Article

Utilizing the Honeybees Mating-Inspired Firefly Algorithm to Extract Parameters of the Wind Speed Weibull Model

by
Abubaker Younis
1,*,
Fatima Belabbes
2,
Petru Adrian Cotfas
1 and
Daniel Tudor Cotfas
1,*
1
Electronics and Computers Department, Transilvania University of Brașov, 500036 Braşov, Romania
2
Department of Electronics, Djillali Liabes University, Sidi Bel Abbes 22000, Algeria
*
Authors to whom correspondence should be addressed.
Forecasting 2024, 6(2), 357-377; https://doi.org/10.3390/forecast6020020
Submission received: 16 April 2024 / Revised: 15 May 2024 / Accepted: 20 May 2024 / Published: 22 May 2024

Abstract

:
This study introduces a novel adjustment to the firefly algorithm (FA) through the integration of rare instances of cannibalism among fireflies, culminating in the development of the honeybee mating-based firefly algorithm (HBMFA). The IEEE Congress on Evolutionary Computation (CEC) 2005 benchmark functions served as a rigorous testing ground to evaluate the efficacy of the new algorithm in diverse optimization scenarios. Moreover, thorough statistical analyses, including two-sample t-tests and fitness function evaluation analysis, the algorithm’s optimization capabilities were robustly validated. Additionally, the coefficient of determination, used as an objective function, was utilized with real-world wind speed data from the SR-25 station in Brazil to assess the algorithm’s applicability in modeling wind speed parameters. Notably, HBMFA achieved superior solution accuracy, with enhancements averaging 0.025% compared to conventional FA, despite a moderate increase in execution time of approximately 18.74%. Furthermore, this dominance persisted when the algorithm’s performance was compared with other common optimization algorithms. However, some limitations exist, including the longer execution time of HBMFA, raising concerns about its practical applicability in scenarios where computational efficiency is critical. Additionally, while the new algorithm demonstrates improvements in fitness values, establishing the statistical significance of these differences compared to FA is not consistently achieved, which warrants further investigation. Nevertheless, the added value of this work lies in advancing the state-of-the-art in optimization algorithms, particularly in enhancing solution accuracy for critical engineering applications.

1. Introduction

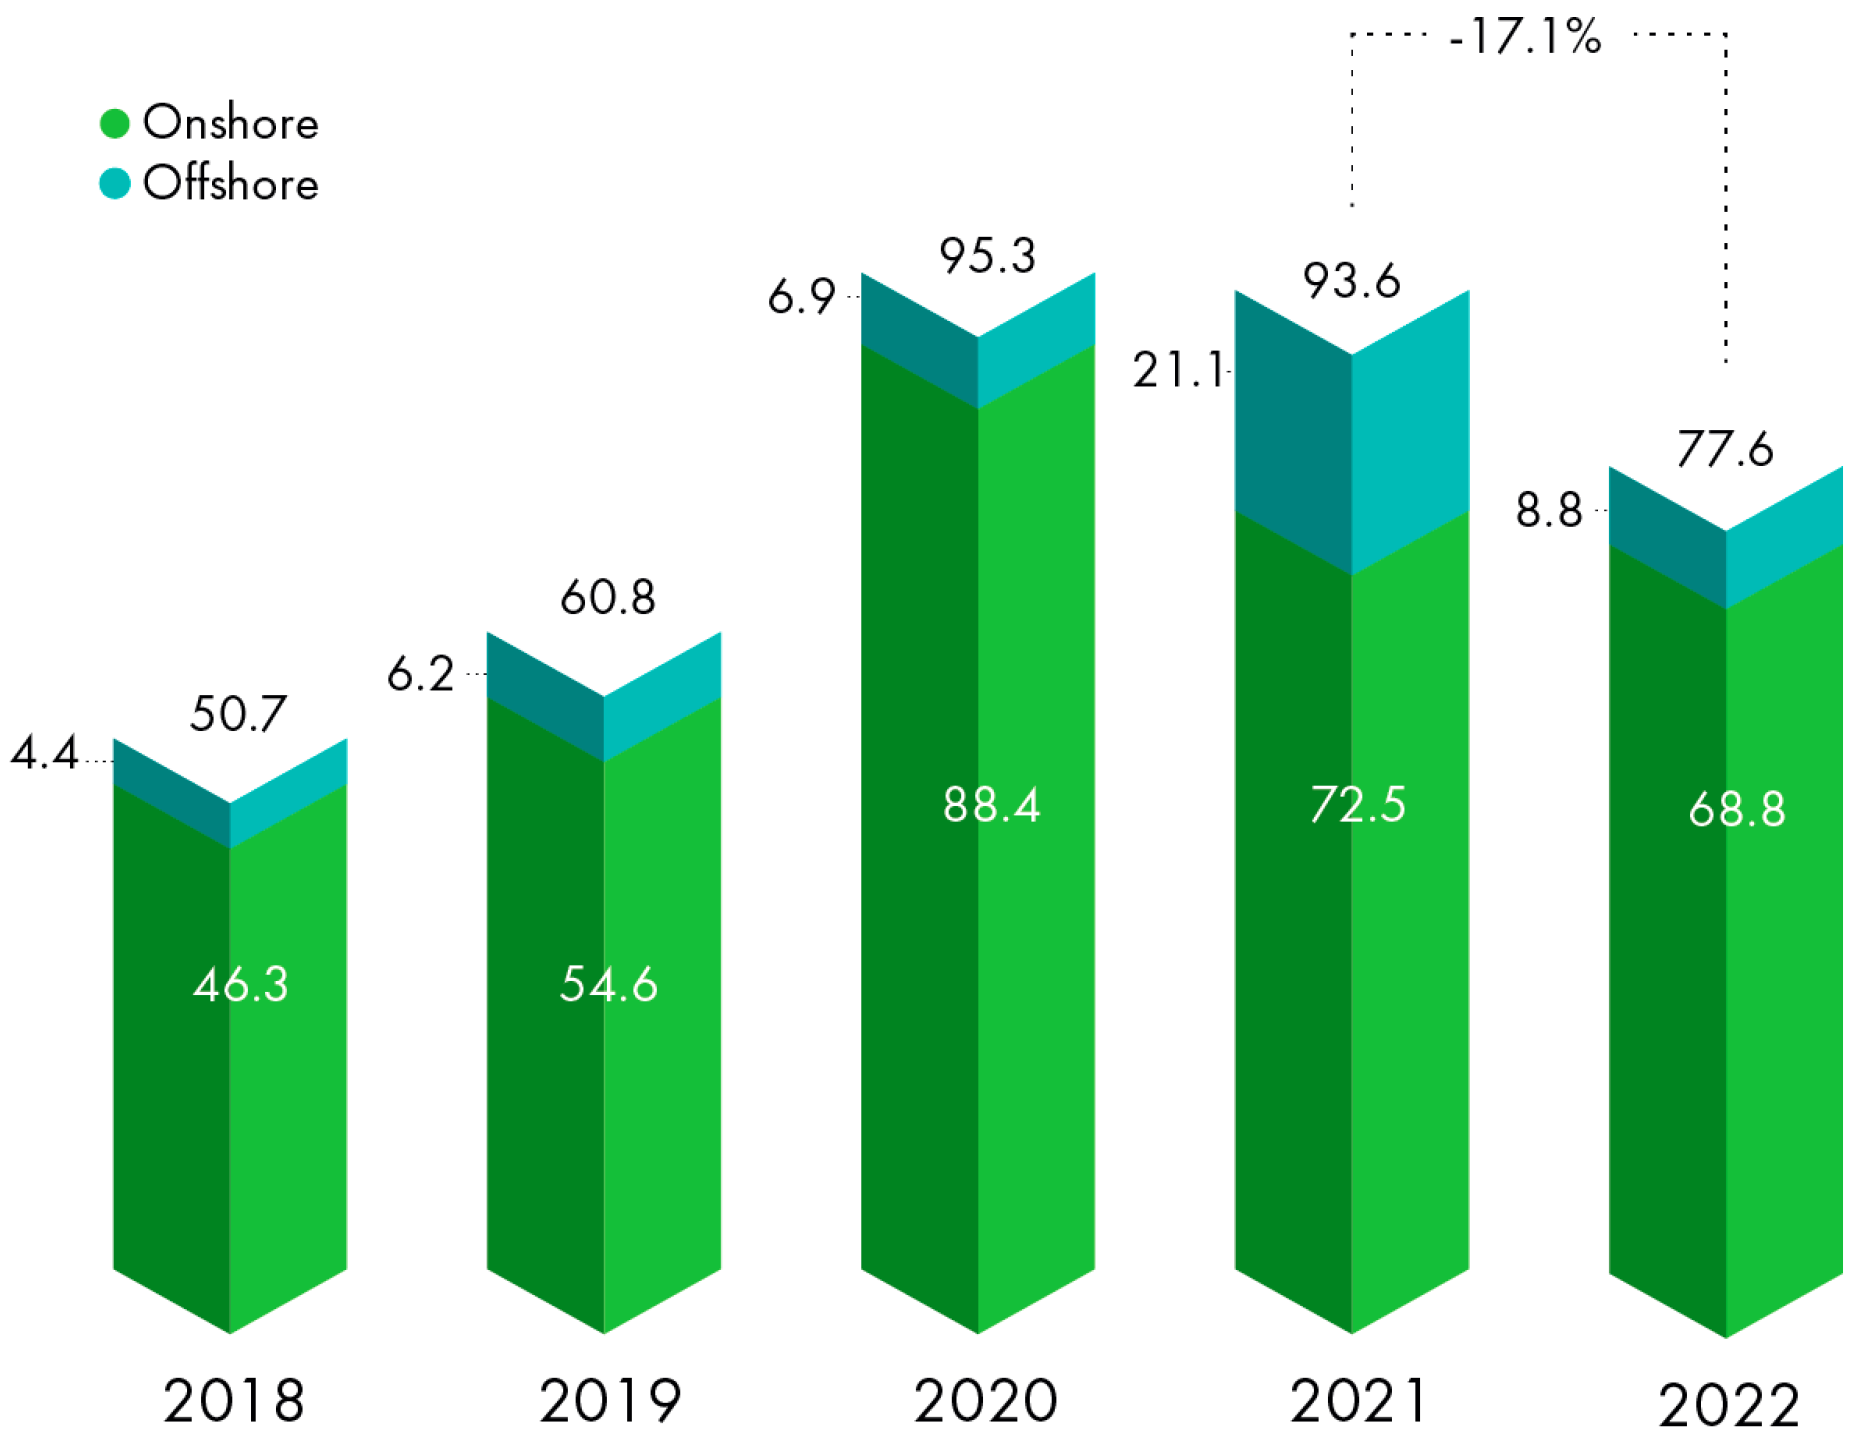
Renewables are a new dawn in energy production, having demonstrated practicality and efficacy. They are projected to surpass coal, the largest global source of electricity generation, by early 2025 [1]. According to the International Energy Agency (IEA), nearly 60% of the newly installed power capacities by 2040 will be clean and renewable energy technologies [2]. The Sun, as the most environmentally friendly power source, converts approximately 1–2% of its intensity reaching Earth into wind energy, accounting for around 10 million megawatts [3]. Perez and Perez estimated that the global wind potential is five times greater than that of a fully electrified global future scenario [4]. Therefore, this tremendous energy reservoir should be harnessed if a sustainable and better world is the overriding target. Wind technologies are green and mature power producers that have shown their effectiveness in producing electricity. They are continuously experiencing increases in their total installed capacity, as demonstrated in Figure 1, provided by the Global Wind Energy Council (GWEC) in their 2023 report [5]. The figure indicates a recent decline in added capacity over the last two years, attributed to delayed project commissioning caused by COVID-19 restrictions; however, experts anticipate a rebound [6]. The GWEC’s report highlights a total global installed wind capacity of 906 GW, with onshore turbines dominating and offshore technology concentrated in Europe and the Asia-Pacific region, representing 99% of global installations [5]. In a related study, Tong et al. explored the reliability of renewable energy technologies in 42 countries, addressing a significant concern associated with clean energy machinery. Their findings indicate that wind systems are the most reliable electricity generators, capable of meeting 72–91% of the countries’ demand in hours [7].
Wind resource assessment is pivotal during the planning phase, particularly for large-scale projects involving multiple megawatts. In other words, evaluating the wind potential at the candidate site is essential, relying on a comprehensive range of models [8]. Parametric statistical distribution models have long been established to represent or characterize wind speed, serving as a milestone in evaluating the resource efficiency of a prospective area [9]. The most widely used models for this purpose in the literature include Exponential, Gamma, Generalized Extreme Value, Inverse Gaussian, Lognormal, Rayleigh, and Weibull distributions [10,11]. Generally, these frequently used parametric models are categorized into unimodal, where only one model is utilized (such as those mentioned above), and multimodal, which involves a combination of the same models, such as the Gamma–Weibull or the Weibull–Weibull models [12,13]. The two-parameter Weibull distribution model, initially introduced by the Swedish physicist Weibull [14], stands out as the most utilized model in the pertinent literature for characterizing wind speed across diverse global locations [15,16,17,18]. This preference is attributed to its straightforward and highly flexible density functions, along with efficiently calculable parameters [19]. However, a notable limitation of this renowned statistical distribution model lies in its inability to effectively forecast or fit low wind speeds below 2 m/s, commonly referred to as null wind speeds. In such instances, the three-parameter Weibull distribution proves to be more effective than the conventional two-parameter model [20]. It is worth noting that Wang and Okaze showed that the two and three-parameter models described the strong winds around tall buildings with the same accuracy [21].
Among the numerous methods employed for estimating the parameters of statistical distribution models, numerical methods, notably the maximum likelihood method (MLM), the least squares method (LSE), and the method of moments (MOM), are commonly used [22,23,24,25,26]. Additionally, artificial intelligence (AI) methods, primarily driven by heuristic algorithms, have demonstrated superiority over other methods in terms of solution accuracy and wind speed characterization [27,28,29,30,31,32]. In this category, the Cuckoo Search (CS) algorithm was the most frequently used [33,34] followed by, in some cases, the genetic algorithm (GA) [35,36,37]. Figure 2 shows the share of each parameter estimation method in 46 studies reviewed by Jung and Schindler [38]. Furthermore, the literature presents various innovative machine learning approaches aimed at achieving similar objectives in wind speed forecasting, such as long short-term memory (LSTM) neural networks fine-tuned using the modified reptile search algorithm [39]. Notably, efforts such as those by Ala et al. [40] have examined and ranked off-the-shelf algorithms based on their ability to generate highly accurate solutions for optimization problems in the field of wind energy. The typical objective functions employed with metaheuristic algorithms to address minimization optimization problems include the root mean square error (RMSE) [41,42,43,44] or the mean square error (MSE) [45,46]. In some instances, researchers relied on maximizing the objective function. For example, Guedes et al. used the coefficient of determination (R2) to identify the relevant distribution model parameters [47], and Shin et al. maximized the log-likelihood function [48].
The firefly algorithm (FA), inspired by the bioluminescent communication between fireflies [49], is considered an essential tool in the swarm intelligence category. It is characterized by its simplicity, flexibility, and proven efficacy against different optimization problems [50]. However, it is also known for issues such as stagnation, often associated with unbalanced exploration and exploitation [51], slow convergence or solution speed [52,53], and high dependence on control parameters [54]. To address these flaws, extensive research has been conducted to either hybridize or improve the classic algorithm, seeking variants with better performance [55,56,57]. Figure 3, adapted from the work of Kumar and Kumar [58], illustrates a general template for all FA variants. Rizk-Allah et al. hybridized ant colony optimization with FA to benefit from the former’s merits in improving exploration by initializing the ants that wander the entire search space [59]. The resulting algorithm demonstrated comparable performance to other algorithms when solving benchmark optimization problems. Fister et al. reviewed chaos map-enhanced FA algorithms, which led to high population diversity and improved exploration [60]. Wang et al. introduced an FA algorithm with adaptive control parameters that produced comparable results to other famous FA variants when tested with benchmark functions [54]. Hassan developed a chaotic sine–cosine FA that overcame the computational complexity of the standard algorithm, tested against benchmark functions, as customary in this research line [53]. Ghasemi et al. introduced an enhanced version of the FA that uses different movements to improve global exploration, adding more strength to the algorithm in facing complex engineering problems [61]. On the exploitation side, Bazi et al. developed a fast version of the FA in which the convergence to the optimal solution was faster than the basic one, while solution accuracy was almost maintained. These results were obtained after testing the algorithm with benchmark functions [62]. Altabeeb et al. introduced a hybrid version of FA that integrates local search and genetic operators to achieve fast convergence and highly accurate solutions. When tested using benchmark datasets, this new hybridization outperformed other innovative FA approaches [63]. Wang et al. incorporated a probability method similar to that in this research, which depends on the fitness value obtained from the classic FA to accelerate convergence. The newly developed FA algorithm was tested against recognized benchmark functions and proved superior performance [64].
Many applications have relied on the FA to identify the parameters of their relevant models, such as the hybrid model of the solar charging station [65], the capacitated vehicle routing problem [63], civil engineering, meteorological optimization, and other relevant engineering applications [58]. It is worth mentioning that the FA algorithm and its variants are not commonly used in wind energy research, with a few exceptions, such as the work conducted by Younis et al. to forecast wind speed based on data from Khartoum, Sudan [66]; and the study by Shan et al., where they developed a hybrid FA variant used to tune the parameters of a variable pitch wind turbine PID controller [52].
Figure 3. Universal structure of the firefly algorithms.
Forecasting 06 00020 g003
The current study utilizes the honeybees mating optimizer (HBMO) annealing function to calculate a conditional value representing the small proportion of firefly insects that engage in cannibalism instead of mating. This intricate simulation of biotic interactions between organisms leads to the development of a more robust algorithm in terms of solution accuracy, termed the honeybees mating-inspired firefly algorithm (HBMFA). This algorithm represents a significant step towards garnering attention for firefly algorithm (FA) variants, especially for those seeking straightforward implementation in future optimizers. The methodology of this work focuses on determining the value of this function and integrating it as a condition in the algorithm structure. The newly introduced statement compares the calculated value with an empirical reference value obtained through extensive experimentation or fine-tuning, representing the segment of flesh-eating fireflies. The efficacy of the HBMFA was evaluated through various experiments, including testing on benchmark functions. Statistical analyses, such as two-sample t-tests and fitness function evaluations, were conducted to validate the optimization capabilities of the algorithm. The study also involved comparing the performance of HBMFA with conventional FA and other optimization algorithms. Additionally, a real-world application using wind speed data from Station SCR-25 in São João do Cariri, Brazil, in 2008 [47], was conducted to assess the algorithm’s effectiveness, fine-tune control parameters, and achieve optimal solution accuracy for wind speed characterization. The significant contribution of this study is bridging the gap in developing optimization algorithms for wind speed forecasting, aiming for improved accuracy, robustness against various factors such as changing weather conditions and terrain features, and computational efficiency for real-time applications. This endeavor involves effectively incorporating algorithmic modifications and establishing benchmark datasets for fair comparisons. Addressing this research void will not only enhance wind speed forecasting accuracy but also contribute to the more efficient utilization of renewable energy sources. Specifically, employing this innovative FA variant to achieve an accurate global best solution maximizing R2 as an objective function exemplifies this effort to narrow the disparity.
Therefore, the remaining sections of this article are organized as follows: Section 2 introduces the new metaheuristic algorithm and the objective function used throughout the study. Section 3 showcases the wind speed model and benchmark data functions, Section 4 presents and discusses the results, and Section 5 concludes.

2. Firefly-Based Algorithms

2.1. Objective Function

The coefficient of determination (R2), represented by Equation (1) [67,68] is used here as an objective function for the maximization problem intended to be solved using the HBMFA. The range of variability for this coefficient is between 0 and 1, with the upper bound representing the optimal value. R2 is highly interpretable and facilitates the comparison between different models and their selection. However, some limitations exist, such as the coefficient’s sensitivity to outliers and its inappropriateness when facing nonlinearity [69]. According to Guedes et al., the maximization of R2 resulted in the best solution in 55.68% of cases, which led the research team to endorse its equation as the objective function for characterizing their wind speed data based on different statistical distribution models [47]. In the current work, the authors also maximize R2 between the observed and predicted CDF values based on the same wind data to enhance the algorithm’s assessment by comparing the obtained results with those presented by earlier researchers, employing proper goodness of fit measures.
R 2 = i = 1 n ( F i F ¯ ) 2 i = 1 n ( F i F ^ i ) 2 i = 1 n ( F i F ¯ ) 2
where F i is the observed CDF, F ^ i is the predicted CDF, F ¯ is the mean value of the observed CDF.

2.2. Standard Firefly Algorithm

The biotic behavior of fireflies is as complicated as that of other species, making it necessary to establish some assumptions for developing an algorithm that mimics the swarm intelligence of these beetles [49,60]:
  • The fireflies are unisex.
  • The attractiveness is proportional to the firefly’s brightness.
  • The fitness value is the indicator of the brightness.
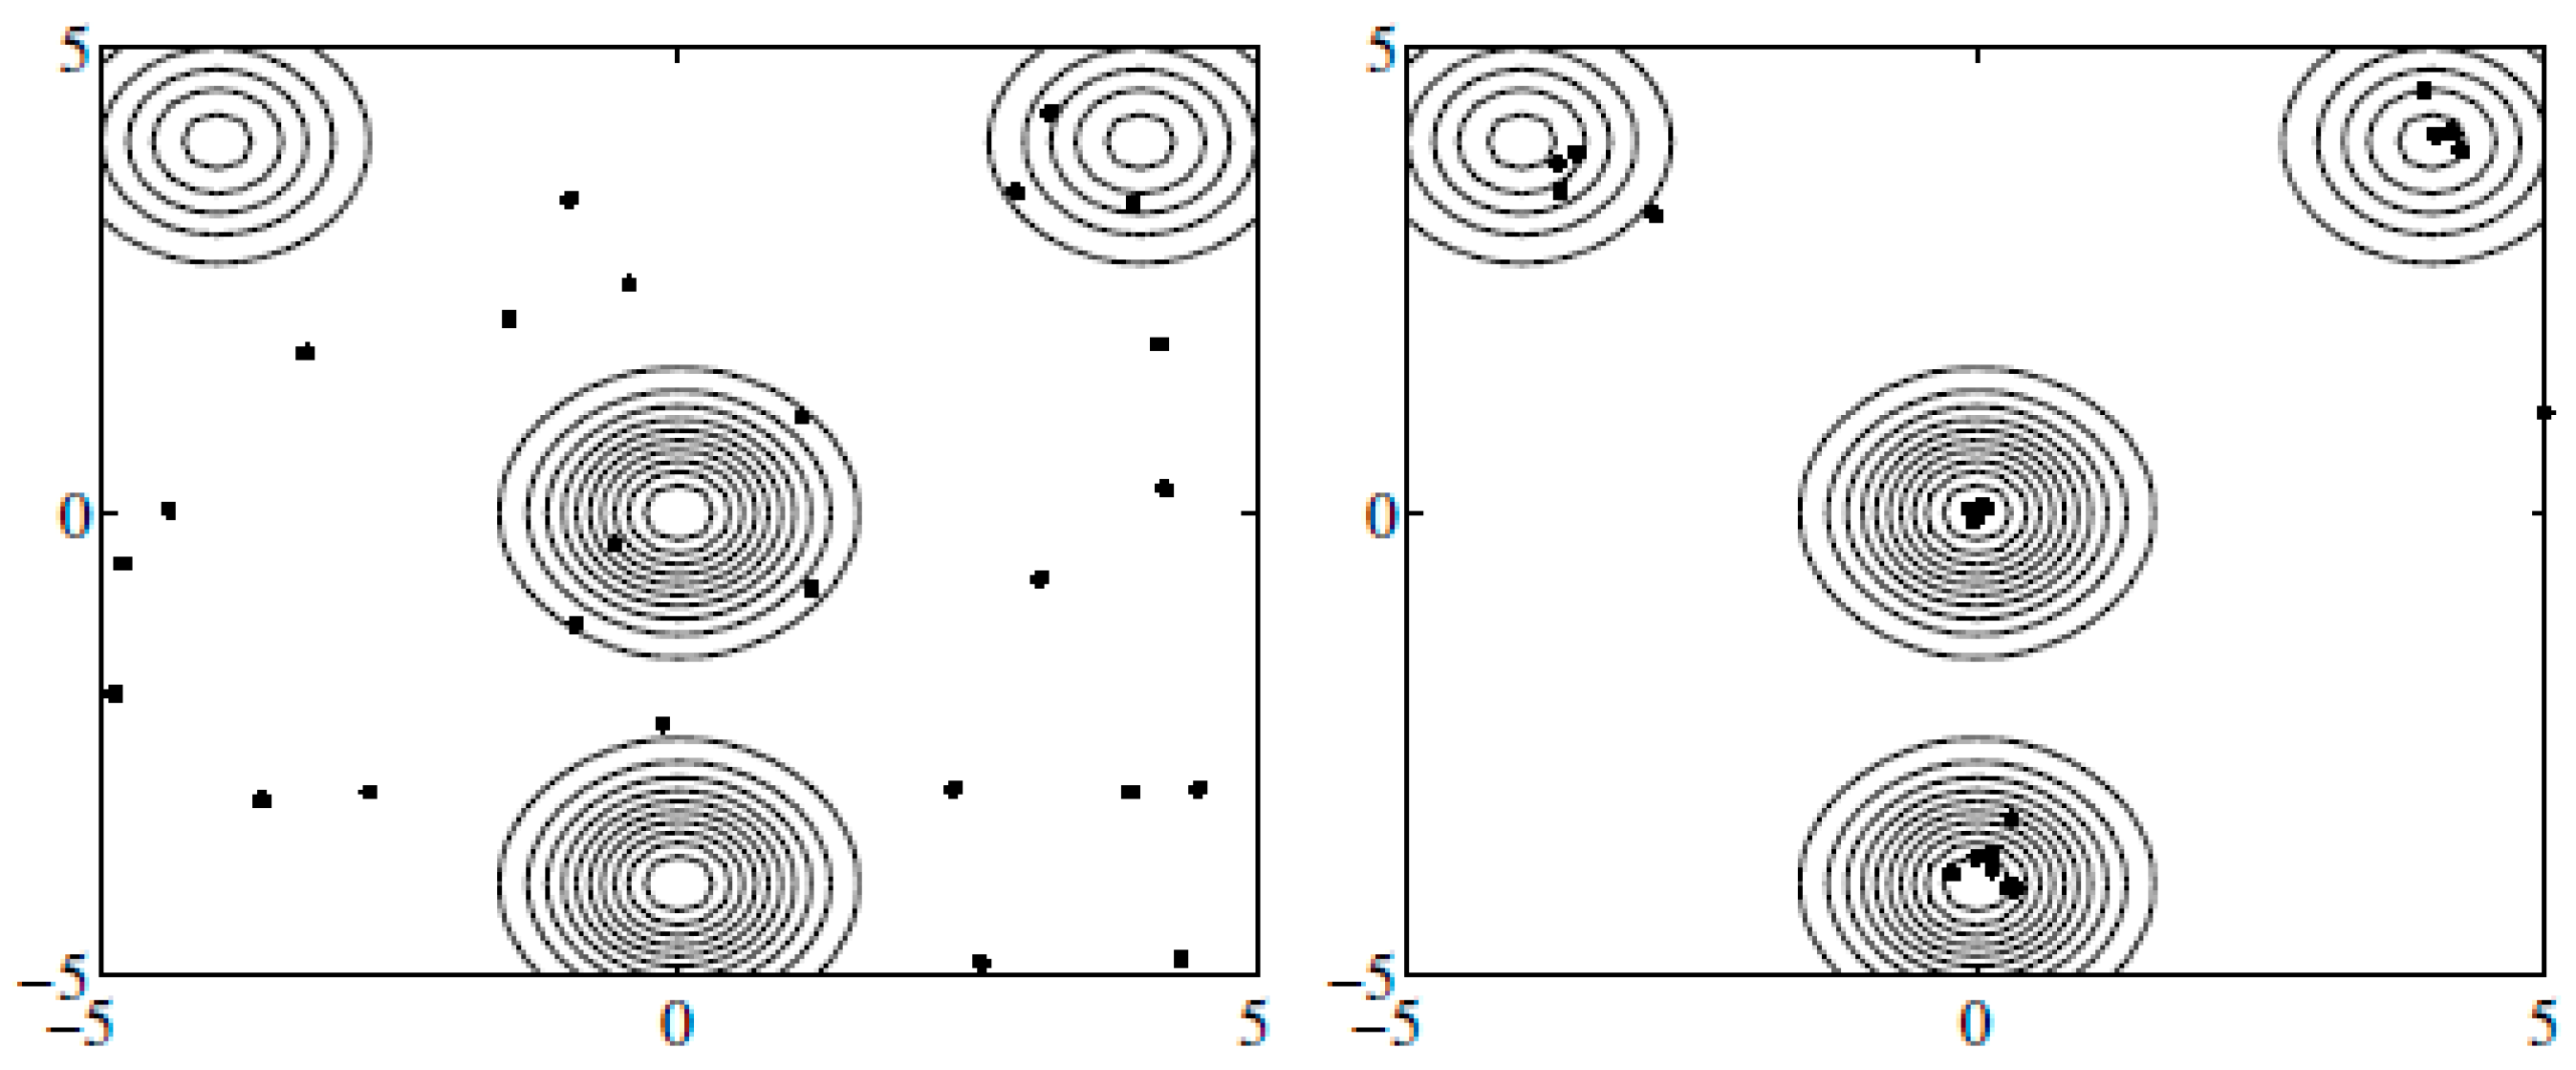
As with other metaheuristic algorithms, the initialization of the first generation or population is accomplished using Equation (2) [66,70], as shown in Figure 4 [70]. This is followed by the FA update function given in Equation (3), which represents the movement of the i firefly towards j firefly, in which the distance between them ( r i j ) is given in Equation (4) [71]. It should be briefly noted here that the primary control parameters in the basic FA, which directly influence the algorithm, include the randomization parameter (α) typically static but with a dynamic version in some FA variants [72]; the light absorption coefficient (γ); and the attractiveness (β), often denoted as β0 when there is no distance between fireflies (i.e., when r = 0 ) [50]. Figure 5 provides the pseudo-code of the classic FA [50,66].
X i = l b + r a n d × ( u b l b )
X i t + 1 = X i t + β o e γ r i j 2 X j t X i t + α t i t × u b l b
r i j = m = 1 D x j , m x i , m 2
where X i is the candidate solution, u b is the upper bound, l b is the lower bound, r a n d is a random number between 0 and 1, ∈ is a random number drawn from the Gaussian distribution, x i , m is the mth component of X i or the design variable.

2.3. Honeybees Mating Inspired Firefly Algorithm (HBMFA)

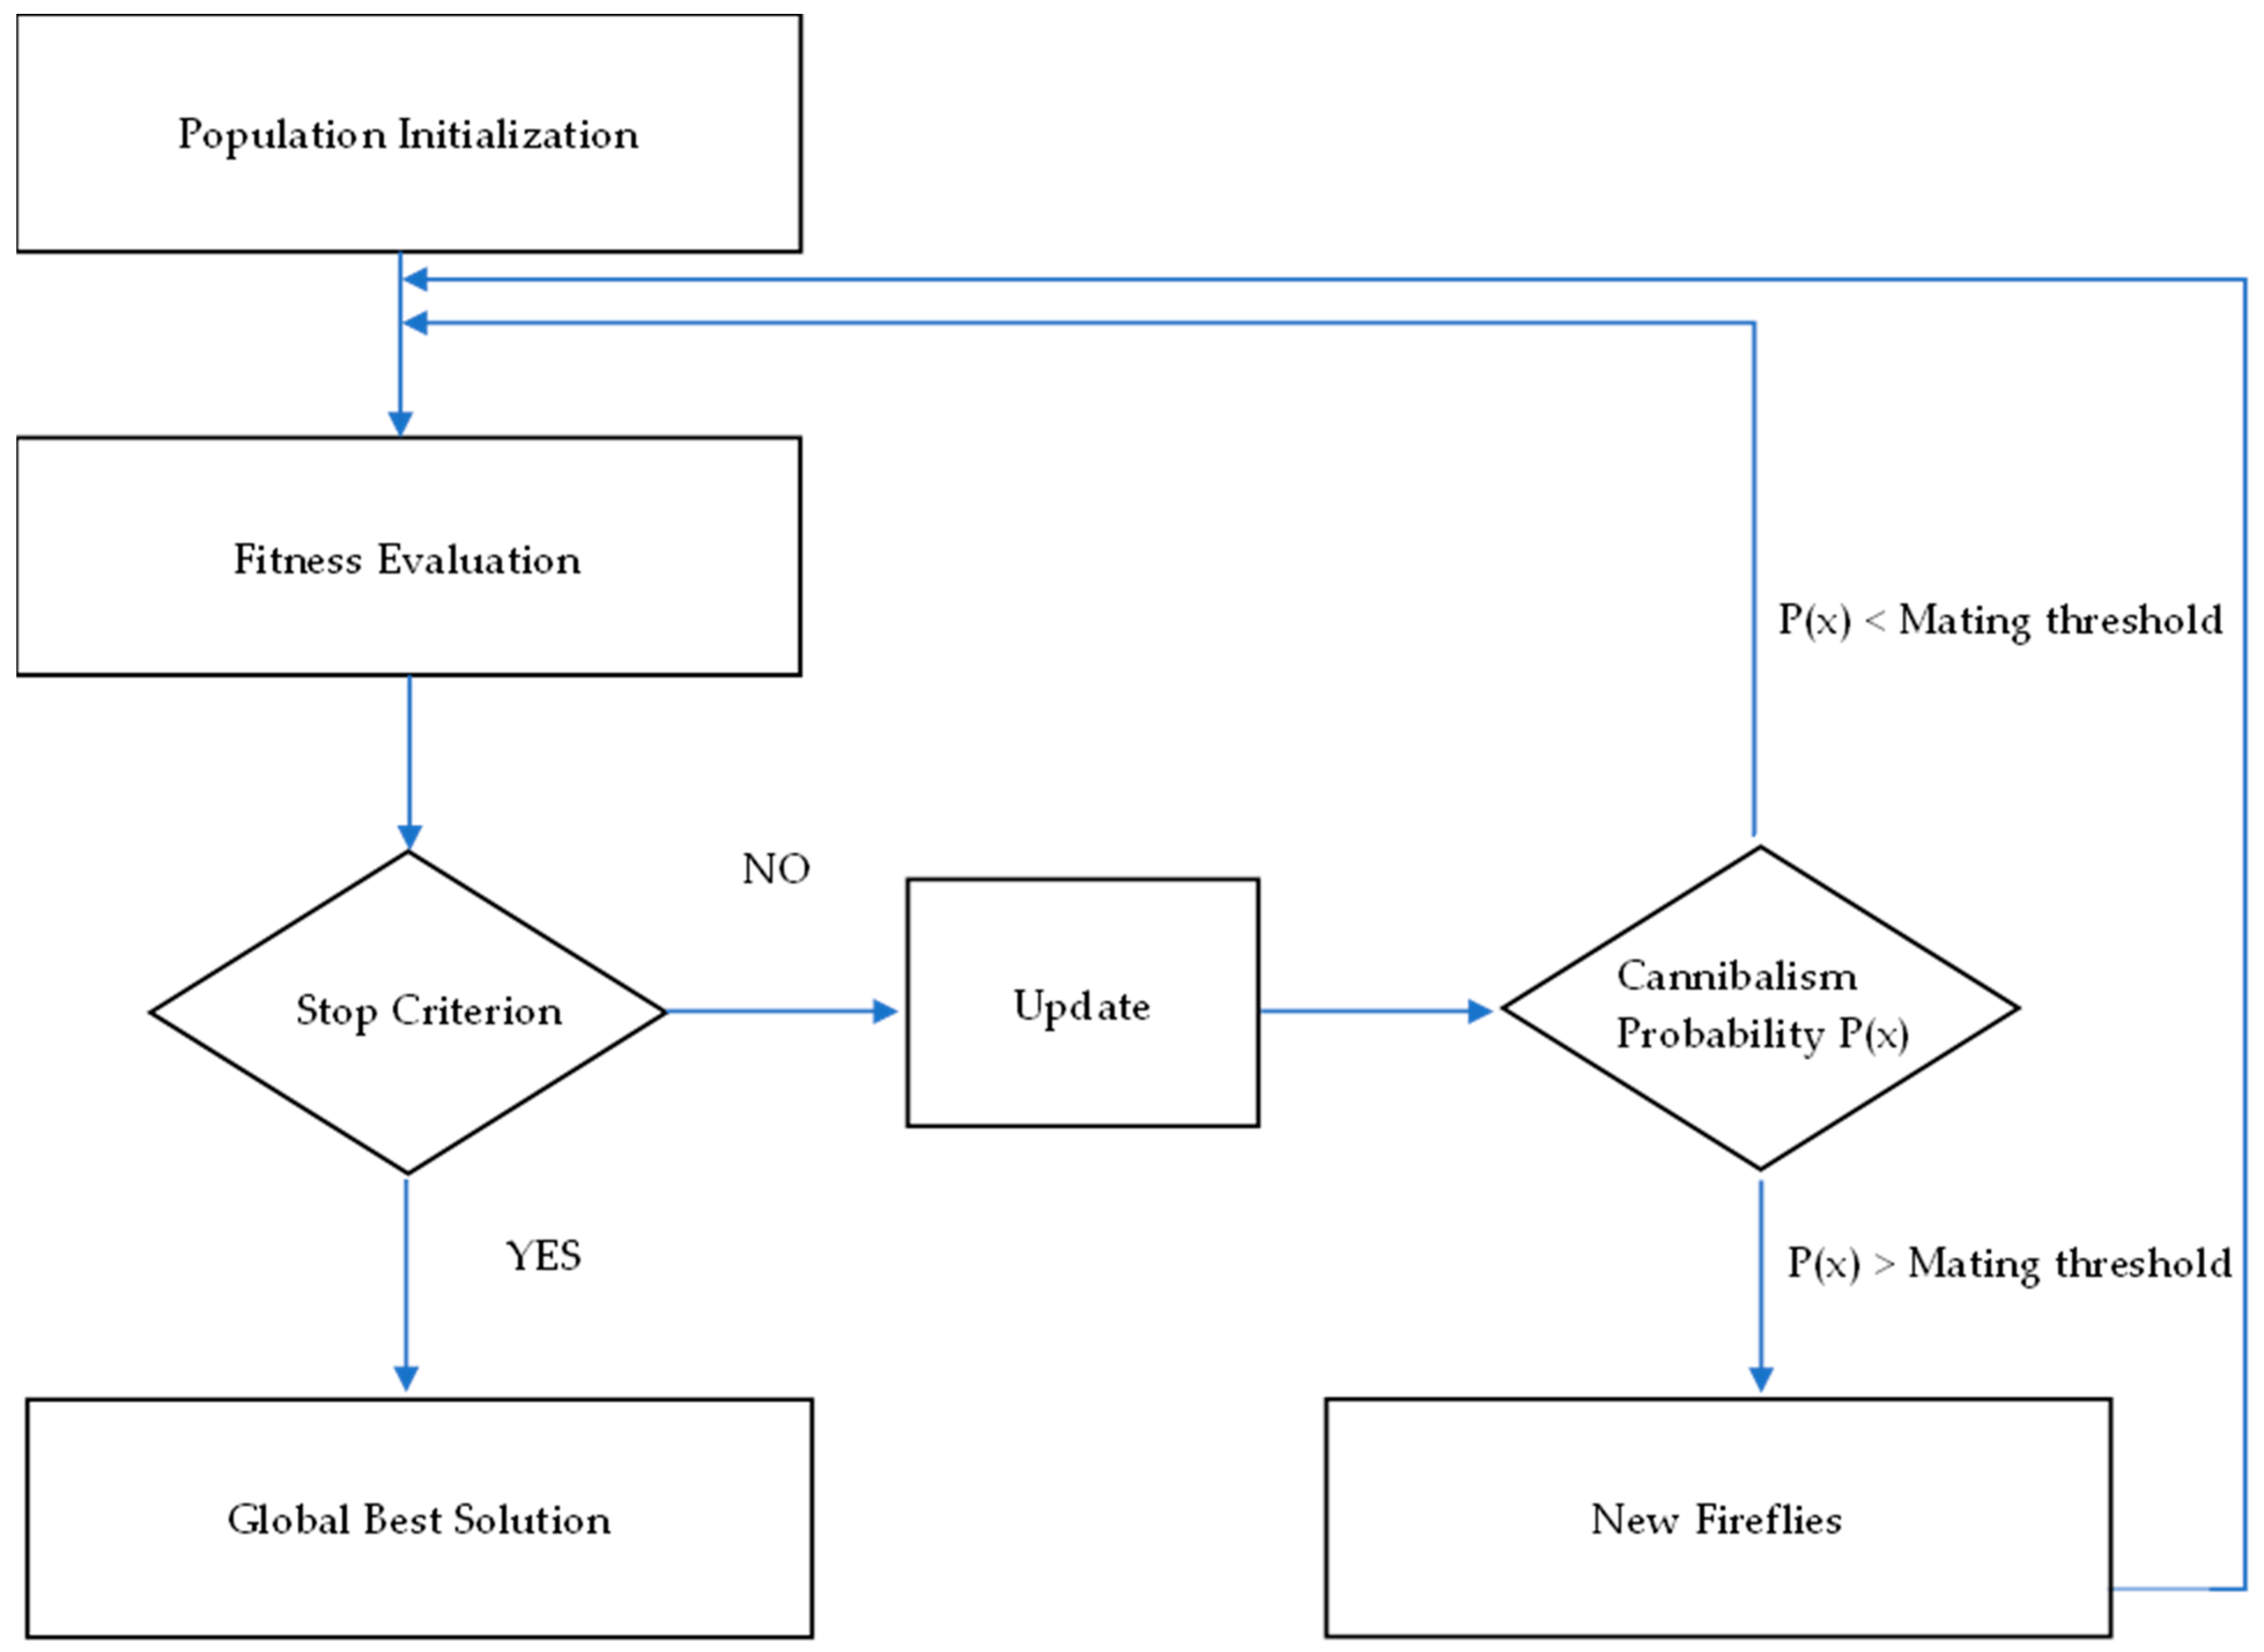
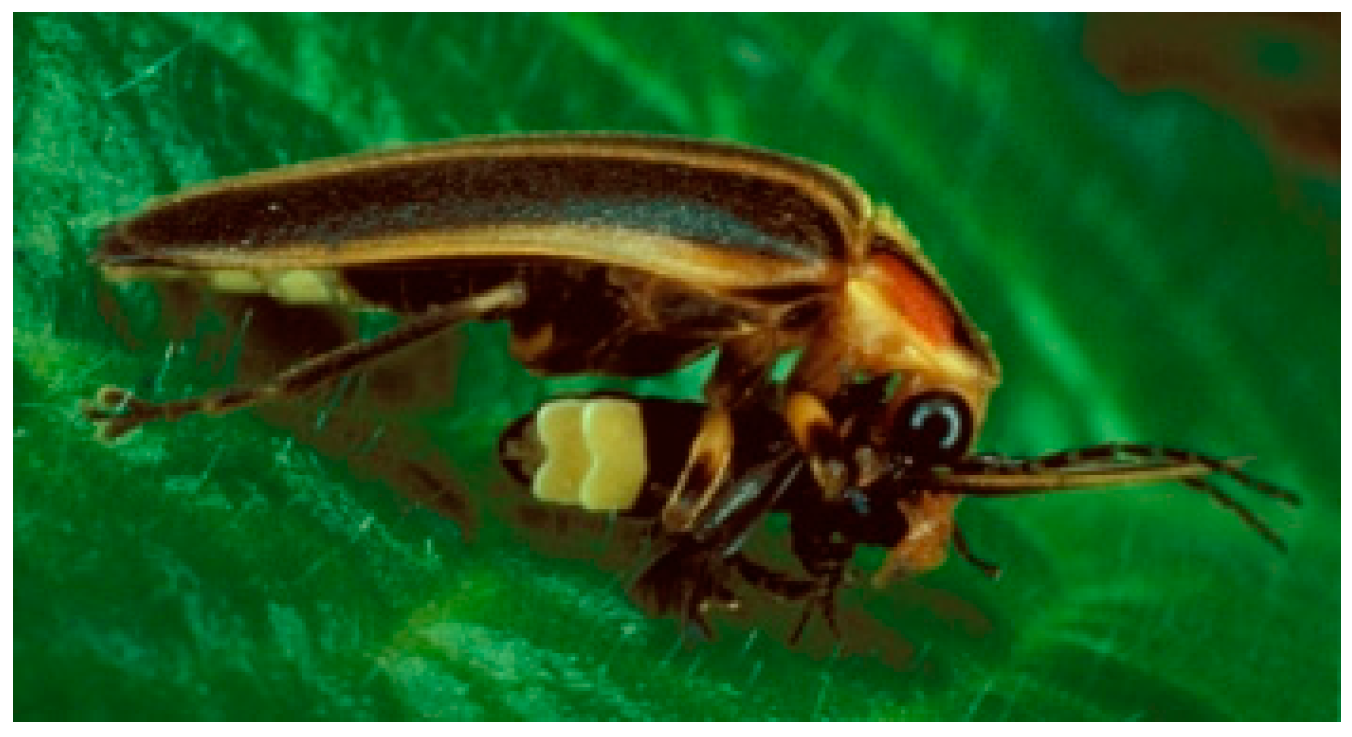
The current work implements an algorithm hybrid from the standard FA with some features of the HBMO for wind speed characterization. The HBMO was first introduced by Haddad et al. to simulate the mating event between the bee queen and a drone, yet another swarm-intelligence algorithm comparable in performance to the genetic algorithm [73]. The probabilistic mating between the queen and any random drone is described by the annealing function in Equation (5) [73,74]. The importance of this equation to this effort is that it represents the marginal percentage of this intraspecies mating event to occur, which is analogous to the rare occasion of a female firefly, also known as femmes fatales fireflies [75], feeding on males from other firefly-species instead of breeding after luring one in using the exact brightness attractiveness mechanism, as shown in the photograph in Figure 6. Accordingly, this algorithm incorporates a fourth biotic interaction, which accounts for rare incidences of cannibalism in addition to the three behaviors listed in the standard FA above. Henceforth, the developed HBMFA adheres to the algorithmic flowchart outlined in Figure 7, which involves the removal of consumed fireflies and the introduction of new ones. Additionally, Figure 8 presents the pseudocode of the innovative algorithm. To clarify, the HBMFA incorporates an additional step following the update of firefly positions, contingent upon the probability derived from the annealing function. Specifically, if this probability surpasses a predetermined mating threshold, the algorithm decides whether to introduce new fireflies to compensate for consumed ones. Alternatively, if the probability falls below this threshold, this step is skipped. The control parameters detailed in Table 1 were fine-tuned to optimize their values for achieving the best solution. The selection of a mating threshold percentage of 99.99% (i.e., annealing function probability > 99.99% in the maximization problem) is justified by the rarity of the cannibalism occurrence. Additionally, the number of fireflies was determined based on available wind speed data points and their corresponding speed classes, as delineated in Table 2.
P r o b a b i l i t y = e ( F ) S ( t )
where F is the absolute fitness difference between the queen and the drone of firefly i and firefly j , S t is the speed of the queen or the pair-eater firefly and is assumed to be a random number between 0 and 1.
Figure 5. An algorithm (Pseudo-code) of the basic FA for the maximization problem [50,66].
Forecasting 06 00020 g005
Table 1. Control parameters for the FA and HBMFA algorithms.
ParameterValue
n 13 fireflies
D2
l b 0
u b 13
α 0 0.1
−0.5 to 0.5
β 0 1
γ 0.01
Threshold percentage99.99%
Figure 6. Female Photuris firefly feeds on a small male Photinus firefly (photo by Professor James E. Lloyd).
Forecasting 06 00020 g006
Figure 7. Flowchart of the HBMFA.
Forecasting 06 00020 g007
Figure 8. An algorithm (Pseudo-code) of the HBMFA for the maximization problem.
Forecasting 06 00020 g008

3. Wind Speed Modeling

3.1. Weibull Distribution

The two-parameter Weibull frequency distribution model, represented by its probability (PDF) and cumulative (CDF) density functions, is the most popular in wind energy research and industry for characterizing and forecasting wind speed [20,76,77]. The PDF ( f ) of this distribution is given by Equation (6), the CDF ( F ) by Equation (7), and the mean ( μ ) and variance ( σ 2 ) are given by Equation (8) and Equation (9), respectively [66,78].
f ( V ) = k c V c k 1 e ( V c ) k
F ( V ) = 1 e ( V c ) k
μ = c Γ ( 1 + 1 k )
σ 2 = c 2 [ Γ 1 + 2 k Γ 2 ( 1 + 1 k ) ]
where V ≥ 0 is the wind speed (m/s), Γ ( ) is the Gamma function, and k ≥ 0 and c ≥ 0 are the shape and scale (m/s) parameters, respectively.
Table 2. SR-25 station wind speed data for 2008 [79].
Wind Speed Class (m/s)Average Wind Speed (m/s)FrequencyFrequency PercentageCumulative Frequency Percentage
0.01–1.000.61311902.25935%2.25935%
1.01–2.001.54831886.05278%8.31213%
2.01–3.002.54952399.94684%18.25897%
3.01–4.003.519749114.22252%32.48149%
4.01–5.004.502820515.57813%48.05962%
5.01–6.005.498795915.11107%63.17069%
6.01–7.006.490683312.97323%76.14391%
7.01–8.007.480553210.50313%86.64705%
8.01–9.008.47337577.13309%93.78014%
9.01–10.009.45421564.09341%97.87355%
10.01–11.0010.4019151.73723%99.61078%
11.01–12.0011.3241850.35124%99.96203%
12.01–13.0012.408200.03797%100%

3.2. Benchmark Data

The SR-25 station dataset was obtained from the online databank of the Brazilian National Environmental Data Organization System (SONDA) [79]. The wind speed data recorded by the 50 m height anemometer was averaged every 10 min for the São João Do Cariri station (SR-25) from that data network for 2008. This specific dataset is the same one used by Guedes et al. [47] in their analysis, enabling a comparative investigation as intended in this paper. The table categorizes the wind speed and provides the average for each category, along with the corresponding frequency, frequency percentage, and cumulative frequency percentage. It is worth noting that the SONDA database was validated according to the quality control protocol adopted by the Baseline Surface Radiation Network (BSRN) [80].

3.3. Benchmark Functions

Given that the HBMFA algorithm is a variant of the FA used in this study for extracting parameters of the two-parameter Weibull distribution model, it was important to choose functions from the IEEE Congress on Evolutionary Computation (CEC) 2005 benchmark suite that closely resemble the characteristics of wind speed data and are suitable for parameter estimation tasks. Specifically, functions that are multimodal, non-linear, and share characteristics similar to real-world data were sought. Based on these considerations, the following functions were deemed suitable for testing the algorithm [81]:
1.
CEC 2005 Function 11 (Shifted Rotated Weierstrass Function):
f ( x ) = i = 1 D [ k = 0 K a k cos ( 2 π b k ( x i o i ) ) k = 0 K a k cos ( π b k ) ]
where x represents the input vector of dimension D, a and b where a ∈ (0,1) and b ∈ (1,10), and K is the number of harmonics and is typically set to 20, o is the shifted global optimum vector.
2.
CEC 2005 Function 12 (Schwefel’s Problem 2.13):
f ( x ) = 418.9829 D i = 1 D ( x i sin ( | x i | ) )
3.
CEC 2005 Function 13 (Expanded Extended Griewank’s plus Rosenbrock’s Function (F8F2):
f ( x ) = i = 1 D [ ( x i 2 4000 ) j = 1 i cos ( x j i ) + 1 ] + i = 1 D 1 [ 100 ( x i 2 x i + 1 100 ) 2 + ( x i 1 ) 2 ]
4.
CEC 2005 Function 14 (Shifted Rotated Expanded Scaffer’s F6):
f ( x ) = 1 D 1 i = 1 D 1 ( g ( z i , z i + 1 ) + g ( z D , z 1 ) ) + f shifted
where z i = x i o i , g ( z i , z i + 1 ) = 0.5 + sin 2 ( z i 2 + z i + 1 2 ) 0.5 [ 1 + 0.001 ( z i 2 + z i + 1 2 ) ] 2 D 1 , and f shifted denotes the shifted global optimum.

4. Results and Discussion

The provided results in Table 3 detail the testing of two optimization algorithms, HBMFA and FA, on the four CEC 2005 benchmark functions (i.e., Function 11 to Function 14). Both algorithms achieved similar best fitness values for each function, indicating comparable performance in optimizing them. However, it is notable that HBMFA consistently demonstrated slightly better performance in terms of best fitness values compared to FA across all tested functions, suggesting its potential for more accurate optimization results. Conversely, FA consistently exhibited faster execution times compared to HBMFA across all tested functions, reflecting its superior computational efficiency.
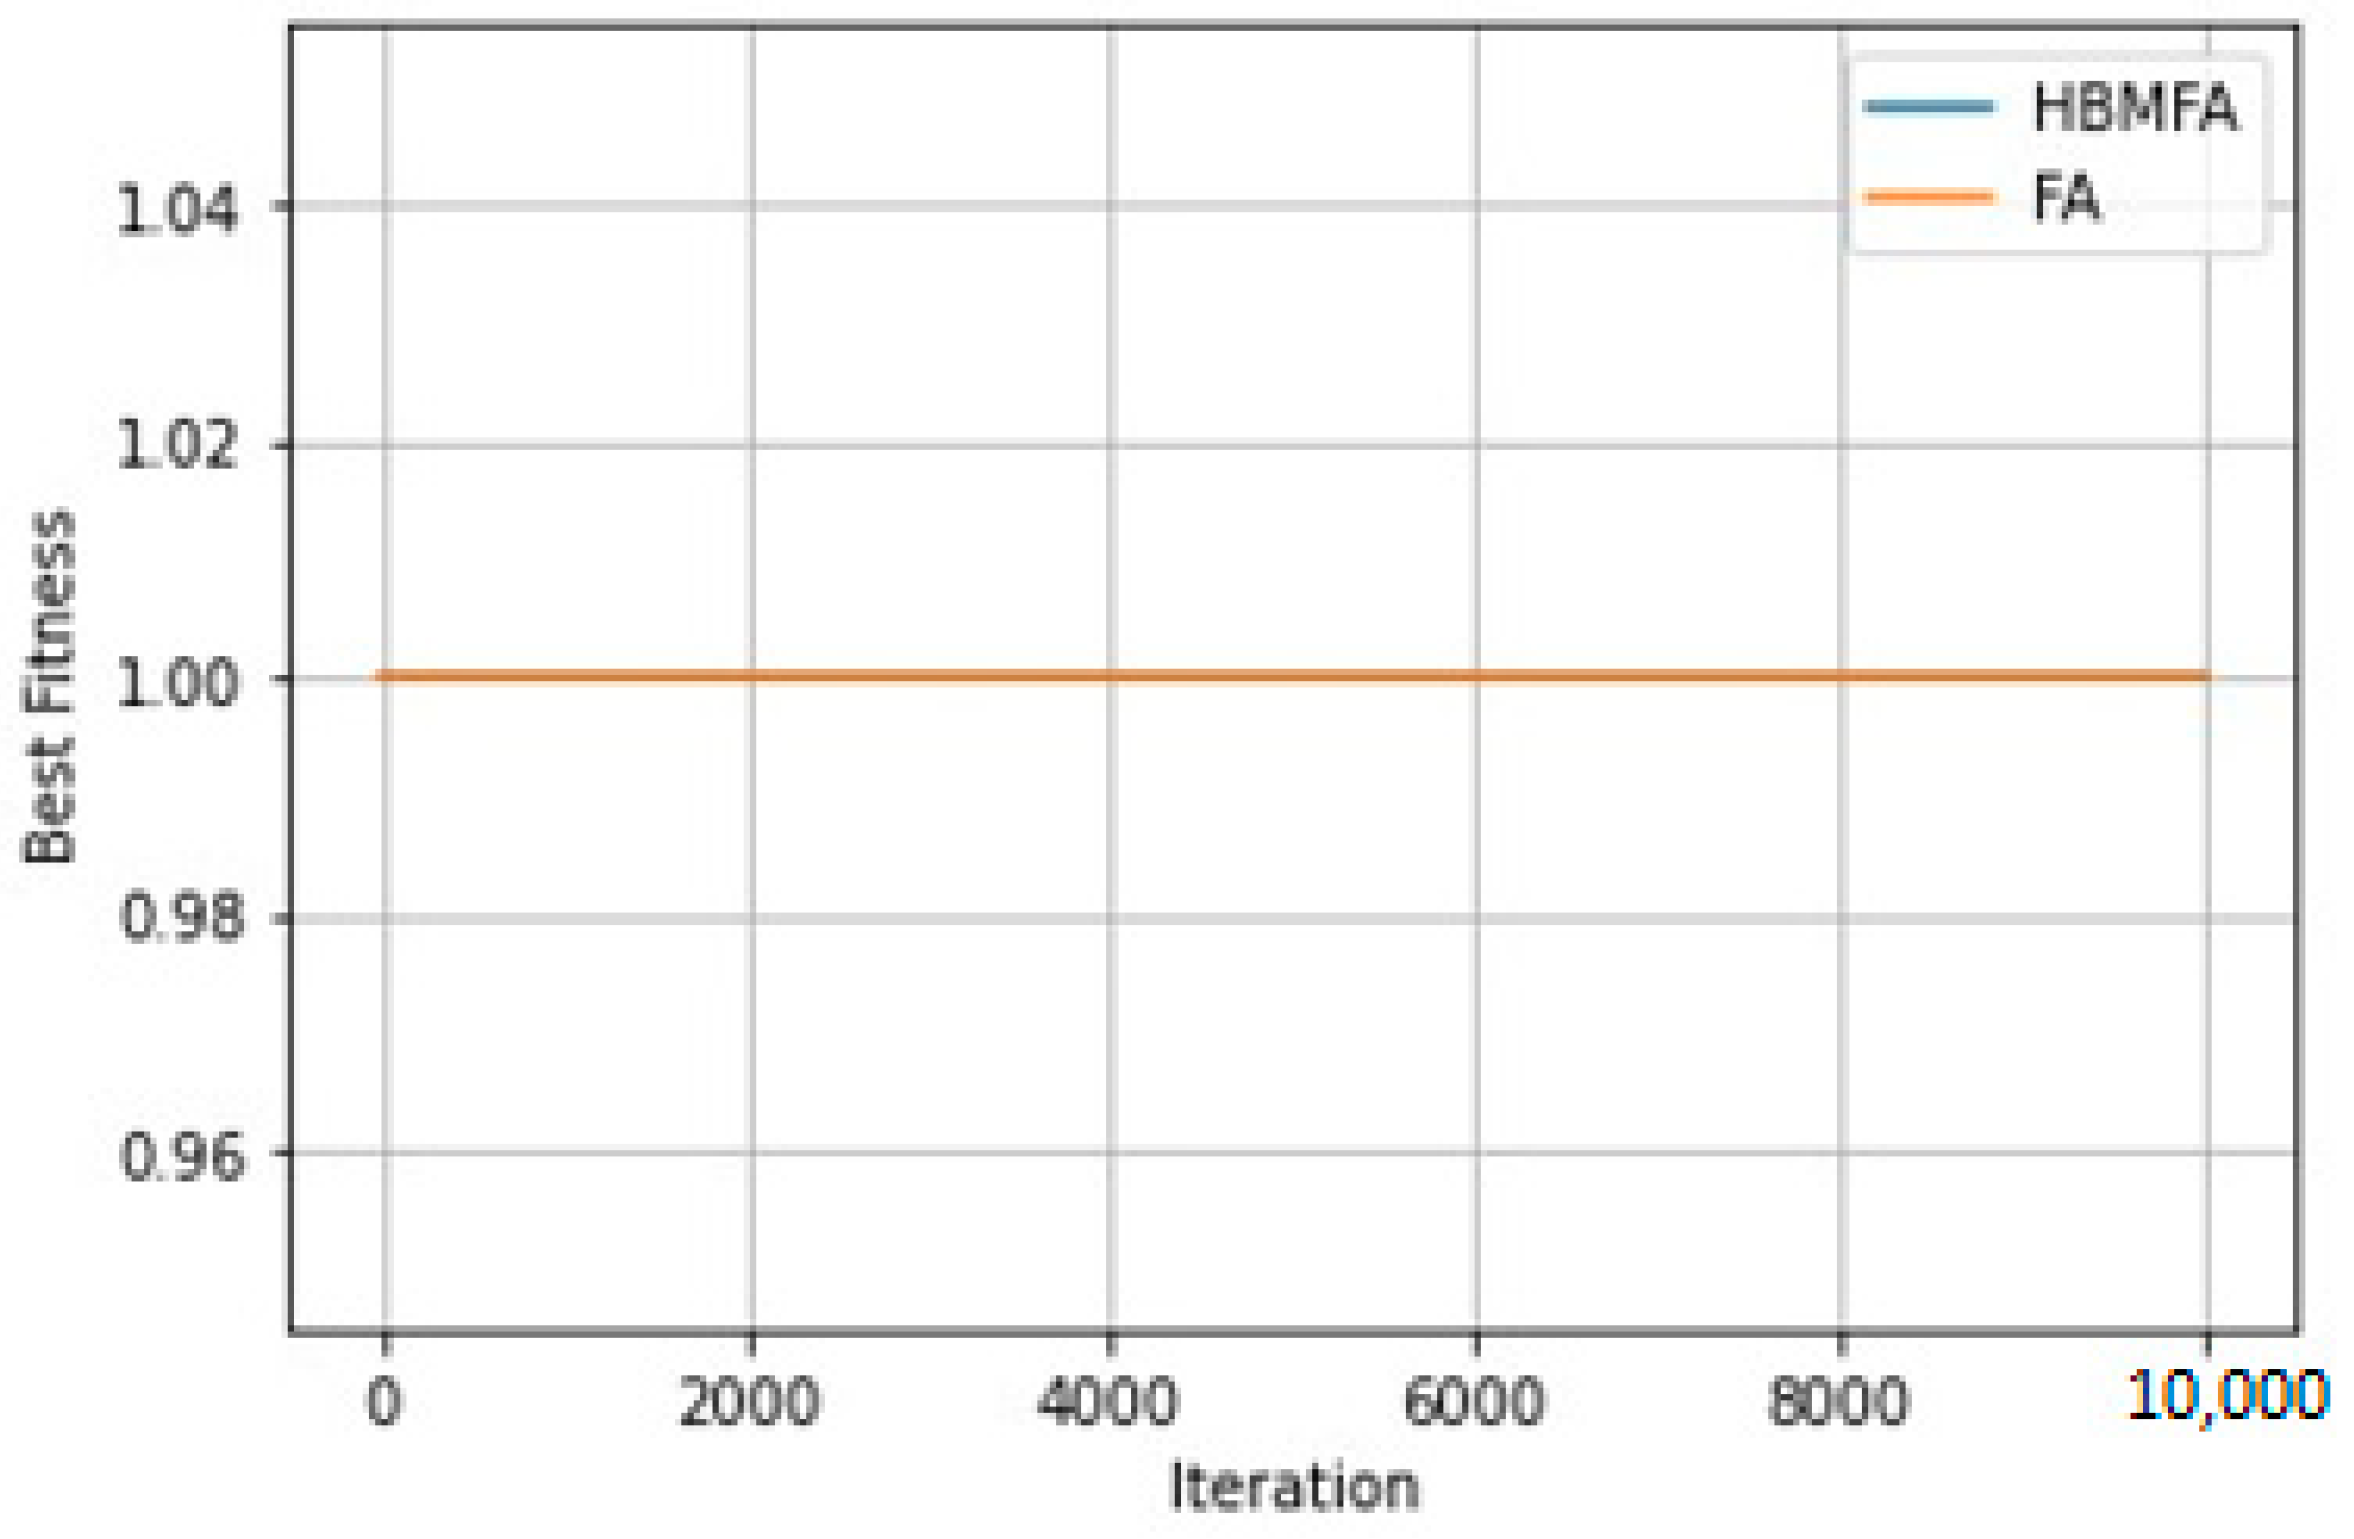
Furthermore, convergence graphs and box plots of the CEC benchmark functions over independent runs were generated to gain deeper insights into the optimization process. Figure 9, Figure 10, Figure 11 and Figure 12 depict convergence charts illustrating the progression of the relevant function’s best fitness value over iterations or function evaluations for both HBMFA and FA algorithms. These figures provide visualized information about their convergence behavior and speed. Additionally, Figure 13 shows box plots summarizing the distribution of the CEC functions’ values obtained from multiple independent runs of the algorithms, allowing for a quantitative assessment of their performance in terms of solution quality and robustness.
To assess the statistical significance of the observed differences, two-sample t-tests were conducted. These tests aimed to determine whether there were significant differences between the algorithms’ best fitness values and execution times. For best fitness values, the t-test results showed t-statistic values within the range of (−1.00000458, −0.00837452), and p-values ranging from (0.35591564, 0.99358968). These results indicated that there was no significant difference between HBMFA and FA in terms of best fitness values, with p-values greater than 0.05 suggesting comparable optimization capabilities. However, for execution times, the t-test results showed a significant difference between HBMFA and FA. The t-statistic value for execution times was within the range of (171.78802293), indicating a notable difference in performance. This was corroborated by very low p-values (close to 0), suggesting that the difference in execution times between the two algorithms was statistically significant.
Additionally, fitness function evaluations (FFE) analysis revealed that both algorithms exhaustively utilized the allowed function evaluations, reaching the maximum of 10,000 for all tested functions. This analysis indicates that both algorithms thoroughly explored the solution space within the given computational constraints.
As the analysis in this study continues to excavate the potentials of the innovative FA variant, the emphasis was put on examining how often the condition of fireflies consuming each other occurs throughout the total number of iterations. Table 4 provides the mean, median, and mode of instances where the algorithm had to replace eaten fireflies or execute the additional step in the HBMFA. It is evident from these statistics that the predation phenomenon is closely linked to the number of fireflies themselves, which is 13 in our case. The slight variation in statistical measures across a wide range of iterations, such as a difference of three in maximum and minimum averages, is logical, as more fireflies inherently lead to more instances of cannibalism, and vice versa.
The values presented in Table 5 depict the computational outcomes of the HBMFA algorithm, aimed at maximizing R2, the objective function in the case of Weibull model parameters extraction based on the earlier mentioned benchmark data. Here, the mating threshold percentage is set to 99.99%, indicating a rare occurrence of cannibalism between firefly pairs. Evidently, the most accurate solution has been consistently achieved since 1000 iterations. When considering both accuracy and execution time, the optimal solution arises at 10,000 iterations, with the time per single iteration being the lowest among the two. This reduction in computational time can be attributed to the algorithm’s memory feature, a common trait in AI, wherein previous iteration results or updated positions are utilized as input for subsequent iterations.
Continuing the investigation into the new algorithm’s performance based on the Brazil benchmark data, it was crucial to compare the results of the HBMFA with those of the standard FA, as presented in Table 6, to ascertain any performance improvements. Table 7 provides percentages comparing both algorithms in terms of increased solution accuracy and total execution time across different numbers of iterations. From this table, it is evident that solution accuracy has indeed improved, with an average increase percentage of 0.025%. However, for the second criterion, execution time, the HBMFA lags behind the FA, as illustrated in Figure 14, with an average increase of 18.74%. For transparency and scientific integrity, it is important to note that the computational study was conducted using a computer equipped with an Intel(R) Core(TM) i9-10850K CPU @ 3.60 GHz processor and 32.0 GB of installed RAM, operating on a 64-bit system.
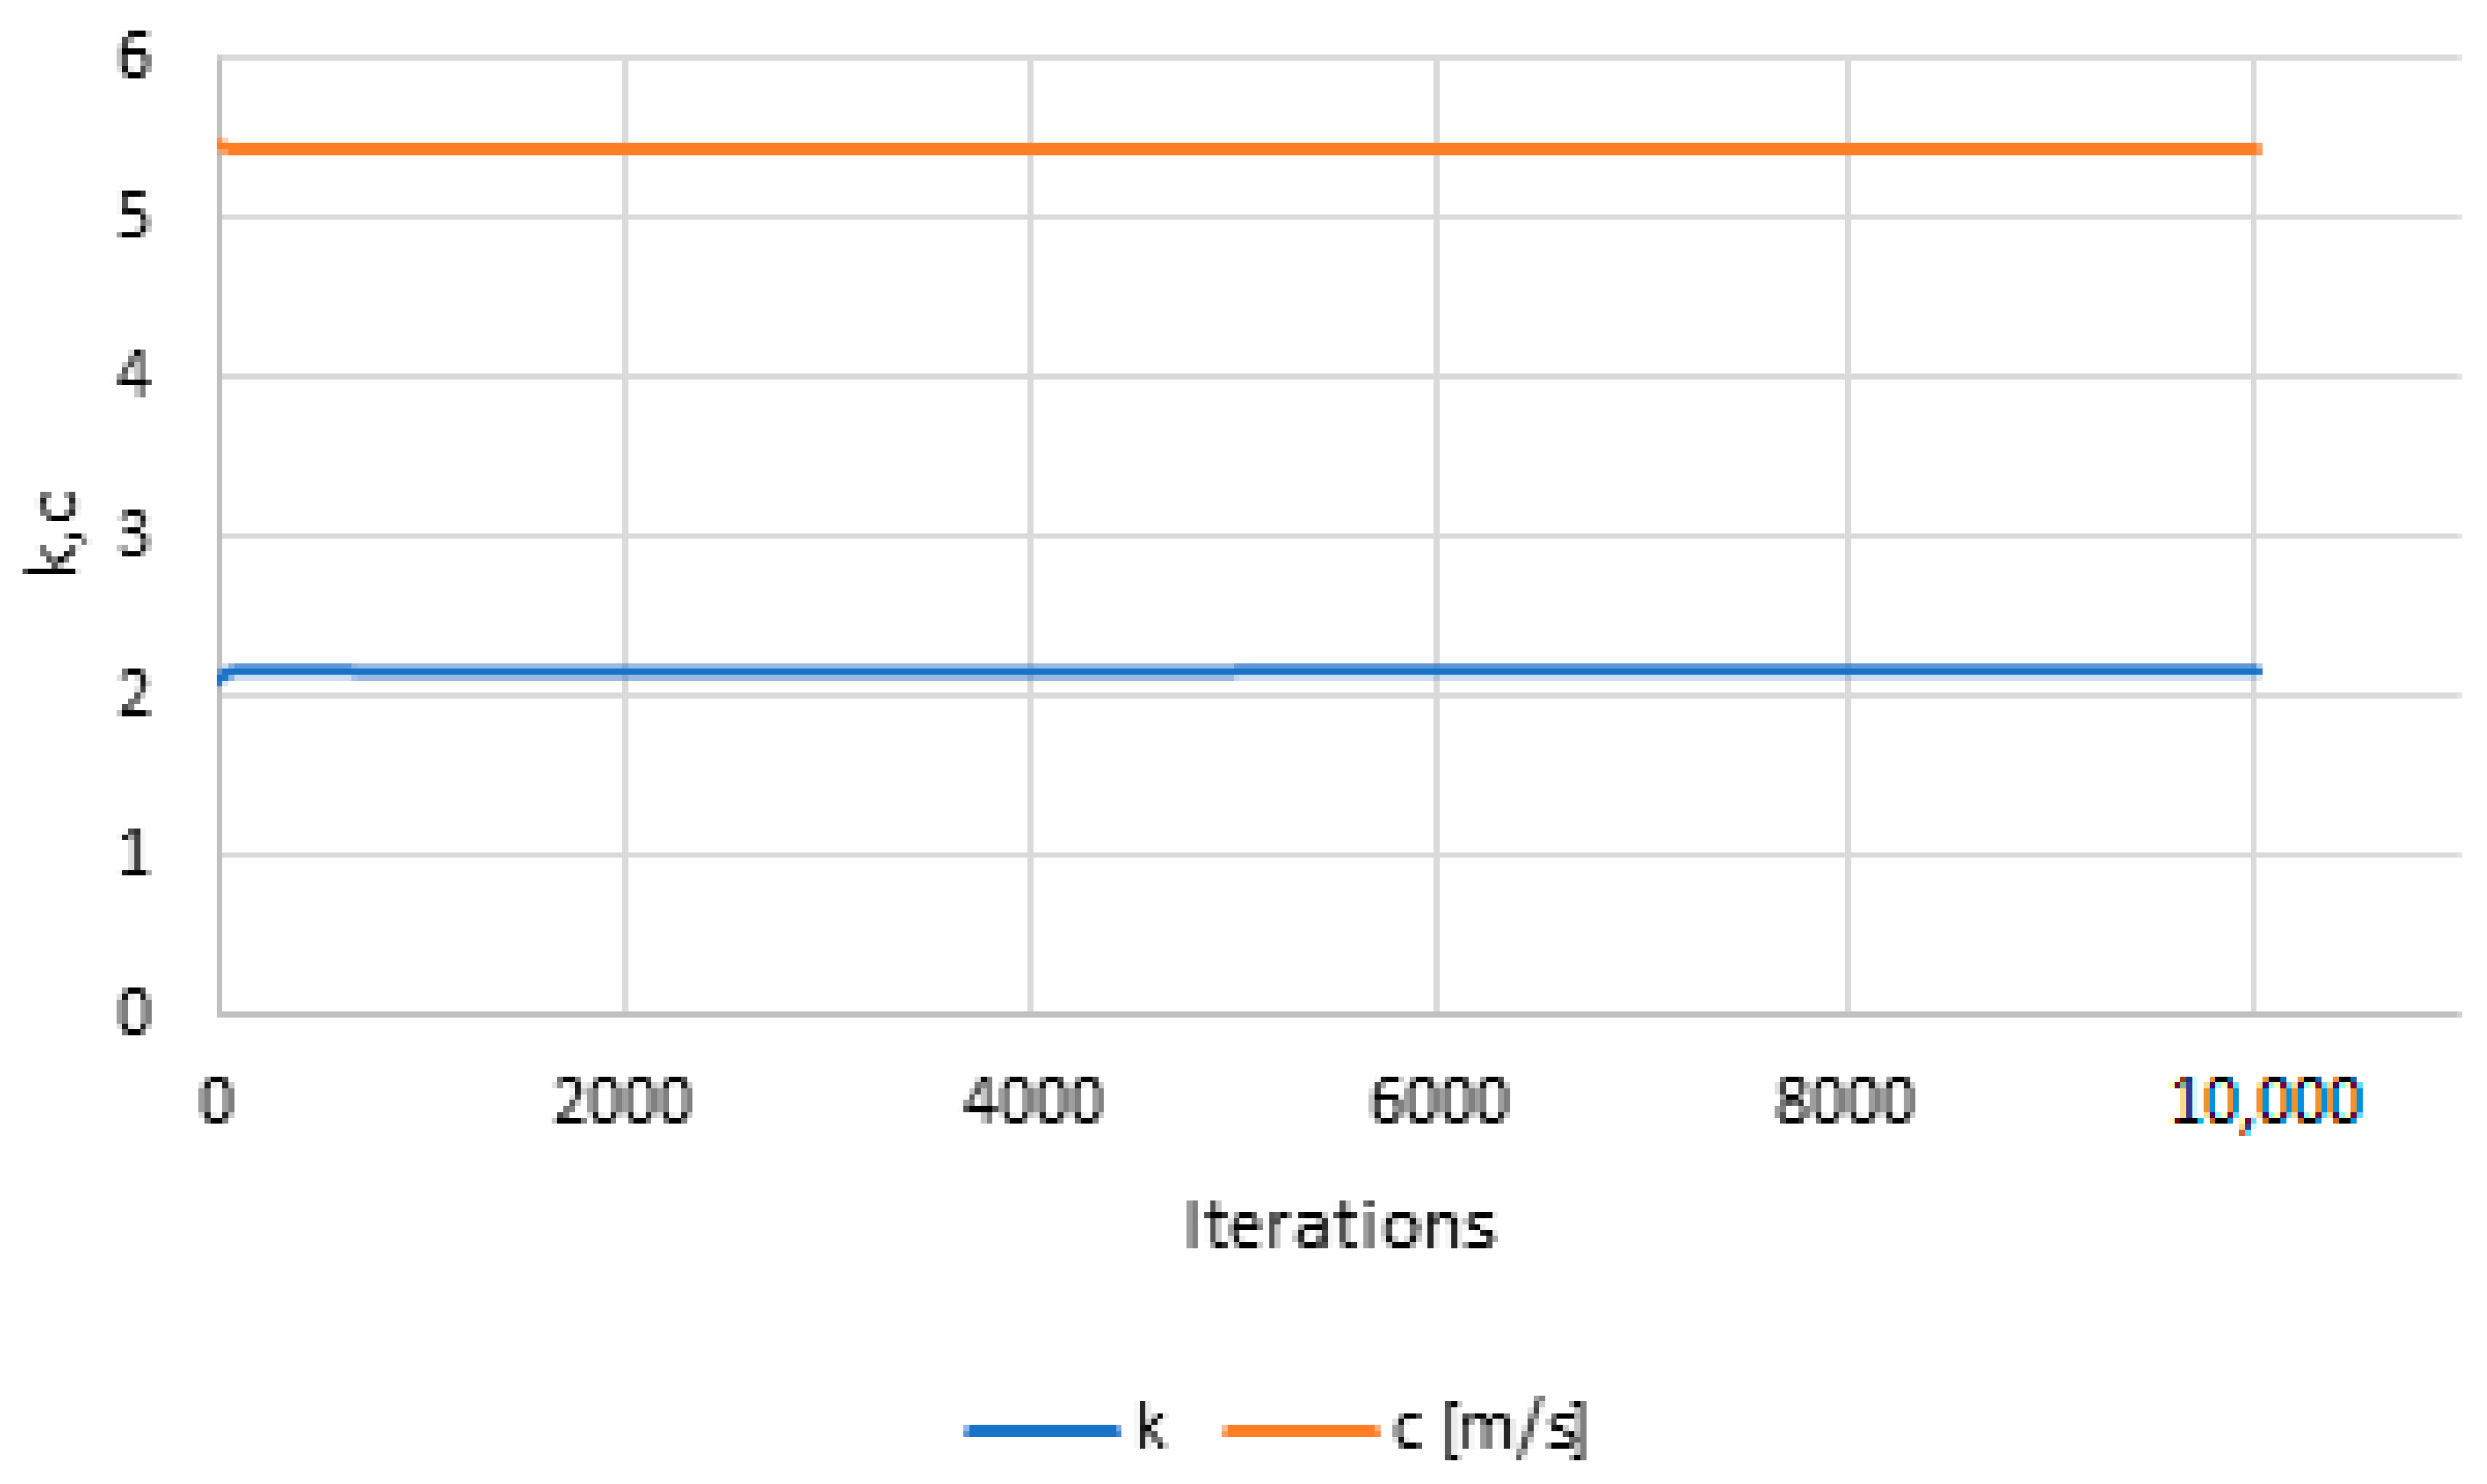
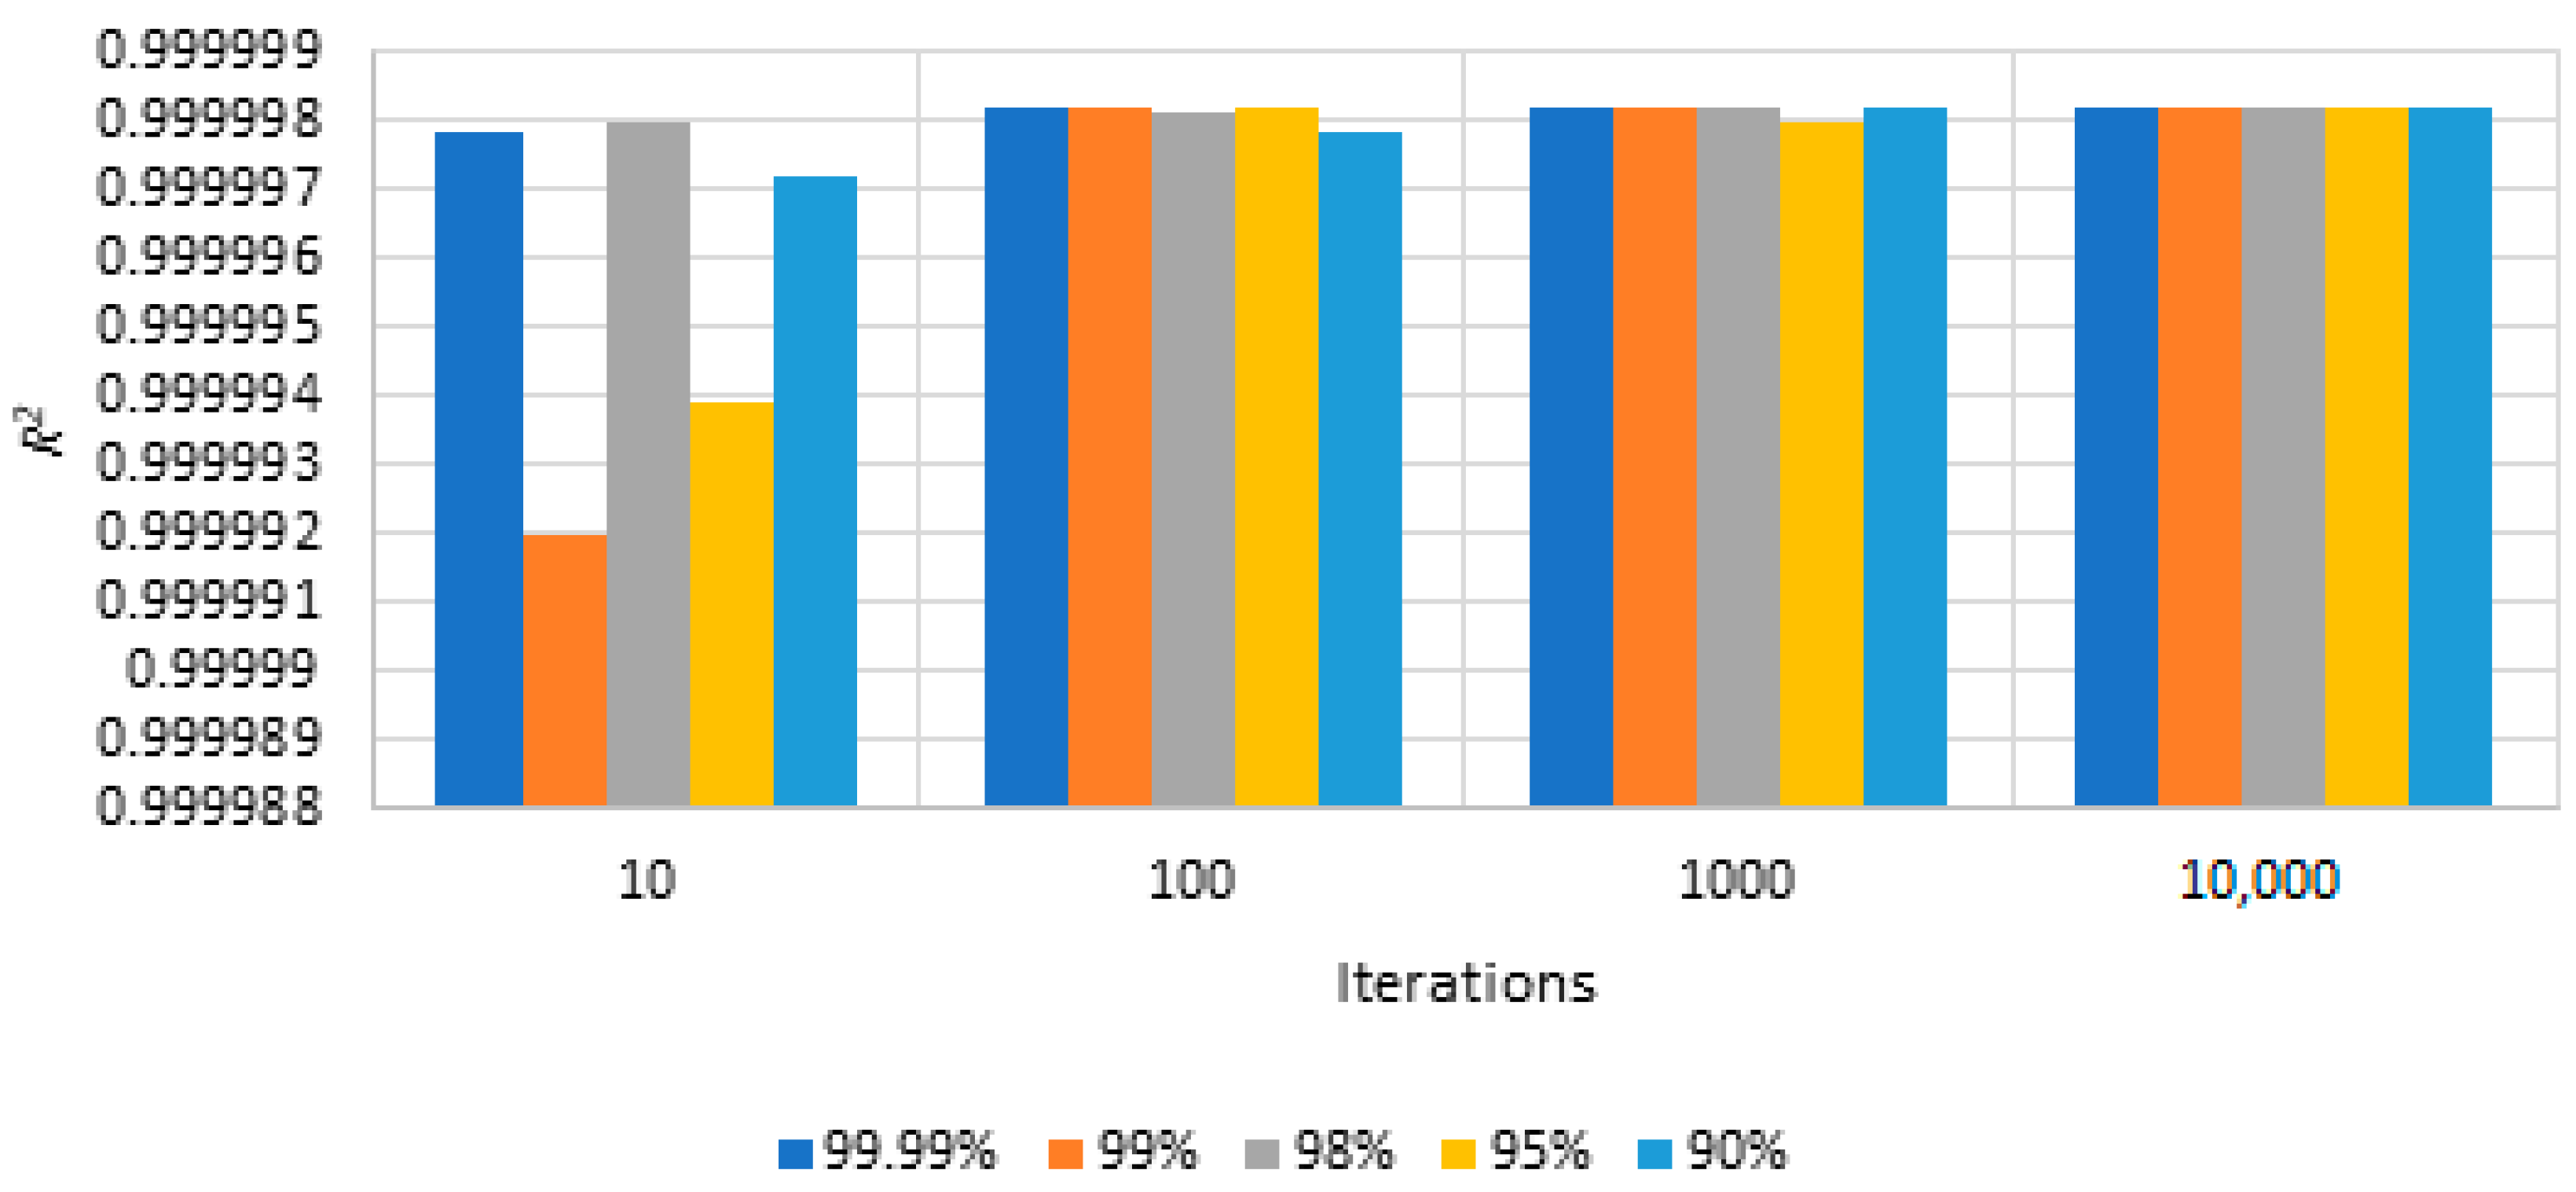
The stability observed in the R2 values with increasing iterations, as evidenced by the results thus far, along with the consistent k and c values depicted in Figure 15, suggests a correlation between the increase in the number of iterations and solution stability or convergence. Furthermore, Figure 16 demonstrates that varying mating thresholds can effectively maximize R2 to the desired value, particularly at high iterations. It is worth noting that, across all cases, the 99.99% threshold consistently yields the highest quality solution. Put simply, the HBMFA is capable of generating similar solutions across a broad spectrum of cannibalism probabilities, especially when the threshold is set at 90% or higher.
Comparative analysis is also crucial for thoroughly assessing the quality and performance of any newly introduced optimization algorithm. In Table 8, a comparison is provided between the computational results of popular metaheuristic optimization algorithms and HBMFA, all applied to the task of extracting the shape and scale parameters of the two-parameter Weibull model using the same benchmark data, with a unified population size of 13 and a number of iterations of 10,000. The algorithms tested include cuckoo search (CS), genetic algorithm (GA), grey wolf optimizer (GWO), and particle swarm optimization (PSO). Notably, HBMFA achieved the highest R2 value of 0.999998196, signifying exceptional performance in maximizing the objective function. However, this advantage is accompanied by a longer execution time of 143.317 s compared to other algorithms such as PSO, which achieved a comparable R2 value with a significantly lower execution time of 0.02336 s. Despite its longer runtime, HBMFA demonstrates promising potential for accurately optimizing the parameters of the Weibull model, offering a trade-off between computational efficiency and optimization effectiveness when compared to existing metaheuristic algorithms.
Finally, in Table 9, the conveyed R2 and 1 − R2 results show that the HBMFA performance exceeds the MBO algorithm in the Guedes et al. [47] paper by a considerable margin concerning the solution accuracy in the case of excluding the null wind speeds, as the earlier researchers did in their work to ensure the best results out of the two-parameter Weibull model. It is worth noting that due to the unavailability of information regarding the computational time in the study of Guedes et al., the comparison between the two algorithms was conducted only based on solution accuracy.

5. Conclusions

The new HBMFA introduced a novel adjustment to the FA algorithm by incorporating rare instances of cannibalism among fireflies, modeled through a probability threshold. Testing the new algorithm on the CEC 2005 benchmark functions confirmed its efficacy and demonstrated superior performance compared to conventional FA and other common optimization algorithms. Additionally, statistical analyses, including two-sample t-tests and FFE analysis, provided robust validation of the algorithm’s optimization capabilities.
Moreover, the introduced adjustment significantly improved solution accuracy compared to both the conventional FA and the MBO in maximizing the R2 based on the two-parameter Weibull distribution model when the analysis was conducted using wind speed data from the SR-25 station in Brazil for 2008, revealing a notable enhancement in solution accuracy, with an average improvement of 0.025% in the R2 values. Despite an increase in execution time, approximately 18.74%, the HBMFA exhibited outstanding results, yielding an optimal solution with parameters of k = 2.1655 and c = 5.4338 m/s, and R2 values of 0.999998196 and 0.999998825 with and without null speeds, respectively. The HBMFA revealed remarkable stability in solution accuracy, with minimal variation, indicating its robustness across diverse scenarios. The algorithm’s efficient exploitation of the search area led to enhanced R2 values compared to both literature and FA results, underscoring its effectiveness. Nevertheless, higher probabilities of predation between fireflies correlated with decreased solution accuracy.
In summary, this work advanced the state-of-the-art in optimization algorithms by introducing the HBMFA. The integration of rare instances of cannibalism among fireflies enhanced the algorithm’s ability to explore and exploit the search space effectively. Thorough statistical analyses and real-world application using wind speed data demonstrated the algorithm’s robustness and applicability in diverse optimization scenarios. Despite some limitations regarding execution time and statistical significance, the HBMFA’s distinguished solution accuracy underscored its potential for critical engineering applications. Further research will focus on addressing these limitations and exploring the algorithm’s applicability across various engineering domains, ensuring its effectiveness and practical utility.

Author Contributions

Conceptualization, A.Y.; methodology, A.Y. and F.B.; software, A.Y. and F.B.; validation, D.T.C. and P.A.C.; formal analysis, A.Y.; investigation, A.Y.; data curation, A.Y. and F.B.; writing—original draft preparation, A.Y.; writing—review and editing, D.T.C.; visualization, A.Y.; supervision, D.T.C. and P.A.C. All authors have read and agreed to the published version of the manuscript.

Funding

This research received no external funding.

Data Availability Statement

Data available on request due to restrictions.

Conflicts of Interest

The authors declare no conflicts of interest.

References

  1. International Energy Agency. Executive Summary—Renewables 2022. Available online: https://www.iea.org/reports/renewables-2022/executive-summary (accessed on 4 October 2023).
  2. Zheng, J.; Du, J.; Wang, B.; Klemeš, J.J.; Liao, Q.; Liang, Y. A Hybrid Framework for Forecasting Power Generation of Multiple Renewable Energy Sources. Renew. Sustain. Energy Rev. 2023, 172, 113046. [Google Scholar] [CrossRef]
  3. Filom, S.; Radfar, S.; Panahi, R.; Amini, E.; Neshat, M. Exploring Wind Energy Potential as a Driver of Sustainable Development in the Southern Coasts of Iran: The Importance of Wind Speed Statistical Distribution Model. Sustainability 2021, 13, 7702. [Google Scholar] [CrossRef]
  4. Perez, M.; Perez, R. Update 2022—A Fundamental Look at Supply Side Energy Reserves for the Planet. Sol. Energy Adv. 2022, 2, 100014. [Google Scholar] [CrossRef]
  5. Global Wind Energy Council. Global Wind Report 2023. Available online: https://gwec.net/globalwindreport2023/ (accessed on 4 October 2023).
  6. International Energy Agency. Wind. Available online: https://www.iea.org/energy-system/renewables/wind (accessed on 31 October 2023).
  7. Tong, D.; Farnham, D.J.; Duan, L.; Zhang, Q.; Lewis, N.S.; Caldeira, K.; Davis, S.J. Geophysical Constraints on the Reliability of Solar and Wind Power Worldwide. Nat. Commun. 2021, 12, 6146. [Google Scholar] [CrossRef] [PubMed]
  8. Guarienti, J.A.; Kaufmann Almeida, A.; Menegati Neto, A.; de Oliveira Ferreira, A.R.; Ottonelli, J.P.; Kaufmann de Almeida, I. Performance Analysis of Numerical Methods for Determining Weibull Distribution Parameters Applied to Wind Speed in Mato Grosso Do Sul, Brazil. Sustain. Energy Technol. Assess. 2020, 42, 100854. [Google Scholar] [CrossRef]
  9. Ouarda, T.B.M.J.; Charron, C.; Shin, J.Y.; Marpu, P.R.; Al-Mandoos, A.H.; Al-Tamimi, M.H.; Ghedira, H.; Al Hosary, T.N. Probability Distributions of Wind Speed in the UAE. Energy Convers. Manag. 2015, 93, 414–434. [Google Scholar] [CrossRef]
  10. Zhou, J.; Erdem, E.; Li, G.; Shi, J. Comprehensive Evaluation of Wind Speed Distribution Models: A Case Study for North Dakota Sites. Energy Convers. Manag. 2010, 51, 1449–1458. [Google Scholar] [CrossRef]
  11. Alavi, O.; Mohammadi, K.; Mostafaeipour, A. Evaluating the Suitability of Wind Speed Probability Distribution Models: A Case of Study of East and Southeast Parts of Iran. Energy Convers. Manag. 2016, 119, 101–108. [Google Scholar] [CrossRef]
  12. Akdaǧ, S.A.; Bagiorgas, H.S.; Mihalakakou, G. Use of Two-Component Weibull Mixtures in the Analysis of Wind Speed in the Eastern Mediterranean. Appl. Energy 2010, 87, 2566–2573. [Google Scholar] [CrossRef]
  13. Wang, Z.; Liu, W. Wind Energy Potential Assessment Based on Wind Speed, Its Direction and Power Data. Sci. Rep. 2021, 11, 16879. [Google Scholar] [CrossRef]
  14. Shi, H.; Dong, Z.; Xiao, N.; Huang, Q. Wind Speed Distributions Used in Wind Energy Assessment: A Review. Front. Energy Res. 2021, 9, 769920. [Google Scholar] [CrossRef]
  15. Mahmood, F.H.; Resen, A.K.; Khamees, A.B. Wind Characteristic Analysis Based on Weibull Distribution of Al-Salman Site, Iraq. Energy Rep. 2020, 6, 79–87. [Google Scholar] [CrossRef]
  16. Wan, J.; Zheng, F.; Luan, H.; Tian, Y.; Li, L.; Ma, Z.; Xu, Z.; Li, Y. Assessment of Wind Energy Resources in the Urat Area Using Optimized Weibull Distribution. Sustain. Energy Technol. Assess. 2021, 47, 101351. [Google Scholar] [CrossRef]
  17. Khalid Saeed, M.; Salam, A.; Rehman, A.U.; Abid Saeed, M. Comparison of Six Different Methods of Weibull Distribution for Wind Power Assessment: A Case Study for a Site in the Northern Region of Pakistan. Sustain. Energy Technol. Assess. 2019, 36, 100541. [Google Scholar] [CrossRef]
  18. Azad, K.; Rasul, M.; Halder, P.; Sutariya, J. Assessment of Wind Energy Prospect by Weibull Distribution for Prospective Wind Sites in Australia. Energy Procedia 2019, 160, 348–355. [Google Scholar] [CrossRef]
  19. Jia, J.; Yan, Z.; Peng, X.; An, X. A New Distribution for Modeling the Wind Speed Data in Inner Mongolia of China. Renew. Energy 2020, 162, 1979–1991. [Google Scholar] [CrossRef]
  20. Wais, P. A Review of Weibull Functions in Wind Sector. Renew. Sustain. Energy Rev. 2017, 70, 1099–1107. [Google Scholar] [CrossRef]
  21. Wang, W.; Okaze, T. Statistical Analysis of Low-Occurrence Strong Wind Speeds at the Pedestrian Level around a Simplified Building Based on the Weibull Distribution. Build. Environ. 2022, 209, 108644. [Google Scholar] [CrossRef]
  22. Chang, T.P. Performance Comparison of Six Numerical Methods in Estimating Weibull Parameters for Wind Energy Application. Appl. Energy 2011, 88, 272–282. [Google Scholar] [CrossRef]
  23. Costa Rocha, P.A.; de Sousa, R.C.; de Andrade, C.F.; da Silva, M.E.V. Comparison of Seven Numerical Methods for Determining Weibull Parameters for Wind Energy Generation in the Northeast Region of Brazil. Appl. Energy 2012, 89, 395–400. [Google Scholar] [CrossRef]
  24. Arslan, T.; Bulut, Y.M.; Altin Yavuz, A. Comparative Study of Numerical Methods for Determining Weibull Parameters for Wind Energy Potential. Renew. Sustain. Energy Rev. 2014, 40, 820–825. [Google Scholar] [CrossRef]
  25. Alsamamra, H.R.; Salah, S.; Shoqeir, J.A.H.; Manasra, A.J. A Comparative Study of Five Numerical Methods for the Estimation of Weibull Parameters for Wind Energy Evaluation at Eastern Jerusalem, Palestine. Energy Rep. 2022, 8, 4801–4810. [Google Scholar] [CrossRef]
  26. Tiam Kapen, P.; Jeutho Gouajio, M.; Yemélé, D. Analysis and Efficient Comparison of Ten Numerical Methods in Estimating Weibull Parameters for Wind Energy Potential: Application to the City of Bafoussam, Cameroon. Renew. Energy 2020, 159, 1188–1198. [Google Scholar] [CrossRef]
  27. Wang, J.; Hu, J.; Ma, K. Wind Speed Probability Distribution Estimation and Wind Energy Assessment. Renew. Sustain. Energy Rev. 2016, 60, 881–899. [Google Scholar] [CrossRef]
  28. Hemanth Kumar, M.B.; Balasubramaniyan, S.; Padmanaban, S.; Holm-Nielsen, J.B. Wind Energy Potential Assessment by Weibull Parameter Estimation Using Multiverse Optimization Method: A Case Study of Tirumala Region in India. Energies 2019, 12, 2158. [Google Scholar] [CrossRef]
  29. Chang, T.P. Wind Energy Assessment Incorporating Particle Swarm Optimization Method. Energy Convers. Manag. 2011, 52, 1630–1637. [Google Scholar] [CrossRef]
  30. Niu, T.; Wang, J.; Zhang, K.; Du, P. Multi-Step-Ahead Wind Speed Forecasting Based on Optimal Feature Selection and a Modified Bat Algorithm with the Cognition Strategy. Renew. Energy 2018, 118, 213–229. [Google Scholar] [CrossRef]
  31. Makhloufi, S.; Mekhaldi, A.; Teguar, M. Three Powerful Nature-Inspired Algorithms to Optimize Power Flow in Algeria’s Adrar Power System. Energy 2016, 116, 1117–1130. [Google Scholar] [CrossRef]
  32. Khamees, A.K.; Abdelaziz, A.Y.; Eskaros, M.R.; Alhelou, H.H.; Attia, M.A. Stochastic Modeling for Wind Energy and Multi-Objective Optimal Power Flow by Novel Meta-Heuristic Method. IEEE Access 2021, 9, 158353–158366. [Google Scholar] [CrossRef]
  33. Freitas de Andrade, C.; Ferreira dos Santos, L.; Silveira Macedo, M.V.; Costa Rocha, P.A.; Ferreira Gomes, F. Four Heuristic Optimization Algorithms Applied to Wind Energy: Determination of Weibull Curve Parameters for Three Brazilian Sites. Int. J. Energy Environ. Eng. 2019, 10, 1–12. [Google Scholar] [CrossRef]
  34. Jiang, H.; Wang, J.; Wu, J.; Geng, W. Comparison of Numerical Methods and Metaheuristic Optimization Algorithms for Estimating Parameters for Wind Energy Potential Assessment in Low Wind Regions. Renew. Sustain. Energy Rev. 2017, 69, 1199–1217. [Google Scholar] [CrossRef]
  35. Wadi, M.; Elmasry, W. Statistical Analysis of Wind Energy Potential Using Different Estimation Methods for Weibull Parameters: A Case Study. Electr. Eng. 2021, 103, 2573–2594. [Google Scholar] [CrossRef]
  36. Kılıç, M.B.; Şahin, Y.; Koca, M.B. Genetic Algorithm Approach with an Adaptive Search Space Based on EM Algorithm in Two-Component Mixture Weibull Parameter Estimation. Comput. Stat. 2021, 36, 1219–1242. [Google Scholar] [CrossRef]
  37. Patidar, H.; Shende, V.; Baredar, P.; Soni, A. Comparative Evaluation of Optimal Weibull Parameters for Wind Power Predictions Using Numerical and Metaheuristic Optimization Methods for Different Indian Terrains. Environ. Sci. Pollut. Res. 2023, 30, 30874–30891. [Google Scholar] [CrossRef] [PubMed]
  38. Jung, C.; Schindler, D. Wind Speed Distribution Selection—A Review of Recent Development and Progress. Renew. Sustain. Energy Rev. 2019, 114, 109290. [Google Scholar] [CrossRef]
  39. Pavlov-Kagadejev, M.; Jovanovic, L.; Bacanin, N.; Deveci, M.; Zivkovic, M.; Tuba, M.; Strumberger, I.; Pedrycz, W. Optimizing Long-Short-Term Memory Models via Metaheuristics for Decomposition Aided Wind Energy Generation Forecasting. Artif. Intell. Rev. 2024, 57, 45. [Google Scholar] [CrossRef]
  40. Ala, A.; Mahmoudi, A.; Mirjalili, S.; Simic, V.; Pamucar, D. Evaluating the Performance of Various Algorithms for Wind Energy Optimization: A Hybrid Decision-Making Model. Expert Syst. Appl. 2023, 221, 119731. [Google Scholar] [CrossRef]
  41. Khamees, A.K.; Abdelaziz, A.Y.; Ali, Z.M.; Alharthi, M.M.; Ghoneim, S.S.M.; Eskaros, M.R.; Attia, M.A. Mixture Probability Distribution Functions Using Novel Metaheuristic Method in Wind Speed Modeling. Ain Shams Eng. J. 2022, 13, 101613. [Google Scholar] [CrossRef]
  42. İnaç, T.; Dokur, E.; Yüzgeç, U. A Multi-Strategy Random Weighted Gray Wolf Optimizer-Based Multi-Layer Perceptron Model for Short-Term Wind Speed Forecasting. Neural Comput. Appl. 2022, 34, 14627–14657. [Google Scholar] [CrossRef]
  43. Su, Z.; Wang, J.; Lu, H.; Zhao, G. A New Hybrid Model Optimized by an Intelligent Optimization Algorithm for Wind Speed Forecasting. Energy Convers. Manag. 2014, 85, 443–452. [Google Scholar] [CrossRef]
  44. Abdel-Basset, M.; Mohamed, R.; Jasser, M.B.; Hezam, I.M.; Sallam, K.M.; Mohamed, A.W. Developments on Metaheuristic-Based Optimization for Numerical and Engineering Optimization Problems: Analysis, Design, Validation, and Applications. Alex. Eng. J. 2023, 78, 175–212. [Google Scholar] [CrossRef]
  45. Alrashidi, M.; Pipattanasomporn, M.; Rahman, S. Metaheuristic Optimization Algorithms to Estimate Statistical Distribution Parameters for Characterizing Wind Speeds. Renew. Energy 2020, 149, 664–681. [Google Scholar] [CrossRef]
  46. Hassan, A.Y.; Soliman, A.M.; Ahmed, D.; Saleh, S.M. Wind Cube Optimum Design for Wind Turbine Using Meta-Heuristic Algorithms. Alex. Eng. J. 2022, 61, 4911–4929. [Google Scholar] [CrossRef]
  47. Guedes, K.S.; De Andrade, C.F.; Rocha, P.A.C.; Mangueira, S.; Moura, E.P. De Performance Analysis of Metaheuristic Optimization Algorithms in Estimating the Parameters of Several Wind Speed Distributions. Appl. Energy 2020, 268, 114952. [Google Scholar] [CrossRef]
  48. Shin, J.Y.; Ouarda, T.B.M.J.; Lee, T. Heterogeneous Mixture Distributions for Modeling Wind Speed, Application to the UAE. Renew. Energy 2016, 91, 40–52. [Google Scholar] [CrossRef]
  49. Yang, X. Nature-Inspired Metaheuristic Algorithms, 2nd ed.; Luniver Press: Bristol, UK, 2008; ISBN 1905986289. [Google Scholar]
  50. Fister, I.; Yang, X.S.; Brest, J. A Comprehensive Review of Firefly Algorithms. Swarm Evol. Comput. 2013, 13, 34–46. [Google Scholar] [CrossRef]
  51. Cheng, Z.; Song, H.; Wang, J.; Zhang, H.; Chang, T.; Zhang, M. Hybrid Firefly Algorithm with Grouping Attraction for Constrained Optimization Problem. Knowl. Based Syst. 2021, 220, 106937. [Google Scholar] [CrossRef]
  52. Shan, J.; Pan, J.S.; Chang, C.K.; Chu, S.C.; Zheng, S.G. A Distributed Parallel Firefly Algorithm with Communication Strategies and Its Application for the Control of Variable Pitch Wind Turbine. ISA Trans. 2021, 115, 79–94. [Google Scholar] [CrossRef]
  53. Hassan, B.A. CSCF: A Chaotic Sine Cosine Firefly Algorithm for Practical Application Problems. Neural Comput. Appl. 2021, 33, 7011–7030. [Google Scholar] [CrossRef]
  54. Wang, H.; Zhou, X.; Sun, H.; Yu, X.; Zhao, J.; Zhang, H.; Cui, L. Firefly Algorithm with Adaptive Control Parameters. Soft Comput. 2017, 21, 5091–5102. [Google Scholar] [CrossRef]
  55. Liang, T.; Zhao, Q.; Lv, Q.; Sun, H. A Novel Wind Speed Prediction Strategy Based on Bi-LSTM, MOOFADA and Transfer Learning for Centralized Control Centers. Energy 2021, 230, 120904. [Google Scholar] [CrossRef]
  56. Ray, P.K.; Mohanty, A. A Robust Firefly–Swarm Hybrid Optimization for Frequency Control in Wind/PV/FC Based Microgrid. Appl. Soft Comput. 2019, 85, 105823. [Google Scholar] [CrossRef]
  57. Gupta, D.K.; Soni, A.K.; Jha, A.V.; Mishra, S.K.; Appasani, B.; Srinivasulu, A.; Bizon, N.; Thounthong, P. Hybrid Gravitational-Firefly Algorithm-Based Load Frequency Control for Hydrothermal Two-Area System. Mathematics 2021, 9, 712. [Google Scholar] [CrossRef]
  58. Kumar, V.; Kumar, D. A Systematic Review on Firefly Algorithm: Past, Present, and Future. Arch. Comput. Methods Eng. 2021, 28, 3269–3291. [Google Scholar] [CrossRef]
  59. Rizk-Allah, R.M.; Zaki, E.M.; El-Sawy, A.A. Hybridizing Ant Colony Optimization with Firefly Algorithm for Unconstrained Optimization Problems. Appl. Math. Comput. 2013, 224, 473–483. [Google Scholar] [CrossRef]
  60. Fister, I.; Perc, M.; Kamal, S.M.; Fister, I. A Review of Chaos-Based Firefly Algorithms: Perspectives and Research Challenges. Appl. Math. Comput. 2015, 252, 155–165. [Google Scholar] [CrossRef]
  61. Ghasemi, M.; Mohammadi, S.k.; Zare, M.; Mirjalili, S.; Gil, M.; Hemmati, R. A New Firefly Algorithm with Improved Global Exploration and Convergence with Application to Engineering Optimization. Decis. Anal. J. 2022, 5, 100125. [Google Scholar] [CrossRef]
  62. Bazi, S.; Benzid, R.; Bazi, Y.; Rahhal, M.M. Al A Fast Firefly Algorithm for Function Optimization: Application to the Control of Bldc Motor. Sensors 2021, 21, 5267. [Google Scholar] [CrossRef]
  63. Altabeeb, A.M.; Mohsen, A.M.; Ghallab, A. An Improved Hybrid Firefly Algorithm for Capacitated Vehicle Routing Problem. Appl. Soft Comput. J. 2019, 84, 105728. [Google Scholar] [CrossRef]
  64. Wang, C.; Chu, X. An Improved Firefly Algorithm with Specific Probability and Its Engineering Application. IEEE Access 2019, 7, 57424–57439. [Google Scholar] [CrossRef]
  65. Goswami, A.; Kumar Sadhu, P. Stochastic Firefly Algorithm Enabled Fast Charging of Solar Hybrid Electric Vehicles. Ain Shams Eng. J. 2021, 12, 529–539. [Google Scholar] [CrossRef]
  66. Younis, A.; Elshiekh, H.; Osama, D.; Shaikh-Eldeen, G.; Elamir, A.; Yassin, Y.; Omer, A.; Biraima, E. Wind Speed Forecast for Sudan Using the Two-Parameter Weibull Distribution: The Case of Khartoum City. Wind 2023, 3, 213–231. [Google Scholar] [CrossRef]
  67. Dong, Z.; Wang, X.; Zhu, R.; Dong, X.; Ai, X. Improving the Accuracy of Wind Speed Statistical Analysis and Wind Energy Utilization in the Ningxia Autonomous Region, China. Appl. Energy 2022, 320, 119256. [Google Scholar] [CrossRef]
  68. Teimourian, H.; Abubakar, M.; Yildiz, M.; Teimourian, A. A Comparative Study on Wind Energy Assessment Distribution Models: A Case Study on Weibull Distribution. Energies 2022, 15, 5684. [Google Scholar] [CrossRef]
  69. Chicco, D.; Warrens, M.J.; Jurman, G. The Coefficient of Determination R-Squared Is More Informative than SMAPE, MAE, MAPE, MSE and RMSE in Regression Analysis Evaluation. PeerJ Comput. Sci. 2021, 7, e623. [Google Scholar] [CrossRef]
  70. Younis, A.; Bakhit, A.; Onsa, M.; Hashim, M. A Comprehensive and Critical Review of Bio-Inspired Metaheuristic Frameworks for Extracting Parameters of Solar Cell Single and Double Diode Models. Energy Rep. 2022, 8, 7085–7106. [Google Scholar] [CrossRef]
  71. Massan, S.U.R.; Wagan, A.I.; Shaikh, M.M.; Abro, R. Wind Turbine Micrositing by Using the Firefly Algorithm. Appl. Soft Comput. J. 2015, 27, 450–456. [Google Scholar] [CrossRef]
  72. Yu, S.; Zhu, S.; Ma, Y.; Mao, D. A Variable Step Size Firefly Algorithm for Numerical Optimization. Appl. Math. Comput. 2015, 263, 214–220. [Google Scholar] [CrossRef]
  73. Haddad, O.B.; Afshar, A.; Mariño, M.A. Honey-Bees Mating Optimization (HBMO) Algorithm: A New Heuristic Approach for Water Resources Optimization. Water Resour. Manag. 2006, 20, 661–680. [Google Scholar] [CrossRef]
  74. Afshar, A.; Haddad, O.B.; Marino, M.; Adams, B. Marriage in Honey-Bee Optimization (MBO): A Haplometrosis Polygynous Swarming Approach. In Proceedings of the Congress on Evolutionary Computation, Seoul, Republic of Korea, 27–30 May 2001; pp. 207–214. [Google Scholar]
  75. Lloyd, J.E. Aggressive Mimicry in Photuris: Firefly Femmes Fatales. Science 1965, 149, 653–654. [Google Scholar] [CrossRef]
  76. Ozay, C.; Celiktas, M.S. Statistical Analysis of Wind Speed Using Two-Parameter Weibull Distribution in AlaçatI Region. Energy Convers. Manag. 2016, 121, 49–54. [Google Scholar] [CrossRef]
  77. Wais, P. Two and Three-Parameter Weibull Distribution in Available Wind Power Analysis. Renew. Energy 2017, 103, 15–29. [Google Scholar] [CrossRef]
  78. Soulouknga, M.H.; Doka, S.Y.; Revanna, N.; Djongyang, N.; Kofane, T.C. Analysis of Wind Speed Data and Wind Energy Potential in Faya-Largeau, Chad, Using Weibull Distribution. Renew. Energy 2018, 121, 1–8. [Google Scholar] [CrossRef]
  79. SONDA: Sistema de Organização Nacional de Dados Ambientais. SCR-25: SAO JOAO DO CARIRI STATION. Available online: http://sonda.ccst.inpe.br/basedados/sjcariri.html (accessed on 17 October 2023).
  80. World Radiation Monitoring Center Baseline Surface Radiation Network. Available online: https://bsrn.awi.de/ (accessed on 18 October 2023).
  81. Suganthan, P.N.; Hansen, N.; Liang, J.J.; Deb, K.; Chen, Y.-P.; Auger, A.; Tiwari, S. Problem Definitions and Evaluation Criteria for the CEC 2005 Special Session on Real-Parameter Optimization; Kanpur Genetic Algorithms Laboratory: Kanpur, India, 2005. [Google Scholar]
Figure 1. Global new wind power capacity [5].
Forecasting 06 00020 g001
Figure 2. Share of the parameter estimation method in 46 literature studies [38].
Forecasting 06 00020 g002
Figure 4. (Left) Initial location of 25 Fireflies, (Right) fireflies locations after 20 iterations [70].
Forecasting 06 00020 g004
Figure 9. Convergence chart showing the optimization progress of HBMFA and FA algorithms on CEC 2005 Function 11.
Forecasting 06 00020 g009
Figure 10. Convergence chart showing the optimization progress of HBMFA and FA algorithms on CEC 2005 Function 12.
Forecasting 06 00020 g010
Figure 11. Convergence chart showing the optimization progress of HBMFA and FA algorithms on CEC 2005 Function 13.
Forecasting 06 00020 g011
Figure 12. Convergence chart showing the optimization progress of HBMFA and FA algorithms on CEC 2005 Function 14.
Forecasting 06 00020 g012
Figure 13. Convergence box plots of HBMFA and FA across CEC 2005 benchmark functions.
Forecasting 06 00020 g013
Figure 14. Execution time vs. iterations.
Forecasting 06 00020 g014
Figure 15. Scale and shape parameters vs. iterations produced by HBMFA on a 99.99% threshold percentage.
Forecasting 06 00020 g015
Figure 16. Impact of various mating thresholds on solution accuracy.
Forecasting 06 00020 g016
Table 3. Summary of Optimization Results: HBMFA vs. FA on CEC 2005 benchmark functions.
FunctionAlgorithmBest FitnessTime [s]
11HBMFA0.99999819635102570.015956401824951172
FA0.99999819635155760.012964487075805664
12HBMFA0.99999819640178120.01695418357849121
FA0.9999981964018480.01295924186706543
13HBMFA0.9999981964018480.015957117080688477
FA0.9999981964018480.012967824935913086
14HBMFA0.9999981964018480.013957023620605469
FA0.9999981964018480.012965917587280273
Table 4. Cannibalism event occurrences for each iteration.
IterationsMeanMedianMode
1021.321.523
10019.181817
100018.3741716
10,00018.6611816
Table 5. Computational results for the HBMFA on 99.99% threshold percentage.
Iterationskc [m/s]R2Time [s]Time per Single Iteration [s]
102.109427355.461370140.9999978087070.1735661030.01735661
1002.171232125.43185340.9999981931.5010149480.015010149
10002.165652275.433526930.99999819614.724679230.014724679
10,0002.165765745.433009020.999998196143.31702780.014331703
Table 6. Computational results for the conventional FA.
Iterationskc [m/s]R2Time [s] Time per Single Iteration [s]
104.8485714165.0749461590.9998130210.1485514640.014855146
1007.6797382485.0259945430.9996607571.2516810890.012516811
10005.4011168725.0616976210.99977742612.219410420.01221941
10,0006.0226193635.0450679990.999741091121.76771970.012176772
Table 7. Comparison between HBMFA and FA performances.
IterationsAccuracyTime
100.018%16.84%
1000.034%19.92%
10000.022%20.50%
10,0000.026%17.70%
Table 8. Computational results for HMBFA and popular metaheuristic optimization algorithms at 13 population sizes and 10,000 iterations.
Algorithmkc [m/s]R2Time [s]
CS2.25.40.9990732430.3388538361
FA6.0226193635.0450679990.999741091121.7677197
GA2.1654055725.4335248090.99918590617.3617947102
GWO1.9007960724.9733120880.9848772438.5335
HBMFA2.165765745.433009020.999998196143.3170278
PSO2.1649322865.4332469900.9991858920.0233604908
Table 9. Comparison between the HBMFA and the MBO results.
Wind Speed DataModelAlgorithmkcR21 − R2
Including the null speedTwo parameters WeibullHBMFA2.16555.43380.9999981961.804 × 10−6
Excluding the null speedMBO [47]2.37076.00980.9999427535.7247246 × 10−5
HBMFA2.22535.45020.9999988251.17458222 × 10−6
Disclaimer/Publisher’s Note: The statements, opinions and data contained in all publications are solely those of the individual author(s) and contributor(s) and not of MDPI and/or the editor(s). MDPI and/or the editor(s) disclaim responsibility for any injury to people or property resulting from any ideas, methods, instructions or products referred to in the content.