1. Introduction
In a city with an already-existing built environment, we can globally describe the vitality of a district or a block of this district based on the activities that are proposed there, the visitation of the place, the time that is spent there, and the speed at which one crosses it, but also the travel time to reach this place. Urban design layouts contain information about activities and their location; their a priori attractiveness requires the knowledge of town planners. The frequenting of these places is deduced from the routes taken by the users going to the zone, as well as their dynamics. This paper proposes to predict the movements of future users of a future district based on available census data and future households and the layout of the facilities of the district. This forecasting movement of people is based on a simulation, which is not a common technique in forecasting but can be classified as an agent-based method [
1]. It is an agent-based model that takes into account the flows of external visitors, realistically estimated based on pre-project travels in the district areas of influence.
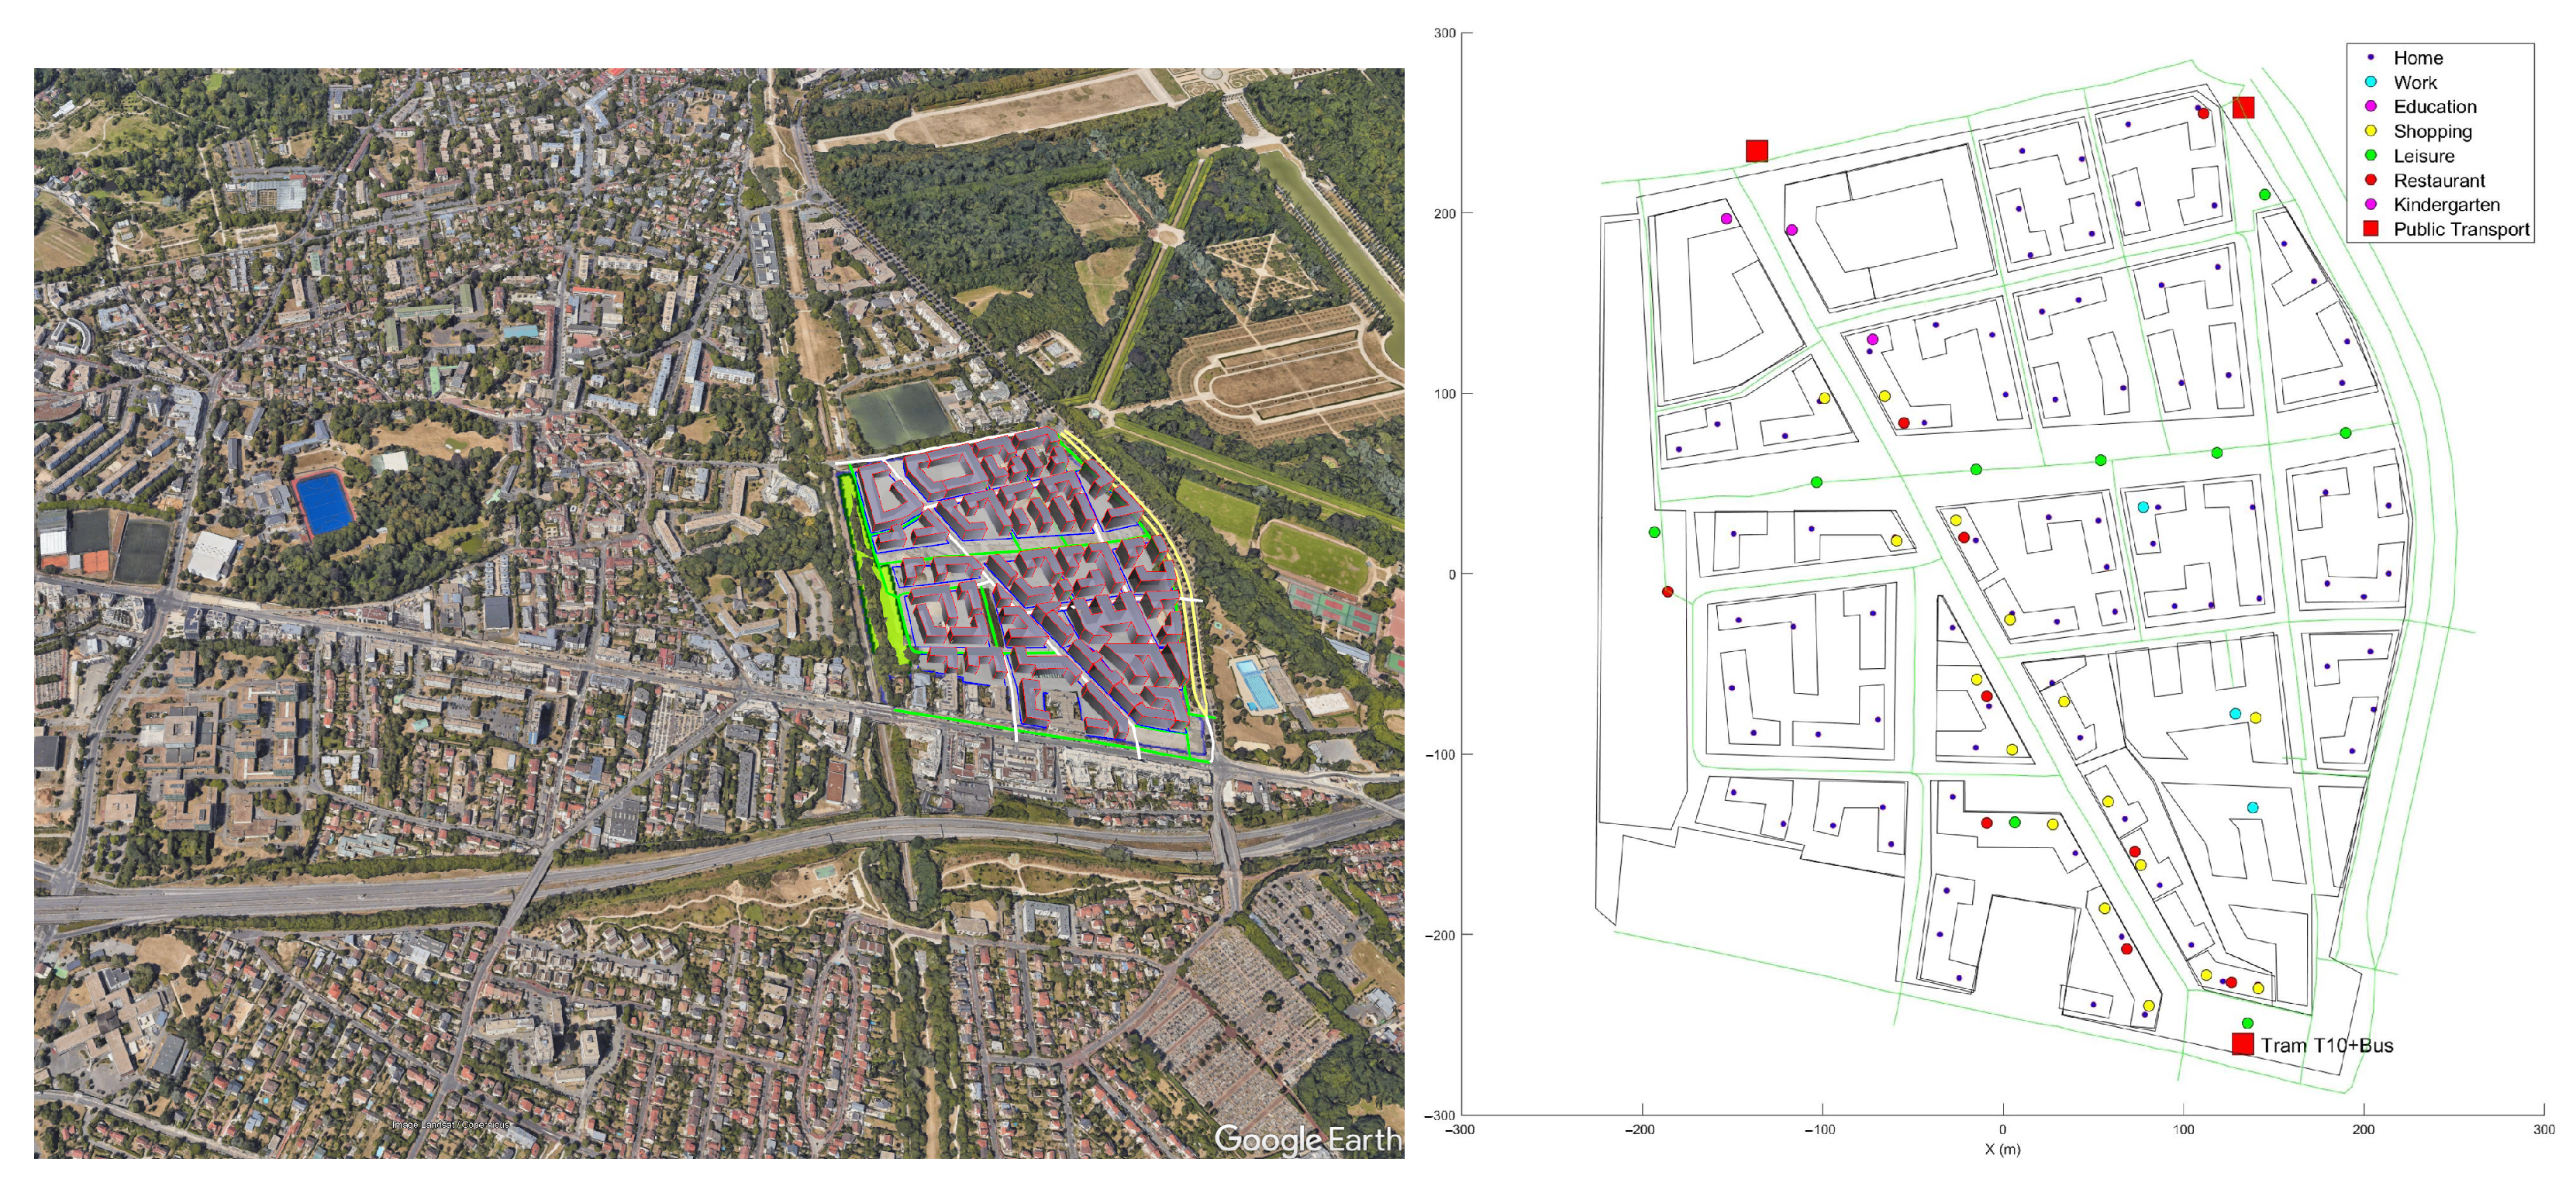
LaVallée is a large construction project recently started in Paris’s suburb. Its spatial extent is about 20 hectares, part of a larger city called Châtenay-Malabry. The whole district is to be delivered in 2027. The first roads are being built, and the first set of inhabitants was installed by mid-2023.
Figure 1 illustrates the mass plan in its urban context, with the buildings’ footprints and the future facilities’ locations.
It will house 6200 residents (20% of the city population), with a large set of services ranging from a shopping street to a mall, schools, and office spaces for 1200 employees; and the district is designed to be open to the rest of the city.
Our overall objective is to develop a method for forecasting the potential visits of the various equipment and public spaces of the project by mobilizing current data from census at the departmental level and the layout of shops and future activities inside LaVallée.
After generating the activity plans of the population of the catchment area in the current reference situation and applying a process of adjustment of the time choice of activities in [
2], we have an accurate simulation of multimodal trips nowadays that we call the
reference scenario from this time forward. In this paper, we proceed to the location choice of activities within the future neighborhood by simulating the trips of residents and external visitors: we call it the
projection scenario.
The projection scenario refers to the hypothetical future situation, in which the catchment area including the LaVallée district and its agents is modeled. In this future situation, the numerical data available on LaVallée are the total number of inhabitants, employees, and students, respectively, in workplaces and schools. However, to be able to generate a set of activity plans, it is necessary to have at least the places of activity of the residents, in addition to the origin of employees and students.
Additionally, in our previous approach [
2], the location-choice approach was a distance-based method. At the scale of the neighborhood, for instance, LaVallée, for a given agent, the distance from its domicile, as well as the possible set of destinations inside LaVallée, is relatively the same. Correspondingly, distance-based location choice in this case is an equivalent of random selection and, therefore, an inappropriate method to apply for a neighborhood case. Given the limited data available on the new neighborhood and the limitations of the distance-based approach, three key questions need to be addressed:
How to generate activity plans for future neighborhood agents?
How to assign a location to a secondary activity carried out at the neighborhood scale?
What will be the impact of the new district on the catchment area?
The aim of this study is two-fold: First, modify the developed generator in [
2] to take into account the available data. Second, overcome the limits of the traditional distance-based approach; we propose applying an attraction model for the location choice of activities within a future district. This approach is based on the attractiveness of the activity, which takes into the account the type of activity, the spatial location, and the proximity to other places of activities. As an application case, we will provide a forecasting of the impact of the construction of the new district on the surrounding cities.
2. Related Works: Activity-Based Models
The basis of an activity-based model in transportation is a synthetic travel demand including a synthetic population of households and persons and their daily activity patterns located in time and space. Travel demand synthesis is usually addressed as a two-step process: a synthetic population is first generated with households and persons with their socio-economic features, and then the daily activities of each person are devised. The daily planning of an agent is made of a chain of activities such as Home, Work, Education, Leisure, Shopping, and Catering, with a planned start time, duration, and location for each activity as well as a mode of transportation to get to it. The obtained set of planning constitutes the synthetic travel demand, which is fed to a transportation model, typically a dynamic traffic assignment model [
3,
4] that loads the road network with the travelers and finds their optimal routes until a dynamic user equilibrium is reached. It results in daily traffic flows, at all times of the day, for each of the transportation modalities represented: private vehicle, public transportation, bicycle, and walk typically.
A synthetic population is an approximation of a real population. The objective of a population synthesis is to reproduce the underlying statistical properties of a real population based on available microsamples and marginal distributions of households and persons. Several methods were proposed to generate a synthetic population; they require at least a representative population sample data. These methods can be classified into three groups: Synthetic Reconstruction (SR), Combinatorial Optimization (CO), and Machine Learning (ML) [
5]. The SR and CO methods produce synthetic populations by means of replicating individuals, whereas ML methods generate a population following a joint probability estimation. The SR approach is an earlier method for generating a synthetic population; it uses a deterministic process to reconstruct the population by reproducing all known constraints from census tables [
6,
7]. The two main synthetic reconstruction methods are iterative proportional fitting and iterative proportional updating [
8,
9,
10]; they can be based on a microsample or sample-free [
11,
12]. In CO methods [
13,
14], data requirements remain less restrictive than in SR methods, but their computational complexity increases for large population sizes. ML focuses on the joint distribution of all attributes by estimating a probability for each combination [
15,
16,
17]. The aforementioned methods regard population synthesis as an independent process to the downstream processing stage of defining the activity planning of the generated population.
Defining daily activity patterns for the synthesized agents often uses statistical matching approaches [
18,
19], which make use of a household travel survey containing an example of real-life daily plannings and attach whole activity chains based on similarity to explanatory socio-demographic attributes.
According to their decision-making process (behavior choice), activity-based models can be divided into two classes: econometric activity-based models and rule-based models. The econometric models use mainly utility maximization-based equations, with the aim of predicting the probability of decision outcomes (based on the relationship between the travel and activity attributes). Several econometric models were developed, such as CEMDAP [
20] and MORPC [
21]. A rule-based model is a computer program built on a set of rules (a production system model): this approach can capture the schedules’ constraints directly. Several rule-based models were developed, such as SCHEDULER [
22] and TASHA [
23].
An example of such an activity-based model is ALBATROSS [
24]: a decision tree is proposed as a formalism to represent an exhaustive set of mutually exclusive rules used to derive decision trees from activity diary data. The survey asked people about the nature of their activities for 2 days, the start and end times, the location where the activity took place, the transport mode, and the travel time per mode. Socio-economic and space–time setting attributes allow for identifying groups of individuals with a similar choice behavior.
TASHA [
25] uses a bottom–up approach to generate its activity plans; the scheduling process uses a predefined order of insertion of activities. Once the activities are inserted, a specific process is applied to solve the generated conflicts due the overlapping of the inserted activities. However, this approach is not suitable in our study case because the full chain of activities is already generated. In the proposed approach, the selection of start time and duration takes into consideration the remaining activities and their temporal constraints. The selection of both start time and duration will not generate conflicts.
In our case study, activity choice and their locations were previously addressed in [
26], and a time-choice process is presented in [
2]. We use the MATSim (Multi-Agent Transport Simulation [
27,
28]) framework for demand modeling and agent-based mobility simulation: it is open-source and widely used to implement large-scale activity-based modeling.
The remainder of this paper is as follows:
Section 3 gives an overview of the approach to generate daily activity planning for future residents based on the facility layout of the district.
Section 4 presents the proposed methodology where the location of an activity is influenced by the proximity of other animation centers in the process declined in three stages: Generation, Assessment, and Selection. Primary and secondary activity plans are then matched to the agents based on a set of constraints and a matching rate.
Section 5 presents an application of the proposed methodology in the case study of the catchment area including LaVallée in a future situation when the district is built. The potential of visitation and the attractiveness of the future facilities are illustrated, and the concrete daily planning of the future residents is detailed.
Section 6 describes the impact of the new district forecast on the surrounding cities by performing a simulation of the hypothetical future situation.
Section 7 concludes the article.
3. Overview of the Proposed Approach
In this section, we introduce the future LaVallée district along with its residents and facilities integrated into the city’s layout. We simulate changes in the mobility patterns of the surrounding catchment area within this projection scenario. To accomplish this, we present a method for generating daily activity plans for the future residents based on the layout of district facilities. These future residents are represented by agents who are assigned both primary and secondary plans. Determining the locations for various activities is a key challenge, particularly since we lack available data. To address this challenge, we propose an attraction model based on the attractiveness of each facility. This attractiveness is defined considering factors such as proximity to other facilities, accessibility, inherent activity potential, and architectural ambiance-derived area potential. Additionally, we extend this method to define activity locations for external visitors who come from the catchment area for leisure, shopping, or dining purposes. We also introduce a method for estimating the origins of external workers and students expected to engage in activities within the district.
With the generated population, comprising future residents, external individuals, and visitors, we simulate future mobility within the catchment area. We also consider the potential for individuals to modify their plans based on the expected influx of visitors from the city before analyzing the anticipated impact of LaVallée on its surroundings.
Our transportation simulation employs an activity-based model with a dynamic traffic assignment. In this model, agents engage in various activities throughout the day, each with predetermined locations and purposes. The choice of departure time and the mode of transport is estimated based on traffic conditions, personal routing behavior, and individual flexibility in adjusting schedules. Central to this work is activity modeling, where we generate daily plans for each agent within the study area’s population. Each plan consists of a sequence of activities an individual will partake in, along with legs representing trips between activities. Each activity is defined by start and end times, duration, and location.
We used the MATSim (Multi-Agent Transport Simulation [
27]) framework for demand modeling and agent-based mobility simulation. This open-source framework is widely used for implementing large-scale activity-based modeling. The study encompasses various trip purposes, including Work, Education, Shopping, Leisure, Restaurant, and Kindergarten. Transportation modes encompass Private Vehicles (cars), Public Transportation, Walking, and Bicycling. Public Transportation comprises buses (integrated into the car network), railways, and tramways.
The transportation simulation MATSim is an activity-based model with a dynamic traffic assignment. Throughout the day, agents engage in various activities, each with predetermined locations and purposes. The selection of departure time and the mode of transport is estimated based on traffic conditions, personal routing preferences, and the individual’s ability to adjust their schedule. To estimate the trips of all the synthetic population during the day, MATSim requires the planning of each agent, which is made of a chain of activities. For each activity, the user specifies its transportation mode, the start and end-time of the activity, and the location of the activity. This paper deals with the construction of this initial demand input: the rest of MATSim is used as is. The demand is fed to the population generator of MATSim, which loads the road network and performs the dynamic traffic assignment until an equilibrium is reached. The result is a set of trips of all agents during the day.
The primary focus of this paper deals with generating agent activity plans within the new neighborhood, with three distinct groups of agents:
Residents: These are the prospective inhabitants of the LaVallée district. At this stage of real estate development, their home locations remain uncertain as apartments are yet to be sold. Household compositions are assumed based on the number of flats per parcel.
Externals: These include workers and students who reside outside the district but work or study within LaVallée’s workplaces or schools.
Visitors: Visitors come from outside the district and engage in shopping, dining, or other leisure activities within LaVallée during the day.
Our generator, based on a previous work [
26], constructs two sets of plans: primary and secondary. In our previous work, activities have predetermined locations estimated based on public census. In the focus of this paper, we are studying the scenario of a new future district for which secondary activity locations need to be estimated. Most of the previous works in this domain only consider the structure of daily activity patterns, but do not provide a method for estimating the locations in the study area. When analyzing commuting patterns, gravity models have long been used. These models quantify the flows between origins and destinations based on the production and attraction of each zone. They are characterized by attributes such as travel time, land use, and employment. However, these previous models do not take into account the propensity of humans to choose a location with high urban vitality: they would choose an activity based on travel time but also on the popularity of a place. Previous models would only consider travel time as an essential element of the location-choice process: facilities isolated from other centers of interest could be predominant in the planning of activities just because they are closer to the previous activity location of an agent. The innovative contribution of our work is integrating urban vitality; for each facility, an attractiveness measure is assessed based on the urbanistic potential of the block it belongs to and the set of available other activities accessible at a walking distance. We believe it conforms more to the human behavior that favors successful places over travel time.
To tackle this problem, we propose a location-choice process based on an assessment measure known as “attractiveness”, which involves three main stages: generation, assessment, and selection.
The two sets of resident plans are generated separately, and a matching process is applied to combine them, guided by predefined rates and constraints.
Subsequently, the primary generator is employed to generate plans for external agents, focusing on work and education activities. While the locations of these activities are defined within the neighborhood, the agents’ home locations remain unspecified. To resolve this, a dedicated process selects each agent’s place of residence.
Lastly, we address potential visitors who primarily engage in activities outside the district. For each potential visitor, we propose conducting secondary activities within LaVallée, with the choice of locations determined through our location-choice process.
An overview of the proposed approach is illustrated in
Figure 2, while a more detailed description is given in
Figure 3.
4. Methodology
4.1. Location-Choice Process
First, in the generation step, all the feasible instances of the activity sequences, formed by the secondary activities, are generated. “Instances” are used as in the object-oriented programming paradigm: they represent here a realization of a given chain of activities with their locations. Activity sequences are the chain of activities, such as Home–Work–Home–Leisure–Shopping–Home. Second, the assessment stage comprises two parts: the definition and the application of the assessment measures. Assessment measures are defined and used to estimate the attractiveness of LaVallée’s various facilities. At the application stage, the previously generated instances are assessed based on the defined measures. Third, the selection step is the important step of this process; based on a set of constraints, an activity sequence instance is selected, and its locations are updated.
4.1.1. Generation Stage
The initial step involves generating all feasible instances of activity sequences for secondary activities. These sequences, including home activity, are then transformed into home-based tours, with the home as both the first and last activity. Each activity sequence is further transformed into a location sequence, instantiating each activity at all available facilities. This process generates a relatively high number of instances, which can be controlled by applying specific constraints, such as predefined combinations and facility restrictions.
4.1.2. Assessment Stage
In the assessment stage, two parts are involved: defining and applying assessment measures. Assessment measures are designed to estimate the attractiveness of various facilities within LaVallée. Attractiveness is determined based on two factors: the facility’s geographical location and the a priori potential of its activity, which can be inferred from urban metrics. These factors contribute to the calculation of an assessment measure called “attractiveness”.
The attractiveness of a facility, denoted as f, is calculated as the product of its zone potential and an inverse distance measure, which considers the activity potential and the distance from facility f from all other facilities F in the neighborhood.
The two measures of facility
f, which are its zone potential and attractiveness, are given, respectively, in Equations (
1) and (
2).
where
f: facility of interest;
: attractiveness potential of f;
z: urban zone;
Z: set of urban zones;
: 1 if facility f belongs to zone z, 0 otherwise;
: urbanistic potential of zone z.
F: set of all facilities.;
i: facility;
: activity potential of i;
: distance from f to i.
To assign an instance to an activity sequence, two measures are considered: attractiveness and travel time. Attractiveness sums the attractiveness values of all facilities within an instance, while travel time pertains to the total tour travel time.
Two types of travelers are distinguished in this study: one is primarily interested in benefit (attractiveness), and the other, in addition to attractiveness, considers travel time. This leads to the proposal of two scoring measures. The first measure reflects the benefit of an instance, equal to the sum of the attractiveness values of its facilities. The second measure is expressed as the instance’s benefit modified by the instance’s travel time
, resulting in a modified benefit score. These measures are formulated in Equations (
3) and (
4).
Finally, benefit, travel time, and score metrics can be calculated for all the generated instances.
4.1.3. Selection Stage
This third stage consists in selecting for each activity sequence of a traveler one or more instances (tours). In the following, the inputs of the selection process will be presented first, followed by an overview of the process.
The selection stage inputs are as follows:
I: a set of generated instances.
C: a set of constraints that will be used to restrict the set of instances by eliminating those that are inconsistent. Mainly, these constraints are composed of an activity sequence, in which we aim to select an instance, and at least one known place of activity, for instance, the agent’s home.
k and n, two parameters that define the number of instances selected after applying the constrains C and for the final set, which is the output of the stage;
Score measure of the selection process.
The selection procedure is detailed below.
First of all, the set of constraints C is applied to I; we refer to this filtered set of instances by S.
Next, two picking rounds are applied: the -instances maximizing the benefit measure are first selected from S; then the k-instances maximizing score are chosen.
After that, for each picked-up instance
, its selection rate
is calculated according to its weight compared with the other instances; this rate is expressed in Equation (
5).
Finally, based on the set of selection rates
R,
n-instances are selected. The description of the entire location-choice process is shown in
Figure 4.
4.2. Matching Process
In the third and crucial stage of the process, instances of activity sequences are selected based on a set of constraints. Each selected instance’s location is updated according to the chosen activity sequence. This stage is vital in determining the final locations for secondary activities.
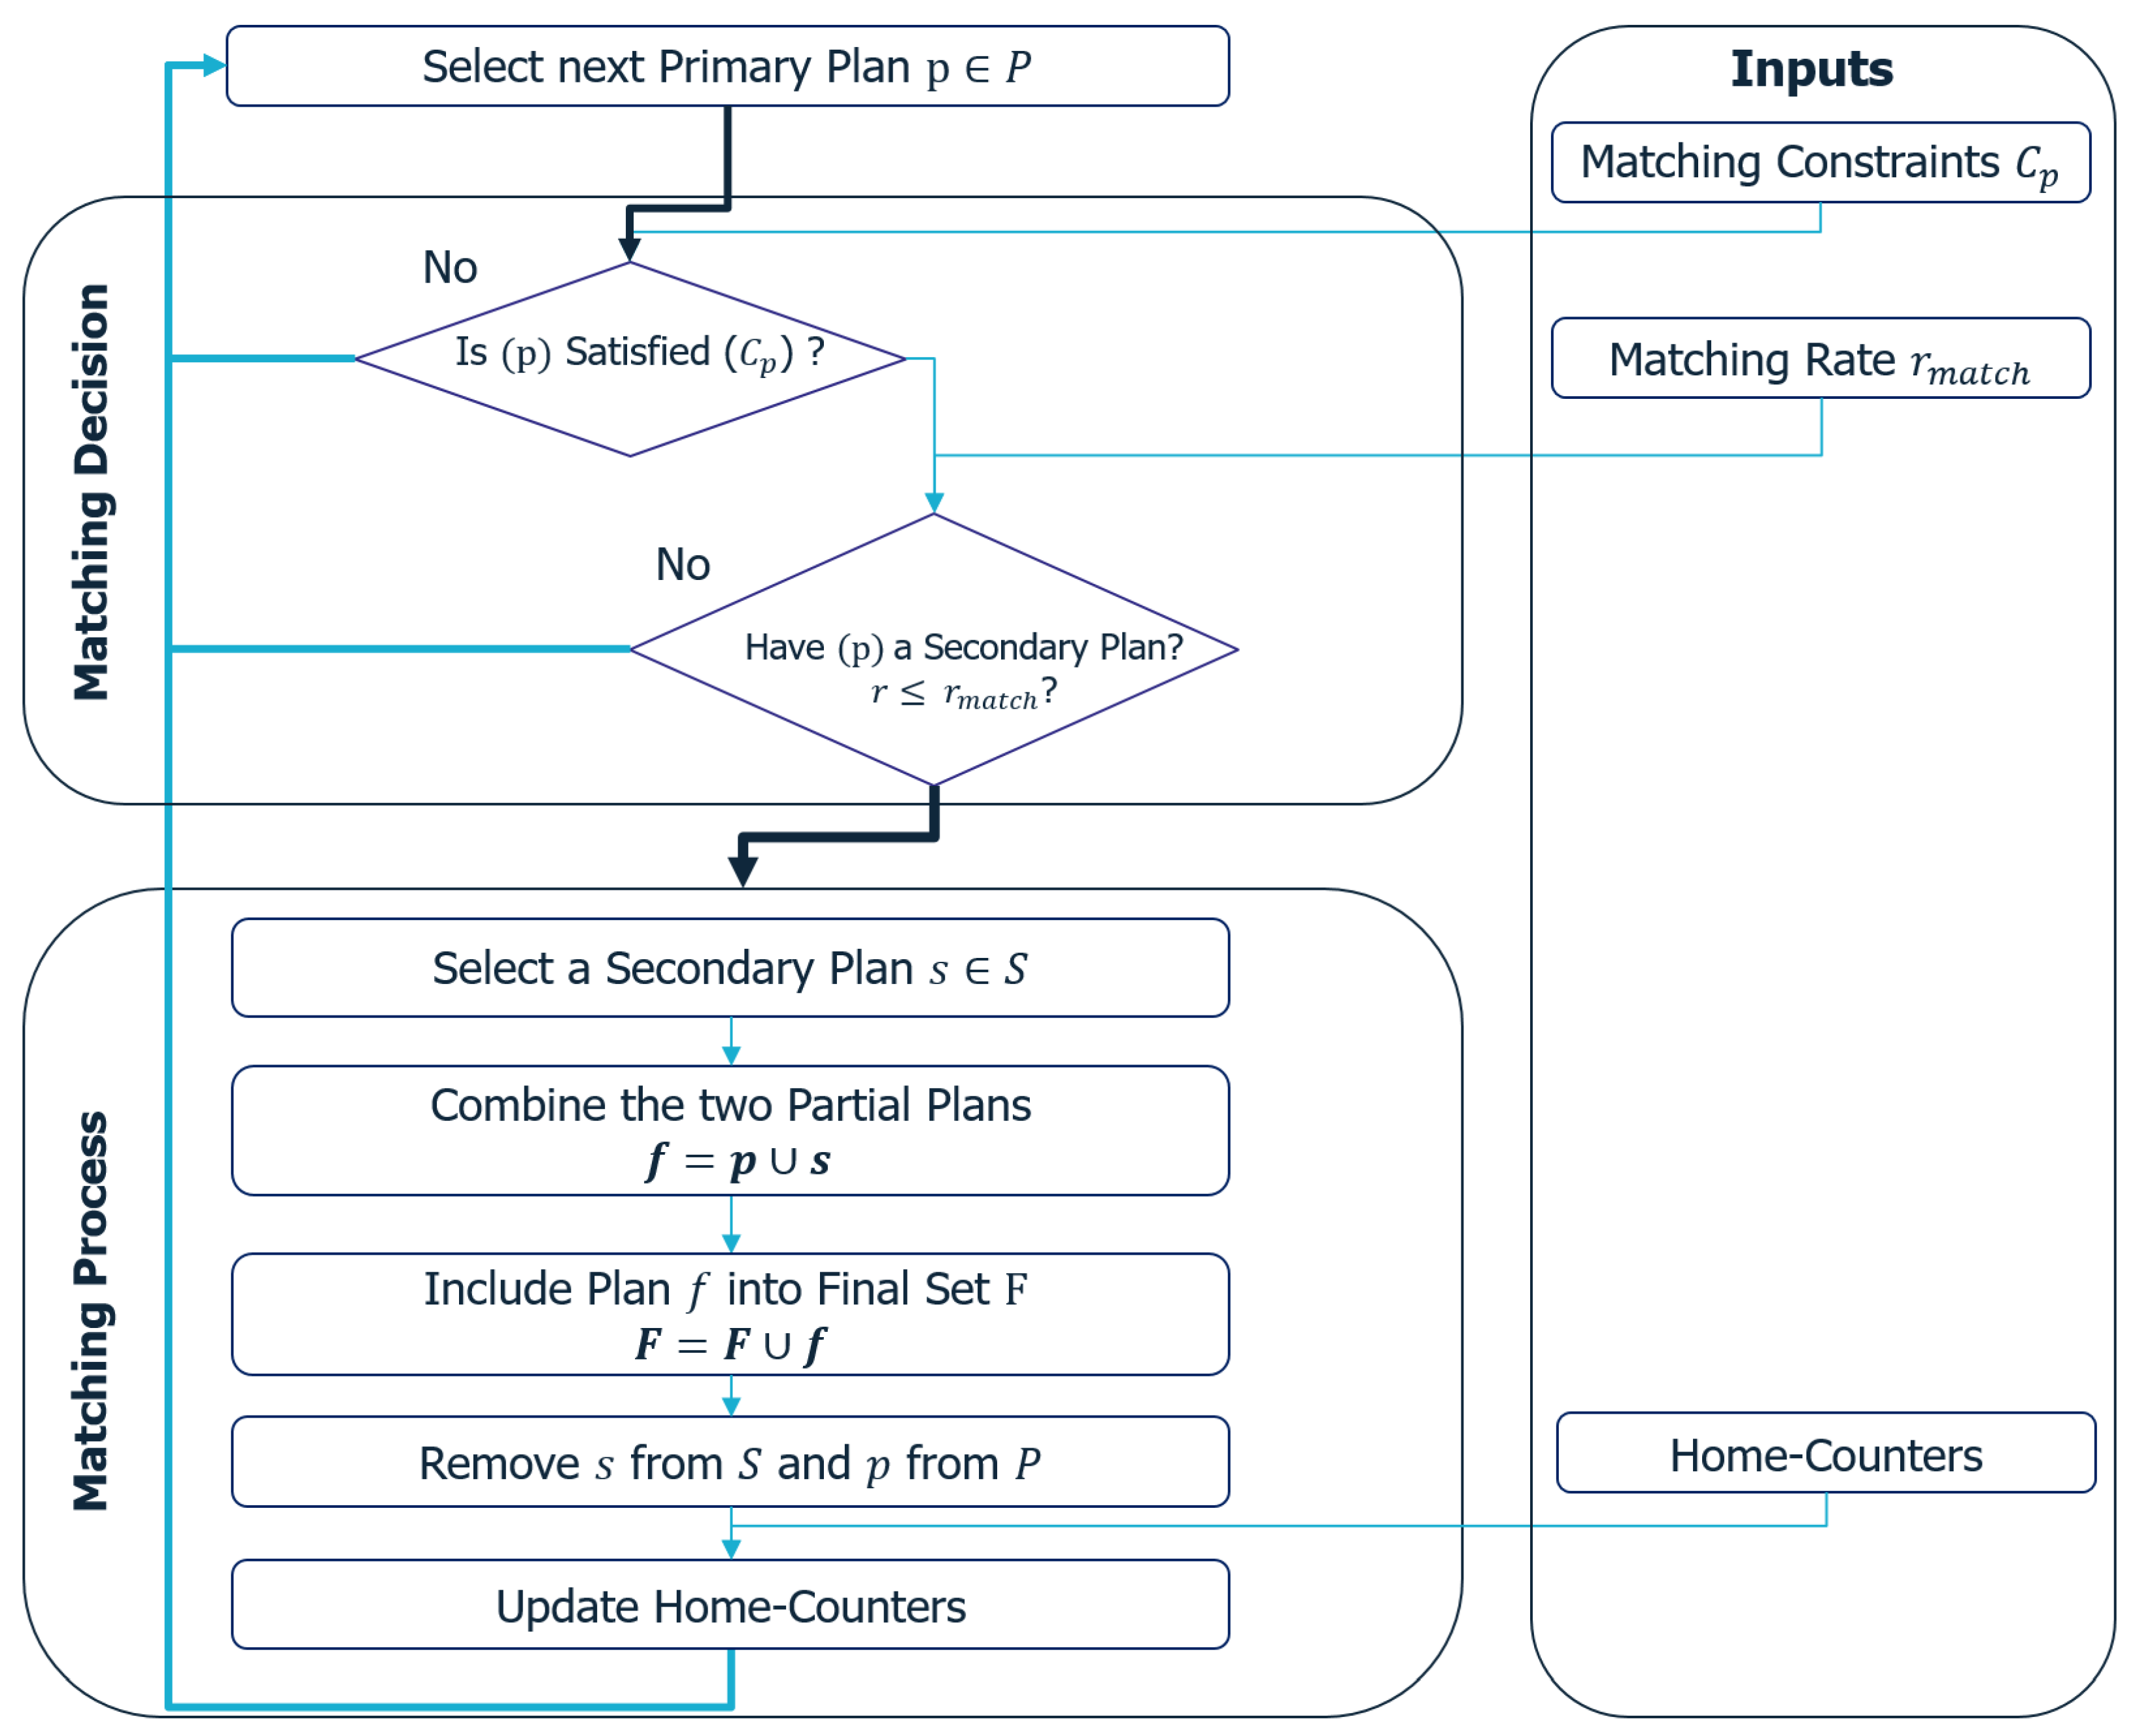
Additionally, there is a matching process introduced in this study. It combines primary and secondary district agent activity plans to create a final set of plans. Each primary plan is randomly selected, and a decision process is initiated to determine the eligibility and willingness to participate in a secondary activity. If eligible and willing, a matching procedure combines the primary and secondary instances to form an activity plan, which is then added to the final set. This process is repeated for all primary plans, ensuring that each is matched with a suitable secondary plan based on predefined constraints and a matching rate.
The inputs of the matching process are presented as follows:
Two sets of plans: primary plans P and secondary plans S.
A set of matching conditions is used to realistically ensure that the selected primary activity plan is eligible for matching. For instance, assume that a pupil will not go alone to a restaurant or shopping center, and therefore, he cannot carry out a secondary activity. Consequently, he is not eligible for matching and will have only a primary activity plan.
: the matching rate depends on the primary plan itself, and it is used to make the decision of whether to match its primary plan or not.
As previously mentioned, before initiating the matching process, it is essential to determine the eligibility of the primary activity plan. To address this, an additional “matching decision” operation is incorporated into the process, and it operates as follows.
A primary plan p is first randomly selected from a set of plans P; then the decision process can be performed. If p is not eligible for the matching process, the decision process is ended and another primary plan is chosen. Next, the agent of the primary plan is asked whether or not to participate in a secondary activity; the decision to participate depends on . If so, the matching procedure can be applied.
The matching procedure begins by randomly selecting a secondary instance, labeled as s. This instance is then combined with the primary plan p to create an activity plan referred to as f, which is subsequently added to the final set F. The matching process will be repeated for all plans within the set P.
Several noteworthy aspects warrant further clarification: In cases where , the matching procedure selects a group of n secondary instances instead of a single one. Additionally, after each successful combination of primary and secondary plans, both the primary plan P and the secondary instance S are removed from their respective sets. Additionally, each time an activity plan f is integrated into the final set F, counter variables require updating to ensure compliance with facility constraints. For example, this ensures adherence to maximum visitor limits.
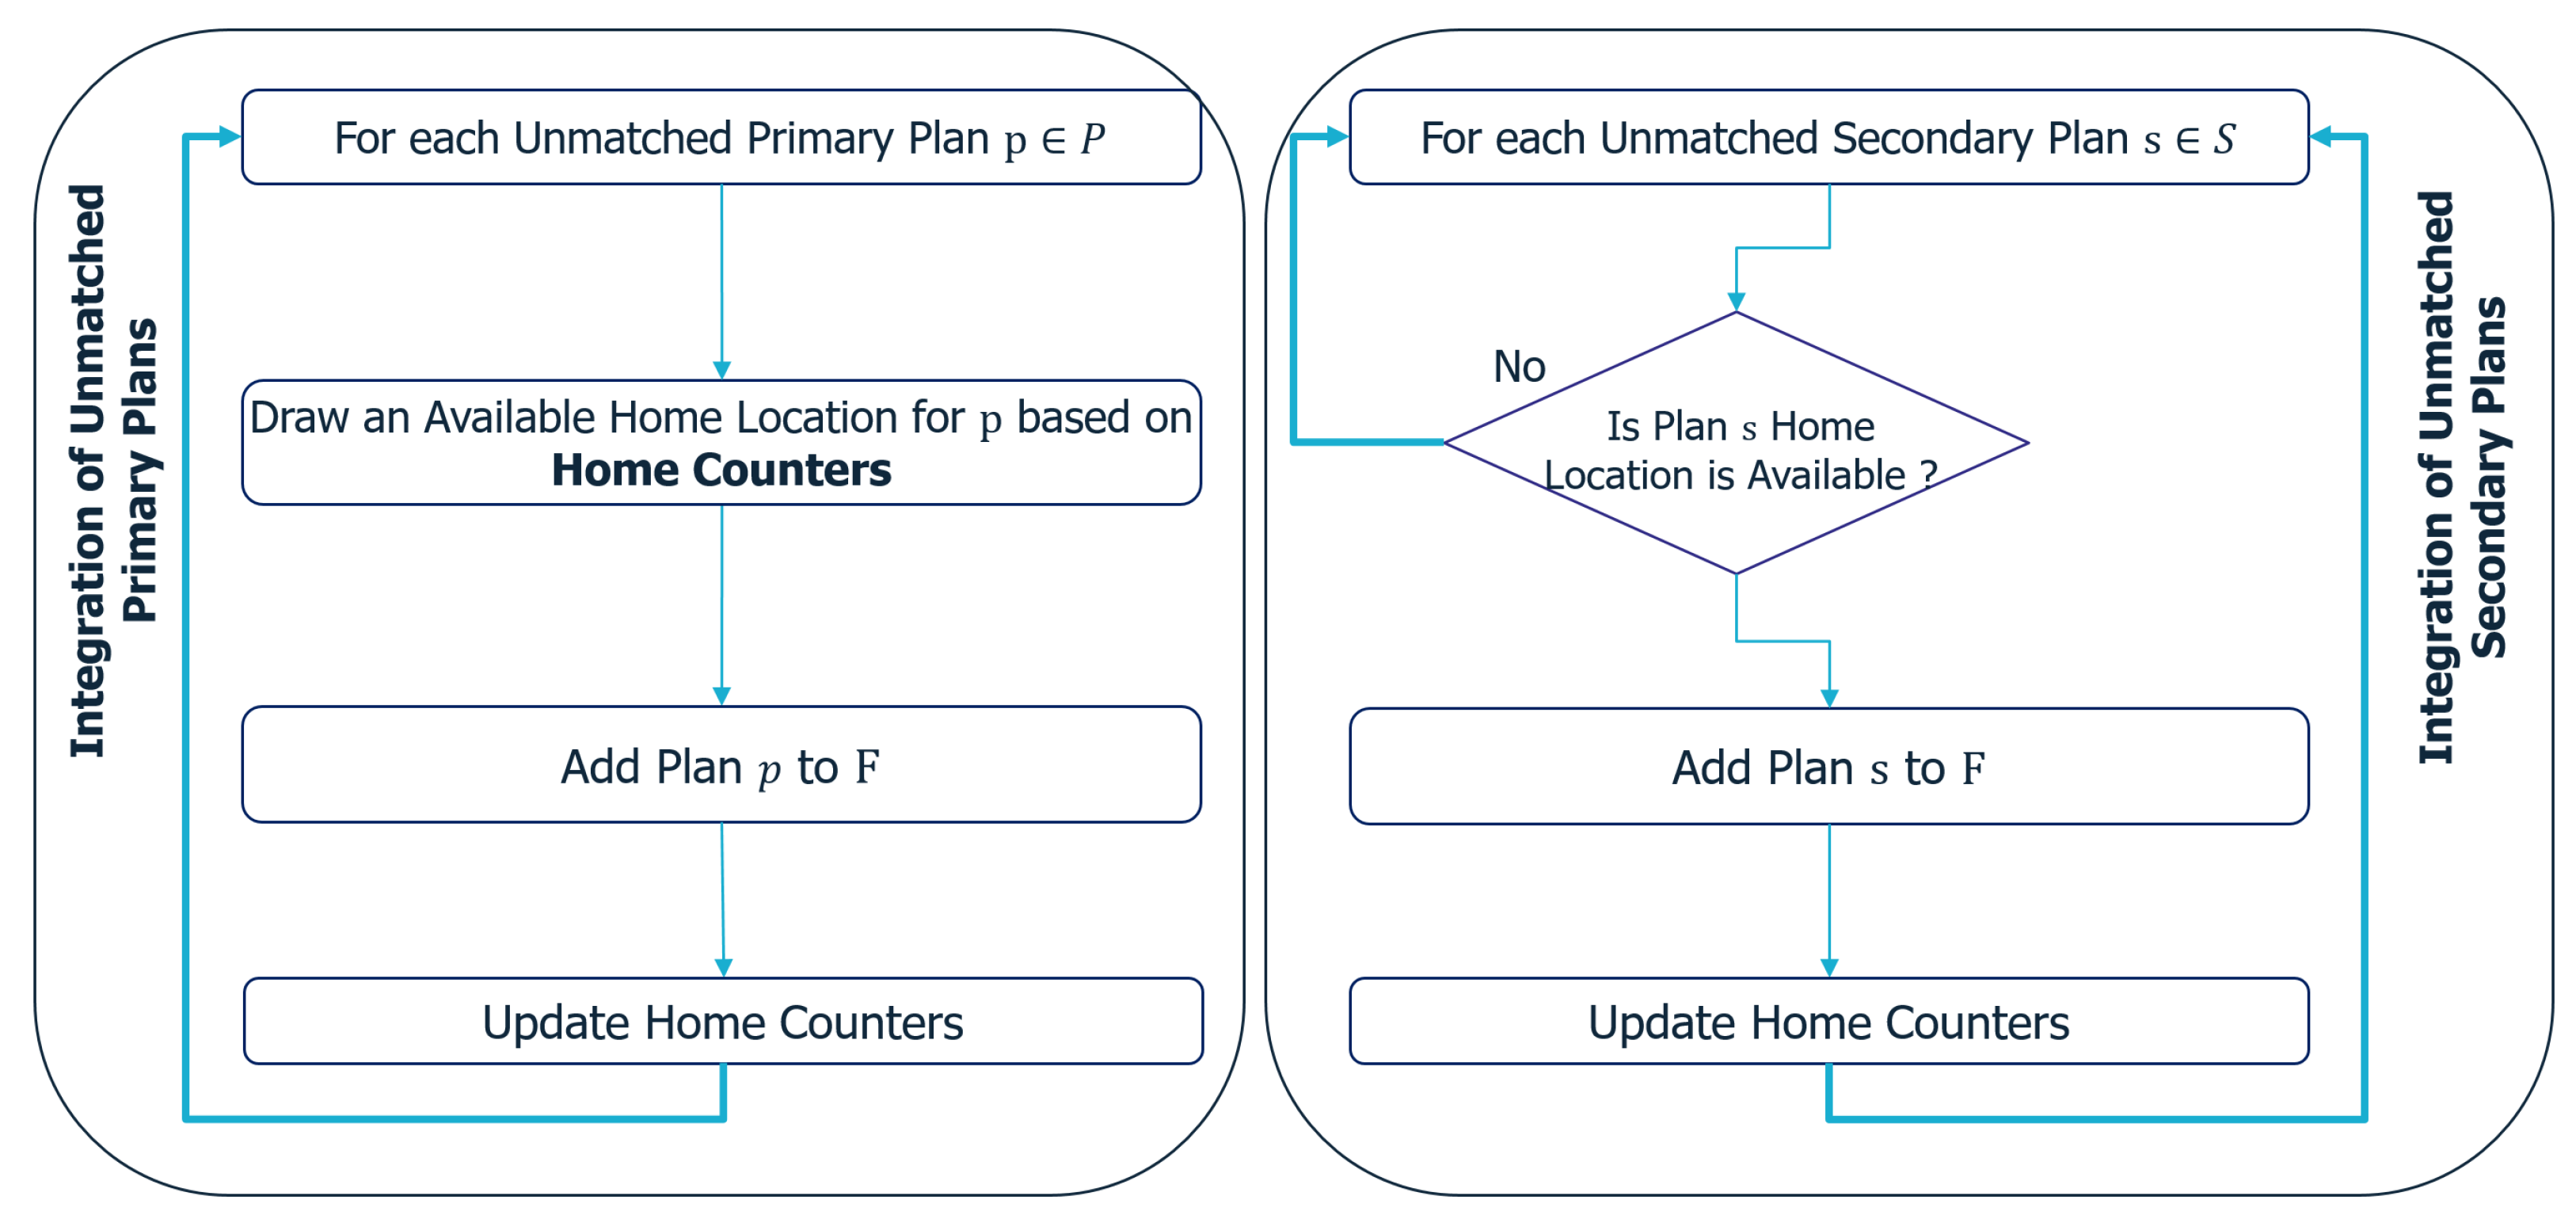
In some instances, certain primary and secondary plans may remain unmatched by the end of the matching process, meaning that they have not yet been included in the final set. To address this situation, an integration process can be used. This process systematically incorporates these unmatched primary plans, followed by secondary plans, into the final set F, while adhering to the various constraints associated with the facilities involved.
The processes of matching and integration of plans are shown in
Figure 5 and
Figure 6, respectively.
5. Case Study: Projection Scenario
In this section, we will demonstrate the application of the proposed methodology using the case study of the catchment area, which includes LaVallée. The presentation is divided into two parts: Data Processing and Application of the Proposed Method.
Data processing begins by providing an overview of the available data concerning the LaVallée district and its facilities. It also outlines certain assumptions made regarding the attractiveness potential of activities and urban zones within LaVallée. Additionally, we will look into the generation and assessment stages of the location-choice process. In the second part, we will apply the methodology to generate activity plans for the population within the catchment area. This population encompasses residents, externals (workers and students), and other potential visitors to the LaVallée district.
5.1. LaVallée Case Study: Data Processing
The present section consists of a set of steps, which are presented as follows: First, the data available on the LaVallée district and its facilities will be given. Then, a set of assumptions, in particular the potential of attractiveness, both for activities and urban zones in LaVallée, will be detailed. Finally, the set of instances of the secondary activities performed in LaVallée will be generated, and then assessed according to two score measures defined in Equations (
3) and (
4).
5.1.1. LaVallée: Available Data
At this stage of real estate development, the available data, such as the number of inhabitants, provide us with a preliminary understanding of the distribution of agents within LaVallée’s primary facilities. The available data can be categorized into: (1) the distribution of inhabitants in LaVallée, (2) the potential number of students in schools (e.g., Groupe Scolaire, Collège) and kindergarten (Crèche), and (3) the number of employees in specific facilities, including an office building (LIDL headquarters), a grocery store (LIDL supermarket), and a co-working space.
The potential number of agents per primary facility in LaVallée is illustrated in
Figure 7. Each residential location is represented by a blue square, accompanied by the number of future residents residing there. It is worth noting that the future LIDL headquarters is expected to employ 1200 individuals, making it a significant attraction for external visitors coming for work purposes. Similarly, the two schools have a combined capacity of 1270 pupils, which will also attract external visitors for educational purposes.
5.1.2. LaVallée Facilities: Potential and Attractiveness Measures
In the following sections, we will outline several assumptions regarding the potential for attractiveness.
First, we assume that only secondary activities possess positive attractiveness potential. Conversely, primary activities are considered neutral, resulting in zero potential. This choice is grounded in the idea that secondary facilities, such as shops or leisure venues, offer high-quality and enjoyable services, making them significant attractions not only for themselves but also for neighboring facilities.
Second, we assume that a place of activity with high attractiveness will inevitably experience high attendance. Therefore, it can be concluded that attractiveness potential and the number of individuals engaging in an activity are strongly correlated.
To assign a potential value to an activity, we implemented the following process. We extract observations from travel surveys like ENTD (National Census on Travel and Transportation) that involve secondary activities. Subsequently, we calculate the ratio of observations for each trip purpose among the following: Shopping, Leisure, and Restaurant. This enables us to easily infer attractiveness potentials. From this survey, it can be inferred that there are 5.8 times more trips for Shopping than for Restaurant and 3.2 times more trips for Leisure purposes than the number of trips for Restaurant.
It is important to highlight the uniqueness of the LIDL supermarket, a specific grocery store in LaVallée, which happens to be the largest shopping facility and, therefore, significantly more attractive than other standard shops. For the sake of simplicity, we assume that its attractiveness potential is twice that of a typical shop.
The number of facilities and the potential attractiveness values per type of activity are detailed in
Table 1.
One aspect that warrants further clarification is that the values presented have been adjusted based on the ratios extracted from the ENTD survey. The objective of this adjustment is to assign a value of 1 to the lowest positive potential. For example, the restaurant ratio is 10%, and after adjustment, its potential becomes .
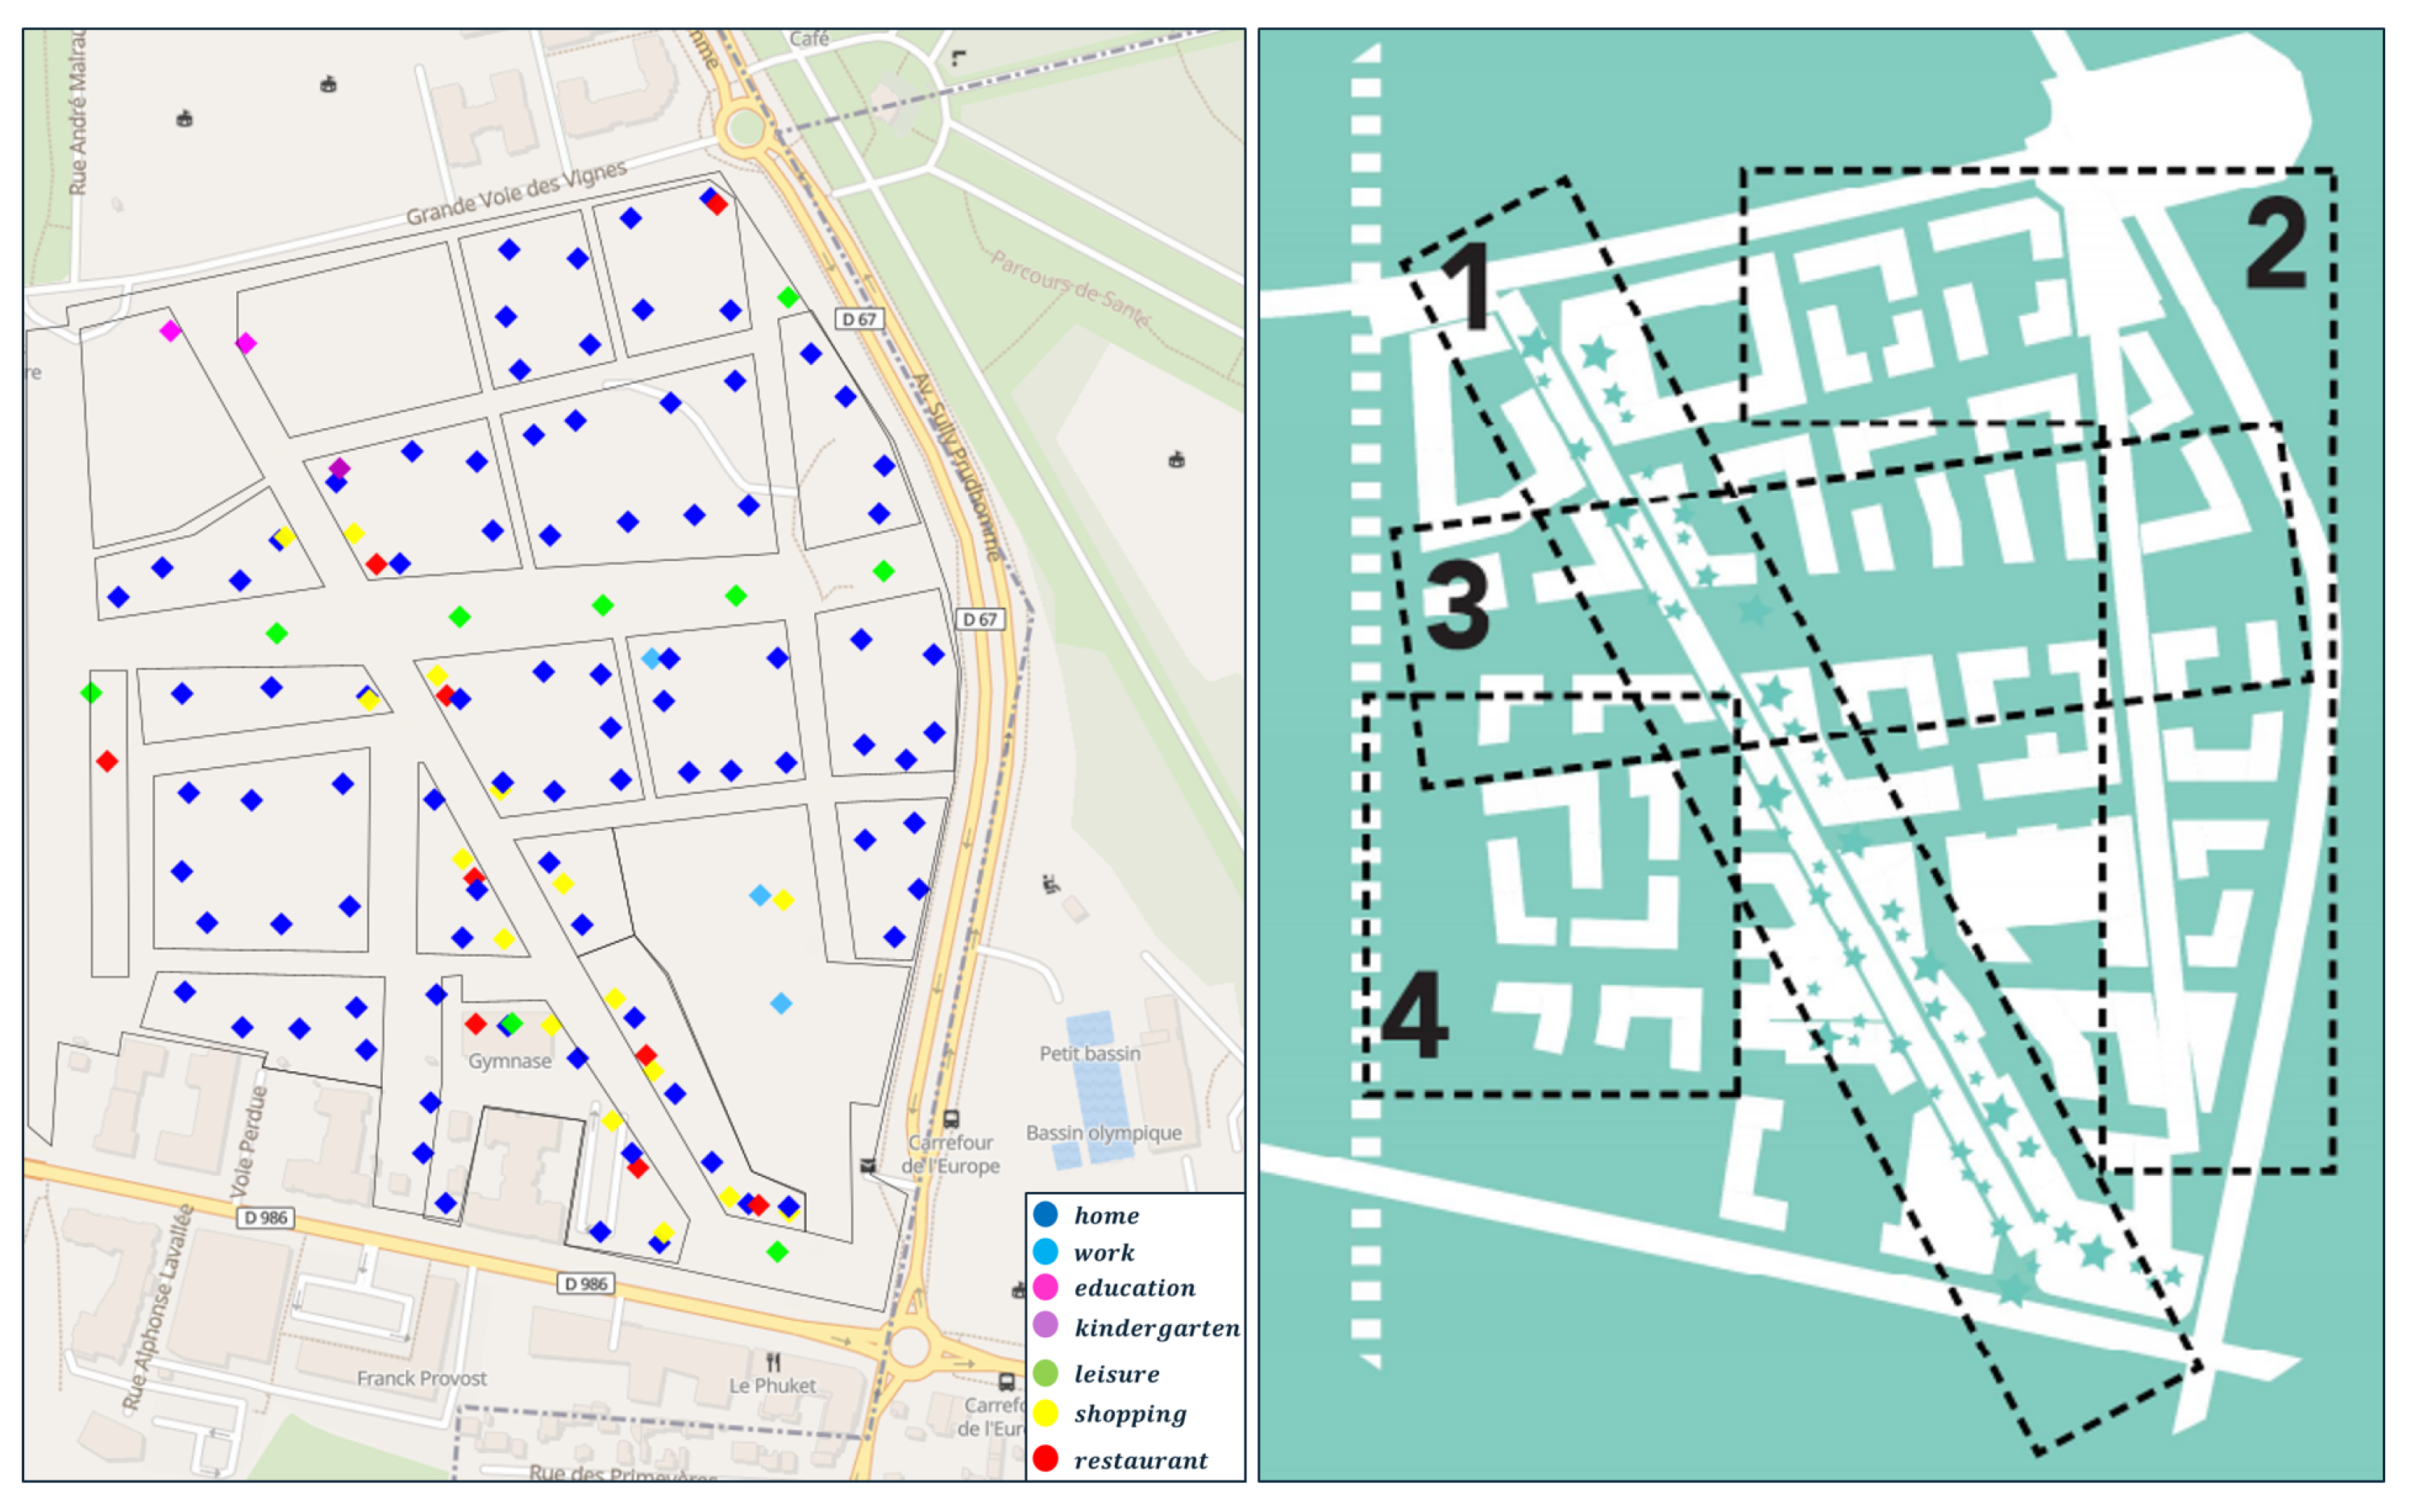
The urbanistic potential of an urban zone is the second attractiveness potential, based on the architectural ambiances expected by the real estate developer Eiffage. The LaVallée district is divided into four urban zones: Cours du Commerce (mall street), Parc de Sceaux (living in the park), Promenade Plantée (pedestrian street), and Jardin (communal garden). Each zone has a specific potential value; these potentials are given in
Table 2. LaVallée’s facilities and urban zones are shown side by side in
Figure 8.
A ballpark of the distribution of secondary facilities in LaVallée is as follows: shops and restaurants are mainly located in Cours du Commerce, leisure facilities are distributed along Promenade Plantée, the LIDL supermarket and some leisure facilities make up the Parc de Sceaux zone, the Jardin zone only consists of a restaurant and leisure facilities, and the other facilities are home locations.
From the activity and zone potentials, the attractiveness of facilities can be obtained by applying Equation (
2), and according to the values of this, four groups of facilities are to be distinguished.
The first group contains only the LIDL supermarket, with its highest attractiveness value. The facilities in the second group are mainly situated at the intersection of Cours du Commerce and Promenade Plantée; those facilities have a high zonal potential value. The facilities in the third group are located south of Cours du Commerce; this part of the district is characterized by numerous facilities, which implies short travel distances between facilities. The facilities in the fourth group are mostly located in the less dense zones of the facilities, for instance, Jardin and Parc de Sceaux.
The attractiveness of the different facilities of LaVallée, computed from Equation (
2), is given in
Figure 9.
5.1.3. LaVallée Secondary Plans’ Instances
In order to generate the secondary plan instances, a specific approach will be applied, consisting of the first two stages of the proposed location-choice process: generation and assessment.
First, the set of all possible combinations composed of leisure, shopping, and restaurant is generated, and then transformed into home-based tours, adding the home activity as the first and last activity. Next, the generated tours are instantiated according to all facilities of each activity at LaVallée (see
Table 1). In sum, we count 15 activity-sequence combinations for 29,565 instances in LaVallée.
After generating the set of instances, the assessment stage can then be applied. For each instance, benefit, travel time, and scores can be calculated.
5.2. Catchment Area: Activity Plans
In this section, we discuss the generation of activity plans for the entire population within the catchment area.
First, activity plans are devised for LaVallée residents, employees, and students. Subsequently, for individuals residing outside LaVallée, their activity plans mirror those generated in the reference situation. Finally, for individuals engaged in secondary activities, their plans are modified to include an alternative plan with the same sequence of activities, but conducted within LaVallée.
5.2.1. LaVallée: Residents’ Plans
Generating plans for LaVallée residents involves creating primary and secondary plans separately and subsequently applying the matching process as defined in
Section 4.2 between the two sets generated.
In the primary plan generation process, two sets of plans are created: home-to-work and home-to-education.
Using available data on LaVallée residents, we estimate that there are approximately 3000 worker-residents, assuming that these individuals work outside the catchment area. To estimate their workplaces, we extract a work destination distribution, referred to as “work-borders”, from simulation results in the reference situation. This distribution is depicted in
Figure 10.
A resident’s home-to-work plan is generated as a home-based tour, with work as the sole activity. The workplace is determined based on the “work-borders” distribution. Among these resident-workers, 100 agents are selected to perform kindergarten activities, which are positioned between the home and work activities. This corresponds to the capacity of the “Crèche”.
Similar to the primary plan for work, a resident’s home-to-education plan is generated as a home tour. Depending on the educational institution, three groups of plans are distinguished: home-to-Groupe Scolaire, home-to-Collège, and home-to-Lycée. The first two sets of plans occur within LaVallée, while those associated with the Lycée take place outside LaVallée but remain within the catchment area.
In the second part of the generation process, the residents’ secondary plans will be generated.
Initially, activity chains consisting solely of secondary activities are created for all LaVallée residents using the generator developed in [
26]. In total, 2165 secondary plans were generated, representing approximately 41% of LaVallée’s total population. These plans include leisure and shopping activities in roughly 90% of cases, distributed as follows: half are home-to-leisure tours, around one-third are home-to-shopping plans, and about 9% encompass both activities. Additionally, restaurant activities are part of 11% of the generated plans. The distribution of secondary activity chains for LaVallée residents is outlined in
Table 3.
Second, based on the information available regarding the distribution of inhabitants in LaVallée, as illustrated in
Figure 7, a home location is assigned to each resident and, consequently, to each generated activity chain.
Third, the selection stage of the location-choice process outlined in
Section 4.1.3 is applied to each agent.
After generating the primary plans and instantiating the secondary plans, the subsequent step involves applying the matching process. This process takes both sets of plans as input.
Regarding the matching conditions C, we assume that only adult agents will participate in a secondary plan. Currently, we lack information on the age of the residents. To address this issue, we assume that agents engaging in educational activities at the Groupe Scolaire or Collège are very young and will not have a secondary plan or be subject to the matching process.
The second parameter is the matching rate, which strongly depends on an agent’s participation in a secondary activity. We assume that equals the agent’s probability of engaging in leisure, shopping, or restaurant activities. According to the reference situation scenario, the rate of participation in a secondary activity is set to .
After applying the matching process to all primary plans, it is possible that a set of plans remains unmatched.
To incorporate these unmatched plans into the final set of plans, an integration procedure can be used. For each unmatched plan, an available home location is randomly selected while respecting the home-capacity constraint. The unmatched plan is then updated and integrated into F.
5.2.2. LaVallée Office and Schools: Plans for Workers and Students
The second category of agents in LaVallée, referred to as externals, can be further divided into two subgroups: employees and students. The majority of employees work primarily at the “LIDL headquarters”, with fewer employed at the “LIDL supermarket” and “co-working space”. Conversely, students are represented by pupils attending the “Groupe Scolaire” and “Collège”.
We assume that employees live outside the catchment area, while students are considered to reside in proximity to LaVallée. Primary plans for external workers and students are generated in a manner similar to the approach detailed in
Section 5.2.1.
Depending on the type of agent, two distinct location-choice approaches are implemented.
For pupils, the home choice is determined through a distance-based approach, subject to specific constraints. For example, home location selection is restricted to places situated within a radius of 1.5 kilometers from LaVallée. Conversely, for employees, due to a lack of information regarding their origins, the home-choice process as developed in [
26] cannot be accurately applied.
To address this limitation, we assume that the origins of external employees follow a distribution similar to that of the destinations of employees within the catchment area. Consequently, the “work-borders” distribution, as presented in
Figure 10, is utilized as an alternative.
5.2.3. LaVallée’s Impact on the Catchment Area: Potential Visitors
After generating activity plans for LaVallée residents, employees, and students, the next step involves creating activity plans for agents residing in the catchment area but outside of LaVallée. These plans mirror the same set of plans generated in the reference situation.
Special attention is directed towards potential visitors, who are agents with secondary activities. We propose modifying their plans by introducing one or more new plans that include secondary activities to be carried out within LaVallée. Consequently, the location-choice process developed in [
26] must first be adapted and then applied to each potential visitor.
In the following, the adjusted location-choice process is illustrated. First, a potential visitor a is randomly selected from the set of agents A; its sequence of activities is composed of two home-based tours:
- 1.
.
- 2.
.
is a home-to-work tour, while
consists of a leisure and a shopping activity. From this last tour, three sequences of activities can be derived and subsequently carried out in LaVallée. An agent’s activity plan, its two home-based tours, and its sequences of activities
derived from
are shown in
Figure 11.
Subsequently, the adjusted location-choice process is applied to all sequences , with an illustration of a sequence, such as , detailed as follows:
Initially, the selection constraints
C are solely defined by their activity sequence constraints
. Since a potential visitor does not reside in LaVallée, the home constraint
is no longer necessary, as it will not correspond to any instance of
I generated earlier (see
Section 5.1.3).
Hence, the constraint is applied to I, selecting all instances with a shopping activity. Given that the home location no longer influences the selection process, only instances with distinct shopping locations are retained.
Moreover, in the selection process, a potential visitor is only interested in a place of activity with high attractiveness. Therefore, the first score measure
expressed in Equation (
3) is chosen as the assessment function.
For instance, the filter parameter
k will have the same value as in the previous illustration (
). The selected instances and the selection rates are detailed in
Table 4.
Finally, a single instance () is selected based on weight rates R. For example, the first instance is chosen, and thus, its shopping facility is extracted. The same process applies to and .
In summary, the tour will consist of four different instances (). In addition to the original sequence , the three instances result from the application of the previous process. The combination of and will generate a set of visitor plan instances. During the travel simulation, the plan with the best score is the one selected by the agent: some will retain their secondary activities outside of LaVallée, while others will change their location and conduct their shopping or leisure within LaVallée.
For each potential visitor, their set of plans will first be updated and then included in the final set of F, where a simulation in a projection situation will be performed. The simulation results, along with the impacts of potential visitors on LaVallée and the catchment area, will be detailed in the next section.
5.3. Validation of the Method
To validate the forecast planning of activities of a projection scenario, we compare it with the reference situation in the catchment area. A more thorough validation method would need to assess the visitation of all amenities of the new district after occupancy: once it is built and frequented. But even once the real estate project is finished, only small data would be publicly available, and they would be based on aggregate travel surveys. Indeed, no call data record (CDR) would be available freely and at this level of spatial scale: indeed, the CDR data proposed by private operators indicate that one cell corresponds to the level of the whole catchment area. Therefore, we based our validation on aggregated travel surveys currently available and make the assumption that the population habits will not vary significantly in this area.
The criteria for validation is the same as those used by Horl et al. [
18]: their synthesis process assigns secondary locations to the activity chains. They show (
Figure 9 in [
18]) the resulting distance distributions for the car and walking modes from, to, and between secondary activities of up to 20 km and 1 km, respectively. They used cumulative distance distribution because they have access to it in the detailed national household travel survey that they had access to. We do not have access to such fine-grained data, but we had access to the last publicly available data at the scale of the department. The travel census EGT 2010 (Enquête Globale Transport 2010 [
29]) gathers aggregated information on the travel of the residents of the department of Hauts-de-Seine in the western suburb of the city of Paris, France. The census does not provide detailed data on the activity planning of the residents; therefore, it was not possible for us to display cumulative distance distribution, but it provides an estimation of the mean traveled distance per trip by private vehicle (5 km), walking (500 m), and cycling (2 km) according to the census. These mean distances are shown in black in
Figure 12. As in [
18], we compared these mean distances with secondary activities’ range per trip for Leisure and Shopping, respectively, in blue and red in
Figure 12. Private vehicle and cycling mode of transportation are correctly modeled especially in the case of Leisure activity. There is more error for the walking trips, but it was also the case in the study presented by Horl et al. [
18] for this transportation mode.
6. Impacts of a Future District on Its Catchment Area
6.1. Introduction
The purpose of this study is to provide an overview of the potential impacts of the LaVallée district on its surrounding catchment area in this projection scenario.
To evaluate these impacts comprehensively, we implicitly consider the influx of external visitors. These external flows are estimated based on realistic pre-project movements within LaVallée’s sphere of influence.
Potential visits refer to specific needs that currently occur outside the neighborhood but could become more convenient if realized within LaVallée once the real estate developments are completed. Furthermore, this study is formalized with the intention of addressing the following questions:
Where would the visitors originate in terms of their home locations?
What would be the distribution of travel modes for trips to LaVallée?
How far would visitors travel in terms of distance and travel time?
The two objectives of this analysis are (1) to examine the visitor profile concerning accessibility to LaVallée and (2) to estimate a range of travel-related metrics.
6.2. Key Performance Indicators with the Future District
6.2.1. Proportion of Visitors from the Catchment Area
In this part of the study, we focus on agents who have leisure and shopping activities in their daily plans and offer them an alternative location within the new district for these specific activities. We identify the factors that influence their decision to change location, favoring a visit to the new district.
This stage of the assessment approach is relatively straightforward and involves several steps. First, we assign a travel mode to each trip representing a visit to LaVallée. Then, we analyze the impacts of two relevant planning strategies on the proportion of visitors.
Based on the simulation results in the reference situation, we filter out agents conducting secondary activities. Notably, potential visitors make up approximately 44% of the total number of agents for shopping activities (56,009 people) and an even higher percentage for leisure activities, with 60,084 agents representing 48% of the total population.
We estimate that 4% of potential visitors would prefer to carry out a secondary activity in LaVallée to create a more favorable daily activity plan. After running the travel simulations, we compile a final list of agents performing activities in LaVallée. The final set of agents performing an activity in LaVallée is reported in
Table 5, distinguishing between residents and external visitors. The results reveal that more than two-thirds of the agents engaging in secondary activities in LaVallée are external visitors, constituting 68% of the total number of agents participating in leisure activities and 72% of those engaged in shopping activities. Moreover, these visitors represent approximately 4.4% and more than 5% of the total number of potential visitors, respectively, for shopping and leisure activities. A summary of these results is presented in
Table 5 and
Table 6.
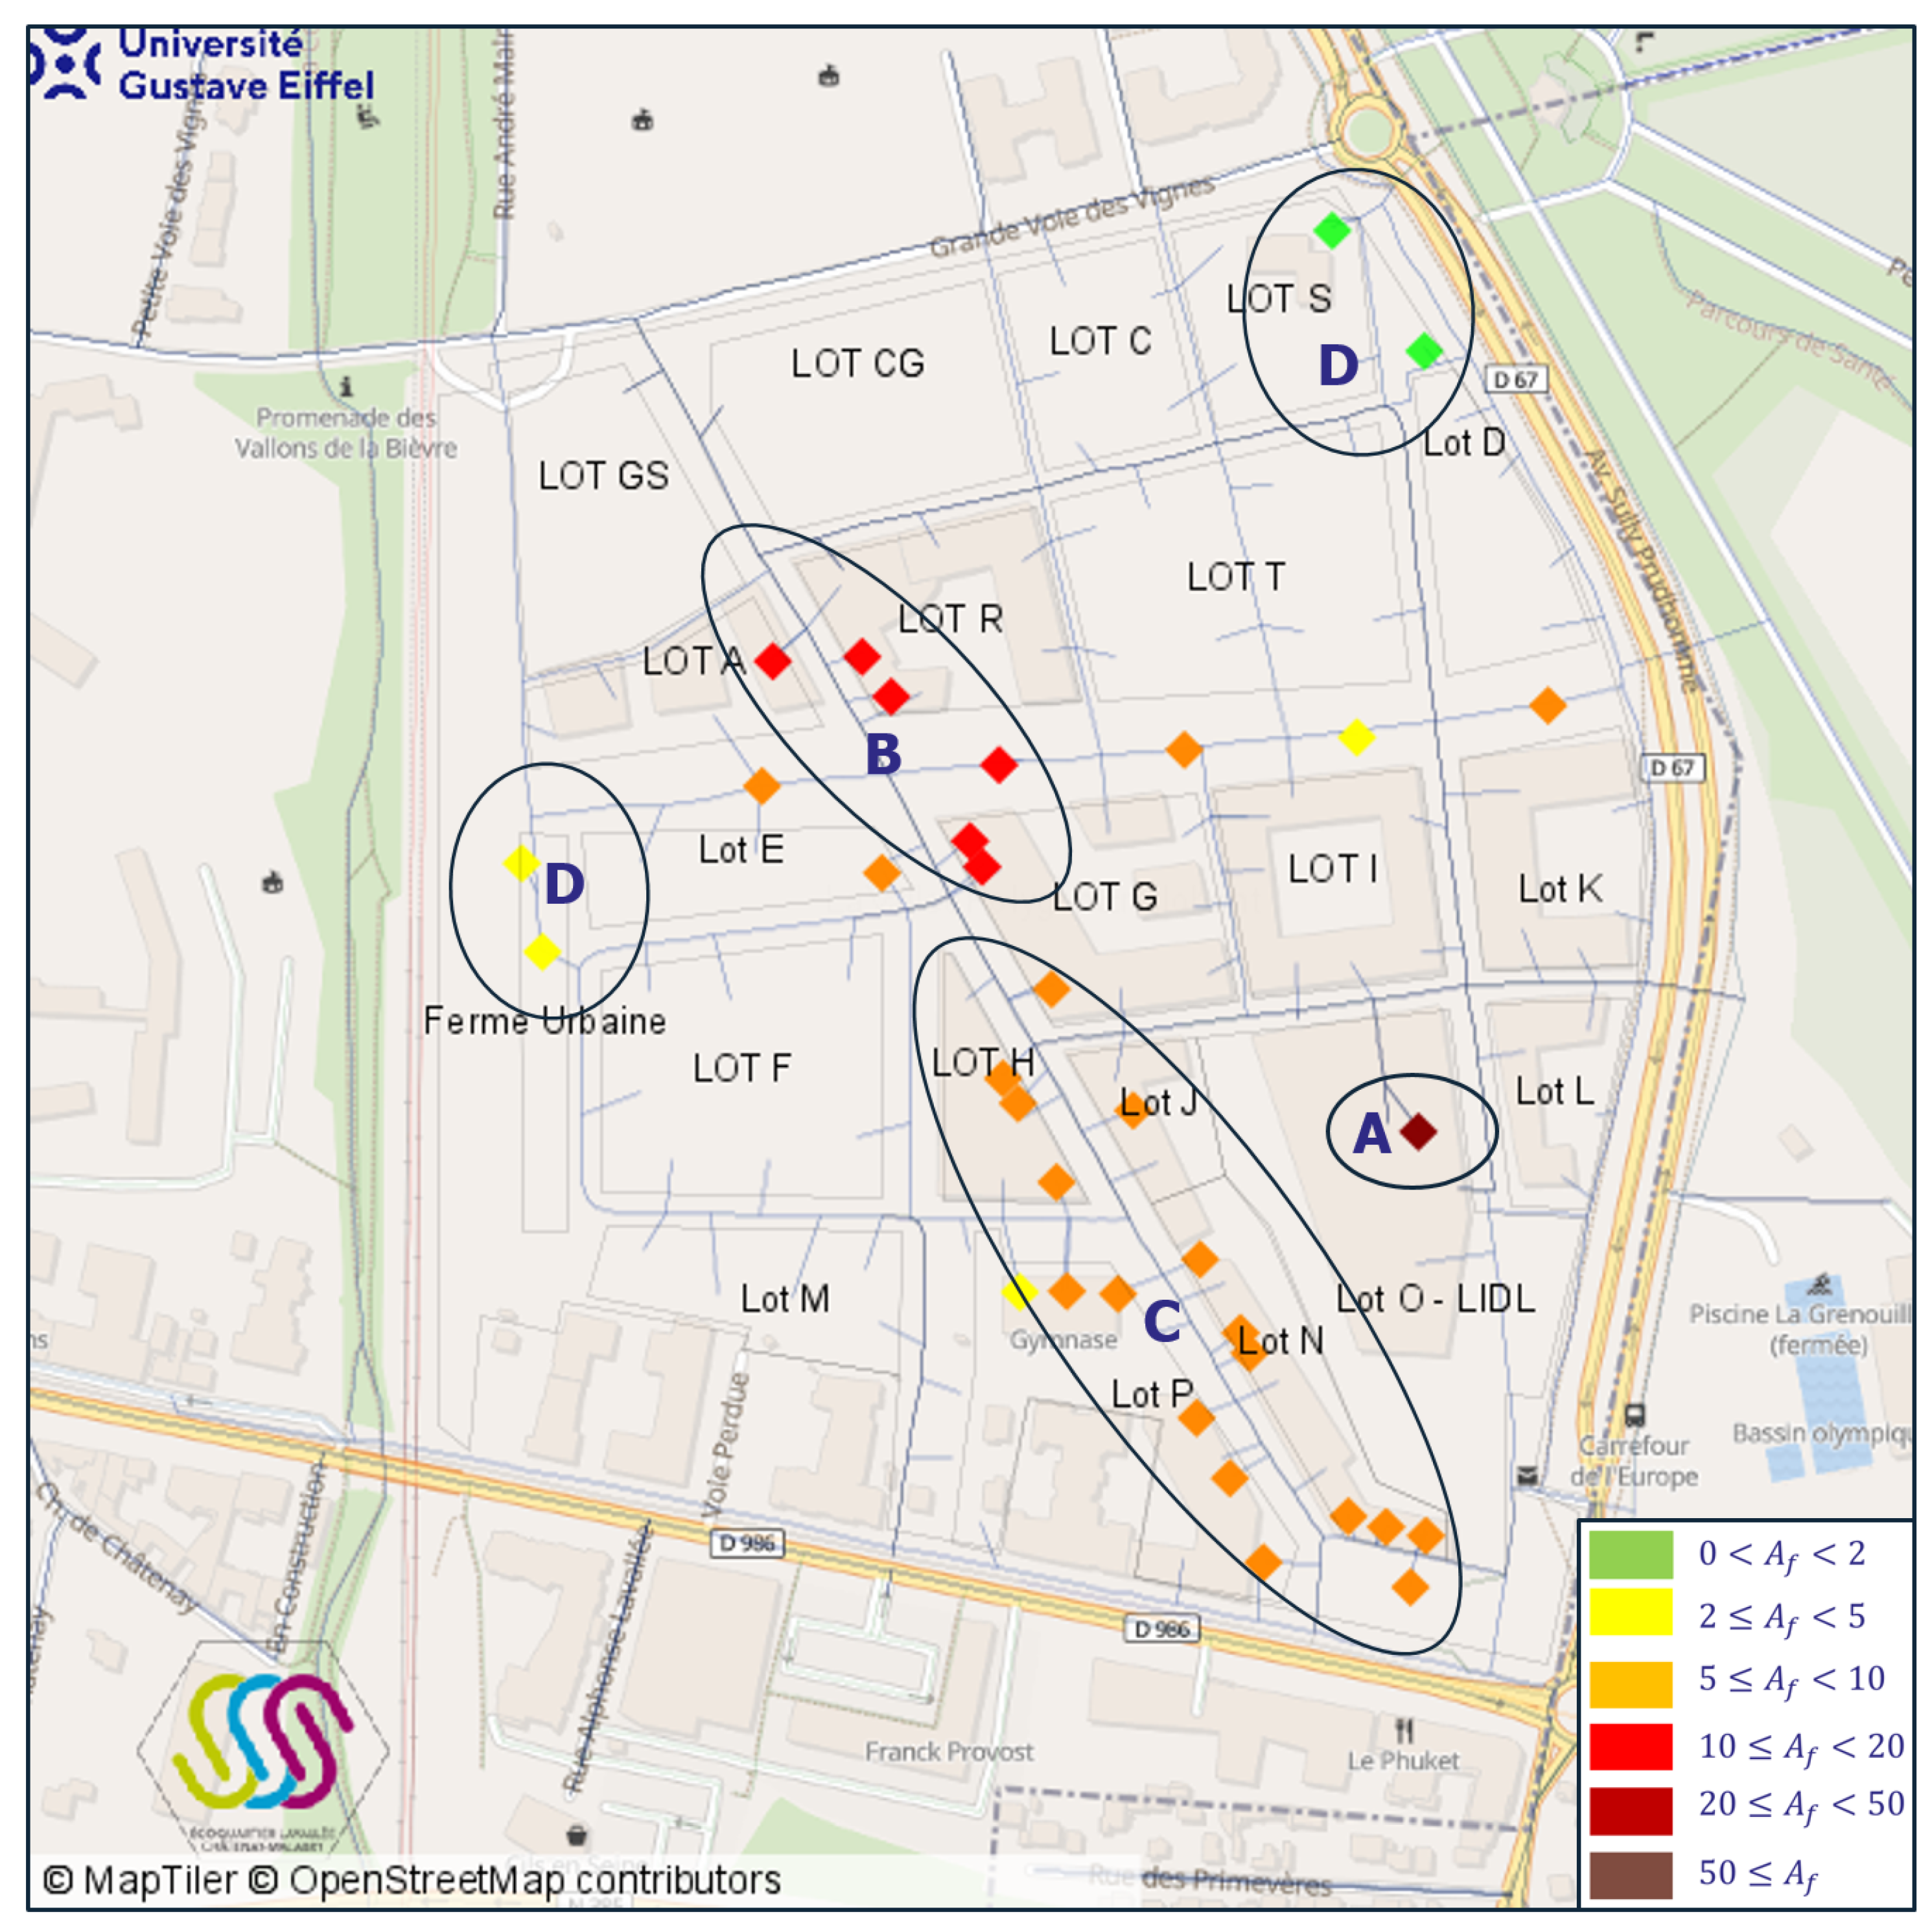
6.2.2. Future Accessibility of LaVallée
In this section, our primary focus is on addressing the first challenging question: “Where do the visitors to LaVallée originate?” To tackle this question, we estimate the accessibility of visitors to LaVallée. This measurement provides crucial insights for our analysis by enabling us to understand the origins of visits to LaVallée. Additionally, we separately estimate the proportion of visitors relative to their home-to-LaVallée Euclidean distance for leisure and shopping activities. The spatial distribution of these activities is visually represented in
Figure 13.
Figure 14 illustrates the distribution of visitors based on their place of residence, categorized by IRIS zones, with a particular focus on areas in close proximity to LaVallée.
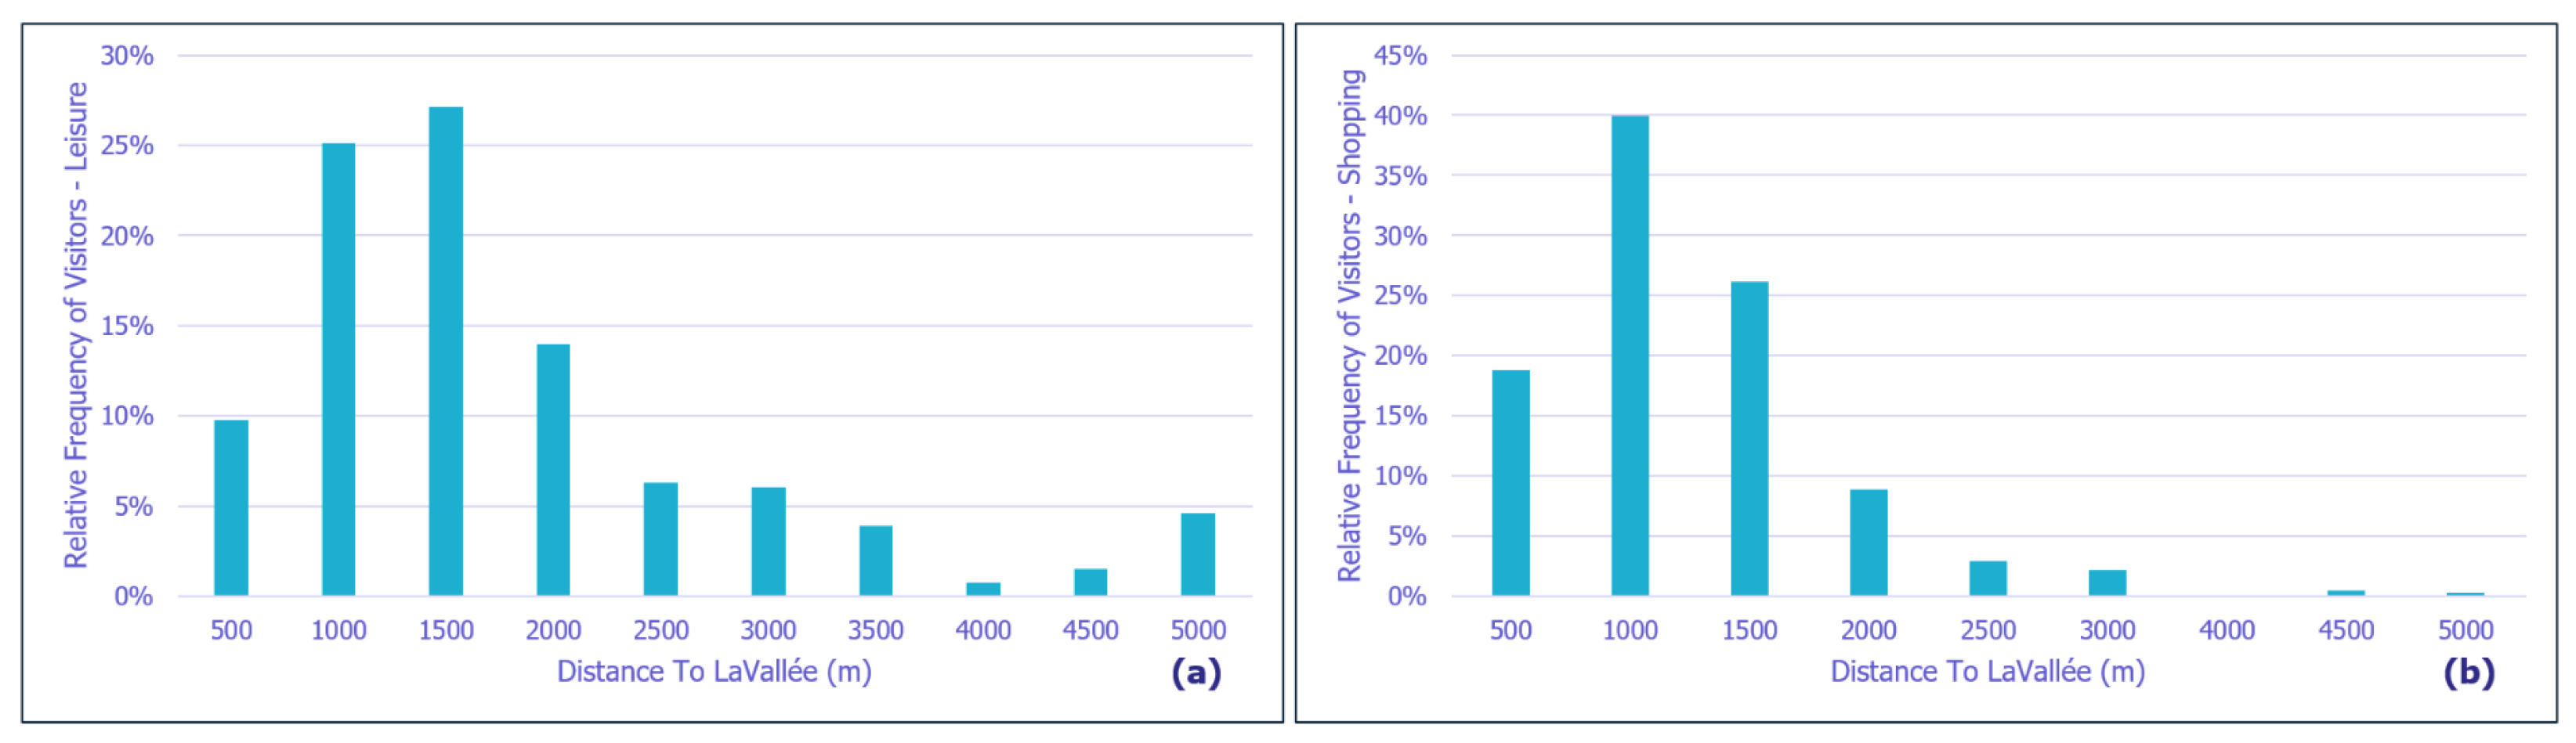
Figure 15 displays the relative and cumulative frequency of external visitors in relation to the home-to-LaVallée distance for both leisure and shopping activities.
The results presented reveal that, for leisure activities, 35% of visitors reside within a 1-kilometer radius of LaVallée, 41% live in an area ranging from 1 to 2 kilometers, and only 24% live more than 2 kilometers away. Conversely, for shopping activities, 85% of visitors live within a 1.5-kilometer radius, with 59% residing within a 1.5-kilometer area, while only 15% live beyond this distance.
In terms of the relative frequency of visitors based on Euclidean distance to LaVallée (refer to
Figure 15), it becomes evident that most visitors’ residences are situated within a 2-kilometer radius. As one would expect, the decision to engage in activities in LaVallée is significantly influenced by the distance to LaVallée itself; generally, the farther a visitor’s home is from LaVallée, the less likely they are to visit.
An explanation for these findings is primarily associated with secondary facilities and their spatial distribution.
As
Figure 13 illustrates, leisure facilities are dispersed across the catchment area, primarily consisting of large public parks such as “Parc de Sceaux” near LaVallée, “Parc Vallée aux Loups” approximately 2.5 km from LaVallée, and “Parc départemental Henri-Sellier” located 3.5 km from LaVallée. Except for “Parc de Sceaux”, all other leisure destinations are situated at least 2 km away from the district. The spatial distribution of these large parks may explain the significant proportion of leisure visitors (38%) residing more than 1.5 km from LaVallée.
In contrast, shopping facilities are abundant, encompassing both small and large areas, and they are well distributed across the study area, often grouped in clusters. For instance, considering the same home-to-LaVallée distance (more than 1.5 km), only 15% of visitors opt to visit LaVallée for shopping. This lower number of shopping visitors can be attributed to the fact that LaVallée is relatively distant from their residences compared with their original shopping facilities.
In conclusion, we can ascertain that the proportion of external visitors engaging in secondary activities in LaVallée is significantly influenced by two key factors: the number of available facilities and their spatial distribution within the catchment area.
6.2.3. Future Travel Modes by Activity
In this analysis, our focus centers on addressing the next important question: “Which mode of transportation will visitors choose to get to LaVallée?” To answer this question, we calculate the modal share for both leisure and shopping activities.
Table 7 and
Table 8 present the modal share percentages for leisure and shopping trips, respectively.
From
Table 7, it is evident that more than 60% of leisure trips are taken by foot, followed by car usage at 23%. Cycling and public transport represent the least utilized modes, each accounting for only around 8% of trips.
For shopping trips (refer to
Table 8), the walking mode dominates the share with over 80%, followed by car usage at 9% and biking at 7%. A noteworthy observation is the surprisingly low usage of public transportation, which does not exceed 2% of the modal share.
Apart from the commonality of walking as the preferred mode for both leisure and shopping trips, biking also occupies a similar share for both travel purposes. However, there is a substantial disparity in the use of the car mode between leisure and shopping trips. Among the various travel modes, public transportation covers the fewest trips.
These results can be explained by the nature of the location-choice approach for secondary activities, which primarily relies on distance-based considerations. Furthermore, it is worth noting that approximately 84% of visitors live within a 2-kilometer radius of LaVallée. Consequently, these short-distance trips tend to favor micromobility options, especially walking and, to a lesser extent, cycling [
30].
Conversely, longer trips are notably less frequent. As indicated in
Figure 15, these extended journeys are less common for leisure compared with shopping. This difference may explain why cars are used less frequently for shopping compared with leisure.
It is important to highlight that trips taken via public transport have the lowest frequency. This reduced modal share can be attributed to the inherent nature of the mode choice process, which is predominantly distance-based. Consequently, public transport trips tend to cover greater distances compared with walking or cycling trips.
Additionally, the implementation of the LaVallée plan introduces alterations to transit routes and subsequently affects travel times. Changes in travel time and distance directly impact the plan’s overall score and, consequently, the traveler’s decision-making process. For instance, opting for a longer route to conduct an activity in LaVallée can reduce the score of the plan and, subsequently, lead to the decision not to undertake the activity in LaVallée. Furthermore, it is worth noting that leisure trips are typically shorter than shopping trips, which may contribute to the disparities observed in the modal share between the two types of trips.
6.2.4. Future Travel Time and Travel Distance by Mode
Having estimated the accessibility of LaVallée and having determined the modal share for the two secondary activities, we now turn our attention to the next challenging question: “How far do visitors travel in terms of both travel distance and travel time?”
To address this question effectively, we need to explicitly consider specific travel metrics. These include measures such as average travel time and average travel distance categorized by mode of transport. Consequently, we apply these selected measures separately to leisure and shopping trips, with the aim of highlighting the differences in metric values between these two types of activities.
The first measure we consider is the average travel distance. As depicted in
Figure 16, car trips stand out as the longest, covering an average of 4.5 km for leisure and just over 3 km for shopping. For the other modes of transport, no significant differences are observed between the two types of activities. External visitors typically travel around 3 km by public transit to reach LaVallée, less than 1 km by foot, and approximately 1.5 km by bicycle.
The second metric we examine is the average travel time. We observe a pattern similar to the first metric regarding differences between leisure and shopping trips for all modes. The average trip durations by mode are as follows: 22 min by public transportation, approximately 14 min by foot, and less than 5 min by bicycle. In contrast, car trips for leisure purposes take 30% longer than those for shopping, with 12 min for leisure and 8 min for shopping.
In summary, it becomes apparent that leisure trips tend to be relatively longer than shopping trips. The differences are moderate, with a 10% variation for active modes and an even greater 30% difference for car trips.
Furthermore, an intriguing observation pertains to the metric values for trips taken by public transport. While leisure trips are slightly longer than shopping trips in terms of distance, the average travel time is nearly identical. This phenomenon may be explained by the variations in travel times and speeds between different types of public transit vehicles. For instance, buses and trams are the two primary modes of public transport used for trips to LaVallée.
7. Conclusions
In this paper, we address the challenge of generating activity plans for agents in a hypothetical projection scenario, with only limited data available about a future district and its inhabitants. To overcome this lack of information, we propose a method to answer two key questions: How can we create activity plans for future neighborhood agents? What approach should be adopted to assign locations for secondary activities at the neighborhood level? Our methodology has a dual objective: first, to adapt the generator developed in [
26] to incorporate the available data and, second, to extend the location-choice approach beyond district-scale distance-based decisions by integrating the attractiveness of facilities.
As an application of our method, we investigate the future impacts of the LaVallée district on the surrounding population. To accomplish this main objective, we establish and execute a simulation scenario in the projection situation using a multi-agent-based simulation model called MATSim.
Overall, this article is a detailed application of MATSim to a planned new occupation: the method proposed enabled us to construct the daily activity planning of people in a future real estate still under development. It reads like a very specific empirical exercise that can be generalized, reproduced, and learned by the community. It takes into account people residing the future premises, the current inhabitants of a 15 min catchment area including five cities around the district, and future workers originating from outside this area of influence. We argue that the model is still reliable if one considers the only data available for comparisons with aggregated data from a larger area composed of non-uniform urban fabrics.
One of the perspectives of improvement of the proposed method is in the definition of the values of the “urbanistic potential” of zones. In this work, we based our estimation on a discussion with expert architects of the real estate project to set these values. One way of improvement would be to implement a method of data mining on publicly available data, such as social media reviews of individuals (Airbnb, Tripadvisor, Foursquare) to automatically note a public place based on its urbanistic features. One would be able to automatically give a zone potential to a block of buildings based on the various activities its encompass.
Another perspective of this work is to measure the impact of the newly built district on the catchment area based on real observations. This would be possible in a few years, once the district is delivered and after a household travel survey is performed. Such a study would more accurately ascertain the output of the proposed methodology, especially the number of daily visitors of the district coming from outside of it.
Decision makers need tools that enable them to accurately forecast the near- and medium-term conditions of transportation supply and demand. They also need to evaluate the consequences of various policies and strategies for a more effective management of these conditions. We believe that this approach could prove invaluable to professionals who are concerned with estimating transportation flows and their distribution among different modes, especially in situations where there is no access to public travel census data or there are no means to conduct one.


