Tuning the Bivariate Meta-Gaussian Distribution Conditionally in Quantifying Precipitation Prediction Uncertainty

Abstract
:1. Introduction
2. Bivariate Meta-Gaussian Distribution
2.1. Formulation
2.2. Estimation of the Dependence Parameter
2.2.1. Pearson’s Correlation
2.2.2. Maximum Likelihood
2.2.3. Minimization of the Mallows Distance
3. A Bivariate Distribution Model for Precipitation Amounts
4. Numerical Experiments
4.1. Data
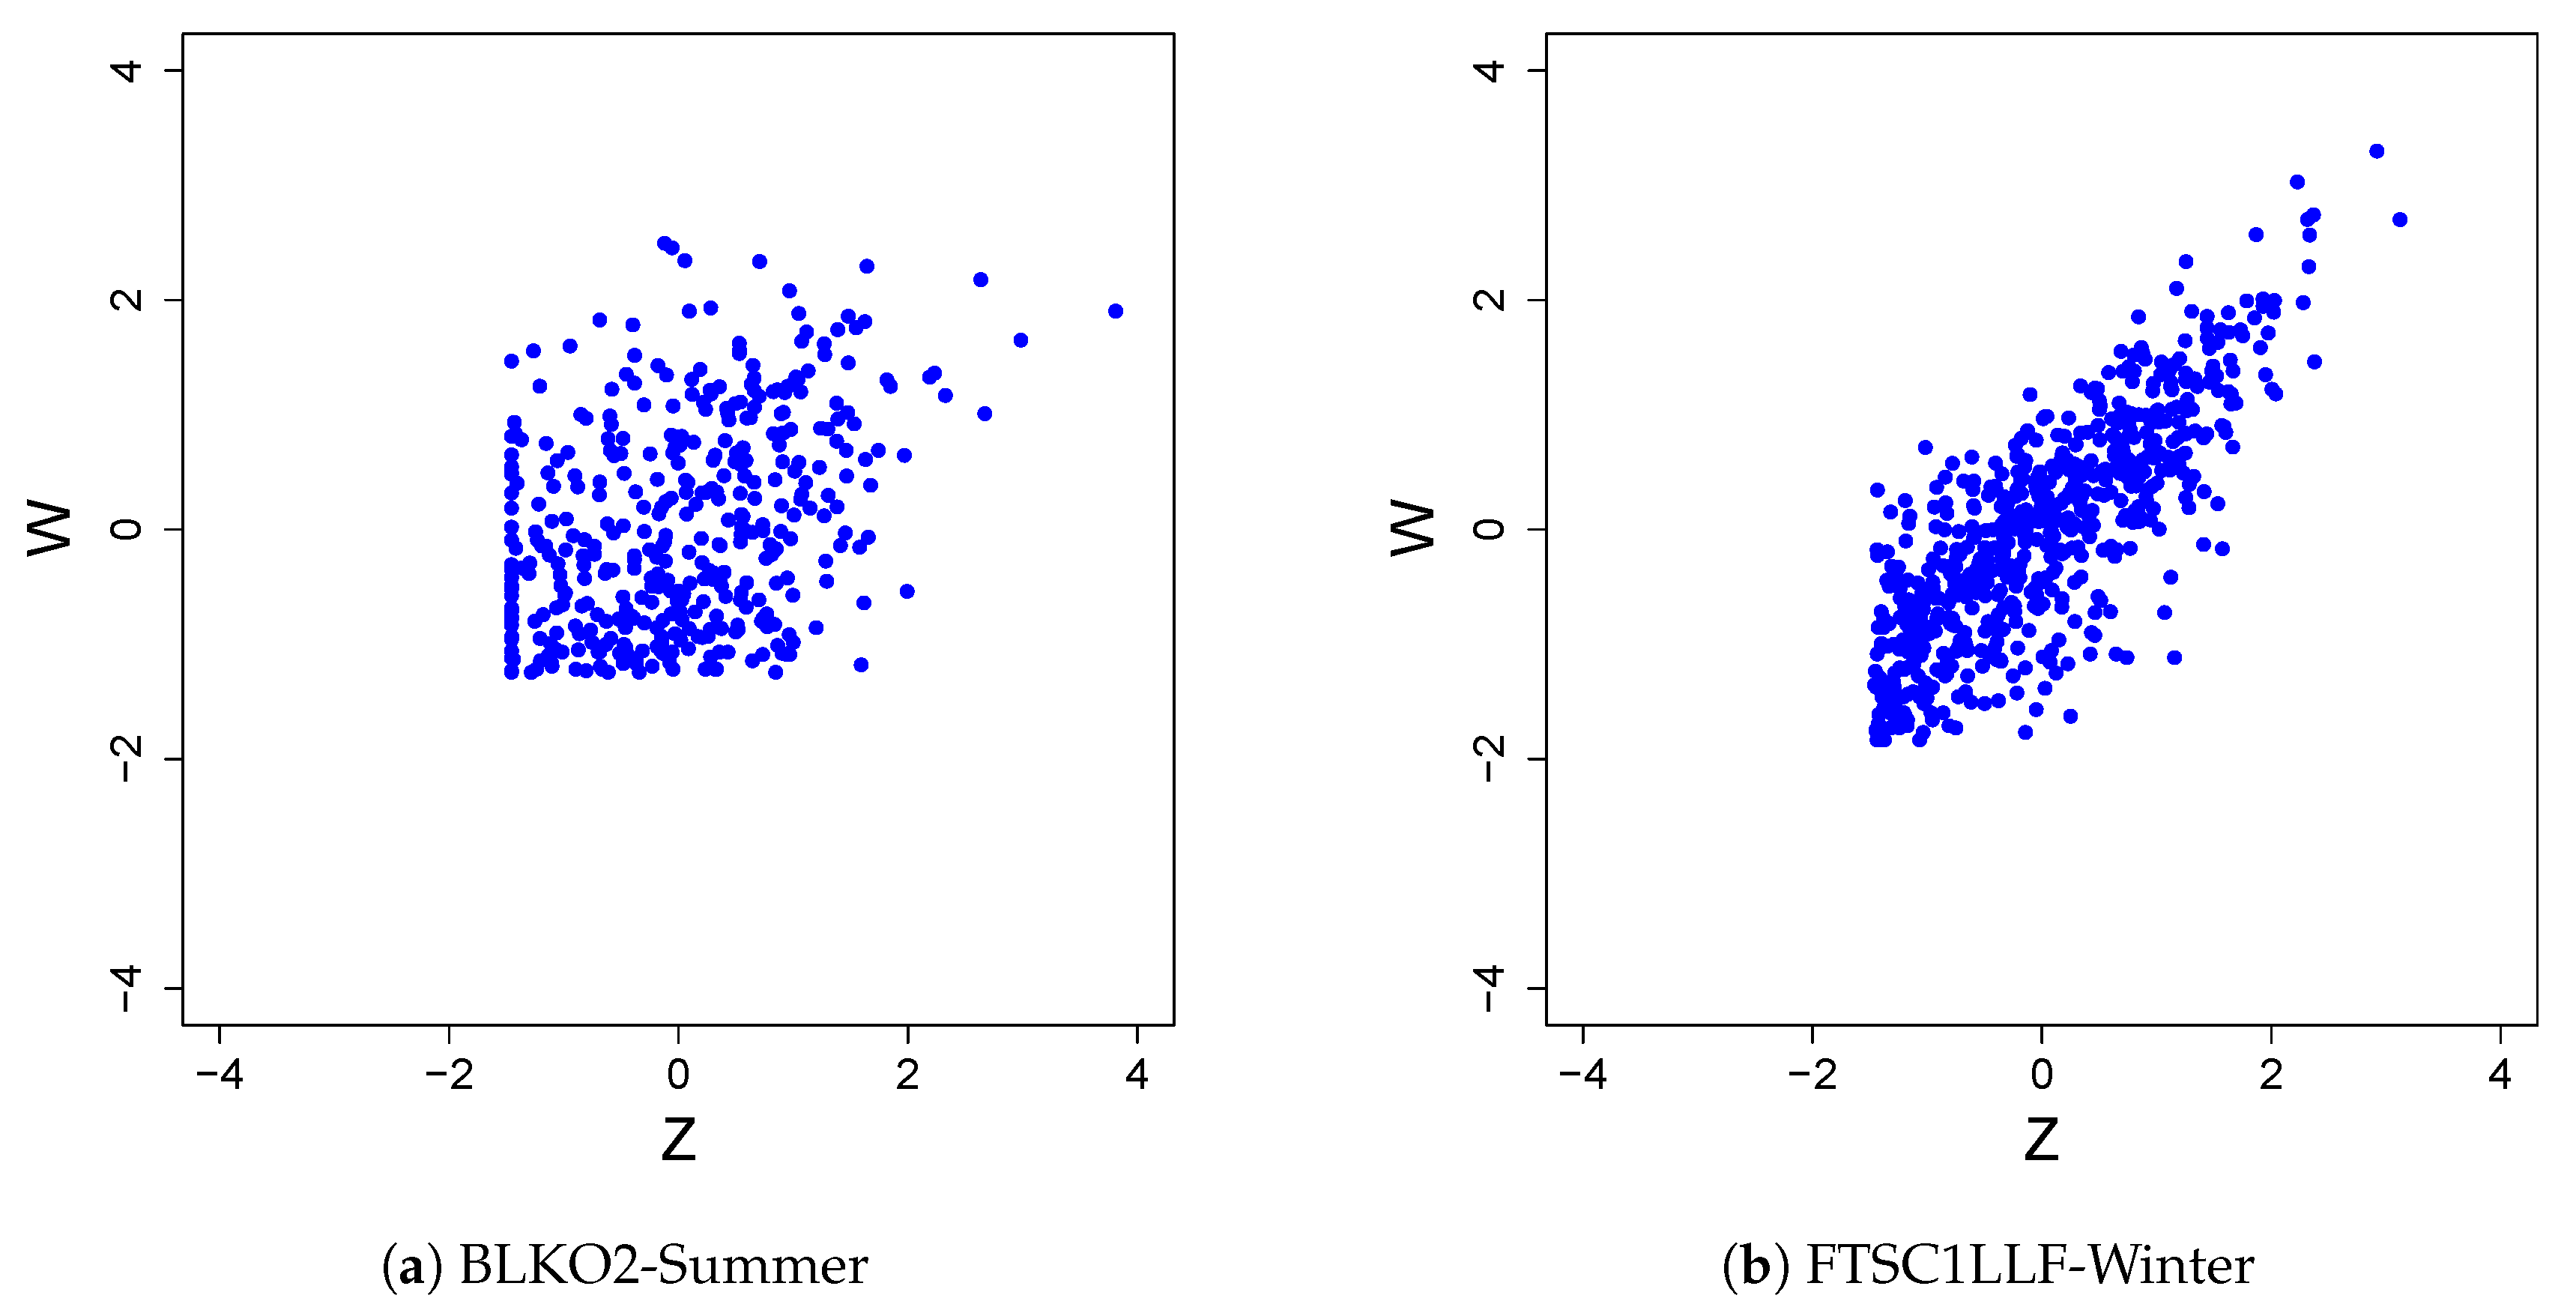
4.2. Simulation
- Package ‘lmomco’: Providing extensive functions for computation of L-moments in addition to probability weighted moments, and parameter estimation for numerous distributions.
- Package ‘emdist’: Providing tools for computing the Earth Mover’s Distance.
- Loop through a sequence of values. These values are created in increments of a certain step size.
- For a given value, loop to create simulated forecast-observation pairs.
- Draw a sample point from the forecast distribution.
- If this value is zero, generate an observation sample point from the distribution given in Equation (13). In this equation, the constant a dictates the probabilities of drawing a zero value or a non-zero value from .
- If the simulated forecast value is positive, generate an observation sample point from the distribution given in Equation (14). In this equation, the function dictates the probabilities of drawing a zero value or a non-zero value from .
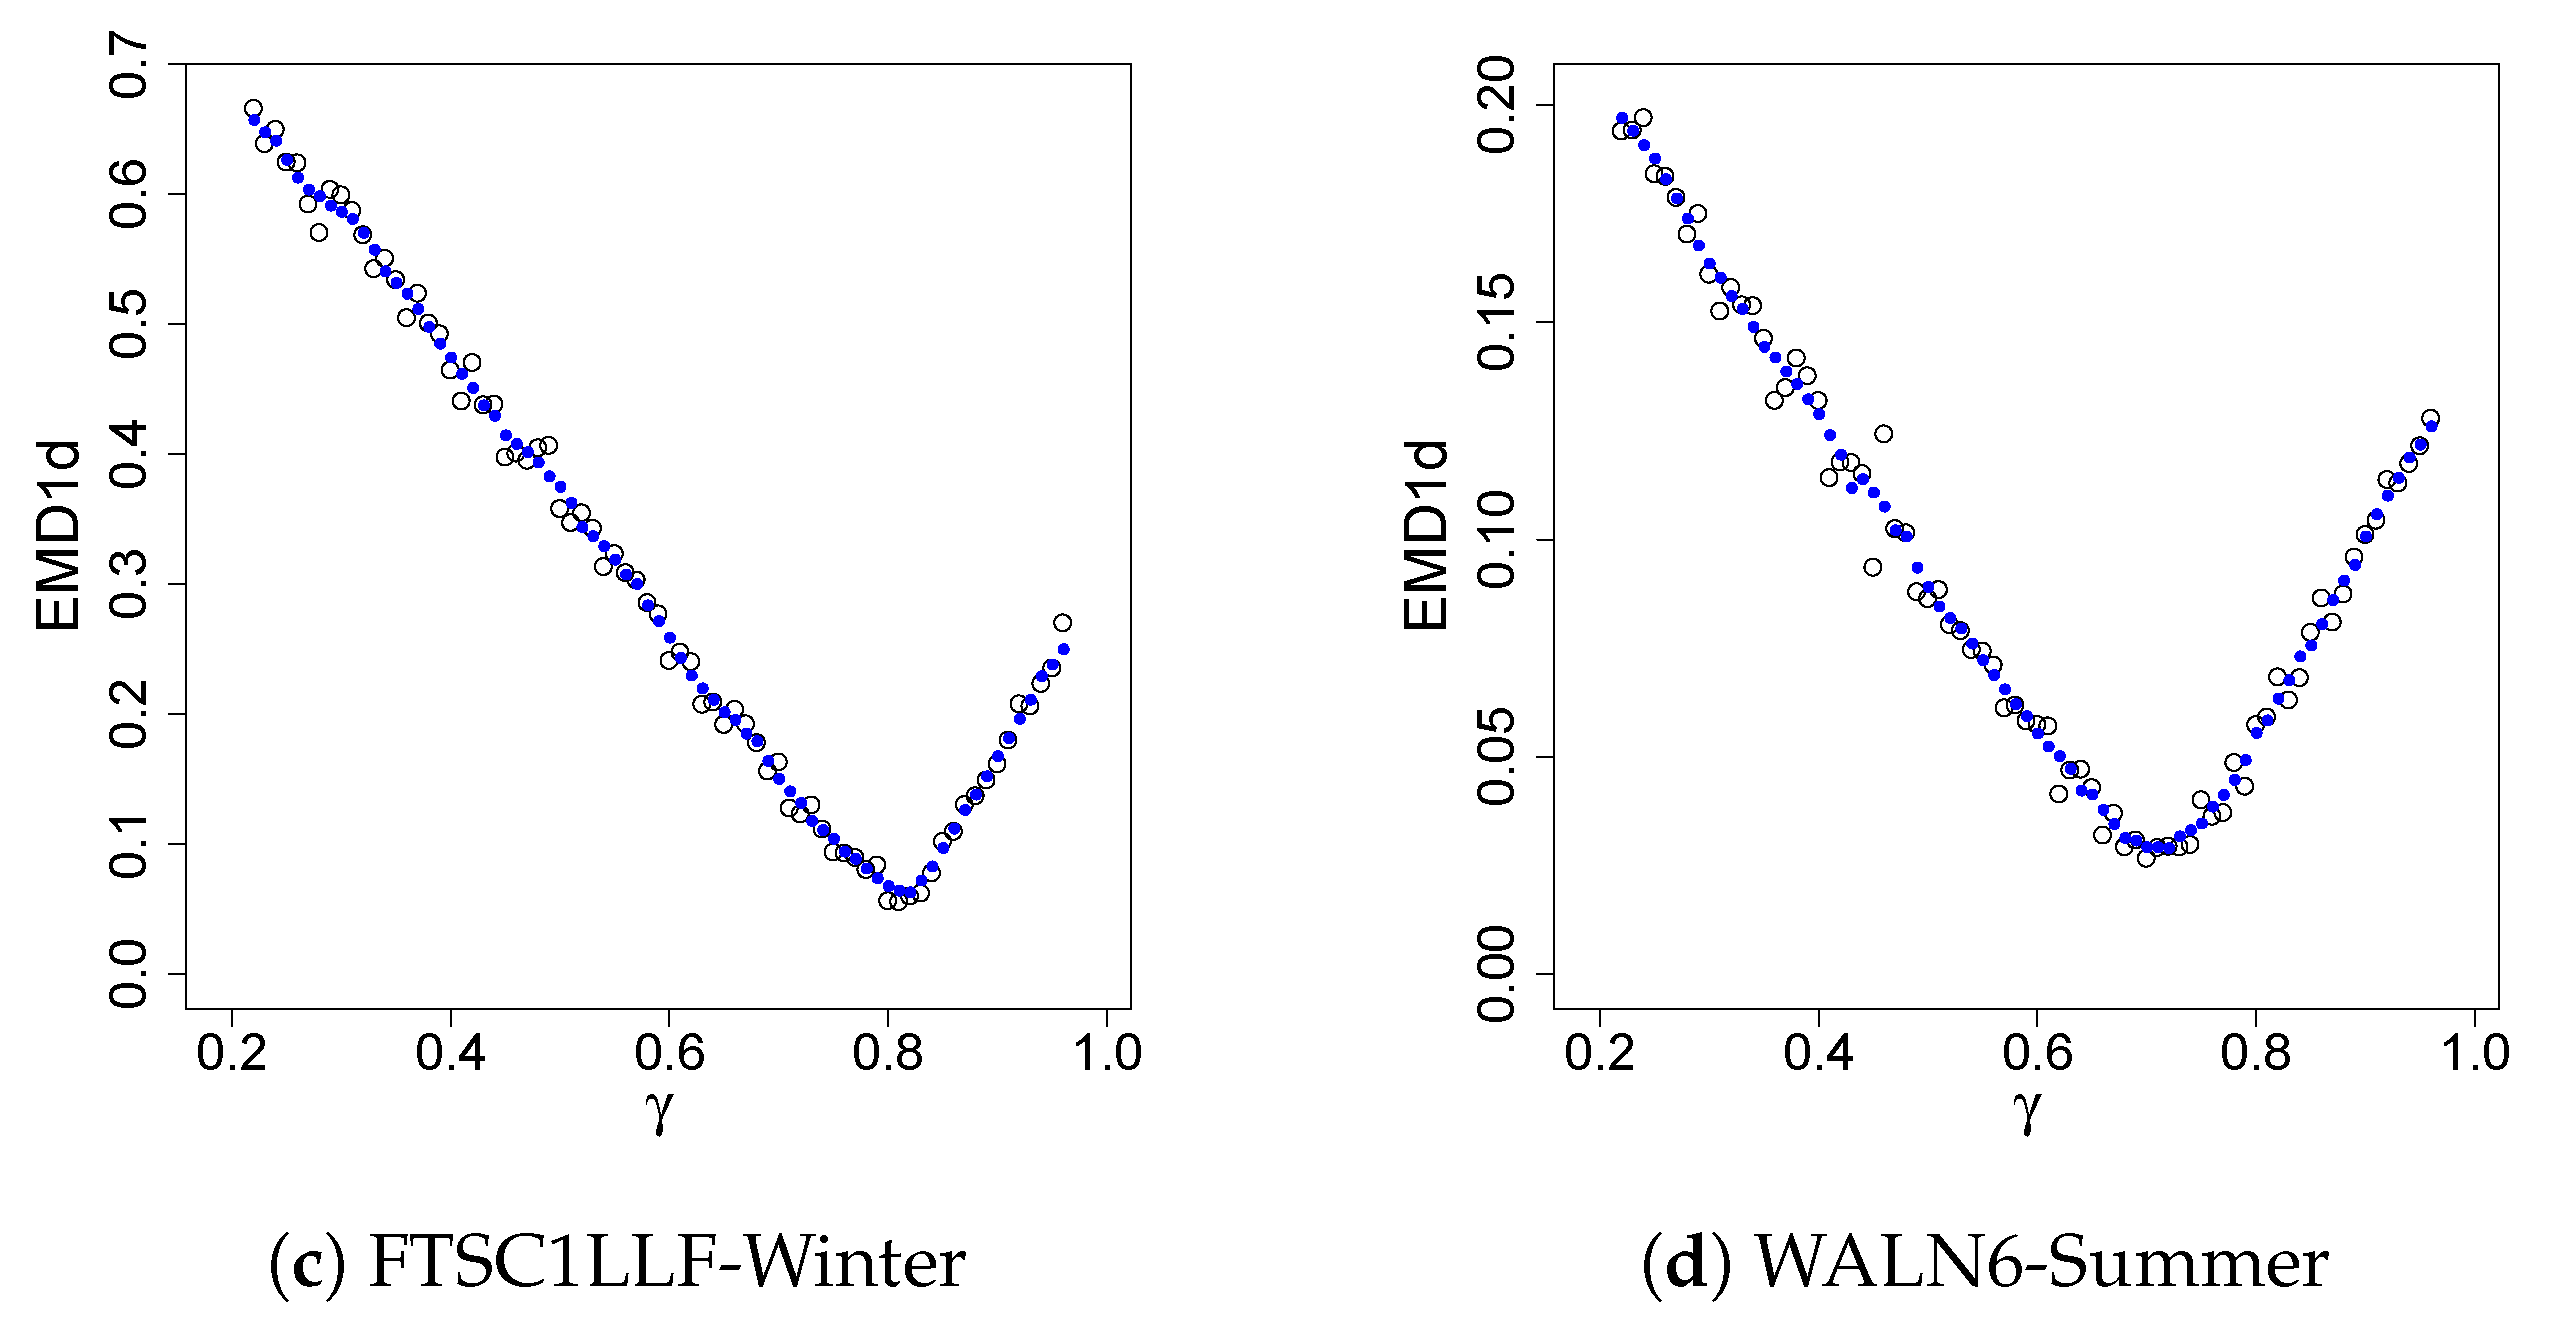
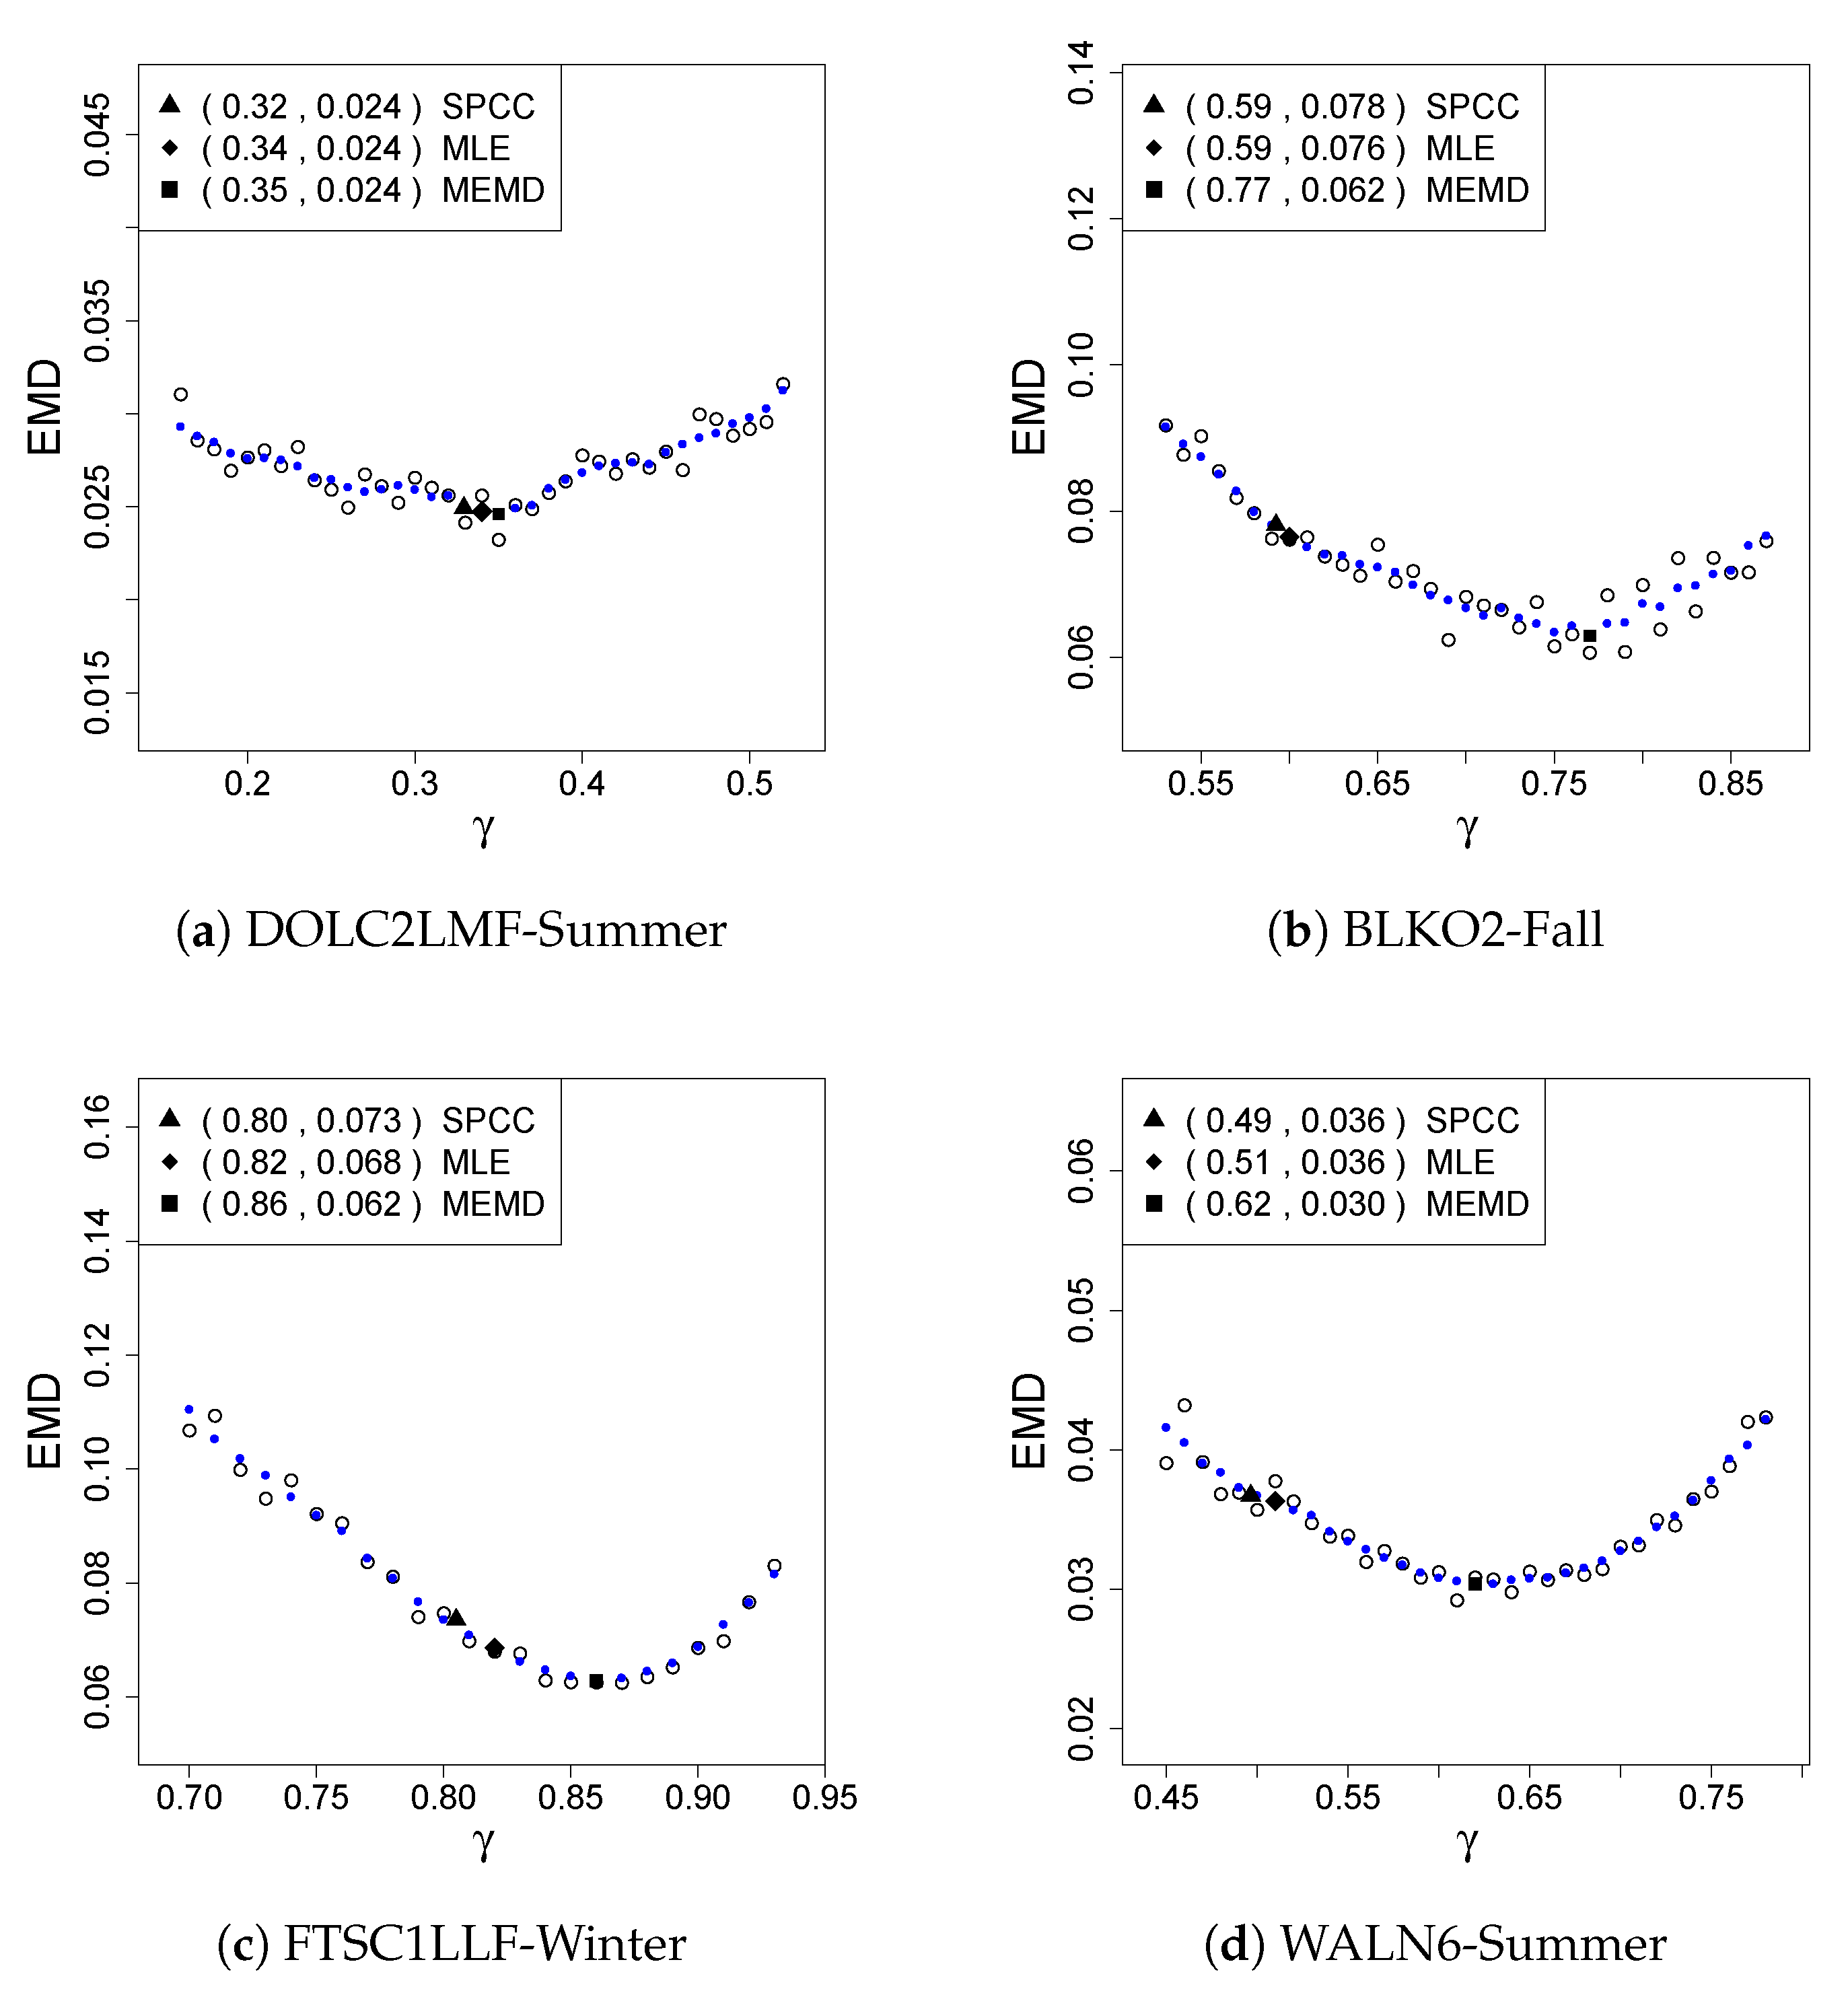
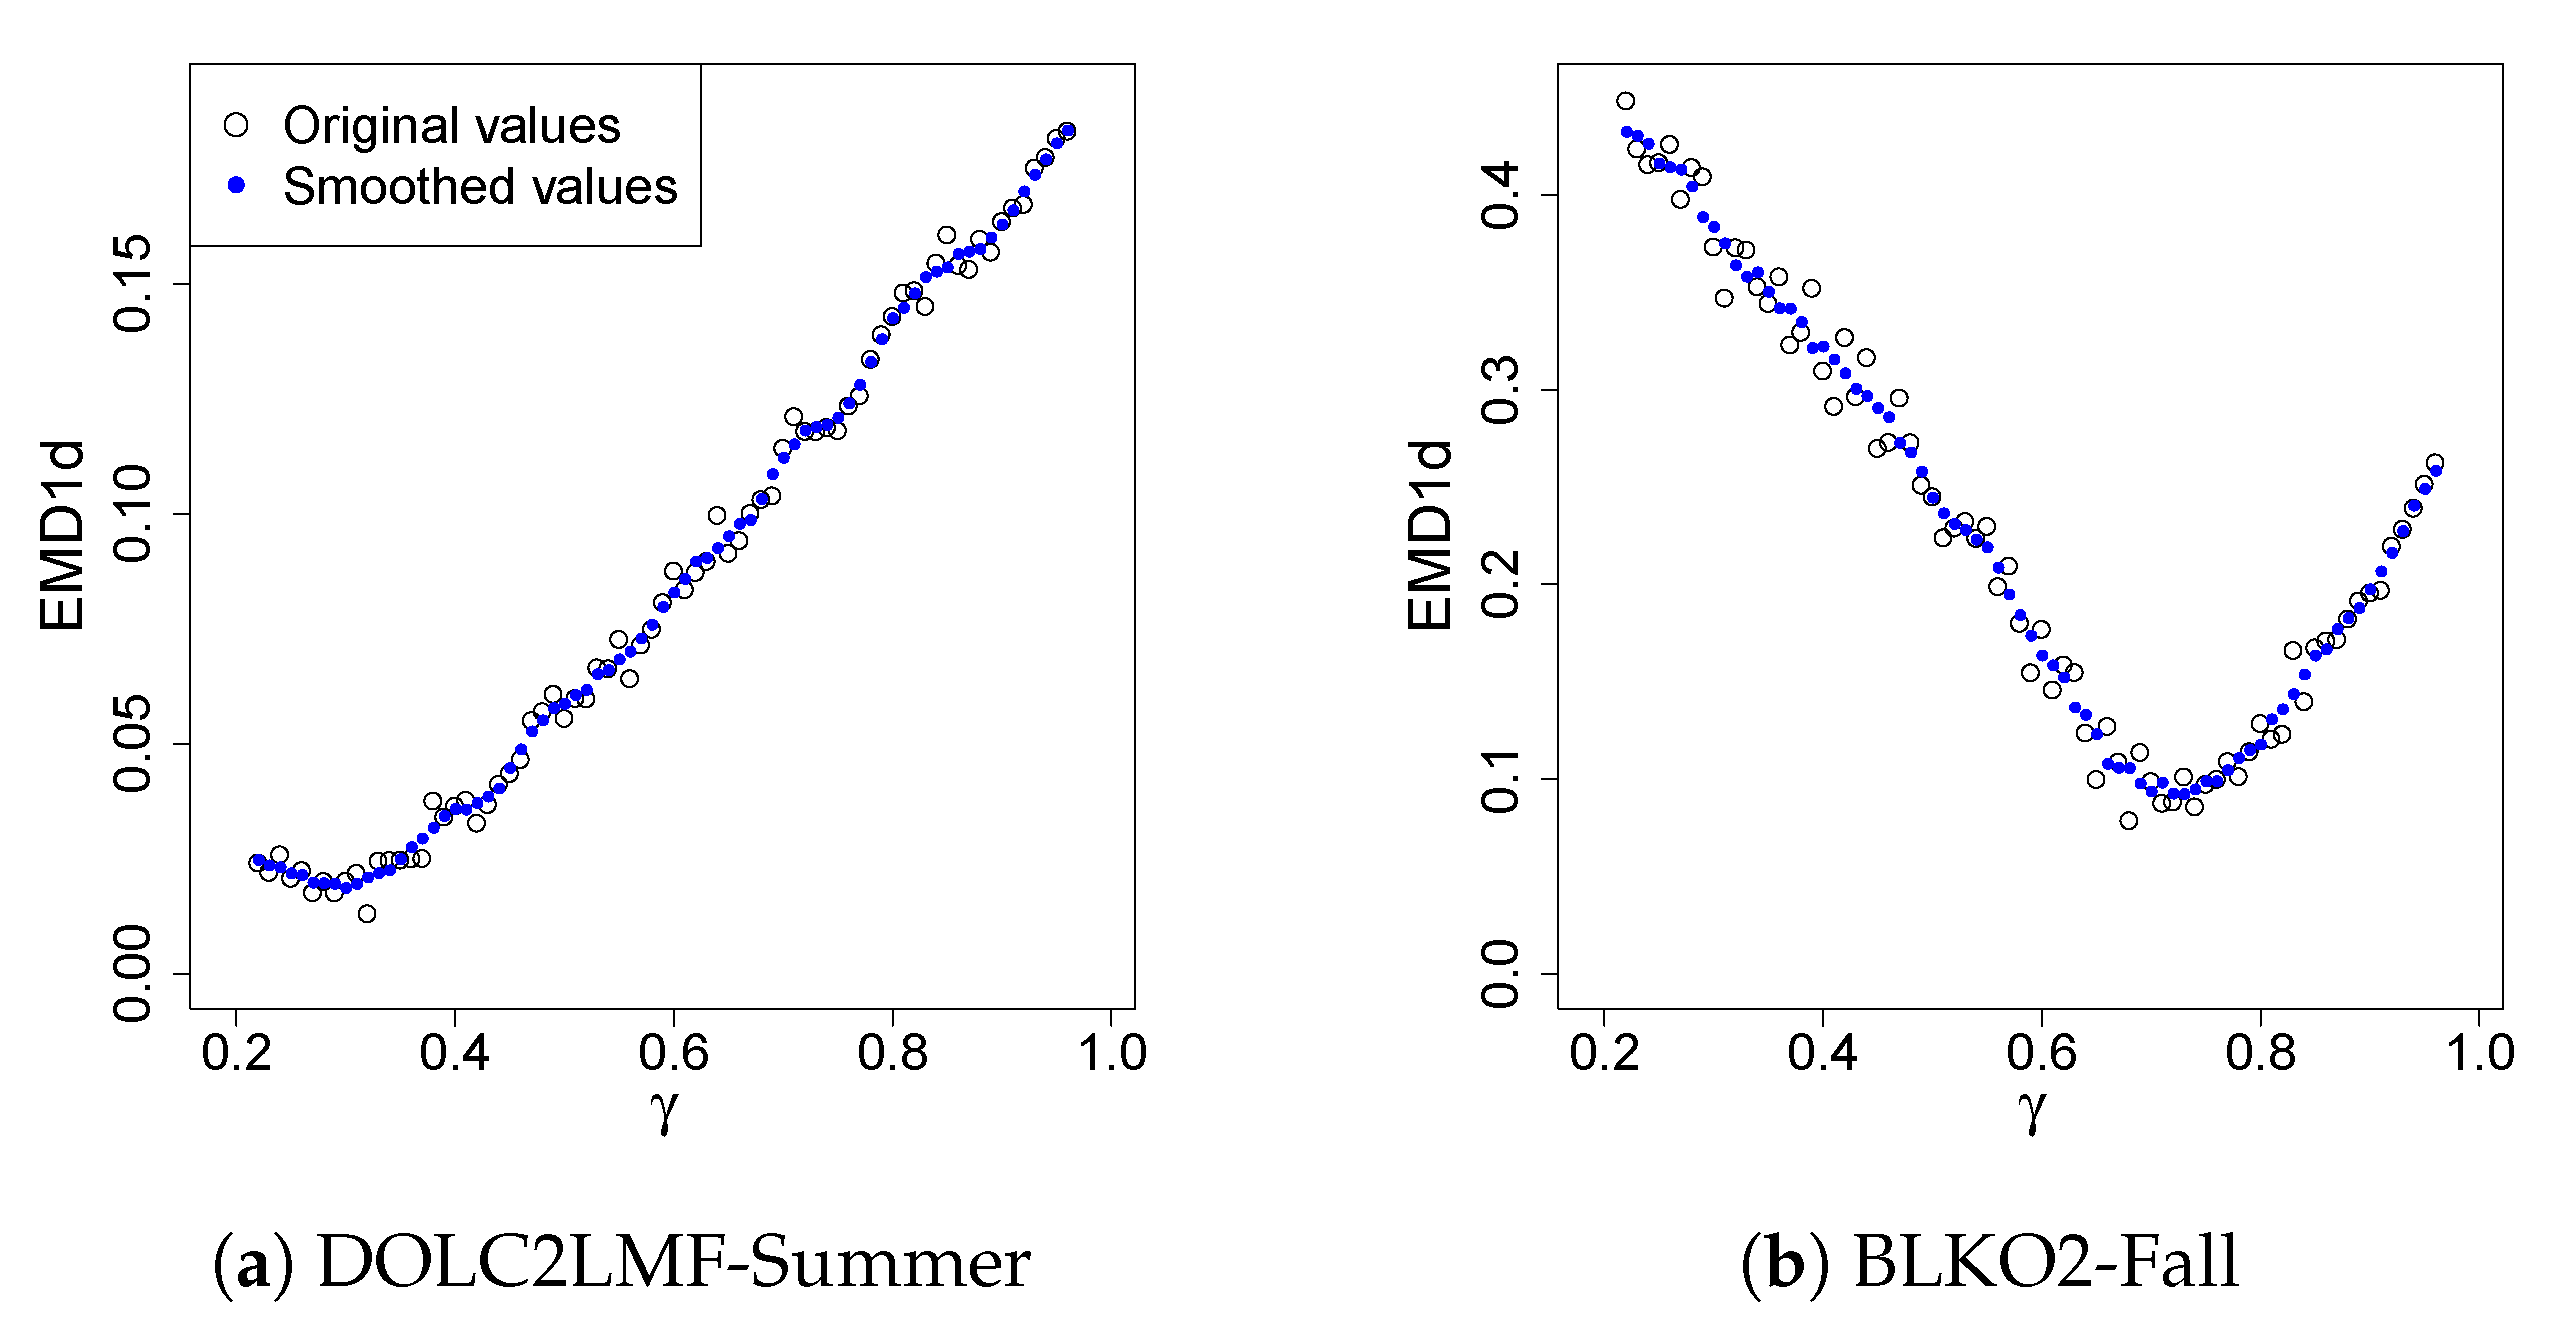
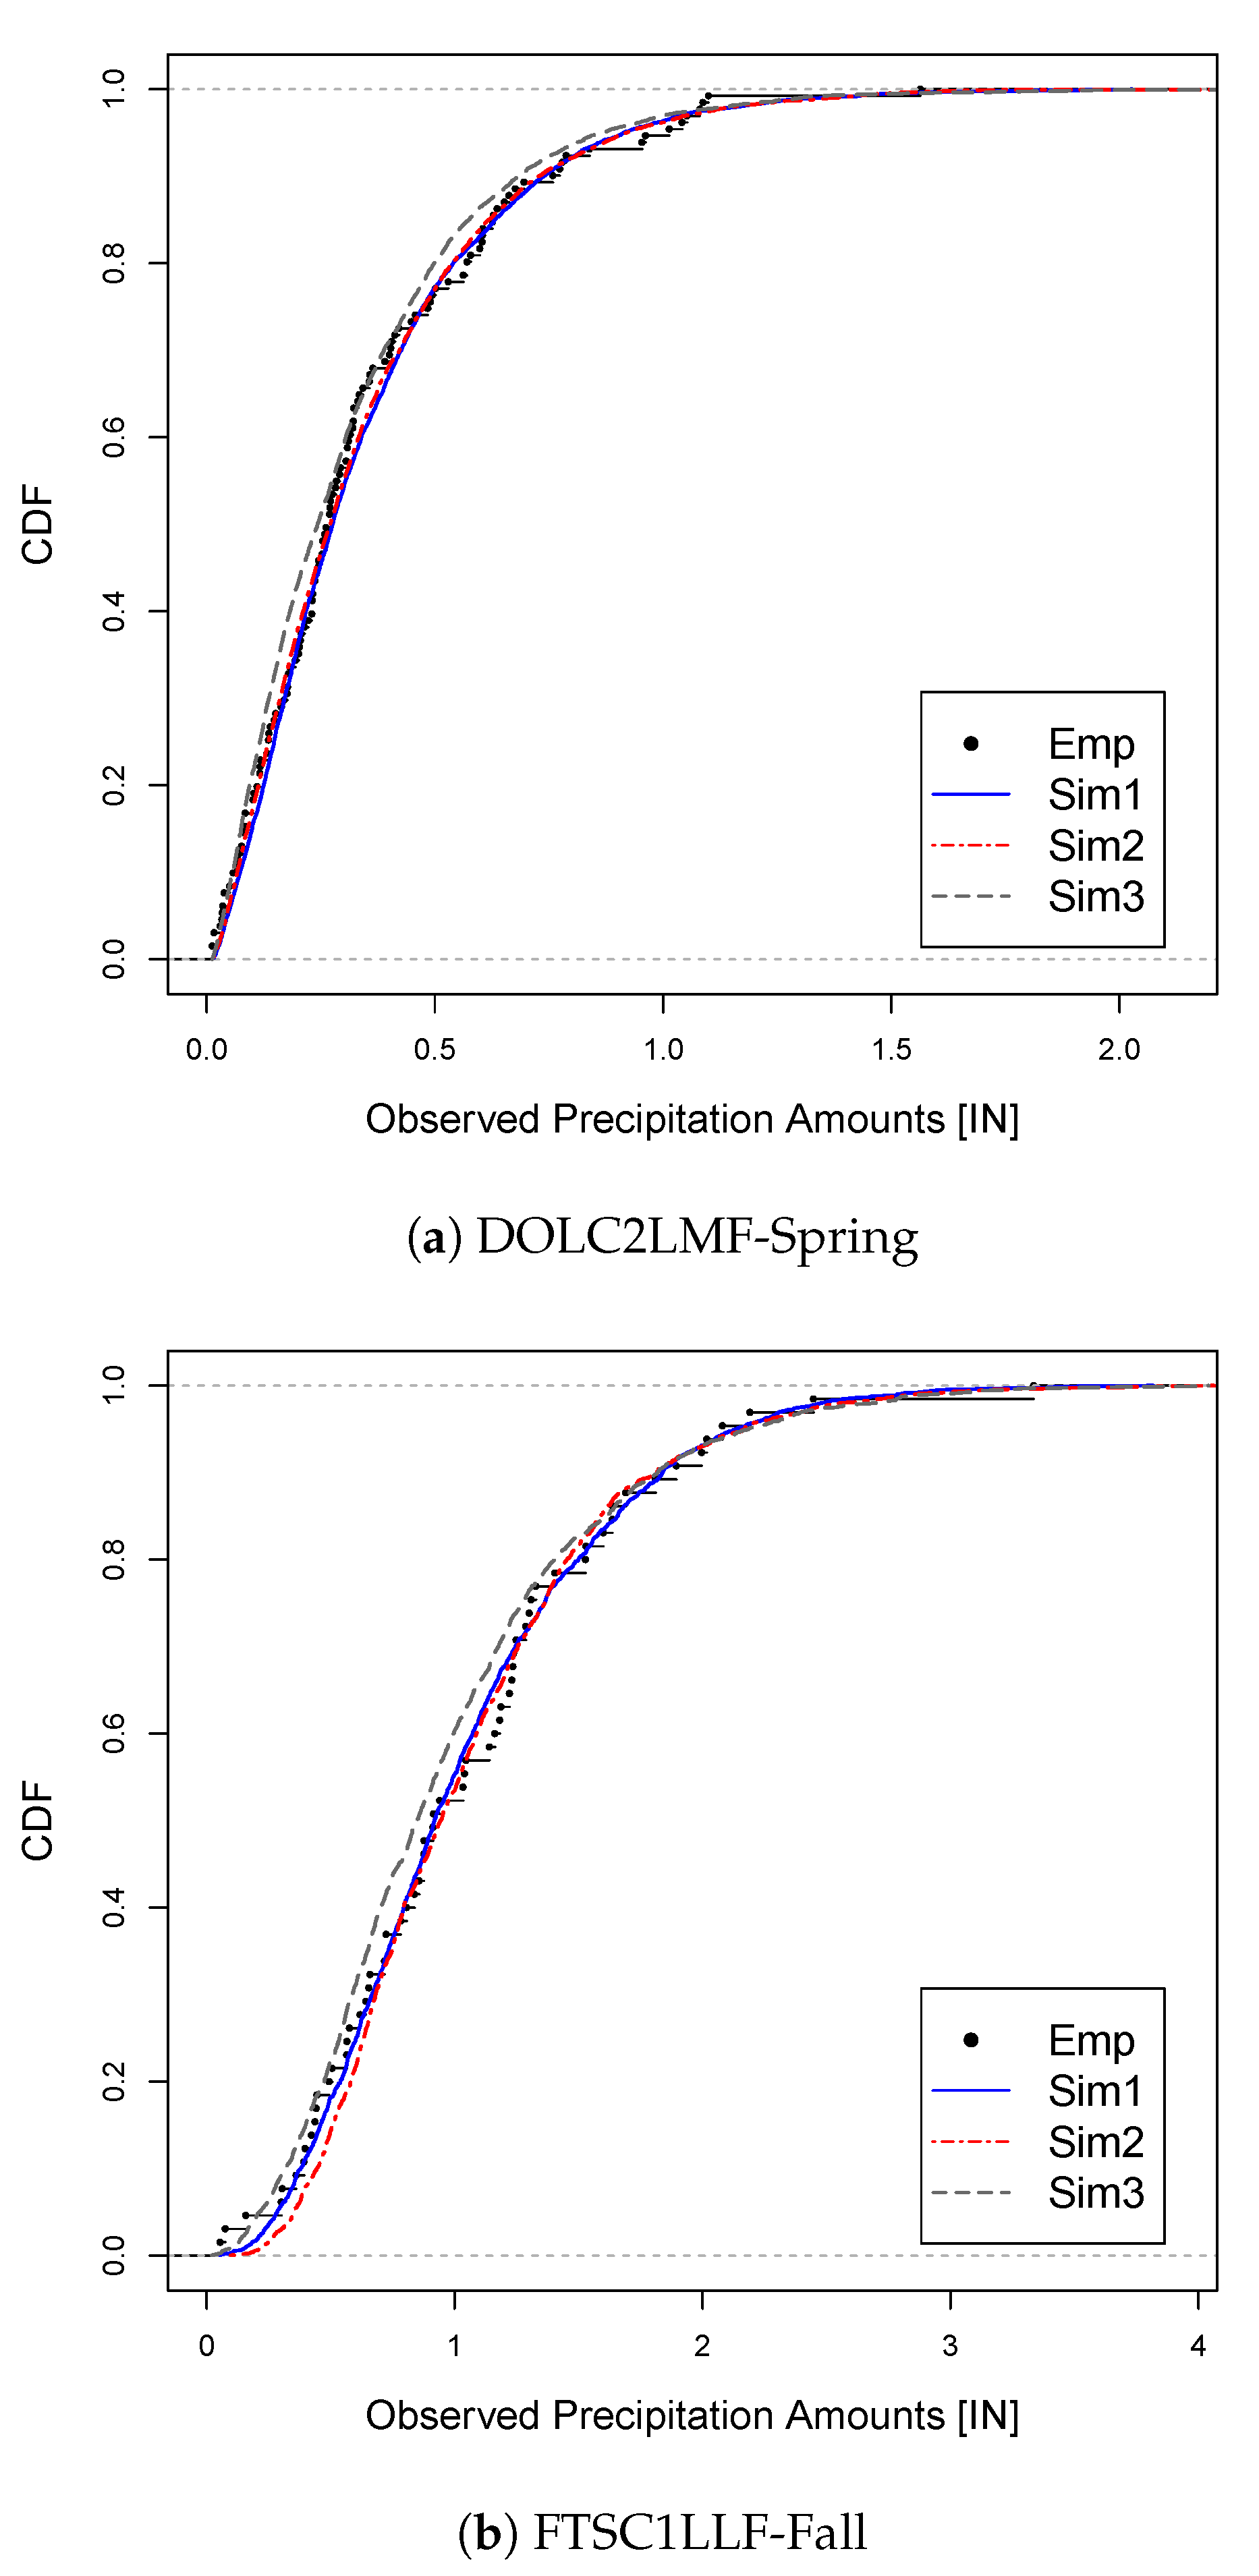
4.3. Results
5. Discussion and Concluding Remarks
Funding
Acknowledgments
Conflicts of Interest
Appendix A
Appendix B
References
- Kelly, K.S.; Krzysztofowicz, R. A bivariate meta-Gaussian density for use in hydrology. Stoch. Hydrol. Hydraul. 1997, 11, 17–31. [Google Scholar] [CrossRef]
- Krzysztofowicz, R.; Kelly, K.S. A Meta-Gaussian Distribution with Specified Marginals; Technical Report; University of Virginia: Charlottesville, VA, USA, 1996. [Google Scholar]
- Li, W.; Duan, Q.; Ye, A.; Miao, C. An improved meta-Gaussian distribution model for post-processing of precipitation forecasts by censored maximum likelihood estimation. J. Hydrol. 2019, 574, 801–810. [Google Scholar] [CrossRef]
- Schaake, J.C.; Demargne, J.; Hartman, R.; Mullusky, M.; Welles, E.; Wu, L.; Herr, H.; Fan, X.; Seo, D.-J. Precipitation and temperature ensemble forecasts from single-value forecasts. Hydrol. Earth Syst. Sci. Discuss. 2007, 4, 655–717. [Google Scholar] [CrossRef]
- Wu, L.; Seo, D.-J.; Demargne, J.; Brown, J.D.; Cong, S.; Schaake, J.C. Generation of ensemble precipitation forecast from single-valued quantitative precipitation forecast for hydrologic ensemble prediction. J. Hydrol. 2011, 399, 281–298. [Google Scholar] [CrossRef]
- Ye, A.; Deng, X.; Ma, F.; Duan, Q.; Zhou, Z.; Du, C. Integrating weather and climate predictions for seamless hydrologic ensemble forecasting: A case study in the Yalong river basin. J. Hydrol. 2017, 547, 196–207. [Google Scholar] [CrossRef]
- Papalexiou, S.M.; Koutsoyiannis, D. Entropy based derivation of probability distributions: A case study to daily rainfall. Adv. Water Resour. 2012, 45, 51–57. [Google Scholar] [CrossRef]
- Herr, H.D.; Krzysztofowicz, R. Generic probability distribution of rainfall in space: The bivariate model. J. Hydrol. 2005, 306, 234–263. [Google Scholar] [CrossRef]
- Serinaldi, F. Copula-based mixed models for bivariate rainfall data: An empirical study in regression perspective. Stoch Env. Res Risk Assess 2009, 23, 677–693. [Google Scholar] [CrossRef]
- Shimizu, K. A bivariate mixed lognormal distribution with an analysis of rainfall data. J. Appl. Meteorol. 1993, 32, 161–171. [Google Scholar] [CrossRef] [Green Version]
- Kedem, B.; Chiu, L.S.; North, G.R. Estimation of mean rain rate: Application to satellite observations. J. Geophys. Res. 1990, 95, 1965–1972. [Google Scholar] [CrossRef]
- Bowers, M.C.; Tung, W.M.; Gao, J.B. On the distributions of seasonal river flows: Lognormal or power law? Water Resour. Res. 2012, 48, W05536. [Google Scholar] [CrossRef]
- Demargne, J.; Wu, L.; Regonda, S.K.; Brown, J.D.; Haksu, L.; He, M.; Seo, D.-J.; Hartman, R.; Herr, H.D.; Fresch, M.; et al. The Science of NOAA’s Operational Hydrologic Ensemble Forecast Service. Bull. Am. Meteor. Soc. 2014, 95, 79–98. [Google Scholar] [CrossRef]
- Brown, J.D.; Wu, L.; He, M.; Regonda, S.; Haksu, L.; Seo, D.-J. Verification of temperature, precipitation, and streamflow forecasts from the NOAA/NWS Hydrologic Ensemble Forecast Service (HEFS): 1. Experimental design and forcing verification. J. Hydrol. 2014, 519, 2869–2889. [Google Scholar] [CrossRef]
- Brown, J.D.; He, M.; Regonda, S.; Wu, L.; Haksu, L.; Seo, D.-J. Verification of temperature, precipitation, and streamflow forecasts from the NOAA/NWS Hydrologic Ensemble Forecast Service (HEFS): 2. Streamflow verification. J. Hydrol. 2014, 519, 2847–2868. [Google Scholar] [CrossRef]
- Fang, H.-B.; Fang, K.-T.; Kotz, S. The meta-elliptical distributions with given marginals. J. Multivar. Anal. 2002, 82, 1–16. [Google Scholar] [CrossRef] [Green Version]
- Genest, C.; Favre, A.-C.; Beliveau, J.; Jacques, C. Metaelliptical copulas and their use in frequency analysis of multivariate hydrological data. Water Resour. Res. 2007, 43, W09401. [Google Scholar] [CrossRef] [Green Version]
- Jolliffe, I.T.; Stephenson, D.B. Forecast Verification: A Practitioner’s Guide in Atmospheric Science. In Atmospheric Science; Jolliffe, I.T., Stephenson, D.B., Eds.; John Wiley and Sons: Chichester, UK, 2003. [Google Scholar]
- Meyer, C. The Bivariate Normal Copula. Commun. Stat. Theory Methods 2013, 42, 2402–2422. [Google Scholar] [CrossRef] [Green Version]
- Sklar, A. Random Variables, Joint Distribution Functions, and Copulas. Kybernetika 1973, 9, 449–460. [Google Scholar]
- Bouyé, E.; Salmon, M. Dynamic copula quantile regressions and tail area dynamic dependence in Forex markets. Eur. J. Financ. 2009, 15, 721–750. [Google Scholar] [CrossRef]
- Rohatgi, V.K.; Ehsanes Saleh, A.K.M. Section 8.7, Maximum likelihood estimators, Theorem 4. In An Introduction to Probability Theory and Mathematics, 2nd ed.; John Wiley and Sons: Hoboken, NJ, USA, 1976. [Google Scholar]
- Joe, H. Asymptotic efficiency of the two-stage estimation method for copula-based models. J. Multivar. Anal. 2005, 94, 401–419. [Google Scholar] [CrossRef] [Green Version]
- Storvik, B.; Storvik, G.; Fjortoft, R. On the Combination of Multisensor Data Using Meta-Gaussian Distributions. IEEE Trans. Geosci. Remote Sens. 2009, 47, 2372–2379. [Google Scholar] [CrossRef]
- Levina, E.; Bickel, P.J. The Earth Mover’s Distance is the Mallows Distance: Some Insights from Statistics. In Proceedings of the Eighth IEEE International Conference on Computer Vision, ICCV 2001, Vancouver, BC, Canada, 7–14 July 2001; pp. 251–256. [Google Scholar]
- Thorarinsdottir, T.L.; Gneiting, T.; Gissibl, N. Using Proper Divergence Functions to Evaluate Climate Models. SIAM/ASA J. Uncertain. Quantif. 2013, 1, 522–534. [Google Scholar] [CrossRef] [Green Version]
- Zhou, D.; Shi, T. Statistical inference based on distances between empirical distributions with applications to airslevel-3 data. In Proceedings of the 2011 NASA Conference on Intelligent Data Understanding, Mountain View, CA, USA, 19–21 October 2011; pp. 129–143. [Google Scholar]
- Rubner, Y.; Tomasi, C.; Guibas, L.J. The Earth Mover’s Distance as a Metric for Image Retrieval. Int. J. Comput. Vis. 2000, 40, 99–121. [Google Scholar] [CrossRef]
- Trenberth, K.E.; Zhang, Y.; Gehne, M. Intermittency in Precipitation: Duration, Frequency, Intensity, and Amounts Using Hourly Data. J. Hydrometeorol. 2017, 18, 1393–1412. [Google Scholar] [CrossRef] [Green Version]
- Li, C.; Singh, V.P.; Mishra, A.K. A bivariate mixed distribution with a heavy-tailed component and its application to single-site daily rainfall simulation. Water Resour. Res. 2013, 49, 767–789. [Google Scholar] [CrossRef] [Green Version]
- Herr, H.D. A Bivariate Precipitation Uncertainty Processor for Probabilistic River Forecasting. Master’s Thesis, University of Virginia, Charlottesville, VA, USA, 1999; pp. 24–31. [Google Scholar]
- Seo, D.-J.; Breidenbach, J.P. Real-time correction of spatially nonuniform bias in radar rainfall data using rain gauge measurements. J. Hydrometeorol. 2002, 3, 93–111. [Google Scholar] [CrossRef] [Green Version]
- Hamill, T.M.; Bates, G.T.; Whitaker, J.S.; Murray, D.R.; Fiorino, M.; Galarneau, T.J.; Zhu, Y.; Lapenta, W. NOAA’s SecondGeneration Global MediumRange Ensemble Forecast Dataset. Bull. Am. Meteor. Soc. 2013, 94, 1553–1565. [Google Scholar] [CrossRef]
- Jones, P.W. First- and second-order conservative remapping schemes for grids in spherical coordinates. Mon. Weather Rev. 1999, 127, 2204–2210. [Google Scholar] [CrossRef]
- Li, C.; Singh, V.P.; Mishra, A.K. Simulation of the entire range of daily precipitation using a hybrid probability distribution. Water Resour. Res. 2012, 48, W03521. [Google Scholar] [CrossRef]


| Centroid | Grid Point | |||
|---|---|---|---|---|
| Lon (W) | Lat (N) | Lon (W) | Lat (N) | |
| BLKO2 | 97.28 | 36.81 | 97.50 | 37.22 |
| DOLC2LMF | 108.22 | 37.63 | 108.28 | 37.69 |
| FTSC1LLF | 123.15 | 39.60 | 123.28 | 39.56 |
| WALN6 | 75.14 | 42.17 | 75.00 | 42.37 |
| Spring | Summer | Fall | Winter | ||
|---|---|---|---|---|---|
| EMD | EMD | EMD | EMD | ||
| BLKO2 | SPCC | 0.62 0.057 | 0.36 0.049 | 0.59 0.078 | 0.77 0.041 |
| MLE | 0.66 0.059 | 0.41 0.049 | 0.59 0.076 | 0.81 0.041 | |
| MEMD | 0.62 0.057 | 0.40 0.049 | 0.77 0.062 | 0.78 0.041 | |
| DOLC2LMF | SPCC | 0.38 0.028 | 0.32 0.024 | 0.31 0.030 | 0.40 0.031 |
| MLE | 0.39 0.026 | 0.34 0.024 | 0.35 0.029 | 0.43 0.029 | |
| MEMD | 0.46 0.024 | 0.35 0.024 | 0.36 0.028 | 0.51 0.028 | |
| FTSC1LLF | SPCC | 0.77 0.049 | 0.58 0.083 | 0.77 0.066 | 0.80 0.073 |
| MLE | 0.79 0.046 | 0.65 0.076 | 0.79 0.063 | 0.82 0.068 | |
| MEMD | 0.85 0.042 | 0.62 0.074 | 0.87 0.061 | 0.86 0.062 | |
| WALN6 | SPCC | 0.70 0.032 | 0.49 0.036 | 0.72 0.035 | 0.82 0.035 |
| MLE | 0.72 0.032 | 0.51 0.036 | 0.74 0.029 | 0.84 0.035 | |
| MEMD | 0.74 0.031 | 0.62 0.030 | 0.77 0.027 | 0.78 0.033 |
| Spring | Summer | Fall | Winter | ||
|---|---|---|---|---|---|
| EMD1d KSS | EMD1d KSS | EMD1d KSS | EMD1d KSS | ||
| BLKO2 | SPCC | 0.62 0.069 0.084 | 0.36 0.072 0.077 | 0.59 0.169 0.107 | 0.77 0.102 0.117 |
| MLE | 0.66 0.053 0.067 | 0.41 0.072 0.071 | 0.59 0.169 0.107 | 0.81 0.079 0.094 | |
| MEMD2d | 0.62 0.069 0.084 | 0.40 0.070 0.070 | 0.77 0.108 0.126 | 0.78 0.095 0.112 | |
| MEMD1d | 0.68 0.049 0.068 | 0.39 0.069 0.070 | 0.72 0.090 0.113 | 0.89 0.072 0.087 | |
| MKSS | 0.66 0.053 0.067 | 0.38 0.070 0.068 | 0.67 0.119 0.075 | 0.87 0.076 0.083 | |
| DOLC2LMF | SPCC | 0.38 0.031 0.096 | 0.32 0.018 0.066 | 0.31 0.037 0.089 | 0.40 0.055 0.087 |
| MLE | 0.39 0.029 0.094 | 0.34 0.021 0.074 | 0.35 0.033 0.072 | 0.43 0.048 0.094 | |
| MEMD2d | 0.46 0.018 0.061 | 0.35 0.023 0.076 | 0.36 0.033 0.067 | 0.51 0.042 0.141 | |
| MEMD1d | 0.46 0.018 0.059 | 0.28 0.018 0.053 | 0.40 0.029 0.066 | 0.51 0.042 0.120 | |
| MKSS | 0.49 0.019 0.058 | 0.29 0.018 0.053 | 0.37 0.032 0.063 | 0.39 0.055 0.085 | |
| FTSC1LLF | SPCC | 0.77 0.108 0.097 | 0.58 0.110 0.177 | 0.77 0.083 0.109 | 0.80 0.067 0.042 |
| MLE | 0.79 0.096 0.094 | 0.65 0.096 0.150 | 0.79 0.069 0.104 | 0.82 0.066 0.047 | |
| MEMD2d | 0.85 0.077 0.081 | 0.62 0.104 0.149 | 0.87 0.058 0.090 | 0.86 0.102 0.071 | |
| MEMD1d | 0.84 0.074 0.085 | 0.70 0.087 0.159 | 0.84 0.052 0.092 | 0.82 0.066 0.044 | |
| MKSS | 0.84 0.074 0.079 | 0.63 0.102 0.147 | 0.85 0.054 0.088 | 0.80 0.067 0.042 | |
| WALN6 | SPCC | 0.70 0.067 0.099 | 0.49 0.094 0.164 | 0.72 0.076 0.127 | 0.82 0.054 0.161 |
| MLE | 0.72 0.060 0.094 | 0.51 0.088 0.154 | 0.74 0.073 0.113 | 0.84 0.049 0.148 | |
| MEMD2d | 0.74 0.053 0.094 | 0.62 0.044 0.088 | 0.77 0.062 0.093 | 0.78 0.067 0.197 | |
| MEMD1d | 0.84 0.035 0.077 | 0.70 0.026 0.066 | 0.80 0.059 0.082 | 0.94 0.023 0.067 | |
| MKSS | 0.85 0.036 0.073 | 0.68 0.028 0.064 | 0.81 0.062 0.075 | 0.94 0.023 0.063 |
| EMD1d | KSS | ||
|---|---|---|---|
| MEMD2d | SPCC | 12:3 | 11:4 |
| MLE | 9:6 | 8:7 | |
| MEMD1d | SPCC | 15:0 | 13:3 |
| MLE | 15:0 | 12:4 | |
| MEMD2d | 14:0 | 12:3 | |
| MKSS | SPCC | 13:0 | 15:0 |
| MLE | 12:3 | 15:0 | |
| MEMD2d | 11:3 | 16:0 |
© 2020 by the author. Licensee MDPI, Basel, Switzerland. This article is an open access article distributed under the terms and conditions of the Creative Commons Attribution (CC BY) license (http://creativecommons.org/licenses/by/4.0/).
Share and Cite
Wu, L. Tuning the Bivariate Meta-Gaussian Distribution Conditionally in Quantifying Precipitation Prediction Uncertainty. Forecasting 2020, 2, 1-19. https://doi.org/10.3390/forecast2010001
Wu L. Tuning the Bivariate Meta-Gaussian Distribution Conditionally in Quantifying Precipitation Prediction Uncertainty. Forecasting. 2020; 2(1):1-19. https://doi.org/10.3390/forecast2010001
Chicago/Turabian StyleWu, Limin. 2020. "Tuning the Bivariate Meta-Gaussian Distribution Conditionally in Quantifying Precipitation Prediction Uncertainty" Forecasting 2, no. 1: 1-19. https://doi.org/10.3390/forecast2010001
APA StyleWu, L. (2020). Tuning the Bivariate Meta-Gaussian Distribution Conditionally in Quantifying Precipitation Prediction Uncertainty. Forecasting, 2(1), 1-19. https://doi.org/10.3390/forecast2010001