Article

Effective Sample Size with the Bivariate Gaussian Common Component Model

by
Letícia Ellen Dal Canton
*,
Luciana Pagliosa Carvalho Guedes
,
Miguel Angel Uribe-Opazo
* and
Tamara Cantu Maltauro
Engineering, Mathematics and Technology Department, Western Paraná State University (Universidade do Oeste do Paraná, UNIOESTE), Cascavel 85819-110, Brazil
*
Authors to whom correspondence should be addressed.
Stats 2023, 6(4), 1019-1036; https://doi.org/10.3390/stats6040064
Submission received: 26 September 2023 / Revised: 1 October 2023 / Accepted: 4 October 2023 / Published: 8 October 2023
(This article belongs to the Section Applied Stochastic Models)

Abstract

:
Effective sample size (ESS) consists of an equivalent number of sampling units of a georeferenced variable that would produce the same sampling error, as it considers the information that each georeferenced sampling unit contains about itself as well as in relation to its neighboring sampling units. This measure can provide useful information in the planning of future georeferenced sampling for spatial variability experiments. The objective of this article was to develop a bivariate methodology for ESS ( E S S b i ), considering the bivariate Gaussian common component model (BGCCM), which accounts both for the spatial correlation between the two variables and for the individual spatial association. All properties affecting the univariate methodology were verified for E S S b i using simulation studies or algebraic methods, including scenarios to verify the impact of the BGCCM common range parameter on the estimated E S S b i values. E S S b i was applied to real organic matter (OM) and sum of bases (SB) data from an agricultural area. The study found that 60% of the sample observations of the OM–SB pair contained spatially redundant information. The reduced sample configuration proved efficient by preserving spatial variability when comparing the original and reduced OM maps, using SB as a covariate. The Tau concordance index confirmed moderate accuracy between the maps.

1. Introduction

Establishing sample planning is one of the first steps within a spatial study. This includes analyzing the area in which the samples will be collected (climate, vegetation, terrain), determining the sample configuration, the spacing between observations and, of course, the number of observations that will be collected [1].
Let us suppose that n is the sample size that is currently collected in a given agricultural area, for example, and that these samples are used to prepare and analyze thematic maps of spatially correlated variables. One problem that several researchers have been discussing and seeking solutions to is determining the equivalent number of independent observations in [2,3,4,5,6]. This number is called effective sample size (ESS). Therefore, ESS represents the estimate of a new sample size, considering the effects of spatial autocorrelation between georeferenced observations to reduce the number of samples collected. In practical terms in agriculture, the information on the spatial dependence structure of the soil attribute, collected in a given agricultural area, is used to calculate ESS, which informs the rural producer how many samples should be collected and sent to the laboratory for chemical or physical analysis.
The formal definition of ESS for georeferenced variables was published by Griffith [2], whose estimate of the reduced sample size derives from the variance inflation factor, with applications of this method found in Watson [7] and Griffith [3]. In the paper by Vallejos and Osorio [4], calculation of the univariate ESS was proposed considering Fisher’s information matrix. In the same article, the univariate case was extended to the bivariate, which was a weighted version of the former to avoid a spatial correlation structure between the variables. Other studies were published based on the premise of the univariate ESS proposed in Vallejos and Osorio [4], namely, Acosta et al. [8] quantified the univariate ESS for a regression model, including existing spatial and serial correlations. Acosta and Vallejos [9] used the method to estimate the univariate ESS considering spatial regression models. Canton et al. [10] used Student’s t distribution and the EM algorithm to model different depths of soil resistance to root penetration with discrepant observations, and calculated the univariate ESS for each depth range. The maximum ESS value was considered in this study to obtain a single sample reduction. Canton et al. [11] made a sample reduction using the multivariate ESS; however, the method only considered a weighted ESS version, to avoid using a spatial correlation between the variables. Vallejos and Acosta [6] proposed a multivariate method to estimate ESS, dividing the attributes into groups of two and using the bivariate coregionalization model (BCRM). The BCRM proposes a parametric structure in which one spatial correlation parameter is common to two variables, and another spatial correlation parameter is exclusive to one of the variables. Thus, the spatial correlation of the other variable is necessarily disregarded from the model.
In addition to the BCRM, the bivariate Gaussian common component model (BGCCM) represents another option for bivariate spatial modeling. Unlike the coregionalization model, the BGCCM takes into account both the spatial correlation between the two variables and the individual spatial association of one of them [12].
Thus, by combining the BGCCM with the bivariate ESS, we have a methodology that enables us to redefine the sample size for a study that simultaneously involves the analysis of the spatial variability of two georeferenced variables, considering the presence of spatial dependence for each of them as well as the spatial dependence that exists between them. This is the main objective of this paper.
The paper was divided into two stages. First, to empirically evaluate and understand E S S b i , a simulation study was used, which was subdivided into different scenarios by the BGCCM parameters considered: (a) to verify if the univariate ESS properties are also valid for the bivariate ESS ( E S S b i ), and (b) to analyze the influence of the BGCCM parameters on the behavior of E S S b i . The simulation study reproduces a list of possibilities presented in the real data and adds practical and theoretical knowledge about sample resizing.
Subsequently, an application in the agricultural context was presented using two variables, organic matter (OM) and sum of bases (SB), whose spatial relationship is agronomically important. The choice of OM and SB was not random, as OM increases solubility and availability of cations (SB) beneficial to the plants, making the soil more fertile [13]. The data were collected in a soybean-producing region, in order to (a) analyze whether there is redundant information between the observations collected from these variables in this area and, if so, resize the sampling design that already exists in the study area, for future experiments, reducing the number of sampling units and the costs related to collection and laboratory analysis; and (b) verify if the methodology proposed maintains accuracy in identifying the spatial variability of OM with SB as a covariate.
Using SB as a covariate for OM makes agronomic sense because the presence of bases (cations) in the soil can directly influence the decomposition and formation of OM. This is due to the fact that the availability of cations such as calcium, magnesium, and potassium affects soil microbial activity, which, in turn, impacts the OM decomposition rate. Therefore, by considering bases as a covariate for organic matter, it becomes possible to capture the interaction between these two factors and gain valuable insights into how soil fertility affects the formation and decomposition of OM. However, the inverse, using organic matter as a covariate for bases, may not be as relevant since OM is more a result of soil conditions rather than a direct cause of variations in bases, making this approach less informative [13].
This article was structured as follows: in Section 2, the BGCCM spatial model and its parameters are described, as well as the univariate effective sample size (ESS) and the bivariate ESS method used. The simulation studies and the real data application are also described in this section. In Section 3, the properties that affect the bivariate ESS are verified, in addition to applying the methodology to a pair of soil chemical attributes of a given agricultural area. In Section 4, the results presented in the previous section are discussed. The final considerations of the paper are made in Section 5.

2. Materials and Methods

2.1. Bivariate Gaussian Spatial Model

In the cases where there is statistical evidence of spatial correlation between two attributes, the spatial pattern of these variables can be modeled and described considering a bivariate Gaussian spatial model [14]. Among the proposals presented in the literature to study situations in which two attributes have spatial correlation, the bivariate Gaussian common component model—BGCCM [15] was used in this study.
In the BGCCM, spatial attributes Y 1 and Y 2 are modeled as follows [14]:
Y 1 = μ 1 + σ 01 S 0 + σ 1 S 1 Y 2 = μ 2 + σ 02 S 0 + σ 2 S 2 ,
where μ 1 , μ 2 are the means of variables Y 1 and Y 2 , respectively; σ = ( σ 01 , σ 1 , σ 02 , σ 2 ) T is the vector of dispersion parameters linked to the bivariate geostatistical model; and S 0 , S 1 , and S 2 are mutually independent Gaussian random fields. Random field S 0 is common to variables Y 1 and Y 2 , which represents a common factor that affects both Y 1 and Y 2 and allows generating valid cross-correlations between variables Y 1 and Y 2 . S 1 and S 2 are individually associated with each variable [16,17].
Thus, the BGCCM spatial model presents a covariance structure built from three valid correlation functions: ρ 0 ( h ) , ρ 1 ( h ) , and ρ 2 ( h ) for S 0 , S 1 , and S 2 , respectively, where h = h i j is the Euclidean distance between locations s i and s j , which are measured as Y 1 and Y 2 , with i , j = 1 , , n k , k = 1 , 2 , and n 1 and n 2 are the sample sizes of Y 1 and Y 2 , respectively.
Let us suppose that Y = ( Y 1 , Y 2 ) T has an ( n 1 + n 2 )-varied Gaussian distribution, with a vector of means μ = ( μ 1 , μ 2 ) T and a defined Σ Y positive covariance matrix, given by [14]:
Σ Y = Σ 1 Σ 1 , 2 Σ 1 , 2 T Σ 2 ,
where Σ k is the covariance matrix of variable Y k , with a dimension of n k × n k , k = 1 , 2 , with Σ k = [ ( C k ( s i , s j ) ) ] = C o v [ Y k ( s i ) , Y k ( s j ) ] , where s i and s j are locations separated by distance h. The parametric form of Σ k elements is given by:
C k ( s i , s j ) = σ 0 k 2 + σ k 2 , for h = 0 σ 0 k 2 ρ 0 ( h ) + σ k 2 ρ k ( h ) , for h 0 ,
and Σ 1 , 2 with n 1 × n 2 in dimension is the cross-covariance matrix between variables Y 1 and Y 2 , with Σ 1 , 2 = [ ( C 1 , 2 ( s i , s j ) ) ] = C o v [ Y 1 ( s i ) , Y 2 ( s j ) ] , where s i and s j are locations separated by a distance h. The parametric form of Σ 1 , 2 elements is given by:
C 1 , 2 ( s i , s j ) = σ 01 σ 02 , for h = 0 σ 01 σ 02 ρ 0 ( h ) , for h 0 ,
where ρ 0 ( h ) and ρ k ( h ) are the correlation functions and σ 0 k and σ k are the dispersion parameters in S 0 and S k ( k = 1 , 2 ), respectively.
The estimation of the θ = ( μ , σ , φ ) T parameters vector follows the same criteria of univariate geostatistical techniques [17], in which μ and σ were described before, and vector φ = ( φ 0 , φ 1 , φ 2 ) T represents range function φ t , linked to the geostatistical model chosen by the ρ t spatial correlation function, in which t = 0 , 1 , 2 is related to random field S t . Thus, the maximum likelihood method was used in this paper to estimate the parameters [18].

2.2. Univariate and Bivariate Effective Sample Size

The effective sample size (ESS) proposal considers that some sample points collected are highly correlated with each other, providing redundant information in relation to spatial variability. Thus, ESS uses the effects of the spatial autocorrelation between the observations to estimate a new sample size [2].
ESS is based on Fisher’s information matrix about the mean and considers a stationary stochastic process, whose set of observations of attribute Y k follows normal distribution. The expression to estimate ESS is given by Vallejos and Osorio [4]:
E S S = 1 T R 1 1 ,
where 1 is unit vector n k × 1 , in which n k is the number of Y k observations and R is the spatial correlation matrix, nonsingular, with n k × n k in dimension.
The following properties affect the estimated ESS values [4]:
  • E S S decreases as the spatial correlation increases;
  • E S S = 1 when there is a perfect spatial correlation between all pairs of observations;
  • E S S = n k when there is no spatial correlation between the pairs of observations, where n k is the number of georeferenced observations of the variable;
  • E S S grows as n k increases;
  • E S S 1 .
In order to spatially correlate two variables, it is necessary to analyze two redundant information sources: the spatial correlation between both attributes and the spatial association within each of them [2]. Thus, the expression for estimating the bivariate effective sample size ( E S S b i ) used in this paper contains, in addition to the individual spatial association structure of the attributes, the spatial correlation structure between them. Thus, the variables were modeled and had their spatial behavior described by the BGCCM (Equation (1)).
Therefore, based on the Vallejos and Osorio [4,6] proposals for the univariate E S S (Equation (5)) and bivariate ESS with the BCRM model, and considering the parameters estimated by BGCCM, the E S S b i value was calculated by means of the following expression:
E S S b i = 1 T R ( b i ) 1 1 ,
where 1 is unit vector 2 n × 1 , in which n = n 1 = n 2 is the total of observations for both attributes; and R ( b i ) is the 2 n × 2 n bivariate spatial correlation matrix, obtained from Equations (2)–(4).

2.3. Description of the Simulation Study

The first four properties described before for the univariate ESS are validated for the bivariate case using simulation studies. Only property (v) was verified algebraically.
In addition to this, the simulations also add practical and theoretical knowledge about the bivariate effective sample size, reproducing situations that might occur in different experimental agricultural areas with any pairs of attributes.
Properties (i) to (iv) were evaluated by simulation studies called scenarios 1 to 4, respectively (Figure 1a). In each scenario, 100 simulations were developed, with p denoting the p-th simulation, p = 1 , , 100 .
To verify property (i), scenario 1 was elaborated, for which five trials were designed ( T 1 , , T 5 ), considering different range values in φ , on the BGCCM model (Figure 1a).
For scenario 1, in addition to the simulations, E S S b i was also calculated with the simulated parameters for the BGCCM spatial model in each trial. The objective was to compare these E S S b i values with the mean values of ( E S S b i ) p , p = 1 , …, 100, obtained when estimating the parameters. This comparison was only performed for this scenario, as the simulated range values in the respective trials did not extrapolate the area’s cutoff value and were not lower than the minimum distance between the points.
Scenarios 2 and 3 had three trials each (T1–T3), where the BGCCM model range values were varied, which complements the evaluation of property (i), as it was also used to verify properties (ii) (simulating high values in φ ) and (iii) (simulating low values in φ ), respectively (Figure 1a).
For property (iv), scenario 4 was prepared—using scenario 1 as a reference, as it contains the original sample size (n = 102 sample points). Scenario 4 was subdivided into three situations with different sample sizes (75%, 50%, and 25% of n), each one with five trials (T1–T5, Figure 1a). Five trials were used so that it was possible to observe the behavior of the mean E S S b i values given the increase in the values of the ranges for the different sample sizes.
Scenario 5 was prepared to analyze the influence of the dispersion parameters ( σ ) in estimating the E S S b i values; and also to verify if there is any relationship between the simulated ranges and the estimated mean values of vector σ . For this, 12 trials were devised, with the values of the range parameter varying individually and, unlike the other scenarios, in this one, only the dispersion parameters were estimated by means of the BGCCM; the range parameters were kept fixed (Figure 1a). The range values were varied individually so that it was possible to analyze the influence of the increase in each range parameter ( φ 0 , φ 1 , and φ 2 ) on the estimation of vector σ , and were fixed to ensure that only one range varied at a time, keeping the other two unchanged.
In all the trials from each scenario, the values of the mean absolute error (MAE) were calculated to evaluate the quality of the parameter estimates [14,17].
To perform the simulations, a Monte Carlo experiment was used based on Cholesky’s decomposition of the Σ Y covariance matrix [18]. The other characteristics regarding the simulations are presented in the methodological scheme of Figure 1b.

2.4. Description of the Actual Data Study
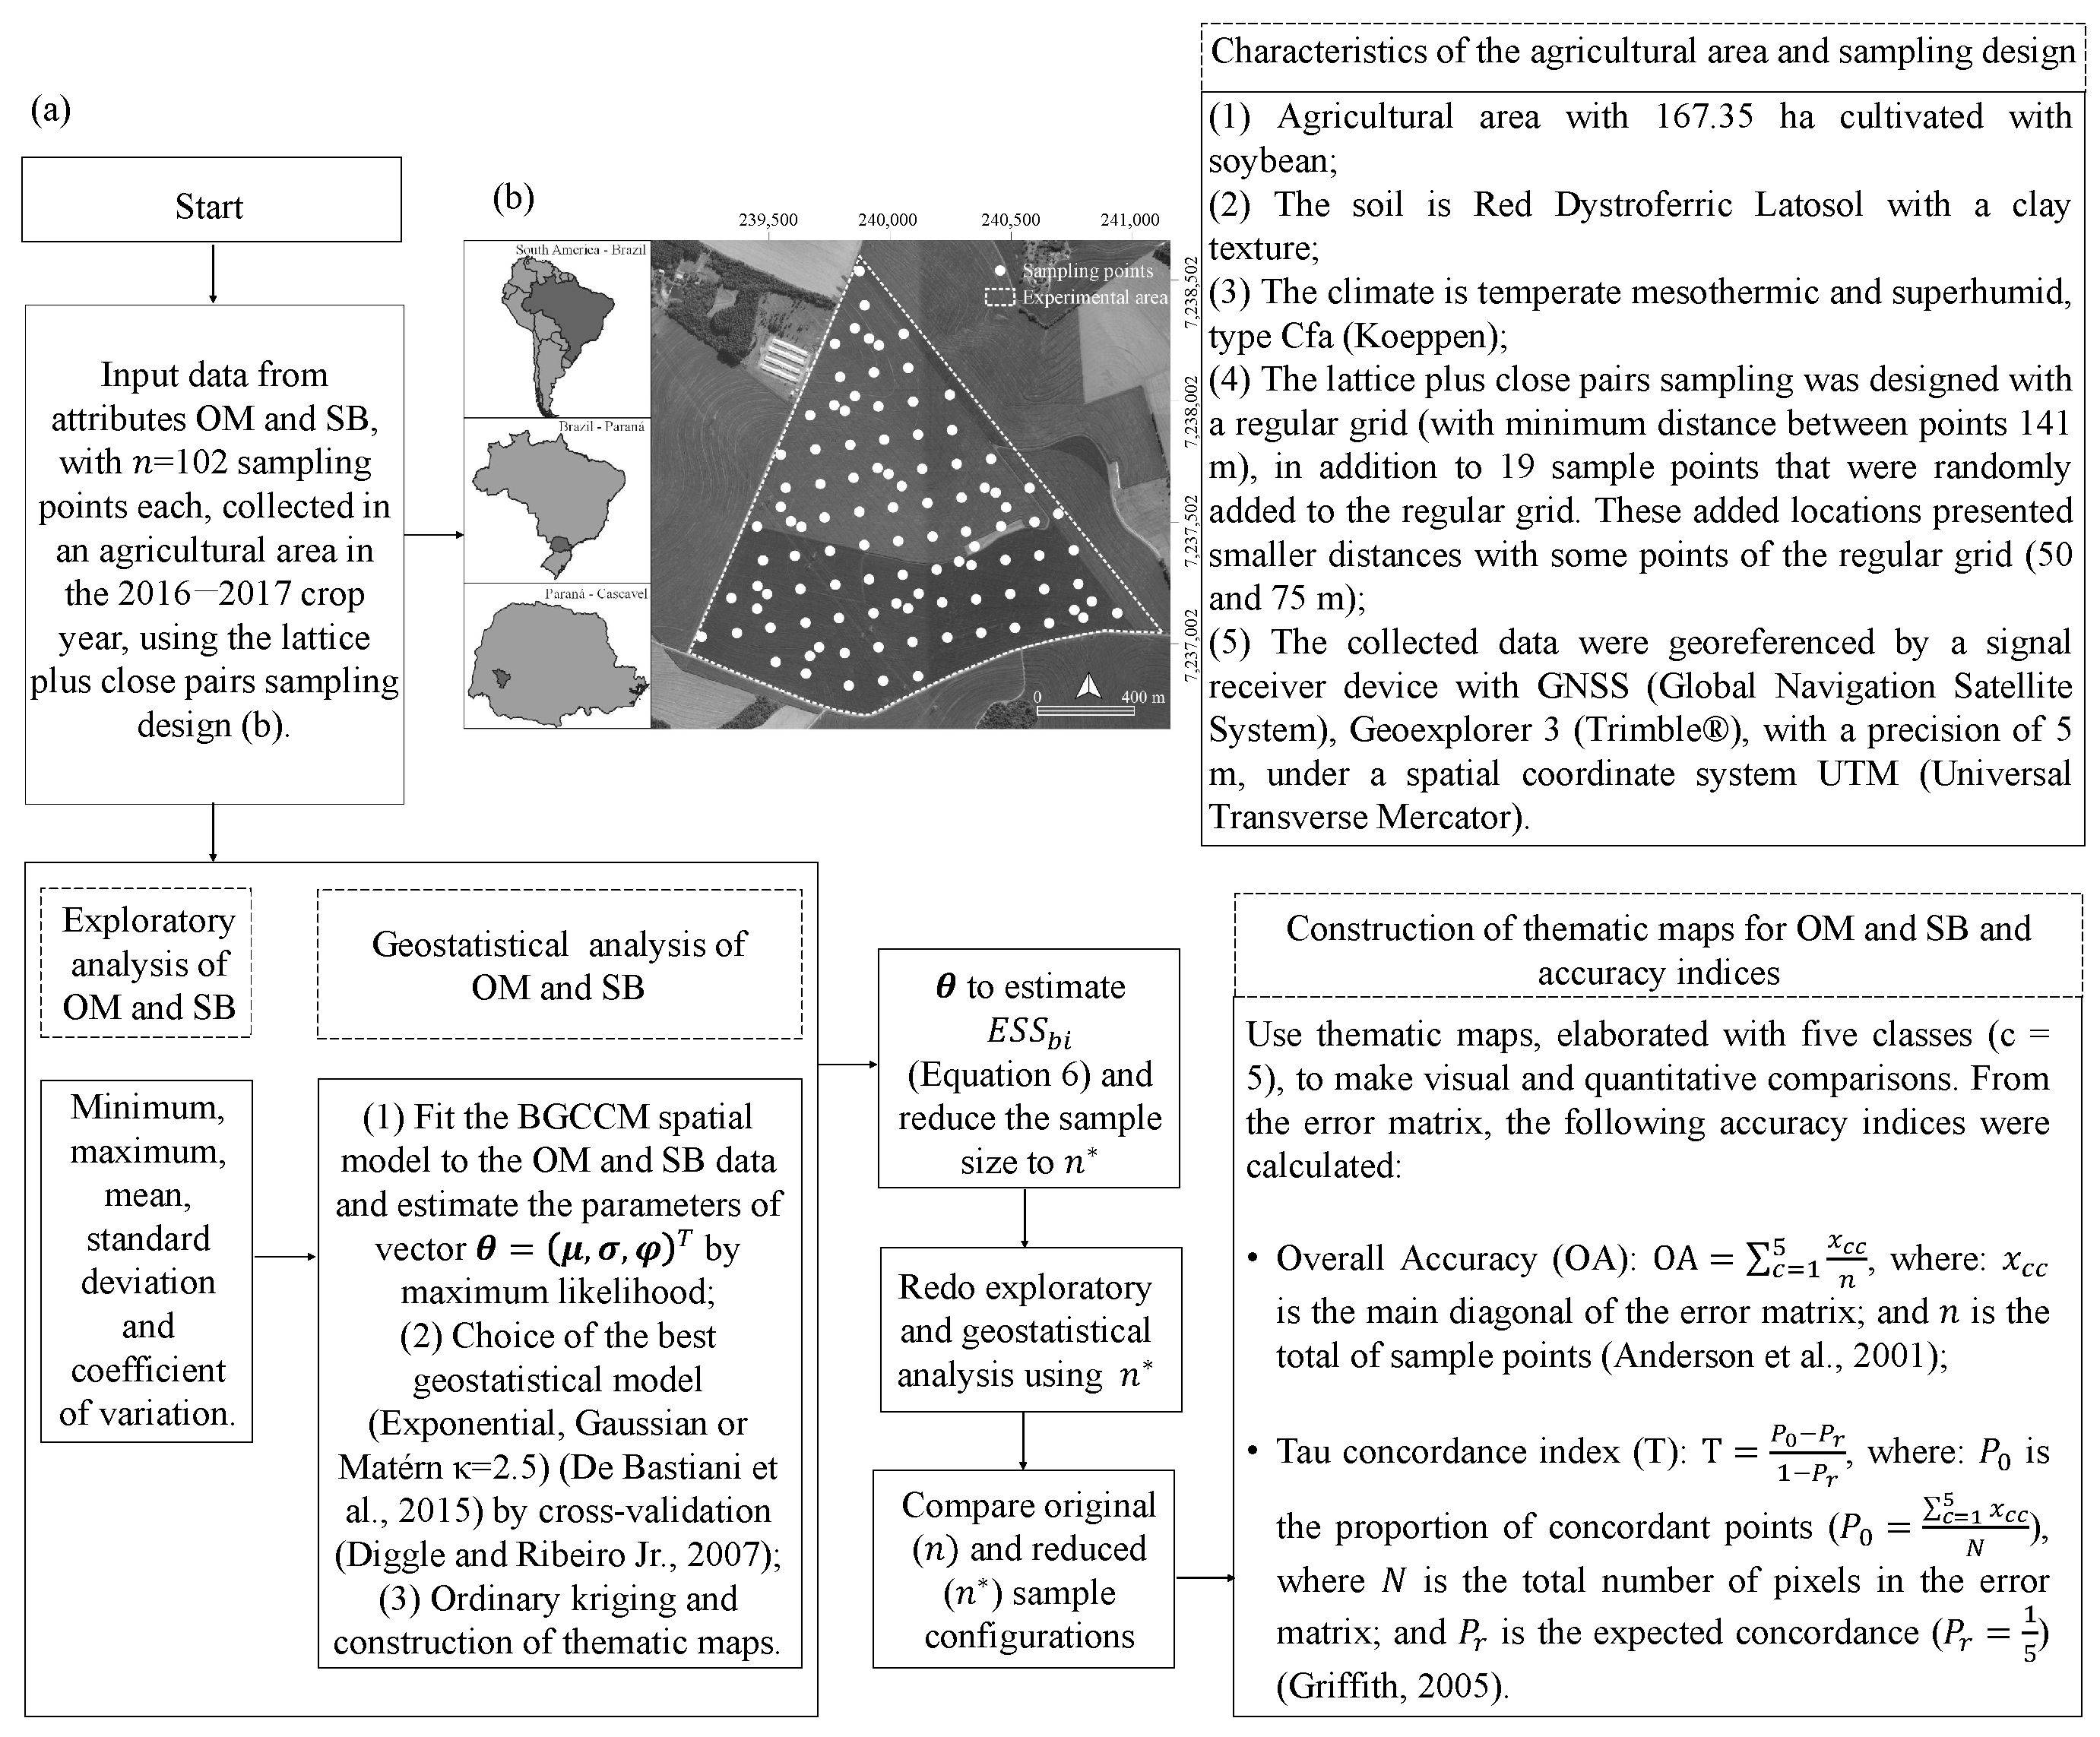
The attributes used were those of organic matter (OM, g dm 3 ) content and sum of bases (SB, cmolc dm 3 ), which represents the sum of exchangeable cations (Ca 2 + , Mg 2 + and K + ) in the soil (Figure 2a). These soil attributes presented spatial dependence, isotropy, and absence of directional trend. The experimental data (Figure 2a,b) were collected in an agricultural area located at Fazenda Três Meninas, which is commercial grain production. In this area, a precision agriculture experiment was developed, with localized application of inputs. The experimental data contain chemical and physical properties of the soil, as well as soybean productivity, and belong to the Spatial Statistics Laboratory at the Western Paraná State University—UNIOESTE, Cascavel, Brazil.
The soil samples (Figure 1b) were obtained considering the following for each point: a collection of five subsamples, from 0 to 20 cm deep in the vicinity of the points, which were mixed and placed in plastic bags, with approximately 500 g, for composition of the representative sample of the plot. The samples were sent to the soil analysis laboratory of Federal University of Technology—Paraná, where the calcium (Ca), magnesium (Mg), and potassium (K) contents were determined according to the methodology described in Pavan [19], with the sum of bases (SB) consisting of the sum of the contents of these cations. The soil organic matter (OM) content was determined according to the method described by Walkey and Black [20].
A thematic map using OM with SB as a covariate was prepared, and the accuracy indices were calculated to analyze similarity of the spatial variability presented by the map with the reduced sample size when compared to the original (Figure 2a). The description and sequence of stages performed in the real data study are presented in the methodological scheme of Figure 2a.
Figure 2. (a) Methodological scheme used in the studies of real data of soil attributes organic matter (OM) and sum of bases (SB). (b) Experimental area and sampling scheme with locations of sampling points in UTM coordinates. References: De Bastiani et al. [21], Diggle and Ribeiro Jr. [15], Anderson et al. [22], and Griffith [2].
Stats 06 00064 g002

2.5. Computational Resources

The routines for calculating E S S b i and for other statistical and geostatistical analyses were developed using the R software, version 4.1.1, [23] and the geoR package [24].

3. Results

3.1. Simulated Data: Properties (i) to (iv) of E S S b i

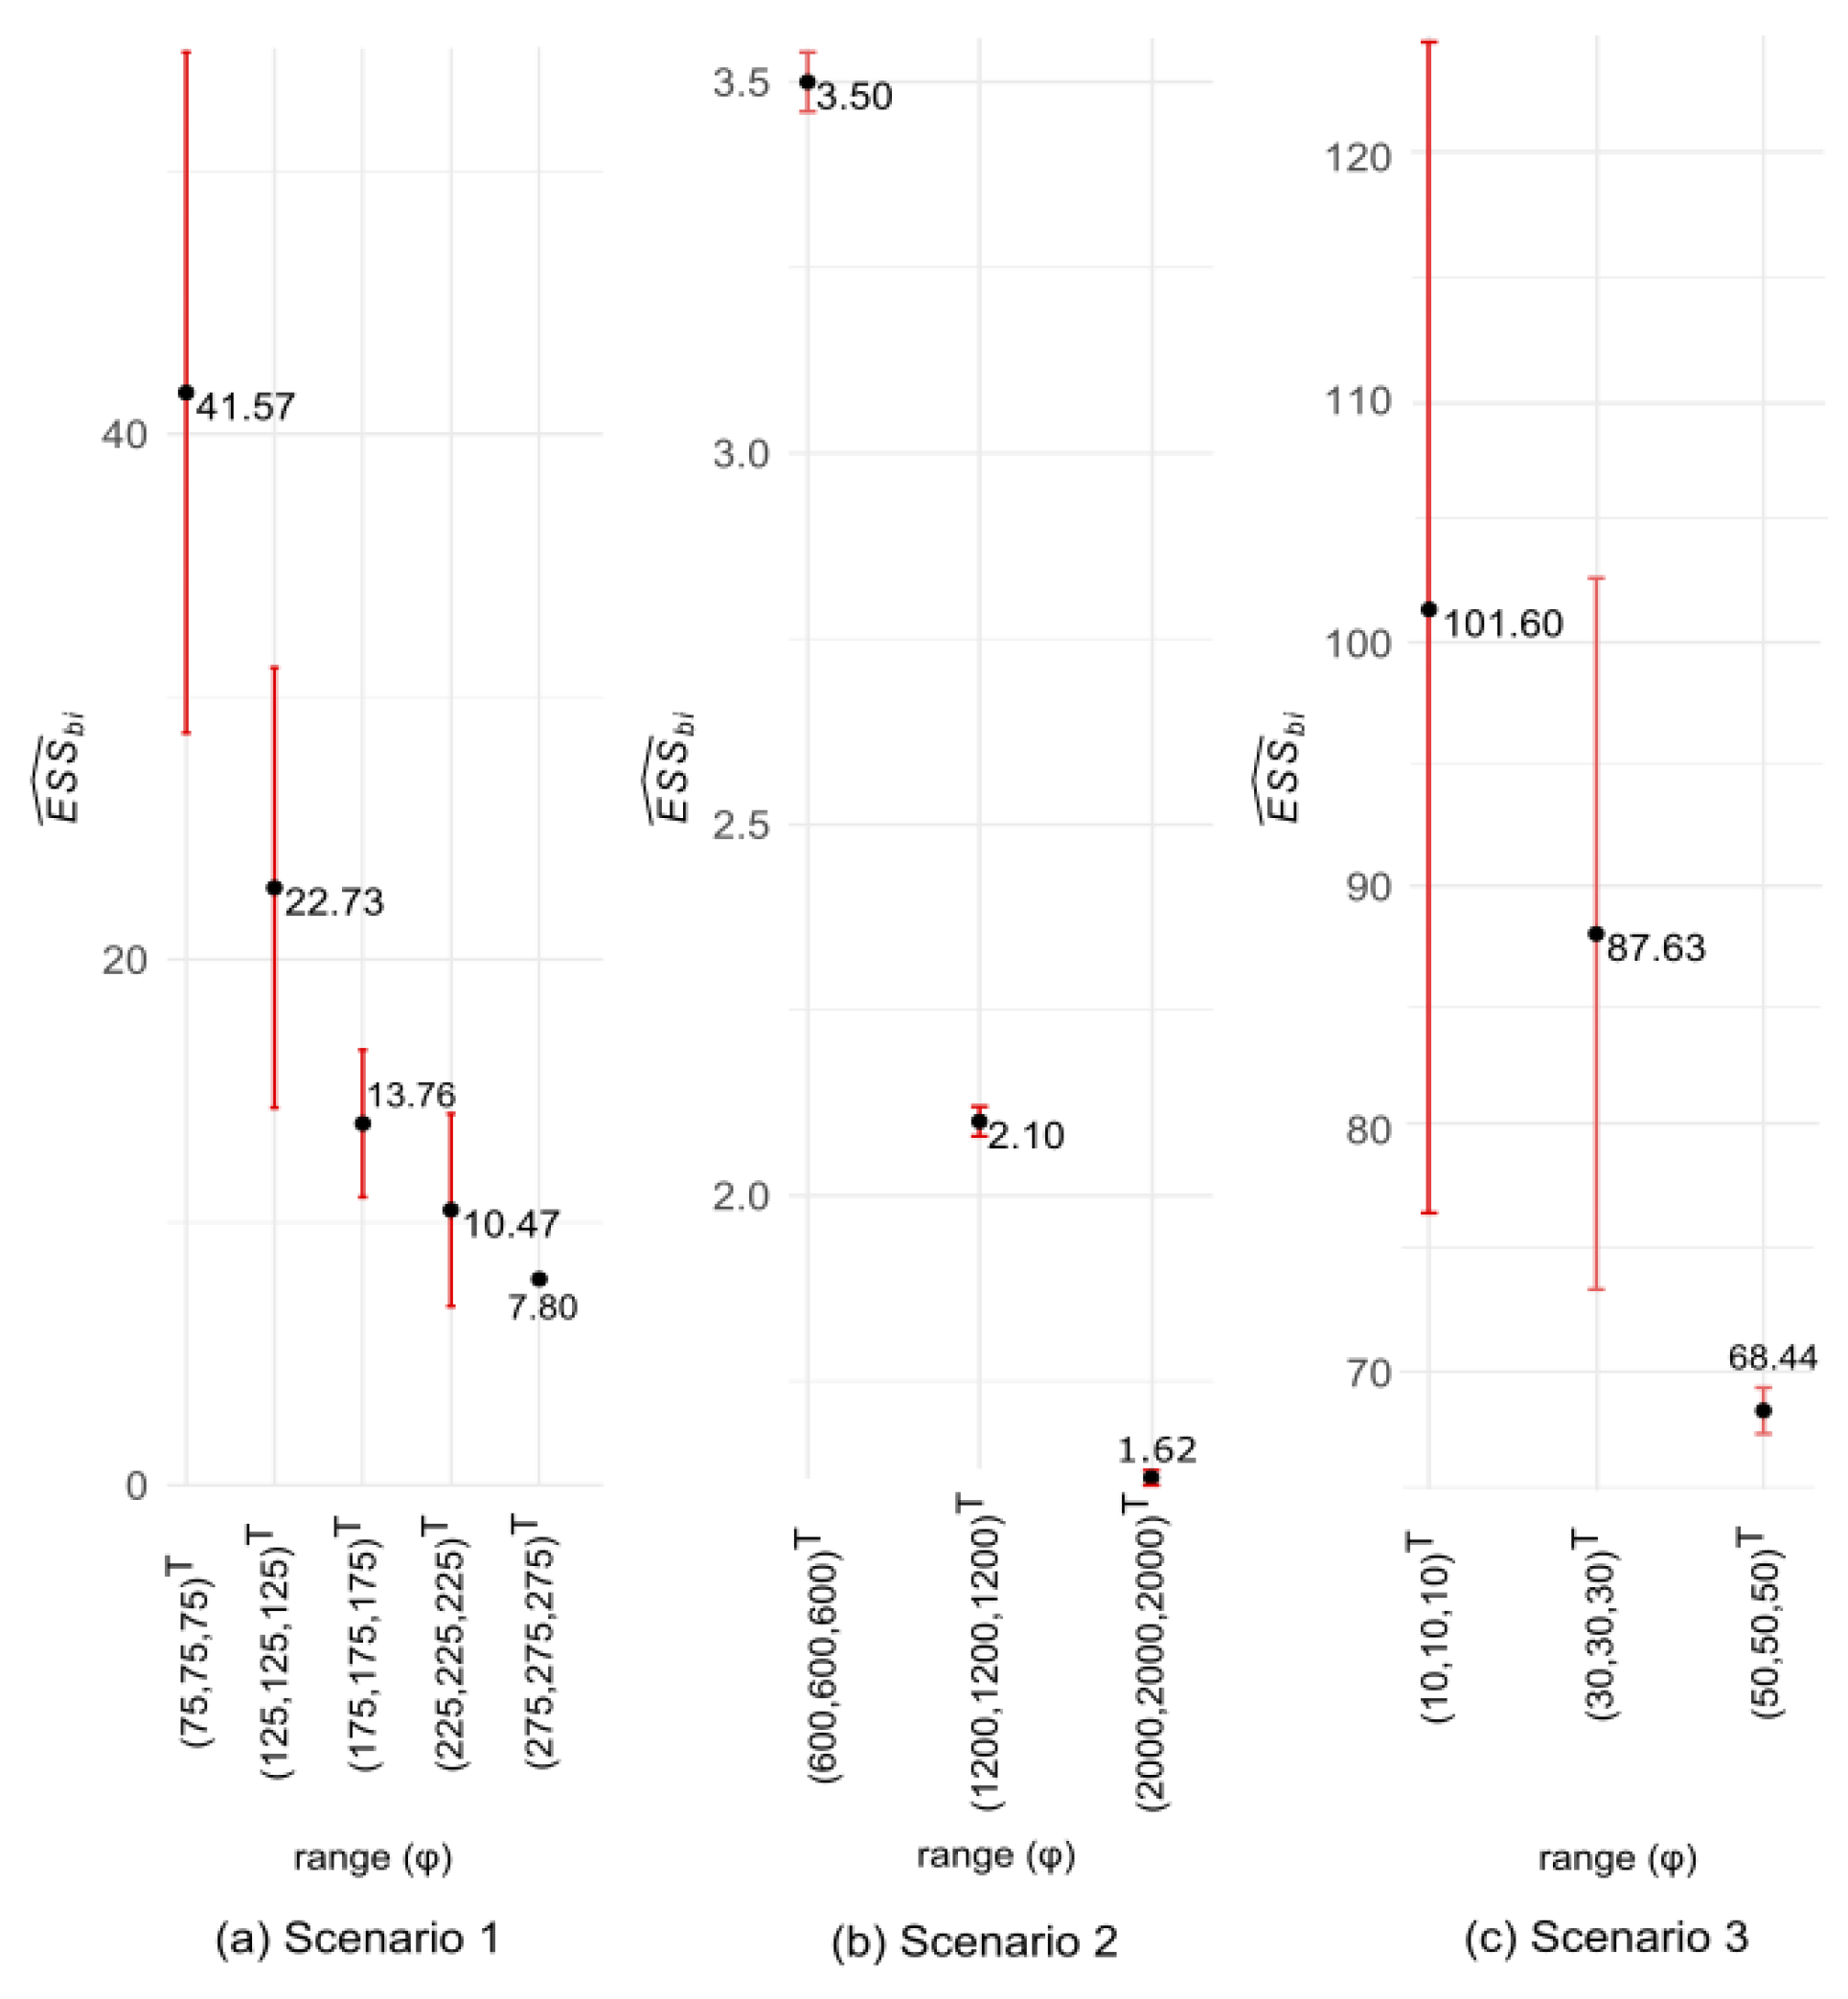
Table 1 presents the estimated mean values of the parameters of the dispersion ( σ ) and range ( φ ) vectors for scenarios 1 to 3, while Figure 3 illustrates the bivariate effective sample size ( E S S b i ) for the same scenarios. In addition to this, the standard deviation of E S S b i and the mean absolute error of the parameters are also displayed, considering the 102 estimates. In scenario 1, as the estimated mean range values (from T1 to T5) increased, the estimated E S S b i mean values decreased (from 41.57 to 7.84). The same trend was observed in scenarios 2 and 3.
For scenario 1, in order to prove reliability of the E S S b i mean estimates obtained with the parameters estimated by BGCCM, the simulated parameters of trials T1 to T5 were used to estimate the “real” E S S b i value. The real E S S b i values were equal to 44.61, 22.64, 14.24, 10.26, and 7.98, using the respective parameters for trials 1 to 5. Meanwhile, the estimated E S S b i means were 41.57, 22.73, 13.76, 10.47, and 7.80 (Figure 3a). Therefore, the real values were quite close to the estimated E S S b i means. In addition to this, the standard deviations of the estimated E S S b i values were low, varying from 12.95 to 0.17 (Figure 3a).
In scenarios 1 and 2, the marked increase in the estimated mean range values caused the E S S ^ b i mean value to fall and approach 1 (from 41.57 to 1.62; Figure 3a,b). On the other hand, in scenario 3, intensely reducing the estimated mean range values (from T3 to T1) provided an increase in the E S S ^ b i mean value (from 68.44 to 101.60; Figure 3c), making it tend to 102, which is the original sample size (n). The standard deviations of E S S ^ b i in scenarios 2 and 3 varied from 24.82 to 0.01, decreasing as the range increased (Figure 3b,c).
The estimated mean values for the dispersion parameters decreased with increasing range, something also evidenced in scenario 2. In general, the individual dispersion parameters ( σ 1 , σ 2 ) were, on average, higher than the common ones ( σ 01 , σ 02 ), especially at shorter distances (Table 1). The mean absolute error (MAE) in scenarios 1 to 3 varied from 4.54 · 10 10 to 5.00 in the dispersion parameter estimates, and from 5.78 to 171.37 in the estimated range parameters (Table 1). It is noteworthy that the errors are proportional to the scale of the simulated parameters; therefore, the dispersion parameters have lower MAEs than the range ones.
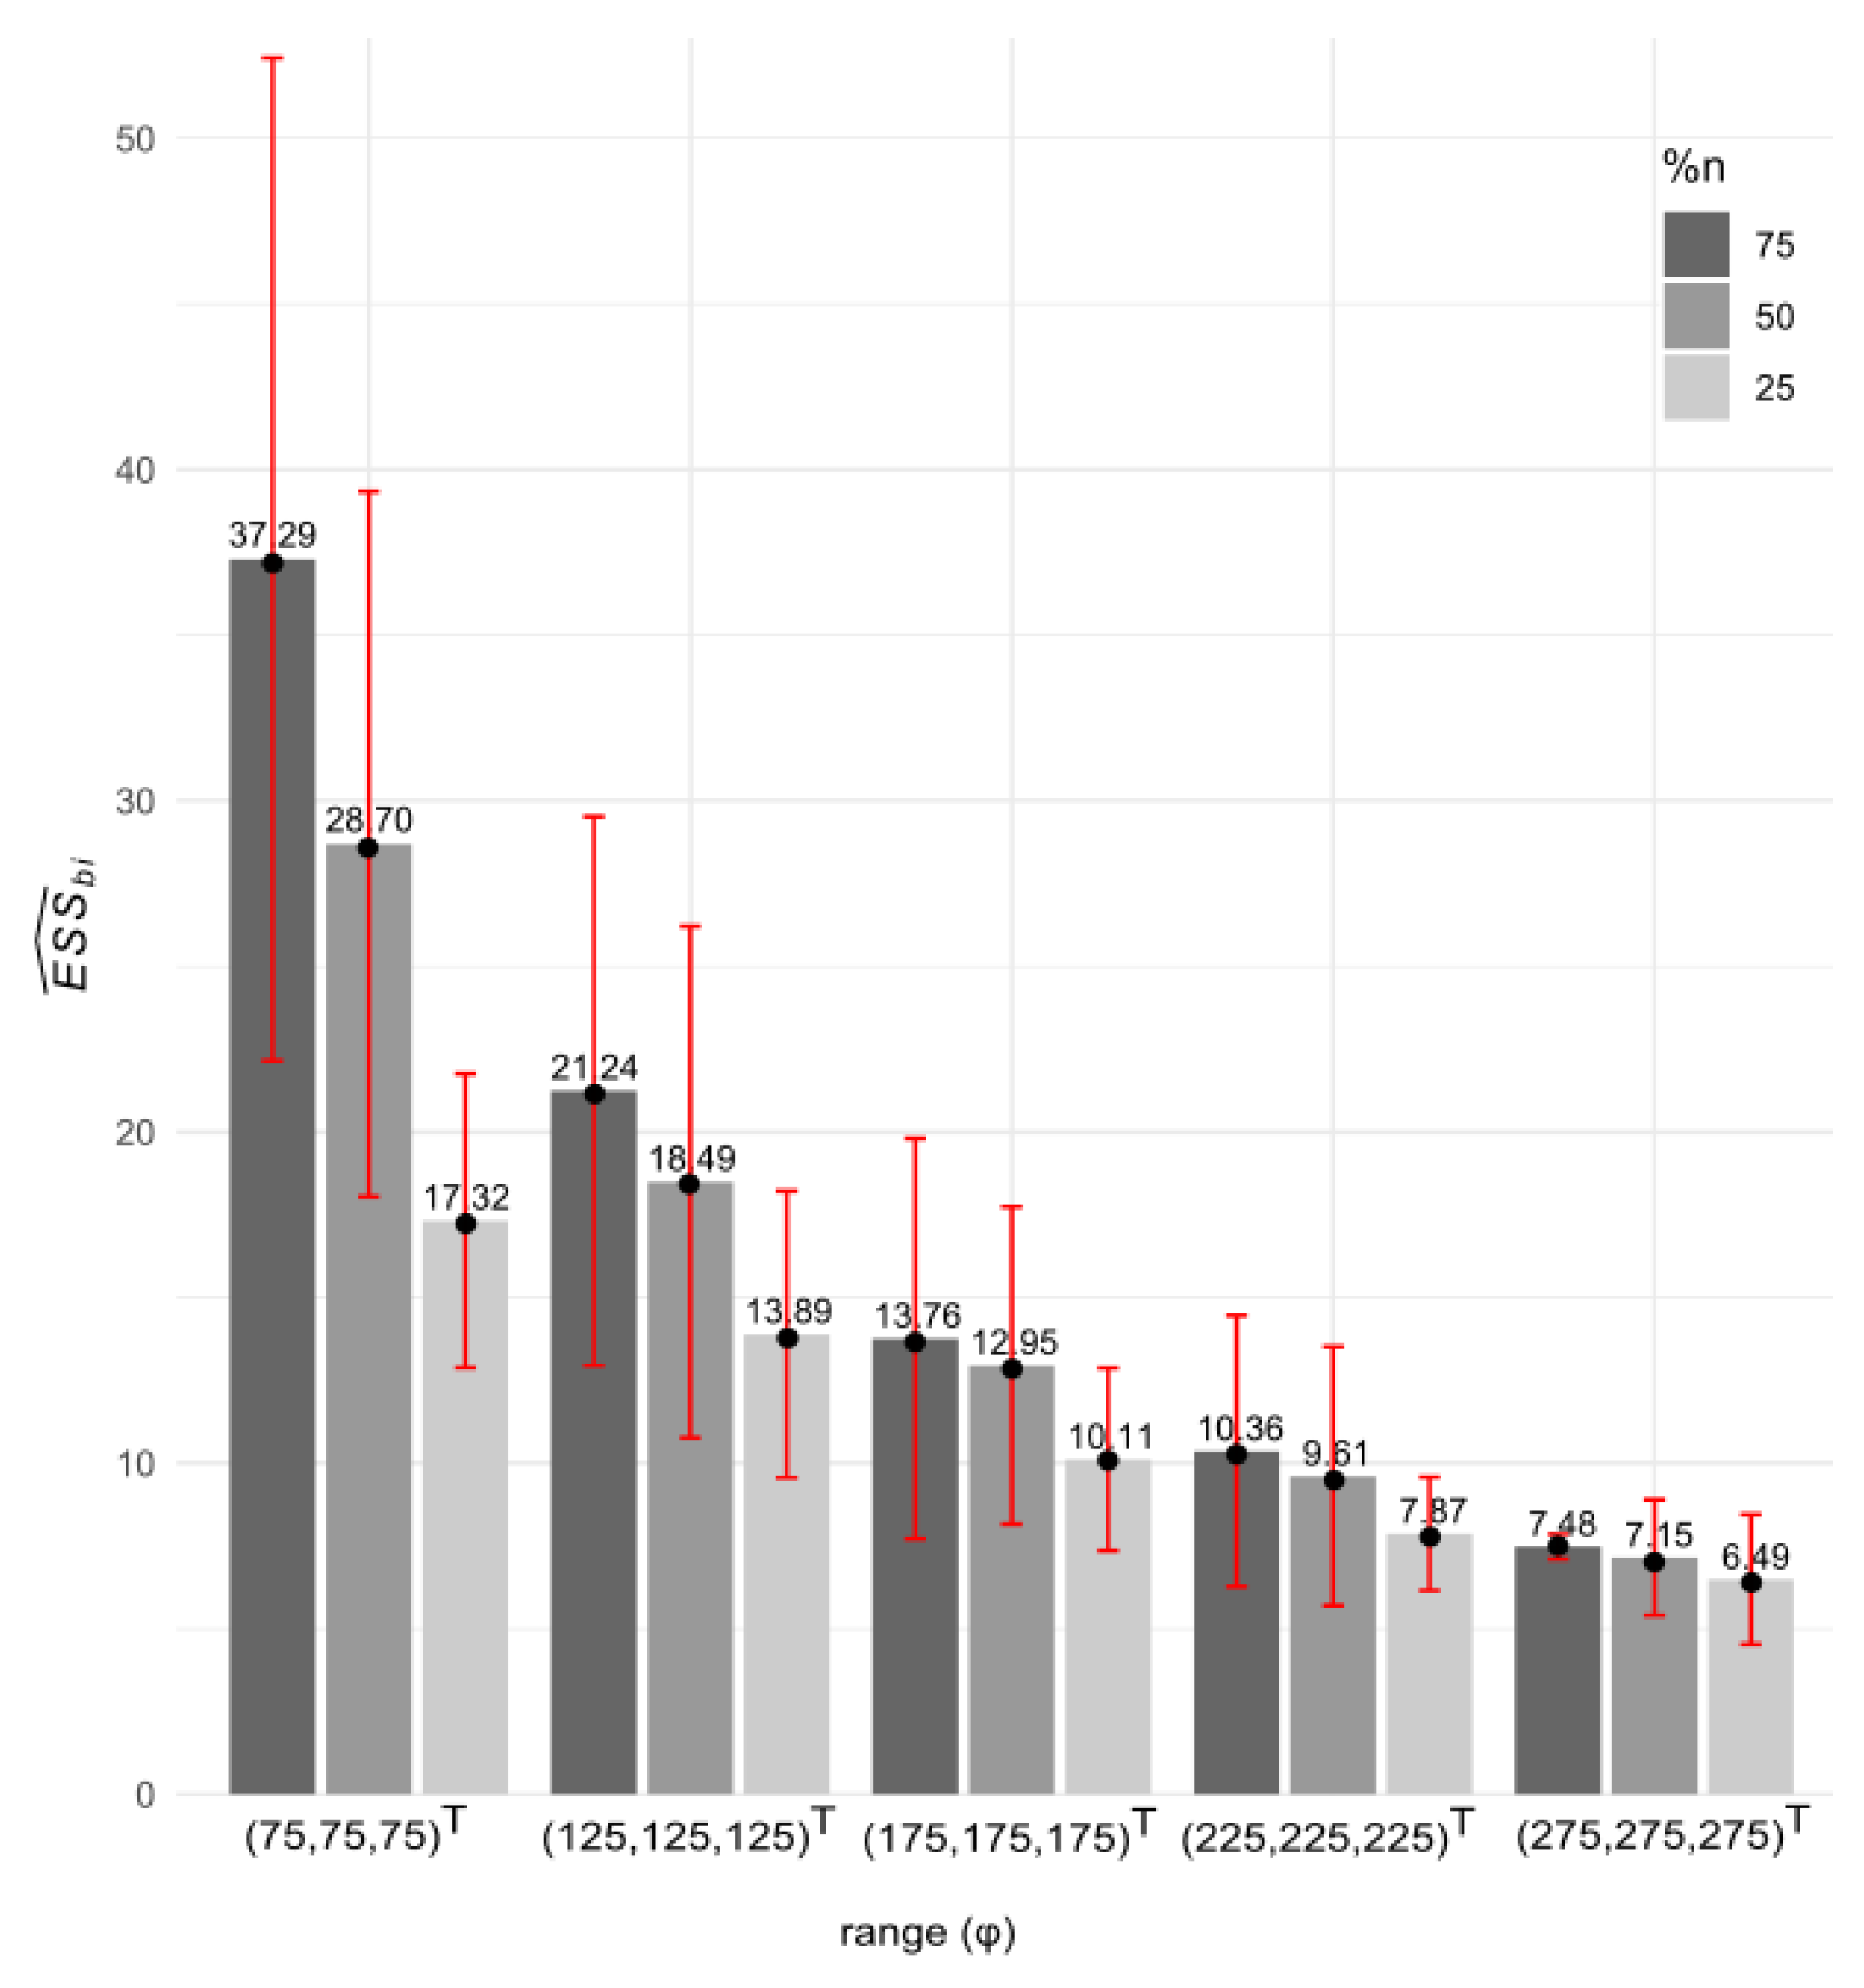
For scenario 4, Figure 4 illustrates the bivariate effective sample size ( E S S b i ) and Table 2 shows the estimated mean values of the dispersion and range parameters for the three different sample sizes, which are proportions of the original sample size (n). In addition to the same results observed in the previous scenarios (Figure 3), regarding the inverse trend between the range vector and the bivariate effective sample size, there was also an increase in the estimated E S S b i mean value and its standard deviation (SD) as points were added to the sample grid: at T1, it was from 17.32 to 37.29 (SD from 4.44 to 15.14); at T2, from 13.89 to 21.24 (SD from 4.33 to 8.29); at T3, from 10.11 to 13.76 (SD from 2.76 to 6.05); at T4, from 7.87 to 13.36 (SD from 1.71 to 4.09); and, finally, it was from 6.49 to 7.48 at T5, where the SD did not increase, due to the proximity of the E S S ^ b i values (Figure 4).
Table 2 evidences that the estimated values of the dispersion and range parameters tended to increase and distance themselves from the real values as the sample size was reduced, especially in trials whose simulated value for the range was higher (T4 and T5). This fact is highlighted by the increase in the MAE values (Table 2).
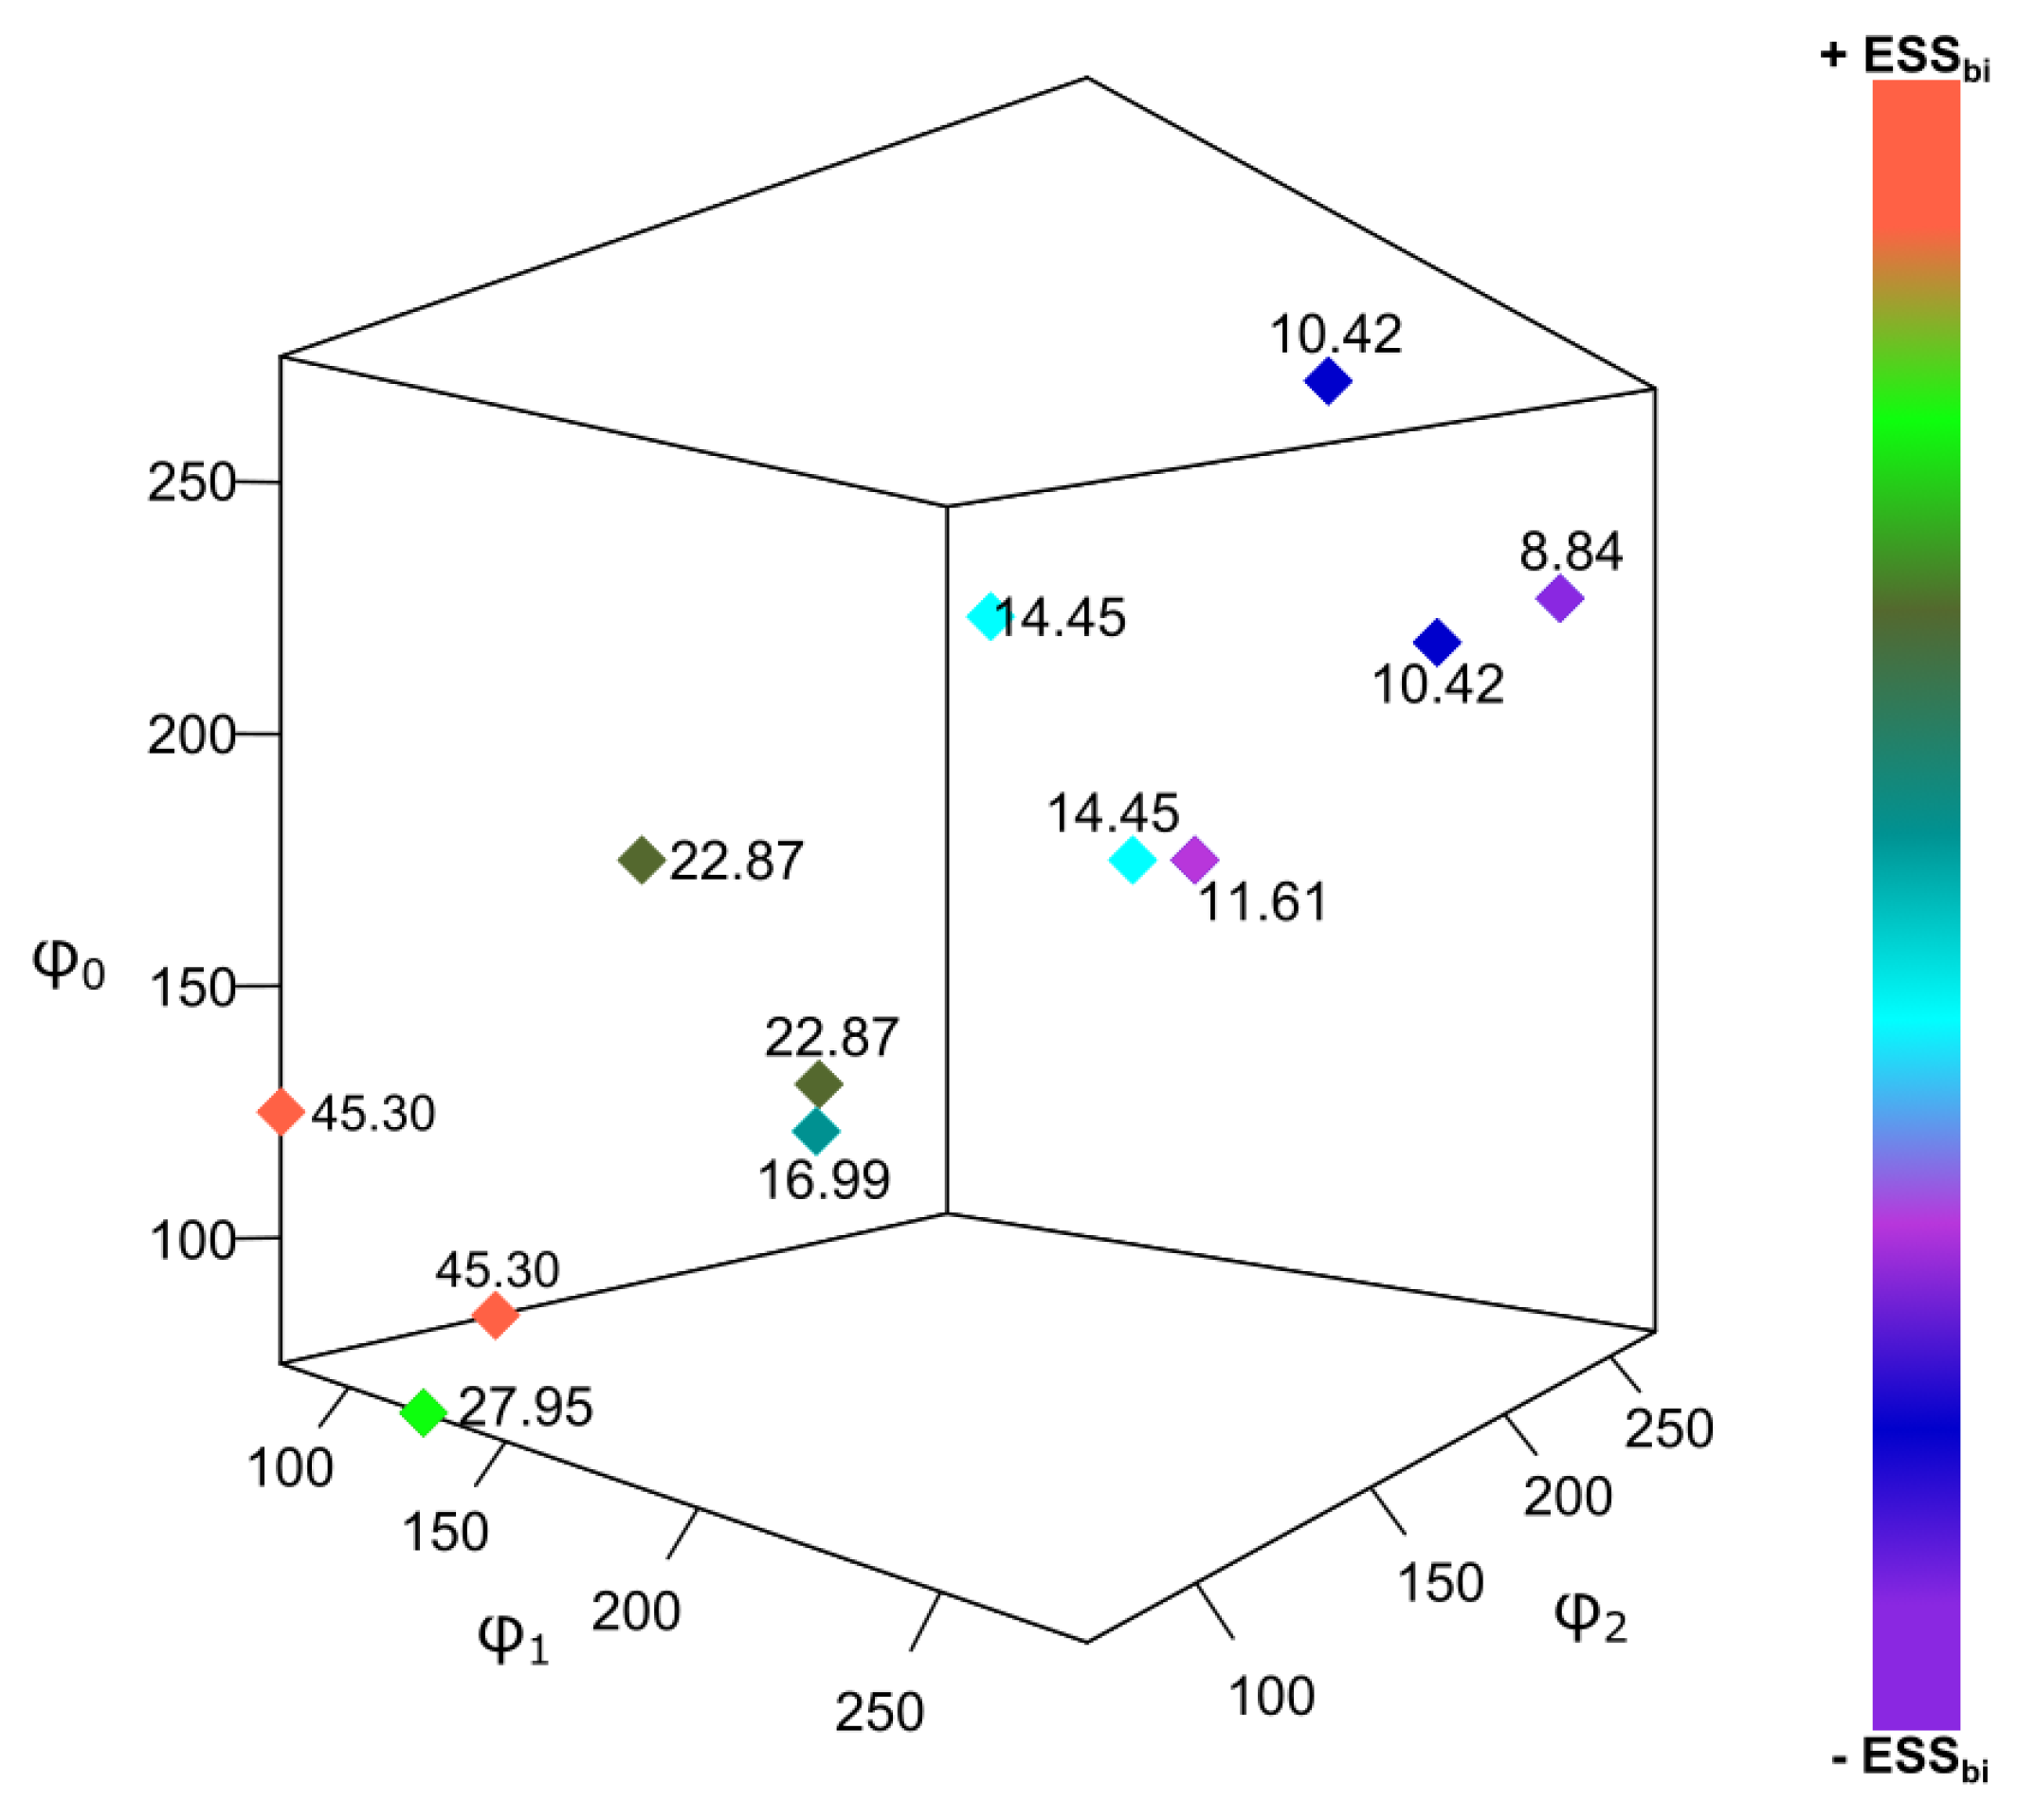
Figure 5 provides a 3D representation of variations in the range parameters and the the estimated E S S b i mean value (scenario 5). In this scenario, regardless of the values of the dispersion parameters, when φ 0 increased (T1: 125 m for T10: 275 m), the estimated E S S b i mean value decreased (from 27.95 to 8.84), as well as the SD (from 2.74 to 0.27) (Figure 5). By fixing the common range and increasing the individual ranges, the estimated E S S b i mean value also decreased (from 45.30 to 10.42), although there was no distinction between the E S S b i values when φ 1 or φ 2 increased individually (Figure 5).
For scenario 5 and trials T1, T4, T7, and T10, Table 3 shows that there was an inverse trend between the simulated common range ( φ 0 ) and the estimated mean values of the dispersion parameters, with distancing from the simulated values of the dispersion parameters and with higher MAEs. In turn, when φ 1 (or φ 2 ) was increased, keeping φ 0 fixed, this caused a small increase of all the estimated mean values of the common dispersion parameters ( σ 01 , σ 02 ) and most of the individual ones ( σ 1 , σ 2 ). Note, as an example of that, trials T11 and T12: the simulated value of φ 0 is fixed at 225 m, and φ 1 is 225 m and 275 m, respectively. At T12, the estimated mean values of σ 01 and σ 1 are equal to 0.003 and 0.49, respectively, while at T11, the same estimated mean values are equal to 0.01 and 0.52. Still, in those trials, the simulated values of φ 2 are 275 m and 225 m, respectively. At T11, the estimated values of σ 02 and σ 2 are equal to 0.33 and 0.49, while at T12, they are equal to 0.34 and 0.53.

3.2. Algebraic Verification of Property (v) E S S b i 1

From Equation (6), we have that E S S b i = 1 T R ( b i ) 1 1 , with 1 being a vector of ones, with 2 n × 1 in dimension, and an R ( b i ) bivariate spatial correlation matrix, with 2 n × 2 n in dimension, given by
R k = 1 , if i = j a i j σ 0 k 2 + σ k 2 , if i j , e
R 1 , 2 = 1 , if i = j b i j σ 01 + σ 02 , if i j ,
for i , j = 1 , , n ; k = 1 , 2 , where a i j are the elements of matrix Σ k related to Y k (Equation (3)), and b i j are the elements of matrix Σ 1 , 2 related to Y 1 , 2 (Equation (4)).
R ( b i ) = R 1 R 1 , 2 R 1 , 2 T R 2 ,
where R k (Equation (7)) and R 1 , 2 (Equation (8)) have a dimension of n × n .
R ( b i ) = [ r u v ] is denoted as a 2 n × 2 n matrix (Equation (9)), with u , v = 1 , , 2 n , and n N . It is known that 4 n 2 4 n 2 n . Using the Cauchy–Schwartz inequality for matrices based on Vallejos and Osorio [4], we have that
4 n 2 1 T R ( b i ) 1 1 T R ( b i ) 1 1 ,
since M A X ( 1 T R b i 1 ) = 4 n 2 , and M A X ( 1 T R b i 1 1 ) = n .
As 0 r u v 1 , we have
1 T R ( b i ) 1 = 4 n + v = 1 2 n u v r u v 4 n + 4 n ( n 1 )
Thus, 1 T R ( b i ) 1 4 n + 4 n 2 4 n = 4 n 2 ; then, 1 T R ( b i ) 1 4 n 2 .
Back to Equation (10), if 1 T R ( b i ) 1 4 n 2 (Equation (11)), then we have that 1 T R ( b i ) 1 1 1 in order for inequality 1 T R ( b i ) 1 4 n 2 to be satisfied. Then,
1 1 T R ( b i ) 1 1 = E S S b i ,
thus showing that E S S b i 1 .

3.3. Application to the Organic Matter and Sum of Bases Data in an Agricultural Area Cultivated with Soybean

The estimated E S S b i value obtained for the OM–SB pair was 42 sample points ( n * ). This represented an approximate 60% reduction in the total number of original sample observations ( n = 102 ).
Table 4 presents descriptive statistics measures of the OM and SB attributes, and Table 5 presents the estimated values of the BGCCM parameters for the OM–SB pair, considering the original sample size n and the reduced sample size n * .
Considering the original sample configuration (n), the OM contents varied from 13.40 to 89.80 g dm 3 , while for SB the variation was between 2.55 and 9.65 cmolc dm 3 (Table 4). On average, the OM (42.14 g dm 3 ) and SB (6.05 cmolc dm 3 ) contents were considered, respectively, very high and high for the soil of the region [25] (Table 4). The OM (24.93%) and SB (22.83%) coefficients of variation (CVs) were close to each other and were considered high [26] (Table 4). For the reduced sample configuration ( n * ), the mean OM (41.87 g dm 3 ) and SB (6.32 cmolc dm 3 ) contents, as well as the OM (21.96%) and SB (24.03%) CVs, maintained their classifications [25,26].
For BGCCM, according to the cross-validation criteria [27], the OM–SB pair was better adjusted by the exponential model (for n) and by the Matérn model with κ = 2.5 (for n * ) (Table 5). For the exponential and Matérn models with κ = 2.5 , the spatial dependence radius ( a t ) is given by 3 φ t and 5.92 φ t , t = 0 , 1 , 2 [15]. Using all sample observations, the estimated values of the spatial dependence radius linked to OM ( a M ) and SB ( a S ) were similar to each other: 806.70 m and 886.81 m, respectively (Table 5). In turn, the common spatial dependence radius ( a 0 ) had a lower estimated value, equal to 237.97 m (Table 5).
With the reduction in the number of sample points, a M (1430.16 m) and a S (1430.51 m) were basically equal to each other, while a 0 had a lower estimated value: 961.15 m (Table 5). As for the Matérn model, the constant multiplied by the range function is larger; consequently, the spatial dependence radius was higher with the reduced configuration when compared to the original one.
With n sample points, the estimated value of the individual dispersion parameter associated with SB ( σ S = 5.78 · 10 7 ) was lower when compared to that of OM ( σ M = 1.91 · 10 2 ) (Table 5). The same occurred with the SB common dispersion parameter ( σ 0 S = 1.87 ), which was lower than the OM value ( σ 0 M = 3.14 ) (Table 5). Using n * sample observations, all estimated values for the dispersion parameters were lower than those of the original configuration, varying from 1.65 · 10 10 to 4.88 · 10 13 (Table 5).
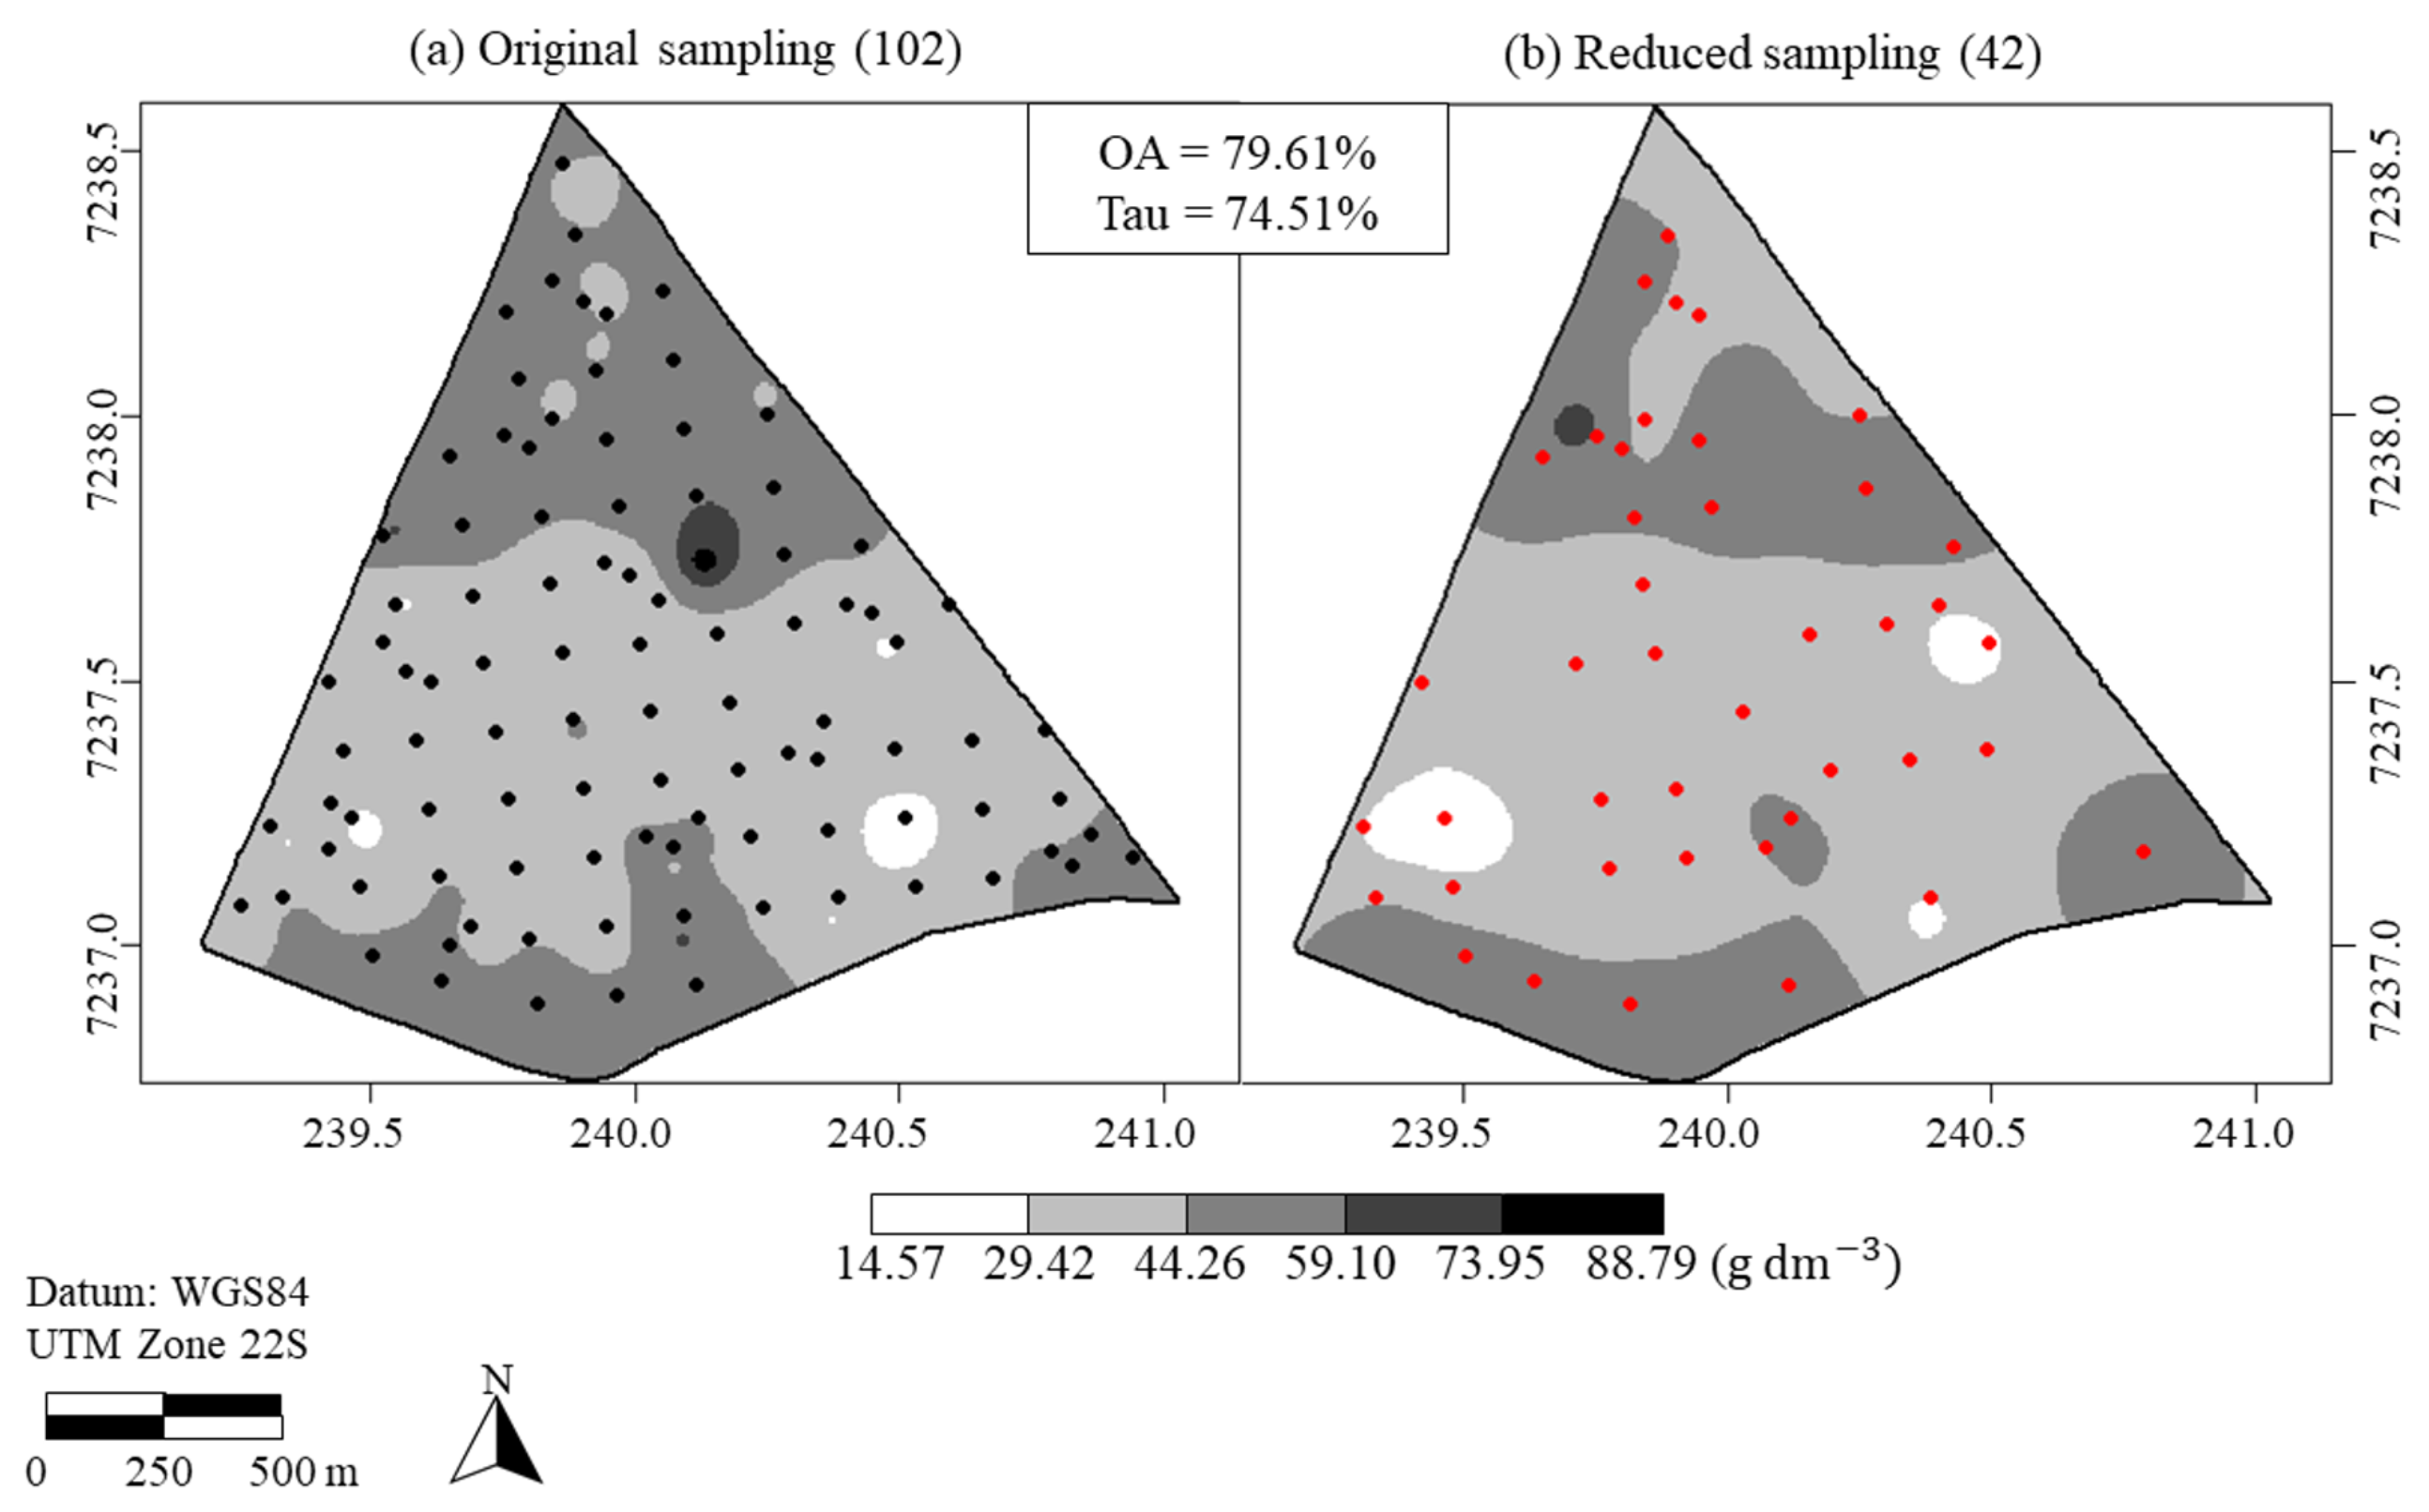
Figure 6 presents the OM spatial variability maps with SB as covariate obtained with the original (a) and reduced (b) sample configurations. Overall accuracy was 79.61%, close to the level considered adequate ( O A 85 % ; [22]). The Tau concordance index was 74.51%, which indicates moderate accuracy across the thematic maps classes ( 67 % T a u < 80 % ; [28]).

4. Discussion

In scenario 1 (Table 1) of the simulation studies, it was verified that, when increasing the estimated mean range values, the estimated E S S b i mean values decreased. These results satisfy property (i), as increasing the spatial dependence radius corresponds to increasing the spatial correlation between the observations.
In scenario 2 (Table 1), it was found that an abrupt increase in range, simulating perfect spatial correlation between the pairs of observations, made the estimated E S S b i mean values tend to 1, satisfying property (ii). On the other hand, in scenario 3 (Table 1), when reducing range intensity, with T1 and T2 having smaller ranges than the shortest distance between most pairs of points and T3 close to the threshold of the shortest distance, the absence of spatial correlation was reproduced, both between the variables ( φ 0 ) and individually ( φ 1 , φ 2 ), and it was verified that the estimated E S S b i mean values increased and tended to the total number of observations (n), which verifies property (iii).
In scenario 4 (Table 2), when using 75% (77 points), 50% (51 points), and 25% (26 points) of the original sample size (102 points), it was observed that the estimated E S S b i value rose according to the increase in the number of points in the sample grid. This shows that E S S b i grows as sample size increases, which satisfies property (iv). Finally, the validity of property (v) was demonstrated algebraically in Section 3.2.
With scenario 5, it was possible to verify the influence of the common range parameter ( φ 0 ) on the estimated E S S b i mean value. This is because, when comparing trials T1 to T4 from scenario 1, when the simulated values for range parameters were from 75 m to 225 m, with trials T2–T3, T5–T6, T8–T9, and T11–T12 from scenario 5, in which the φ 0 values were fixed from 75 m to 225 m, it was observed that the estimated E S S b i values were very similar, respectively. In addition to this, it was verified that there was no difference in the estimated E S S b i value between these pairs of trials from scenario 5.
However, when we compare trials T1–T4 from scenario 1 to, respectively, trials T1, T4, T7, and T10 from scenario 5, it was observed that an increase only in the range of the dependence structure common to both variables represents an average decrease in E S S b i . This occurred mainly when the lowest simulated range values were considered and, in these situations, there were also lower E S S b i standard deviation values. Thus, when there was an increase only in the dependence radius between both variables, there was a decrease in E S S b i .
Therefore, it was verified that the five properties that affect the univariate ESS [4] are also valid for the E S S b i bivariate methodology used in this paper. Regarding the errors in the parameter estimates, it was evident that range is an influential parameter, as the MAE values were higher as the simulated range was increased, considering that the mean estimates of the parameters distanced themselves from the real value. The dispersion parameters, especially σ 01 , proved to be more sensitive and varied more, presenting proportionally higher errors than the range parameters. The estimated E S S b i value varied less as the simulated range increased and as the standard deviation values decreased. An analogous fact was observed by Vallejos and Osorio [4] in the ESS univariate case. In general, considering the influence of range on the E S S b i estimation and that the errors in the estimation of range parameters, given their magnitude, were not high, it can be concluded that there was accuracy in the model estimates. Such being the case, the E S S b i expression was applied to a set of actual data containing the OM–SB pair so that its applicability and feasibility could be analyzed in the practice.
OM is one of the most important variables in relation to soil fertility. This is because in soils where CEC (cation exchange capacity) is very low, as is the case with the region’s soil (latosol), this is the only attribute that increases CEC [13]. The higher the OM, the higher the CEC and the higher the soil’s ability to retain the calcium (Ca 2 + ), magnesium (Mg 2 + ), and potassium (K + ) cations, which together result in SB. As the final product of the geostatistical analyses, the OM spatial variability map with SB as a covariate was obtained.
Although overall accuracy did not reach the level considered adequate for the spatial variability map with the reduced sample configuration when compared to the original (Figure 6), the index has the disadvantage of only considering the main diagonal of the confusion matrix, thus only analyzing the correctly classified pixels [22]. In turn, the Tau index, which showed moderate accuracy between the maps (Figure 6), considers, in addition to the main diagonal, the occurrence possibility of each class, thus providing a precise quantitative measure of the classification accuracy [29].
Visually, it is possible to perceive the similarity between the maps (Figure 6). The third (between 29.42 and 44.26 g dm 3 ) and fourth (between 44.26 and 59.10 g dm 3 ) classes concentrated most of the area in both maps, and the contours that represent spatial variability in the south, center and even north of the agricultural area were kept in the reduced map. It is even possible to observe that, at the northern end of the original map, there are five circular regions belonging to the third class (Figure 6a). With the reduction in the number of sample points, these regions were smoothed and grouped (Figure 6b), similarly to what is observed in the papers by Kestring et al. [30] and Maltauro et al. [31,32], who analyzed different sample sizes in agricultural areas. The same occurred with other smaller regions in the center and south of the area; however, despite becoming larger regions in the reduced map, they maintained the spatial pattern observed in the original map.
In practical terms, this implies that the organic matter content in the soil could be analyzed with only 40% of the sample points that are currently collected in the agricultural area without losing quality in the spatial variability representation. For the producer, this results in continuing to carry out soil management and correction in the appropriate locations, but with less financial investment in soil analysis, which will be reduced in the same proportion as the number of sample points.
This reduction in sample size is justified by property (i) since the estimated spatial model showed that there is spatial correlation, both individually and between the OM and SB variables. There were relevant values of the spatial dependence radius for the common correlation structure and for the individual correlation structures as well. This result is corroborated by the conclusions observed in the simulated data. However, it is important to emphasize that there were relevant differences between the simulated data and the real ones, regarding the values of the mean and dispersion parameters.
The studies using real soil chemical and physical attributes data developed by Griffith [2,3], Canton et al. [10], and Vallejos and Acosta [4], in which the univariate ESS was calculated, obtained sample reductions that varied from 30% to 61%. In the studies by Canton et al. [11] and Vallejos and Acosta [6], in which multivariate ESS values were estimated, the sample reductions varied between 21% and 60%. However, although the maximum reduction obtained in these studies corroborated that of this paper (60%), the correlation structure between two variables was constructed using a matrix of spatial weights or crossed semivariogram. In none of them was the BGCCM model used, which makes it possible to model the spatial dependence structure in a bivariate way, adding the spatial correlation between the variables and within each variable, a characteristic that, according to Griffith [2], should be considered in the joint treatment of two spatially correlated variables.
Thus, the results obtained in this research show that the bivariate ESS can be used in other experiments already implemented that involve the analysis and existence of spatial variability between variables, to redesign the sampling design, reducing the sample size.
The focus of this paper was to study the bivariate ESS assuming the Gaussian spatial model. However, El Saeiti et al. [33] and Sheng et al. [34] described that an incorrect assumption of the probability distribution is one of the causes of the model misspecification and that there is a need for studies beyond the linear models. Future research could extend the studies about the bivariate ESS and relax the normality assumption, considering other probability distributions, which were studied in the univariate geostatistical context, such as the one using the elliptical spatial linear model [21], reparametrized Student’s t spatial model [35], or Birnbaum–Saunders spatial regression model [36].

5. Conclusions

The simulation studies were satisfactory in verifying that the properties that affect the univariate ESS are also valid for E S S b i , in addition to enabling additional conclusions about the influence of common range ( φ 0 ) on the E S S b i value.
When applying the methodology to the OM–SB soil attribute pair, it was verified that 60% of the observations of the original sample size carried redundant information. In addition, after sample resizing, spatial variability of the OM map with SB as covariate presented significant visual similarity, in addition to exhibiting a Tau concordance index that ensured moderate similarity between the maps with the original and reduced sample sizes.
The simulated studies and application of the E S S b i methodology to real data, using BGCCM, evidenced both its practical and theoretical relevance. This is because, in addition to maintaining all the characteristics and properties of the univariate methodology, E S S b i considers and is influenced by the spatial correlation of each of two georeferenced variables, as well as by the spatial correlation between them.
Moreover, E S S b i also provides better practical feasibility, as it is a proposal that reduces the number of soil samples that are sent to the laboratory for two variables simultaneously, maintaining the quality of the thematic maps obtained. Thus, it is possible to reduce expenses in soil monitoring if bivariate geostatistical models are used for problems with spatially correlated chemical attributes.
For future papers, it would be feasible and interesting to combine the sample redesign obtained with the new sample size estimated by E S S b i with an optimization process for selecting the location of these sample points. Additionally, it would also be interesting to extend the E S S b i approach to models with other probability distributions, beyond the Gaussian distribution.

Author Contributions

Conceptualization and methodology, L.E.D.C., T.C.M., L.P.C.G. and M.A.U.-O.; software, L.E.D.C. and T.C.M.; validation, L.E.D.C. and T.C.M.; investigation, L.E.D.C. and T.C.M.; data curation, L.E.D.C.; writing—original draft preparation, L.E.D.C.; writing—review and editing, L.E.D.C. and L.P.C.G.; visualization, L.E.D.C.; supervision, L.E.D.C., L.P.C.G. and M.A.U.-O.; project administration, L.E.D.C.; funding acquisition, L.P.C.G. and M.A.U.-O. All authors have read and agreed to the published version of the manuscript.

Funding

This research was funded by the Coordination for the Improvement of Higher Education Personnel (CAPES), Funding Code 001.

Institutional Review Board Statement

Not applicable.

Informed Consent Statement

Not applicable.

Data Availability Statement

The data is collected from a private agricultural area, which we manage through a partnership arrangement. Therefore, data sharing is not feasible.

Acknowledgments

The authors are grateful for the funding received from the Coordination for the Improvement of Higher Education Personnel (CAPES), Funding Code 001, National Council for Scientific and Technological Development (CNPq), and the Spatial Statistics Laboratory—UNIOESTE, Brazil.

Conflicts of Interest

The authors declare no conflict of interest.

Abbreviations

The following abbreviations are used in this manuscript:
BCRMBivariate coregionalization model
BGCCMBivariate Gaussian common component model
CECCation exchange capacity
CaCalcium
ESSEffective sample size
E S S b i Bivariate effective sample size
KPotassium
MAEMean absolute error
MgMagnesium
OAOverall accuracy
OMOrganic matter
SBSum of bases
SDStandard deviation

References

  1. Brus, D.J. Spatial Sampling with R; Chapman and Hall/CRC: Boca Raton, FL, USA, 2022. [Google Scholar] [CrossRef]
  2. Griffith, D.A. Effective geographic sample size in the presence of spatial autocorrelation. Ann. Am. Assoc. Geogr. 2005, 95, 740–760. [Google Scholar] [CrossRef]
  3. Griffith, D.A.; Plant, R.E. Statistical Analysis in the Presence of Spatial Autocorrelation: Selected Sampling Strategy Effects. Stats 2022, 5, 1334–1353. [Google Scholar] [CrossRef]
  4. Vallejos, R.; Osorio, F. Effective sample size of spatial process models. Spat. Stat. 2014, 9, 66–92. [Google Scholar] [CrossRef]
  5. Vallejos, R.; Osorio, F.; Bevilacqua, M. Spatial Relationships between Two Georeferenced Variables: With applications in R; Springer: New York, NY, USA, 2020. [Google Scholar] [CrossRef]
  6. Vallejos, R.; Acosta, J. The effective sample size for multivariate spatial processes with an application to soil contamination. Nat. Resour. Model. 2021, 34, e12322. [Google Scholar] [CrossRef]
  7. Watson, S.I. Efficient design of geographically-defined clusters with spatial autocorrelation. J. Appl. Stat. 2021, 49, 3300–3318. [Google Scholar] [CrossRef]
  8. Acosta, J.; Osorio, F.; Vallejos, R. Effective sample size for line transect sampling models with an application to marine macroalgae. J. Agric. Biol. Environ. Stat. 2016, 21, 407–425. [Google Scholar] [CrossRef]
  9. Acosta, J.; Vallejos, R. Effective sample size for spatial regression models. Electron. J. Stat. 2018, 12, 3147–3180. [Google Scholar] [CrossRef]
  10. Canton, L.E.D.; Guedes, L.P.C.; Uribe-Opazo, M.A.; Assumpção, R.A.B.; Maltauro, T.C. Sampling redesign of soil penetration resistance in spatial t-Student models. Span. J. Agric. Res. 2021, 19, e0202. [Google Scholar] [CrossRef]
  11. Canton, L.E.D.; Guedes, L.P.C.; Uribe-Opazo, M.A. Reduction of sample size in the soil physical-chemical attributes using the multivariate effective sample size. J. Agric. Stud. 2021, 9, 357–376. [Google Scholar] [CrossRef]
  12. Canton, L.E.D.; Maltauro, T.C.; Guedes, L.P.C.; Uribe-Opazo, M.A. Bivariate spatial correlation between soil attributes and soybean productivity in an agricultural area with Dystroferric Red Latosol. Aust. J. Crop Sci. 2023, 17, 20–27. [Google Scholar] [CrossRef]
  13. Mengel, K.; Kirkby, E. Principles of Plant Nutrition, 5th ed.; Kluwer Academic Publishers: Boston, MA, USA, 2001. [Google Scholar]
  14. Fonseca, B. Um Estudo Sobre Estimação e Predição em Modelos Geoestatísticos Bivariados. Master’s Thesis, Escola Superior de Agricultura Luiz de Queiroz, São Paulo, Brazil, 2008. [Google Scholar] [CrossRef]
  15. Diggle, P.J.; Ribeiro, P.J., Jr. Model Based Geostatistics; Springer: New York, NY, USA, 2007. [Google Scholar]
  16. Fanshawe, T.R.; Diggle, P.J. Bivariate geostatistical modelling: A review and an application to spatial variation in radon concentrations. Environ. Ecol. Stat. 2012, 19, 139–160. [Google Scholar] [CrossRef]
  17. Righetto, A. Avaliação de Modelos Geoestatísticos Multivariados. Master’s Thesis, Escola Superior de Agricultura Luiz de Queiroz, São Paulo, Brazil, 2012. [Google Scholar] [CrossRef]
  18. Cressie, N.A.C. Statistics for Spatial Data, 1st ed.; John Wiley & Sons: New York, NY, USA, 1993. [Google Scholar] [CrossRef]
  19. Pavan, M.; Bloch, M.; Zempulski, H.; Miyazawa, M.; Zocoler, D. Manual de Análise Química de Solo e Controle de Qualidade; Instituto Agronômico do Paraná: Londrina, Brazil, 1992. [Google Scholar]
  20. Walkley, A.; Black, I.A. An examination of the Degtjareff method for determining soil organic matter and a proposed modification of the chromic acid titration method. Soil Sci. 1934, 37, 29–38. [Google Scholar] [CrossRef]
  21. De Bastiani, F.; Cysneiros, A.F.J.; Cysneiros, A.H.M.; Uribe-Opazo, M.A.; Galea, M. Infuence diagnostics in elliptical spatial linear models. Test 2015, 24, 322–340. [Google Scholar] [CrossRef]
  22. Anderson, J.R.; Hardy, E.E.; Roach, J.T.; Witmer, R.E. A Land Use and Land Cover Classification System for Use with Remote Sensor Data; U.S. Government Print Office: Washington, DC, USA, 2001.
  23. R Development Core Team. R: A Language and Environment for Statistical Computing, version 4.1.1; R Foundation for Statistical Computing: Vienna, Austria, 2022; Available online: https://www.r-project.org/ (accessed on 1 November 2022).
  24. Ribeiro, P.J., Jr.; Diggle, P.J. geoR: A Package for Geostatistical Analysis. R-NEWS 2001, 1, 15–18. [Google Scholar]
  25. SBCS-NEPAR. Manual de Adubação e Calagem para o Estado do Paraná; Sociedade Brasileira de Ciência do Solo—Núcleo Estadual do Paraná: Curitiba, Brazil, 2017. [Google Scholar]
  26. Gomes, F.P.; Garcia, C. Estatística Aplicada a Experimentos Agronômicos e Florestais; Fundação de Estudos Agrários Luiz de Queiroz: Piracicaba, Brazil, 2002. [Google Scholar]
  27. Faraco, M.A.; Uribe-Opazo, M.A.; Silva, E.A.A.; Johann, J.A.; Borssoi, J.A. Seleção de modelos de variabilidade espacial para elaboração de mapas temáticos de atributos físicos do solo e produtividade da soja. Rev. Bras. Ciênc. Solo 2008, 32, 463–476. [Google Scholar] [CrossRef]
  28. Krippendorff, K. Content Analysis: An Introduction to Its Methodology; Sage Publications: Beverly Hills, CA, USA, 2004. [Google Scholar]
  29. Ma, Z.; Redmond, R.L. Tau coefficients for accuracy assessment of classification of remote sensing data. Photogramm. Eng. Remote Sens. 1995, 61, 435–439. [Google Scholar]
  30. Kestring, F.B.; Guedes, L.P.C.; De Bastiani, F.; Uribe-Opazo, M.A. Comparação de mapas temáticos de diferentes grades amostrais para a produtividade da soja. Eng. Agric. 2015, 35, 733–743. [Google Scholar] [CrossRef]
  31. Maltauro, T.C.; Guedes, L.P.C.; Uribe-Opazo, M.A.; Canton, L.E.D. A genetic algorithm for resizing and sampling reduction of non-stationary soil chemical attributes optimizing spatial prediction. Span. J. Agric. Res. 2021, 19, e0210. [Google Scholar] [CrossRef]
  32. Maltauro, T.C.; Guedes, L.P.C.; Uribe-Opazo, M.A.; Canton, L.E.D. Spatial multivariate optimization for a sampling redesign with a reduced sample size of soil chemical properties. Rev. Bras. Cienc. Solo 2023, 47, e0220072. [Google Scholar] [CrossRef]
  33. El Saeiti, R.; García-Fiñana, M.; Hughes, D.M. The effect of random-effects misspecification on classification accuracy. Int. J. Biostat. 2021, 18, 279–292. [Google Scholar] [CrossRef]
  34. Sheng, Y.; Yang, C.; Curhan, S.; Curhan, G.; Wang, M. Analytical methods for correlated data arising from multicenter hearing studies. Stat. Med. 2022, 41, 5335–5348. [Google Scholar] [CrossRef] [PubMed]
  35. Schemmer, R.C.; Uribe-Opazo, M.A.; Galea, M.; Assumpção, R.A.B. Spatial variability of soybean yield through a reparameterized t-student model. Eng. Agríc. 2017, 37, 760–770. [Google Scholar] [CrossRef]
  36. Garcia-Papani, F.; Leiva, V.; Uribe-Opazo, M.A.; Aykroyd, R.G. Birnbaum-Saunders spatial regression models: Diagnostics and application to chemical data. Chemom. Intell. Lab. Syst. 2018, 177, 114–128. [Google Scholar] [CrossRef]
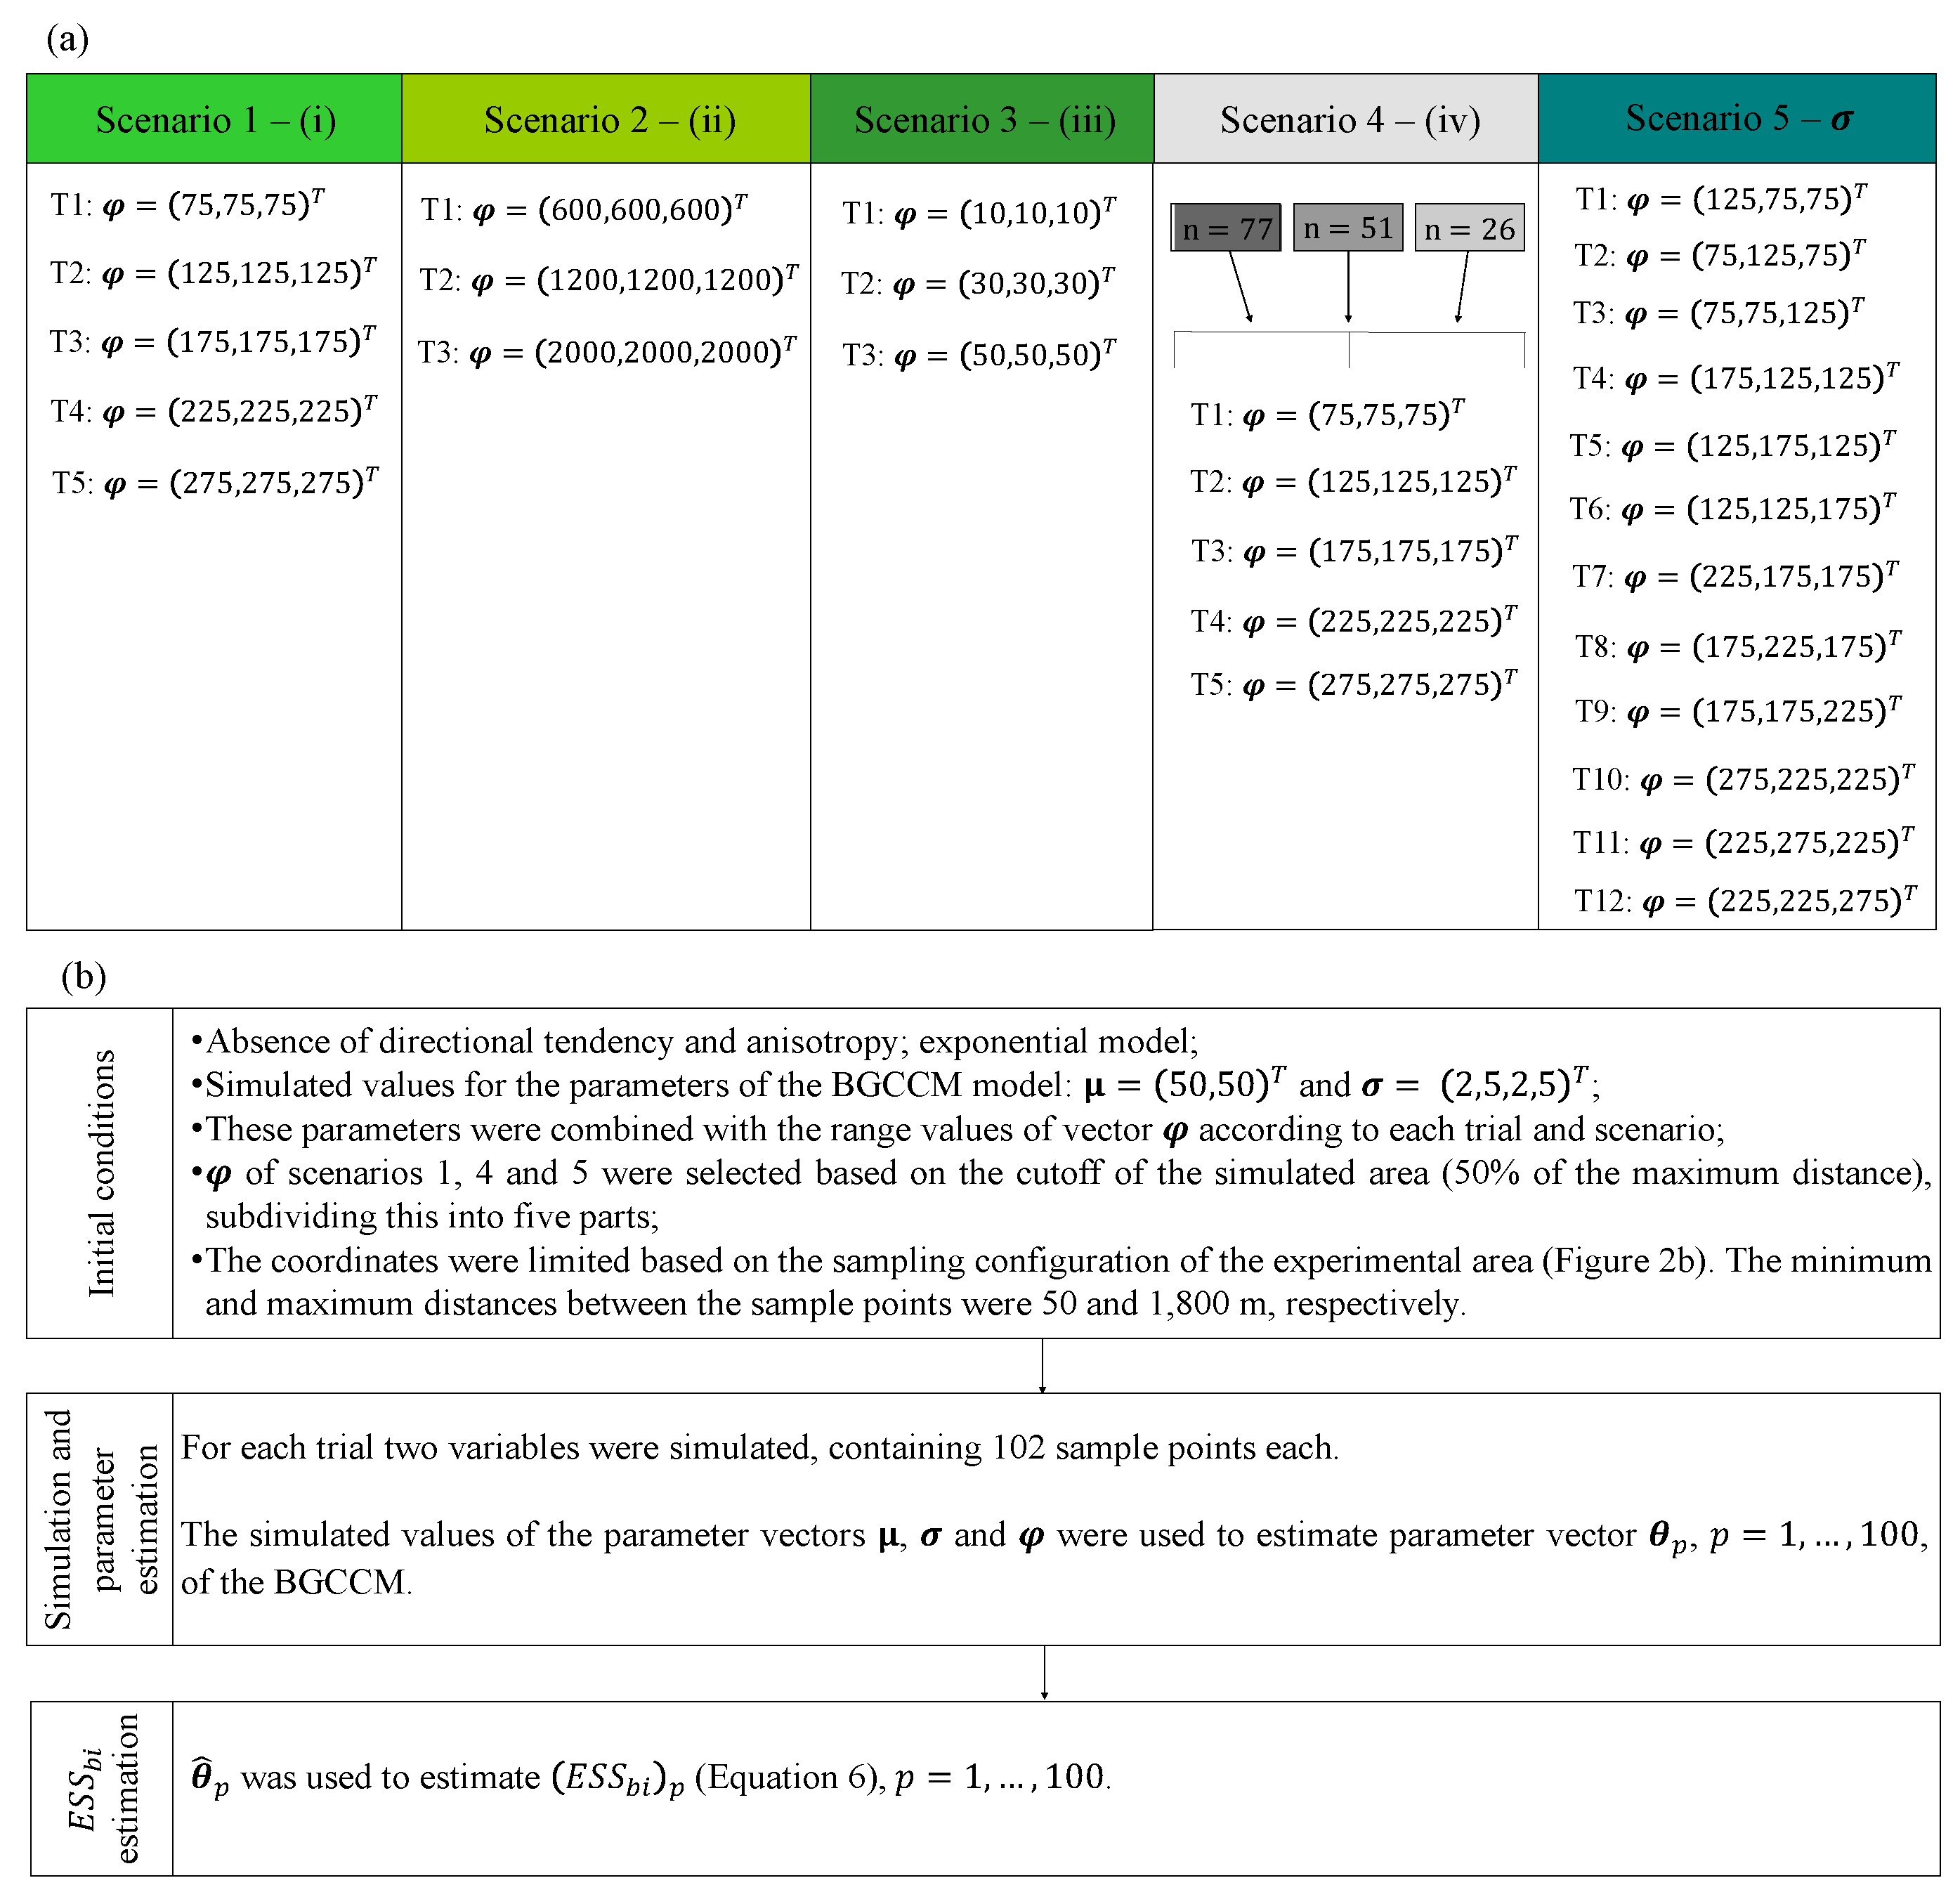
Figure 1. (a) Scenarios and values used for range vector φ = ( φ 0 , φ 1 , φ 2 ) T in each trial. (b) Methodological scheme used in the simulation studies. μ = ( μ 1 , μ 2 ) T : vector of means; σ = ( σ 01 , σ 1 , σ 02 , σ 2 ) T : dispersion vector; T1–T12: trials 1 to 12.
Stats 06 00064 g001
Figure 3. Bivariate effective sample size ( E S S b i ^ ) mean value (represented by black circles) and standard deviation (SD) (represented by red intervals) for scenarios 1 (a), 2 (b), and 3 (c).
Stats 06 00064 g003
Figure 4. Bivariate effective sample size ( E S S b i ^ ) mean value (represented by black circles) and standard deviation (SD) (represented by red intervals) for scenario 4. The different columns (in gray gradient) represent different sample sizes proportional to n.
Stats 06 00064 g004
Figure 5. Bivariate effective sample size ( E S S b i ^ ) mean value varying range parameters φ 0 , φ 1 , and φ 2 for scenario 5. The color scale shows the lowest E S S b i ^ mean values (in purple) to the highest E S S b i ^ mean values (in orange).
Stats 06 00064 g005
Figure 6. Organic matter spatial variability maps with sum of bases as covariate: (a) Original sample configuration with 102 sampling points (in black), (b) reduced sample configuration with 42 sampling points (in red). Estimated values of the overall accuracy (OA) and Tau concordance index (Tau).
Stats 06 00064 g006
Table 1. Estimated mean values of the dispersion ( σ 01 ^ , σ 1 ^ , σ 02 ^ , σ 2 ^ ) and range ( φ 0 ^ , φ 1 ^ , φ 2 ^ ) parameters of the bivariate effective sample size in scenarios 1 to 3. In parentheses are the mean absolute errors (MAEs) of the parameter estimates. The different shades of green represent the different scenarios (1–3).
Trial: ( φ 0 , φ 1 , φ 2 ) T σ 01 ^ σ 1 ^ σ 02 ^ σ 2 ^ φ 0 ^ φ 1 ^ φ 2 ^
Scenario 1T1: ( 75 , 75 , 75 ) T 0.476.192.584.2992.3568.9774.50
(1.66)(1.60)(2.29)(2.40)(27.59)(18.58)(39.63)
T2: ( 125 , 125 , 125 ) T 0.464.791.334.27137.05118.65120.47
(1.76)(2.28)(2.13)(2.77)(32.28)(28.25)(26.61)
T3: ( 175 , 175 , 175 ) T 0.101.790.381.93186.79170.75178.63
(1.90)(3.80)(1.93)(4.02)(19.60)(17.37)(13.46)
T4: ( 225 , 225 , 225 ) T 0.010.370.170.55233.12221.01232.02
(1.98)(4.63)(2.02)(4.78)(15.39)(11.20)(11.14)
T5: ( 275 , 275 , 275 ) T 2.40 · 10 11 1.95 · 10 10 5.72 · 10 11 1.70 · 10 10 285.98278.75279.28
(≈2.00)(≈5.00)(≈2.00)(≈5.00)(11.24)(5.78)(7.05)
Scenario 2T1: ( 600 , 600 , 600 ) T 2.11 · 10 11 3.19 · 10 10 2.28 · 10 10 4.54 · 10 10 629.67607.81608.75
(≈2.00)(≈5.00)(≈2.00)(≈5.00)(30.58)(12.21)(10.94)
T2: ( 1200 , 1200 , 1200 ) T 4.16 · 10 12 1.83 · 10 10 2.17 · 10 10 2.81 · 10 10 1278.031208.101213.74
(≈2.00)(≈5.00)(≈2.00)(≈5.00)(79.63)(14.33)(17.08)
T3: ( 2000 , 2000 , 2000 ) T 1.55 · 10 10 1.87 · 10 9 1.34 · 10 10 1.59 · 10 9 2171.382004.291987.34
(≈2.00)(≈5.00)(≈2.00)(≈5.00)(171.37)(20.99)(37.28)
Scenario 3T1: ( 10 , 10 , 10 ) T 1.145.830.636.276.7512.7714.63
(1.49)(1.59)(1.65)(1.65)(7.60)(9.79)(12.01)
T2: ( 30 , 30 , 30 ) T 1.405.431.355.6332.5029.4329.86
(1.57)(1.62)(2.20)(2.35)(16.53)(12.45)(14.21)
T3: ( 50 , 50 , 50 ) T 0.586.152.953.9654.8946.4346.58
(1.66)(1.62)(2.65)(2.75)(18.62)(17.76)(23.72)
“≈” symbolizes approximate values.
Table 2. Estimated mean values of the dispersion ( σ 01 ^ , σ 1 ^ , σ 02 ^ , σ 2 ^ ) and range ( φ 0 ^ , φ 1 ^ , φ 2 ^ ) parameters of the bivariate effective sample size in scenario 4. In parentheses are the mean absolute errors (MAEs) of the parameter estimates. The different shades of gray highlight the proportions of n used in scenario 4.
Trial: ( φ 0 , φ 1 , φ 2 ) T σ 01 ^ σ 1 ^ σ 02 ^ σ 2 ^ φ 0 ^ φ 1 ^ φ 2 ^
Scenario 4n = 77 (75%)T1: ( 75 , 75 , 75 ) T 0.625.922.464.4097.2365.6866.01
(1.75)(1.66)(2.31)(2.54)(31.01)(23.74)(34.59)
T2: ( 125 , 125 , 125 ) T 0.524.862.123.70170.52113.90110.08
(1.88)(2.11)(2.35)(2.90)(62.89)(36.66)(37.20)
T3: ( 175 , 175 , 175 ) T 0.162.440.972.15194.16164.61168.25
(1.91)(3.33)(2.22)(3.69)(36.29)(25.51)(30.24)
T4: ( 225 , 225 , 225 ) T 0. 050.870.530.90232.28217.20230.40
(1.97)(4.35)(2.08)(4.49)(21.83)(18.97)(14.37)
T5: ( 275 , 275 , 275 ) T 0.020.240.080.33289.19275.68278.30
(1.97)(4.78)(2.02)(4.85)(15.77)(11.37)(9.47)
n = 51 (50%)T1: ( 75 , 75 , 75 ) T 0.465.832.823.91101.3660.8267.28
(1.63)(1.78)(2.58)(2.68)(36.02)(30.88)(40.64)
T2: ( 125 , 125 , 125 ) T 0.374.972.443.54157.02105.98116.42
(1.76)(2.04)(2.54)(2.81)(52.68)(33.94)(59.92)
T3: ( 175 , 175 , 175 ) T 0.223.301.262.96197.72158.68165.81
(1.88)(2.88)(2.26)(3.32)(40.72)(36.87)(41.87)
T4: ( 225 , 225 , 225 ) T 0.041.610.781.66242.50209.03230.76
(1.95)(3.81)(2.05)(4.23)(38.88)(25.06)(33.36)
T5: ( 275 , 275 , 275 ) T 0.021.020.621.10306.30257.65283.61
(1.98)(4.16)(2.21)(4.24)(44.91)(28.52)(30.98)
n = 26 (25%)T1: ( 75 , 75 , 75 ) T 0.865.442.684.02110.1753.4365.70
(1.69)(2.05)(2.63)(2.51)(45.52)(39.03)(41.70)
T2: ( 125 , 125 , 125 ) T 0.764.352.403.51145.37102.18106.91
(1.77)(2.13)(2.38)(2.95)(50.08)(49.69)(58.19)
T3: ( 175 , 175 , 175 ) T 0.433.602.122.44205.45149.13178.98
(1.91)(2.67)(2.62)(3.45)(55.01)(52.66)(84.78)
T4: ( 225 , 225 , 225 ) T 0.123.071.252.36255.67190.27187.42
(1.88)(2.93)(2.16)(3.34)(48.83)(60.70)(54.76)
T5: ( 275 , 275 , 275 ) T 0.112.531.232.04303.92236.79255.68
(1.91)(3.29)(2.31)(3.52)(59.50)(62.18)(61.41)
Table 3. Estimated mean values of the dispersion ( σ 01 ^ , σ 1 ^ , σ 02 ^ , σ 2 ^ ) for different range parameters φ = ( φ 0 , φ 1 , φ 2 ) T of the bivariate effective sample size in scenario 5. In parentheses are the mean absolute errors (MAEs) of the dispersion parameter estimates. The shade of green represents scenario 5.
Trial: ( φ 0 , φ 1 , φ 2 ) T σ 01 ^ σ 1 ^ σ 02 ^ σ 2 ^
Scenario 5T1: ( 125 , 75 , 75 ) T 0.385.681.784.52
(1.71)(1.85)(2.17)(2.43)
T2: ( 75 , 125 , 75 ) T 0.296.392.164.62
(1.70)(1.66)(2.13)(2.08)
T3: ( 75 , 75 , 125 ) T 0.256.372.734.24
(1.76)(1.41)(1.93)(1.94)
T4: ( 175 , 125 , 125 ) T 0.252.761.082.54
(1.85)(3.07)(2.25)(3.53)
T5: ( 125 , 175 , 125 ) T 0.353.800.813.59
(1.78)(2.81)(2.05)(3.12)
T6: ( 125 , 125 , 175 ) T 0.245.521.035.07
(1.76)(2.00)(1.76)(2.31)
T7: ( 225 , 175 , 175 ) T 0.141.230.461.34
(2.01)(4.18)(2.03)(4.33)
T8: ( 175 , 225 , 175 ) T 0.091.620.361.72
(1.90)(3.93)(1.99)(4.20)
T9: ( 175 , 175 , 225 ) T 0.052.200.612.15
(1.94)(3.68)(2.01)(3.92)
T10: ( 275 , 225 , 225 ) T 0.020.360.280.50
(1.97)(4.67)(2.09)(4.84)
T11: ( 225 , 275 , 225 ) T 0.010.520.330.49
(1.98)(4.73)(2.10)(4.68)
T12: ( 225 , 225 , 275 ) T 0.0030.490.340.53
(1.99)(4.61)(2.05)(4.73)
Table 4. Exploratory analysis (minimum, maximum, mean, SD, CV) of organic matter contents (OM, g dm 3 ) and sum of bases (SB, cmolc dm 3 ) using the original and reduced sample configurations.
Sample SizeAttributesMinimumMaximumMeanSDCV (%)
n = 102 OM13.4089.8042.1410.5124.93
SB2.559.656.051.3822.83
n * = 42 OM22.7857.6341.879.1921.96
SB2.559.656.321.5224.03
SD: Standard deviation; CV   =   100 S D m e a n : coefficient of variation.
Table 5. Geostatistical analysis with estimated values of the BGCCM parameters for the OM–SB pair, using the original (n = 102) and reduced ( n * = 42 ) sample configurations.
Geostatistical Model
(Sample Configuration)
μ M ^ μ S ^ σ 0 M ^ σ M ^ σ 0 S ^ σ S ^ φ 0 ^
( a 0 ^ )
φ M ^
( a M ^ )
φ S ^
( a S ^ )
Exponential
(Original)
43.956.143.141.91 · 10 2 1.875.78 · 10 7 79.43
(237.97)
269.28
(806.70)
296.02
(886.81)
Matérn 2.5
(Reduced)
51.222.814.88 · 10 13 7.94 · 10 11 1.65 · 10 10 1.96 · 10 11 162.39
(961.15)
241.63
(1430.16)
241.69
(1430.51)
μ M ^ ( μ S ^ ), σ M ^ ( σ S ^ ), φ M ^ ( φ S ^ ), and a M ^ ( a S ^ ): the estimated values of the mean, dispersion, range function, and spatial dependence radius of the OM content (SB) parameters; σ 0 M ^ ( σ 0 S ^ ), φ 0 ^ , and a 0 ^ : estimated values of the dispersion parameters of OM (SB), range function, and spatial dependence radius associated with the common random field.
Disclaimer/Publisher’s Note: The statements, opinions and data contained in all publications are solely those of the individual author(s) and contributor(s) and not of MDPI and/or the editor(s). MDPI and/or the editor(s) disclaim responsibility for any injury to people or property resulting from any ideas, methods, instructions or products referred to in the content.