Article

The Impact of Penalty Function and Equivalence Factor on the Performance of ECMS Controller in Range Extended Electric Vehicles

by
Malika Keldiyarova
1,2,
Umidjon Usmanov
3,*,
Sanjarbek Ruzimov
4 and
Akmal Mukhitdinov
1
1
Department of Vehicle Engineering, Tashkent State Transport University, Tashkent 100167, Uzbekistan
2
Department of Automation of Technological Processes, Karshi State Technical University, Karshi 180100, Uzbekistan
3
Department of Mechanical and Aerospace Engineering, Politecnico di Torino, 10129 Turin, Italy
4
Department of Mechanical and Aerospace Engineering, Turin Polytechnic University in Tashkent, Tashkent 100095, Uzbekistan
*
Author to whom correspondence should be addressed.
Submission received: 1 August 2025 / Revised: 2 November 2025 / Accepted: 13 November 2025 / Published: 19 November 2025
(This article belongs to the Section Engineering)

Abstract

This study discusses the role of the equivalence factor and penalty function in improving the performance of energy consumption minimization strategies in Range Extended Electric Vehicles (REEVs). In conventional ECMS, equivalence factors are typically derived from constant efficiency assumptions for simplicity or adaptively adjusted according to driving conditions in adaptive ECMS. In REEVs, however, the battery efficiency exhibits nonlinear behavior in the low SOC range, which directly leads to variability in the equivalence factor within conventional ECMS. This study investigates the influence of the variable equivalence factor on the overall fuel economy. The equivalence factors are usually considered constant or vary adaptively depending on driving cycles. However, the variation in battery efficiency is often neglected. The present study compares the results obtained for both constant and variable battery efficiencies in deriving the equivalence factors. The simulation results show that an improvement of approximately 3% in fuel economy was obtained for UDDS, NEDC, and WLTC driving cycles as a result of applying the variable equivalence factor. Additionally, through an analysis of various penalty function designs, the study highlights their crucial role in optimizing fuel consumption across different driving cycles.

1. Introduction

Unlike battery electric vehicles, REEVs utilize multiple energy sources, making the development of an effective energy management strategy essential for optimizing fuel efficiency [1]. The energy management strategy (EMS) serves as a crucial component of powertrain control in REEVs, optimizing power split among energy sources (widely, electric battery and engine–generator set) to meet driving needs and achieve reduced fuel use, longer battery life, and reduced emissions [2]. Rule-based and optimization-based EMSs [3,4] are widely used in the design and operation of REEVs due to their distinct advantages in energy management. Ehsani and et al. [5] introduced rule-based EMSs that use predefined logical rules for power distribution between the engine–generator set and battery. Findings demonstrate that implementing a thermostat control strategy in series hybrid electric vehicles (SHEVs) ensures the engine consistently operates within its optimal efficiency zone. On the other hand, the energy consumption minimization strategy (ECMS), an optimization-based control approach, is used to enhance fuel efficiency in SHEVs [6]. The main goal of ECMS is to minimize the overall energy consumption, considering both fuel and electrical energy usage by converting electrical energy costs to fuel consumption equivalence [7]. The equivalence factor in the ECMS is used as a means to translate electrical energy into an equivalent amount of fuel consumption [8]. This conversion allows the control system to compare the costs associated with using fuel and electrical energy in a unified concept. Specifically, the equivalence factor quantifies the future conversion efficiency of fuel to electrical energy, reflecting how much electrical energy can be effectively obtained from a given amount of fuel. By applying this factor, the ECMS can optimize the power split between the internal combustion engine–generator set and the electric battery, ensuring that the overall energy usage is minimized while meeting driving torque demands. The proper selection of the equivalence factor is essential, as it directly impacts the system’s performance, fuel saving potential, and overall efficiency of the REEVs [9]. In the context of the ECMS, the equivalence factor may be either fixed or adaptive. The fixed equivalence factor may not be sufficient for obtaining optimal results under varying driving conditions. This limitation often results in suboptimal engine activation or battery depletion, leading to decreased overall efficiency [1,3,8]. Conversely, the adaptive equivalence factors adjust dynamically based on vehicle states and predicted future energy requirements [10,11]. Additionally, in the application of ECMS, a penalty function on SOC is commonly used to maintain it within its permissible boundaries [9].
Numerous approaches for designing the equivalence factor have been proposed in the literature to improve the effectiveness of ECMS. Yao et al. [11] used a proportional- integral (PI) method to calculate the equivalence factor by using SOC feedback to enhance performance of SHEV. Li et al. [12] found the boundaries for the equivalence factor of ECMS by using a neural network, which yielded substantial fuel savings. Wu et al. [13] proposed an equivalence factor that linearly depends on the SOC feedback. Liu et al. [14] developed an optimized equivalence factor map using vehicle acceleration and battery SOC as independent variables, establishing an improved globally optimal ECMS for parallel HEVs. Zhang et al. [15] presented a reinforcement learning (RL) strategy with the ECMS-based energy management system for PHEVs that improves equivalent factor evaluation for better fuel economy and real-world reliability. According to recent trends, Zhang et al. [16] proposes a MAML-based energy management approach that enables cross-platform transfer without additional calibration and achieves significant real-world fuel economy improvement through online adaptation.
A vast majority of early studies have focused on the design of fixed equivalence factors in ECMS, while later studies have focused mainly on the adaptive equivalence factors. However, the analysis of the impact of both the variable equivalence factor, which considers the dynamic efficiency of the battery, and the penalty function on fuel consumption and SOC deviation under varying driving conditions has not been conducted in detail.
Unlike conventional or adaptive ECMS approaches that assume constant battery efficiency, this study incorporates variable battery efficiency derived from experimental data, reflecting the nonlinear behavior of the battery in the low SOC range of REEVs. The main purpose of this study is to demonstrate the impact of this variable battery efficiency on the equivalence factor, which directly affects the overall fuel economy. Moreover, the impact of three distinct penalty function formulations on the performance of an ECMS through simulations is conducted on a REEV. By integrating SOC-based, exponential, and PI-controlled penalty functions into the ECMS, their influence on battery SOC and overall fuel consumption over standard drive cycles is evaluated.
Thus, the main aim of this study is to evaluate the impact of an equivalence factor utilizing a variable battery efficiency and three distinct penalty function formulations on the performance of an ECMS through simulations conducted on a REEV. By integrating SOC-based, exponential, and PI-controlled penalty functions into the ECMS, their influence on battery SOC and overall fuel consumption over standard drive cycles is evaluated.

2. Materials and Methods

The main function of the ECMS is to split power between an auxiliary power unit (APU) and the battery of the REEV while minimizing the fuel consumption and maintaining the battery SOC within a specified range. In this study, the APU is regarded as comprising an engine and a generator set. However, it should be noted that there are a variety of APUs that utilize fuel cells, micro-gas turbines, wind turbines, and other energy sources [17]. The mathematical description of the equivalent amount of fuel to be minimized by ECMS is presented as follows [8]:
m ˙ e q v t = m ˙ f u e l t + m ˙ b a t t t
where m ˙ e q v ( t ) is the equivalent fuel consumption rate, [ g / s ] ; m ˙ f u e l ( t ) is fuel mass flow rate, [ g / s ] ; m ˙ b a t t t is the virtual fuel consumption of the battery, which is obtained by energy consumption rate converted to fuel consumption equivalent, [ g / s ] , S s o c ( S O C ) is the penalty function on battery SOC, [ ] .
The instantaneous real fuel consumption of the APU is calculated based on the engine’s brake specific fuel consumption (BSFC) and its output power.
m ˙ f u e l t = B S F C × P A P U ( t )
where BSFC is the brake specific fuel consumption, [ g / k W h ] ; P A P U is the output power of APU, [ k W ] .
The virtual fuel consumption of battery m ˙ b a t t t is represented based on the sign of battery output power P b a t t ( t ) as follows:
(a)
P b a t t t ≥ 0, battery discharging mode:
m ˙ b a t t t = s d c h g ( t ) P b a t t ( t ) L H V
(b)
P batt t < 0, battery charging mode:
m ˙ b a t t t = s c h g ( t ) P b a t t ( t ) L H V
where s d c h g and s c h g are the equivalence factors for battery charging and discharging operations, respectively [ ] ; L H V is the low heating value of fuel, [ M J / k g ] .
The equivalence factor is a key parameter used to convert electrical energy consumption into an equivalent fuel cost, and its proper selection significantly impacts the performance of ECMS [8].
For the evaluation of key parameters in ECMS, the backward simulation model [18] of REEV is developed in the MATLAB/Simulink R2022b platform [19]. The main parameters of REEV are indicated in Table 1 [20]. The REEV simulation model consists of several subsystems, including the drive cycle, vehicle dynamics, transmission, electric motor, battery, generator, and an engine modeled as a static fuel consumption map. The model was validated using experimental test data from Downloadable Dynamometer Database (D3) testing results by Argonne National Laboratory [21]. For the sake of simplicity, a detailed description and experimental validation of the model are provided in the authors’ previous works [22]. It is assumed that battery degradation and temperature variations are not considered in this work.

2.1. The Analysis of Equivalence Factor

2.1.1. Constant Equivalence Factors

Using a constant equivalence factor means that the conversion rate of electrical energy consumption into an equivalent fuel cost remains fixed over time. In practical implementations, the equivalence factor is often implemented as a constant due to its simplicity and ease of calibration [8]. In the formulation of ECMS, the equivalence factor is treated as a constant or a set of constants which can be interpreted as the average overall efficiencies of the electric path during charging or discharging mode as shown in Figure 1.
The equivalence factors during charging ( s c h g ) and discharging ( s d c h g ) are defined as the chain of constant efficiencies of electric path. These efficiency values are assumed to remain constant during the driving cycle.
s c h g = 1 η d c h g η c h g η g e n η I C E
s d c h g = η d c h g η c h g η g e n η I C E
where η d c h g and η c h g are battery discharge and charge efficiency, respectively, [-]; η g e n is the generator efficiency, [-]; η I C E is the internal combustion engine efficiency, [-].

2.1.2. Variable Equivalence Factor

In many real-time applications, relying on a fixed equivalence factor presents several limitations, including its inability to adapt to varying driving conditions, effectively maintain SOC over long trips, and achieve optimal fuel economy. To address the limitations associated with using a fixed equivalence factor, the concept of a variable equivalence factor has been introduced in this study. Unlike a fixed value, the variable equivalence factor dynamically changes in real time, taking into account the change in battery efficiency for the current power demand and the battery SOC. This approach is expected to maintain SOC more effectively over long trips and optimize fuel economy. The difference between the variable equivalence factor ECMS and the adaptive ECMS [23] is that the former does not take the driving pattern into account, while the latter adjusts the equivalence factor to its fixed value recognizing the driving cycle.
The values of variable battery efficiencies in charging and discharging modes are shown in Equations (5) and (6), respectively. In the design of the adaptive equivalence factor, this study assumes constant efficiency of APU for a given power output, while the battery efficiency varies depending on battery’s output power and SOC. The battery for charging η c h g and discharging efficiency η d c h g can be expressed as:
η c h g ( t ) = P t ( t ) R c h g ( S O C ) I c h g 2 ( S O C ) P t ( t )
η d c h g = P t ( t ) P t ( t ) + R d c h g ( S O C ) I d c h g 2 ( S O C )
where P t is the motor input power required for traction or regenerative braking, [kW]; I c h g and I d c h g are the charging and discharging currents, [A]; R c h g and R d c h g are the charging and discharging resistances, [ O h m ] .
According to a commonly used equivalent circuit model of the battery [24], the charging and discharging currents are expressed using the open circuit voltage ( V O C V ) and internal resistances ( R c h g and R d c h g ) as follows [8]:
I c h g ( S O C ) = V O C V 2 ( S O C ) + 4 R c h g ( S O C ) P t ( t ) V O C V ( S O C ) 2 R c h g ( S O C )
I d c h g ( S O C ) = V O C V ( S O C ) V O C V 2 ( S O C ) 4 R d c h g ( S O C ) P t ( t ) 2 R d c h g ( S O C )
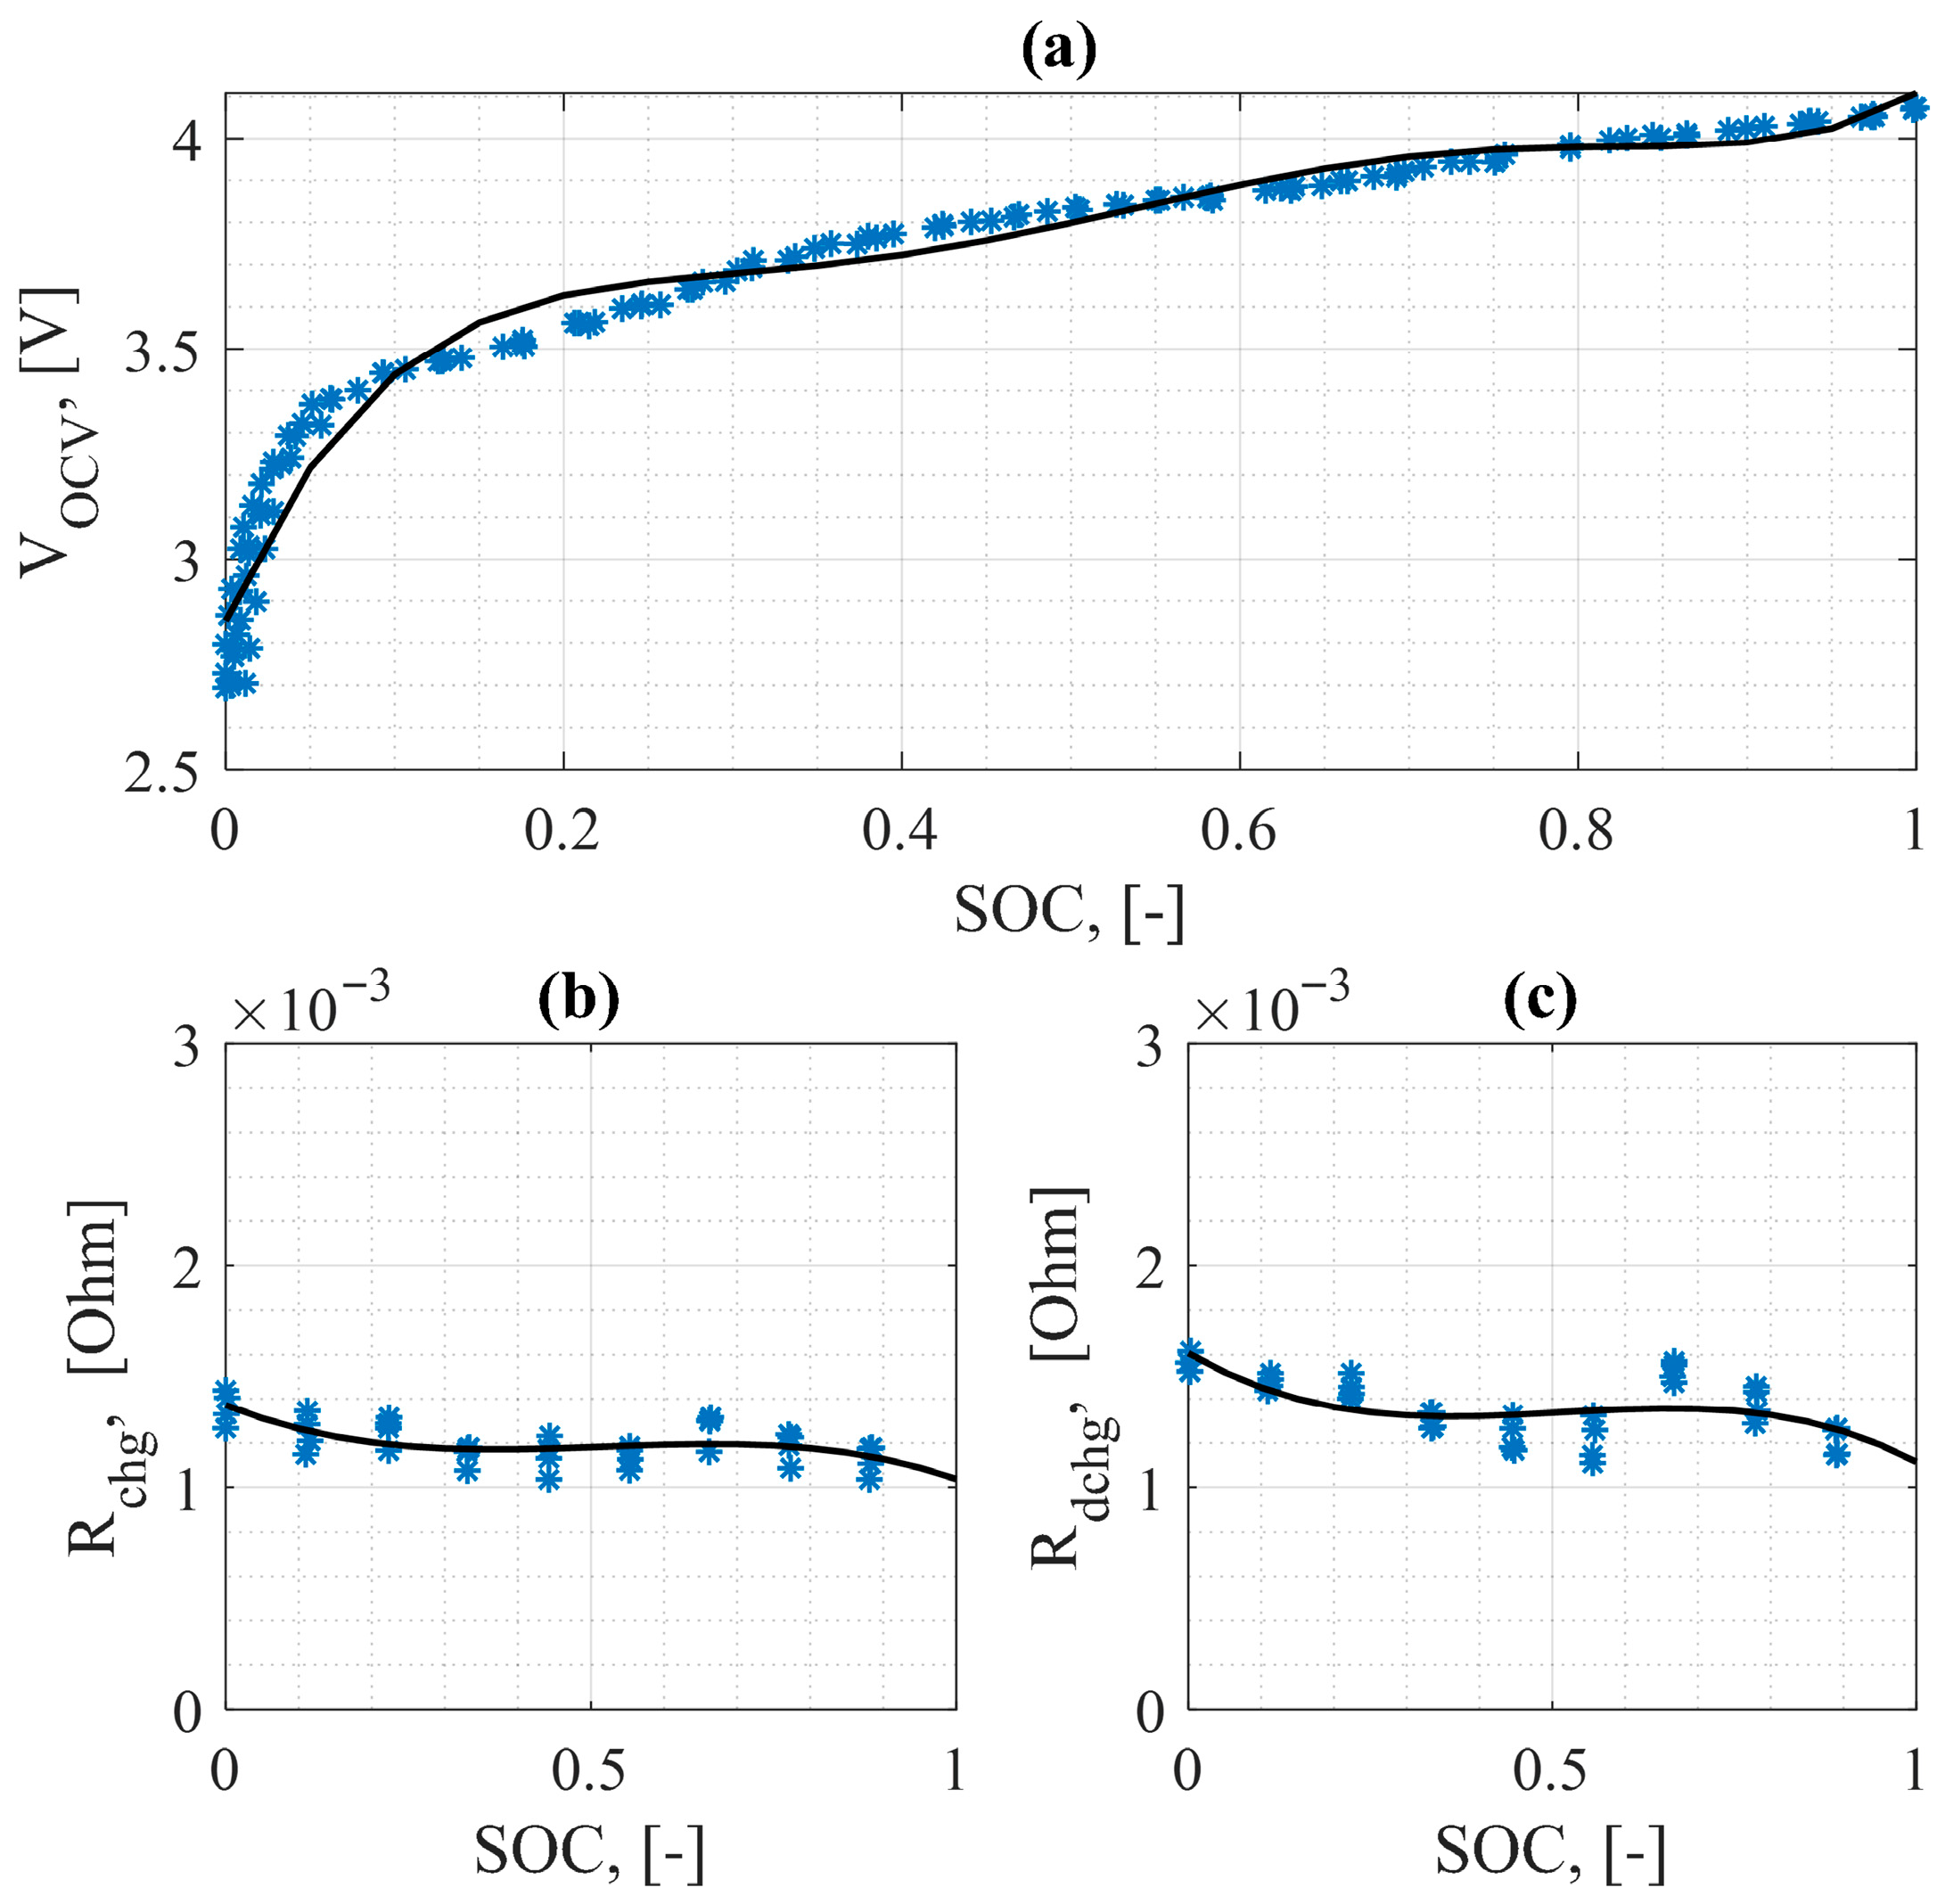
The data of the battery pack used in this study was experimentally obtained by Idaho National Laboratory (INL) and has been made available to the public for purposes of research in [25]. This data is used to derive the polynomial functions V O C V = f(SOC), R d c h g = f(SOC) and R d c h g = f(SOC) [22] as shown in Figure 2.
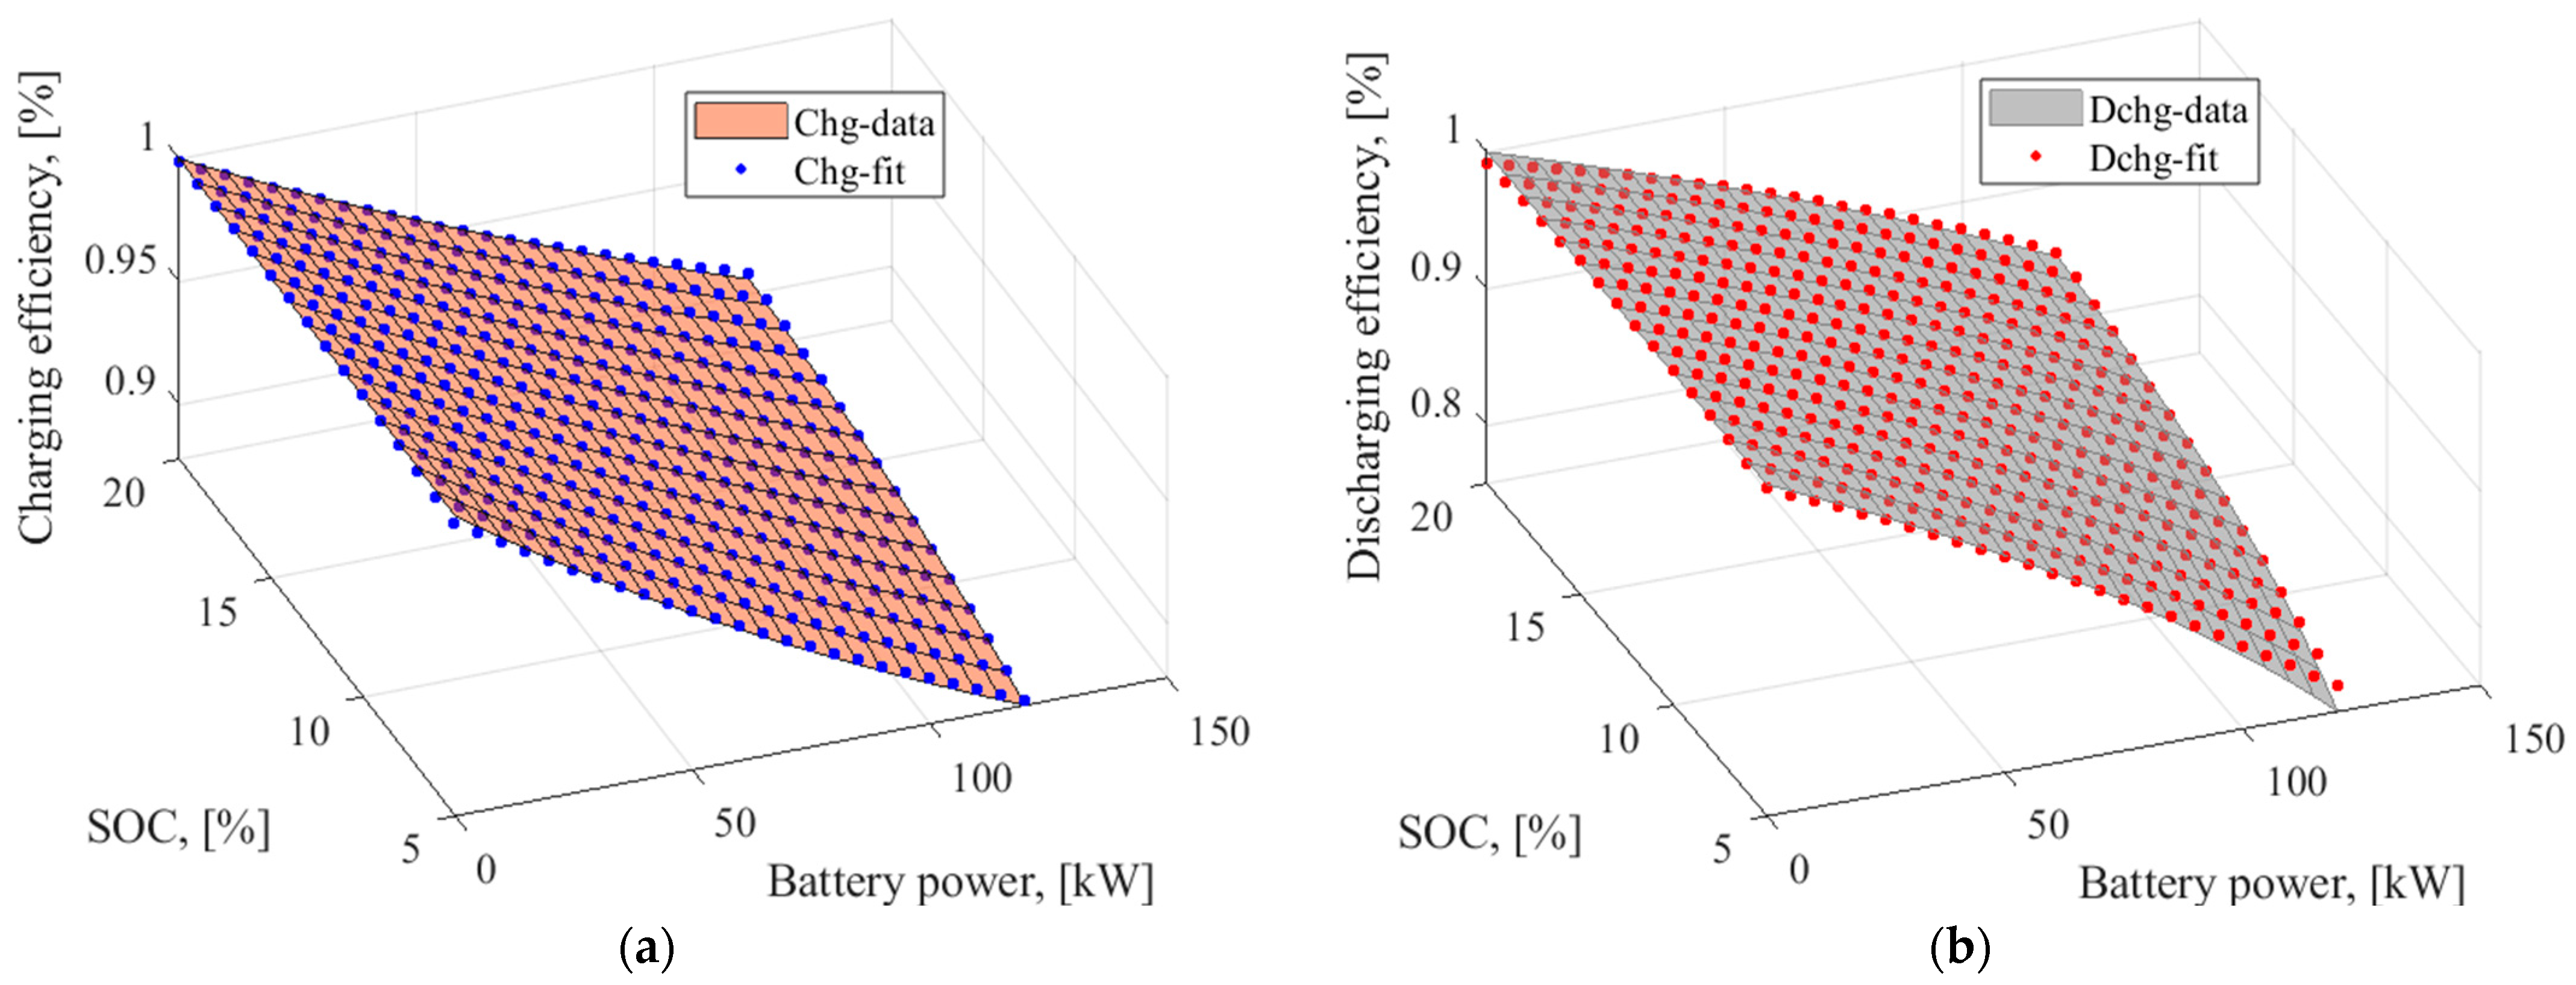
The efficiency map of battery system is generated for both charging and discharging modes by implementing Equations (7) and (8). To define the equation of battery charging and discharging efficiency, the polynomial form was selected for approximation. The MATLAB® Curve Fitting Tool [26] was used to fit the existing data and derive the polynomial equations that are described in Equations (9) and (10). In this study, the polynomial fitting of battery efficiency is an empirical model specific to the tested battery, effectively capturing its nonlinear behavior, and is not generalizable to other chemistries. Figure 3 shows the efficiency map of battery system as a function of battery power and SOC.
To provide an accurate and smooth representation of efficiency variations across different operating conditions, a second-degree two-variable polynomial equation was selected for the approximation. The equations for both charging and discharging efficiency are expressed as follows:
η c h g = 0.9895 1.2344 P t 10 6 + 0.1703 S O C + 1.5493 P t 10 6 2 + 1.4808 P t 10 6 S O C 0.6245 S O C 2
η d c h g = 0.983 1.72 P t 10 6 + 0.35 S O C 2.8841 P t 10 6 2 + 4.4495 P t 10 6 S O C 1.5483 S O C 2
where P t is the output power of battery, [W]; S O C is the battery state of charge, [-].
In the vehicle simulator, these equations were used to design the variable equivalence factor in the ECMS for REEV to improve the accuracy and effectiveness of energy management by dynamically accounting for battery efficiency changes during operation.

2.2. The Analysis of Different Penalty Functions

A penalty function in ECMS serves to balance fuel consumption and battery usage by modifying the control cost in relation to the SOC, thereby ensuring efficient energy management and safe battery operation [8]. It directly affects the equivalence factor of the ECMS by modifying its value based on the current SOC. This section is devoted to the analysis of the influence of three distinct penalty function designs on the performance of the ECMS for charge sustaining (CS) mode through simulations conducted on a REEV. By integrating proportional, exponential, and PI controlled penalty functions, it is evaluated their effect on the battery SOC and overall fuel consumption over standard drive cycles.

2.2.1. Proportional Penalty Function

The linear function is used to design the proportional penalty function based on the battery SOC. The main concept of proportional penalty function is to maintain the battery SOC within a desired value throughout the selected driving cycle [8,13,27]. When the battery SOC decreases the target level, the strategy increases the proportional penalty function to encourage the use of engine power. Conversely, when the battery SOC is relatively high, the proportional penalty function encourages the use of battery power. This approach helps to ensure charge sustainability while optimizing energy management. The linear equation for the penalty function ( S S O C t ) is expressed as follows [8,13,27]:
S S O C t = s 0 + K p [ S O C t S O C t ]
where s 0 is the initial value of penalty function; K p is the proportional coefficient, S O C t and S O C t are the present and target values of battery SOC, respectively.
Figure 4 illustrates the linear relationship between penalty function and battery SOC, highlighting the influence of the initial value and the proportional coefficient.
Excessively high values of K p and s 0 can lead to system instability, characterized by frequent switching of the engine power. Conversely, the low values of K p and s 0 may increase risk of over-discharge [3,8,11,28].
In order to achieve a final SOC that closely matches the target at the end of the considered drive cycles, the value of s 0 is set to 1.1, and K p is set to 0.5.

2.2.2. Exponential Penalty Function

Exponential form of the penalty function takes unitary value when the battery SOC crosses its target value [8]. The concept is that when penalty function value exceeds 1, the cost of electrical power increases, and consequently, all required power is satisfied by the engine. Conversely, when the penalty function is below 1, the cost of using electrical power is significantly lower, hence causing the battery to discharge until reaching the target value. The exponential penalty function is given in Equation (12).
S S O C t = 1 S O C t S O C t ( S O C m a x S O C m i n ) / 2 k s
where S O C t , S O C t , S O C m a x , and S O C m i n are the current, target, maximum, and minimum values of battery SOC, respectively, [ ] ; k s is the degree, [ ] .
The changes in penalty function with respect to the battery SOC and the degree k s are illustrated in Figure 5 for various values of S O C t . The most suitable form of the penalty function is the S-shaped form, which is obtained by using odd values for the degree of k s [8]. In the figure, the constraints on the battery SOC are set to S O C m i n = 0.05 and S O C m a x = 0.16 , i.e., for charge sustaining operation limits.

2.2.3. PI—Controlled Penalty Function

Another alternative to the penalty function is the discrete time PI-controlled penalty function, which adaptively adjusts the equivalence factor based on the SOC feedback in real-time applications. Yao et al. [11] used the PI-controlled function as a discharge equivalence factor to design adaptive ECMS for REEVs. Considering that the proportional and integral coefficients of PI controller, the penalty function is expressed as follows:
S S O C t = s 0 + K p S O C t S O C t + K i t 0 t f S O C t S O C t T s
where s 0 is the inital value of equivalence factor, [ ] ; K p is the proportional coefficient, [ ] ; K i is the integral coefficient, [ ] ; and T s is the system sampling time, [ ] .
As reported in the available literature [11], the effects of different penalty function formulations on fuel economy have been investigated through parameter tuning and simulation analysis. In the design of the PI-controlled penalty function, the initial equivalence factor is commonly set to 1.35 to maintain system stability. Furthermore, studies have shown that proportional and integral coefficients significantly influence the dynamic response of the ECMS controller. To avoid oscillations and ensure stable performance, typical coefficient values of 0.5 and 0.01 are adopted for the proportional and integral gains, respectively, based on simulation results under various driving cycles.
As proposed in [11], in the design of the PI controlled penalty function, the initial value of equivalence factor is set to 1.35 in order to keep system stability. To analyze the impact of varying integral coefficients and different proportional coefficients to the penalty function, several simulations under different drive cycles have been conducted. To prevent system oscillations and maintain system stability, the value of the proportional coefficient and integral coefficient are set to 0.5 and 0.01, respectively.

3. Results

3.1. Equivalence Factor Results

To enhance the performances of ECMS, the variable equivalence factor is used to convert consumed electrical energy to virtual fuel consumption. In order to compare the results of the main performance parameters, the powertrain model is initially simulated using constant equivalence factors in the ECMS. Subsequently, simulations are carried out with variable equivalence factors. In both cases, the initial value of the battery SOC is set to 15.5%, and the simulations are conducted under various drive cycles, including UDDS, NEDC, WLTC, and HWFET.
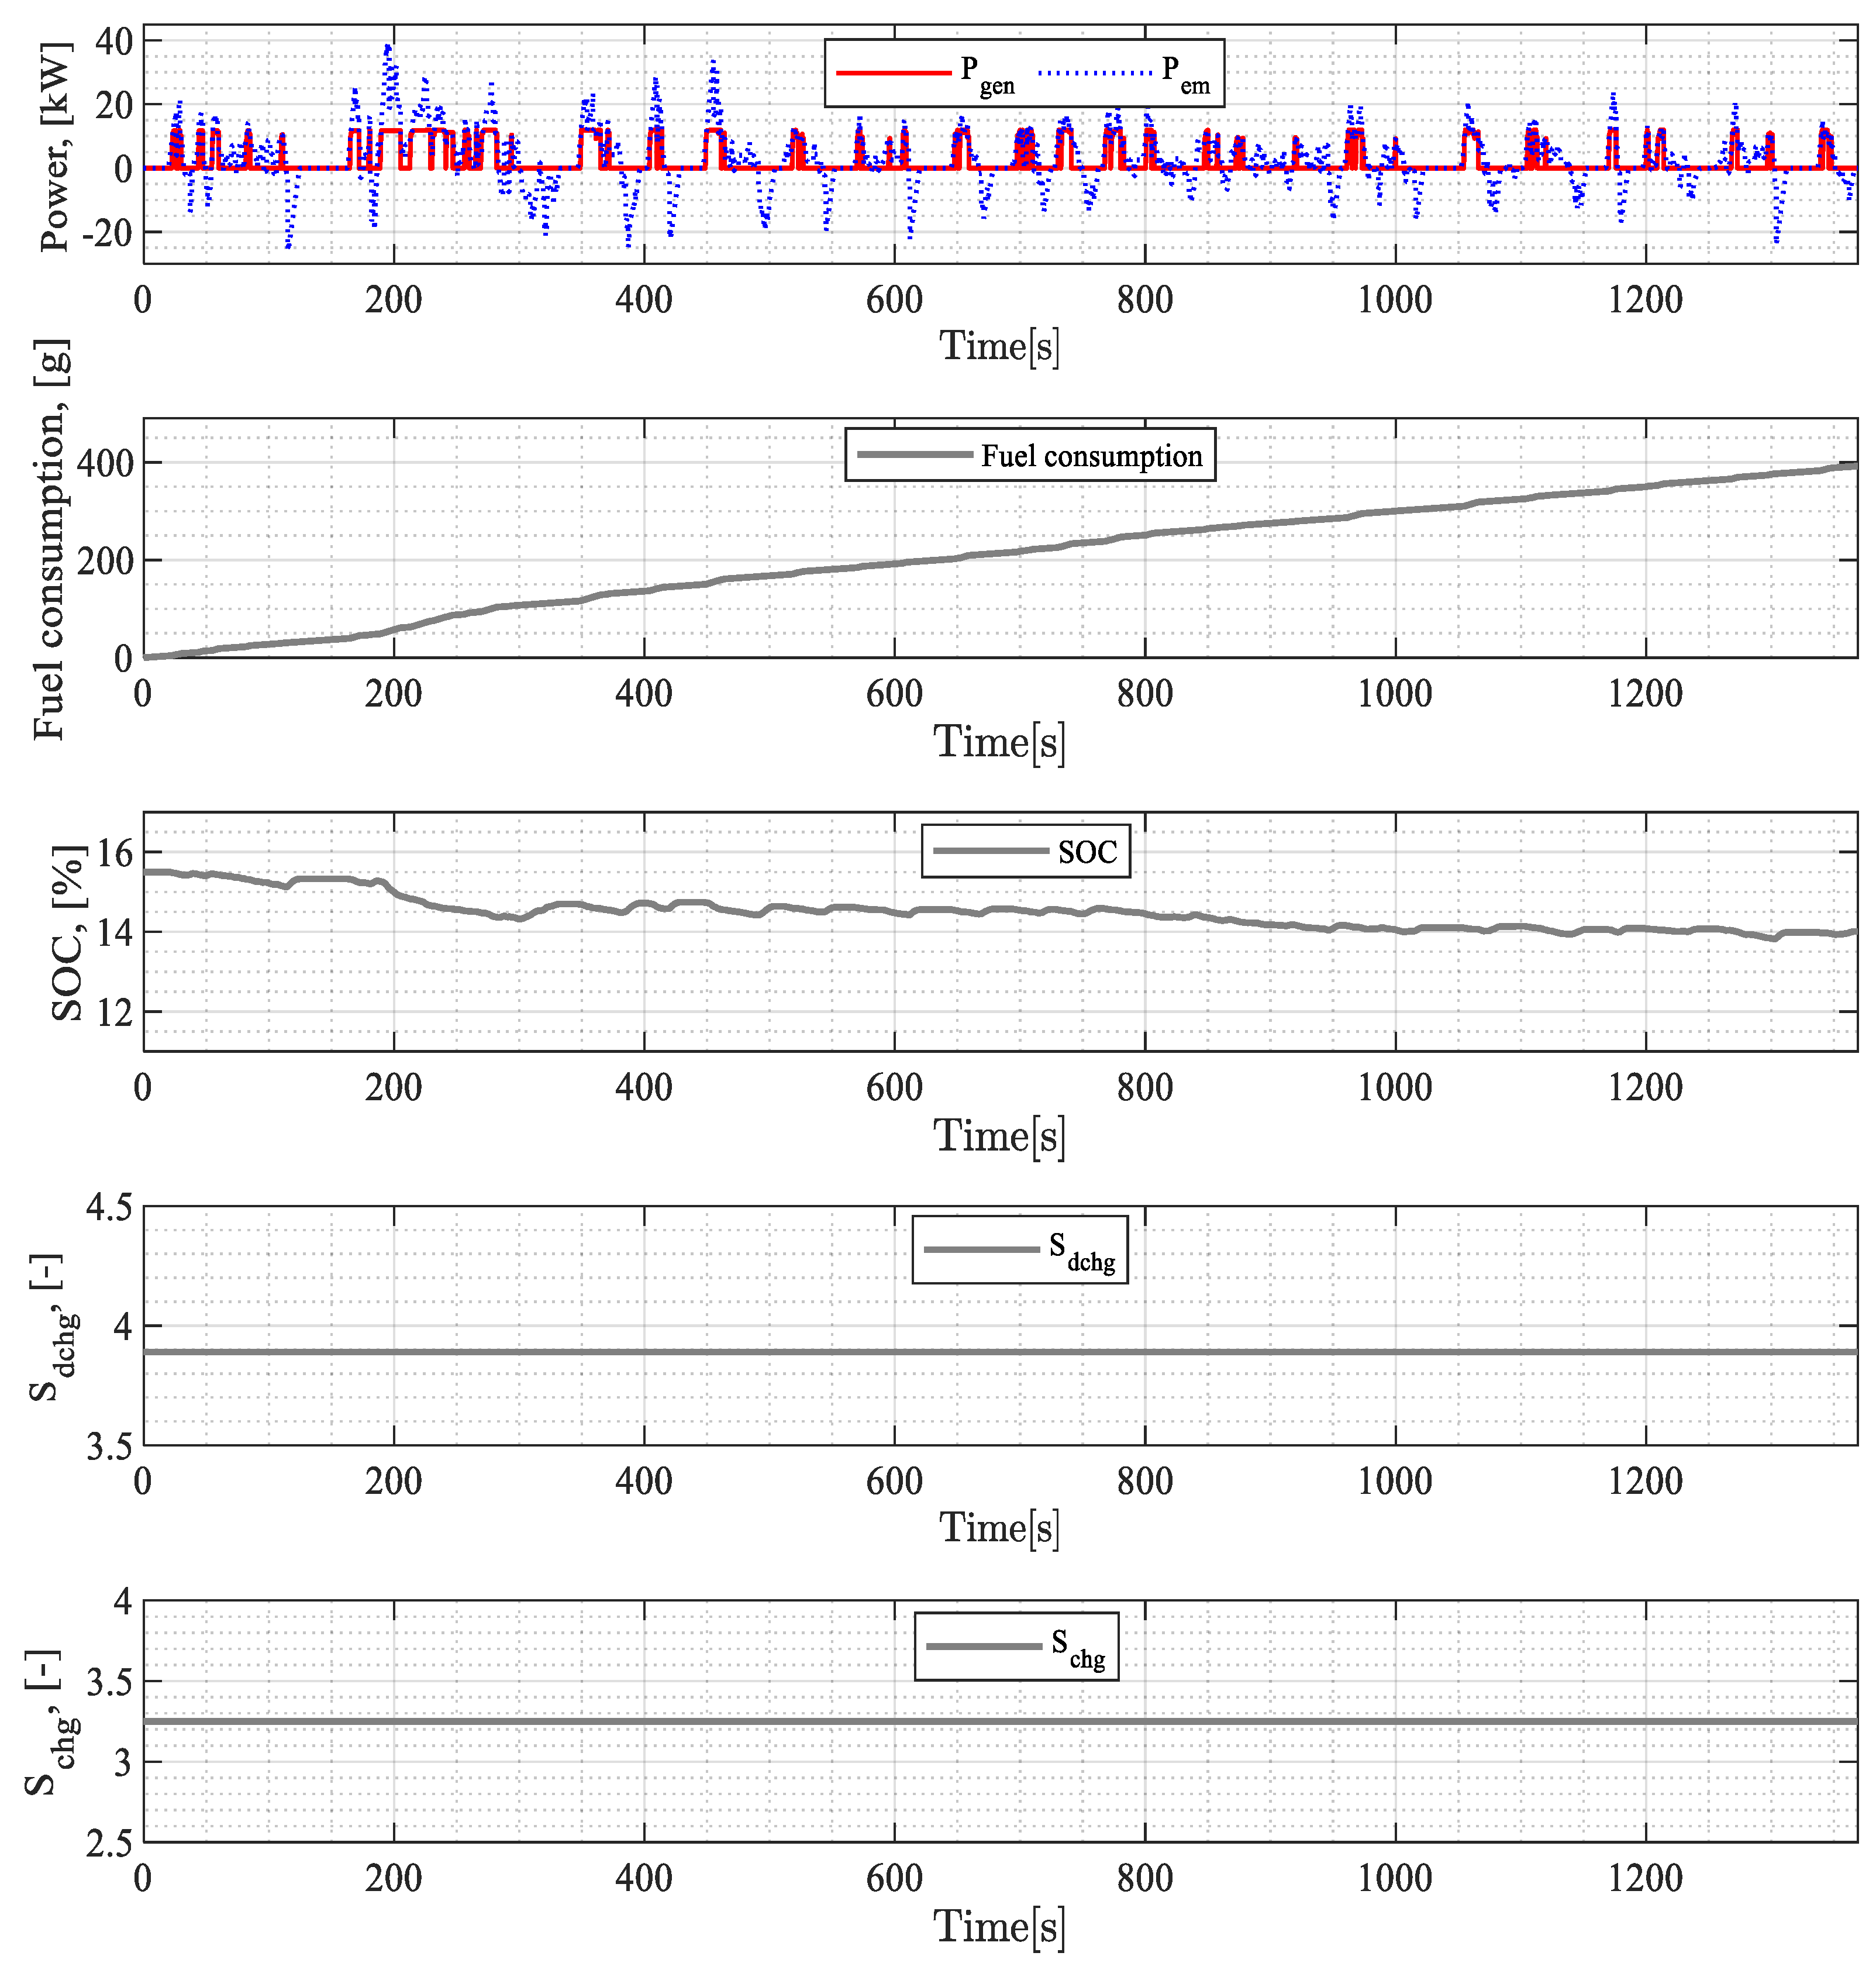
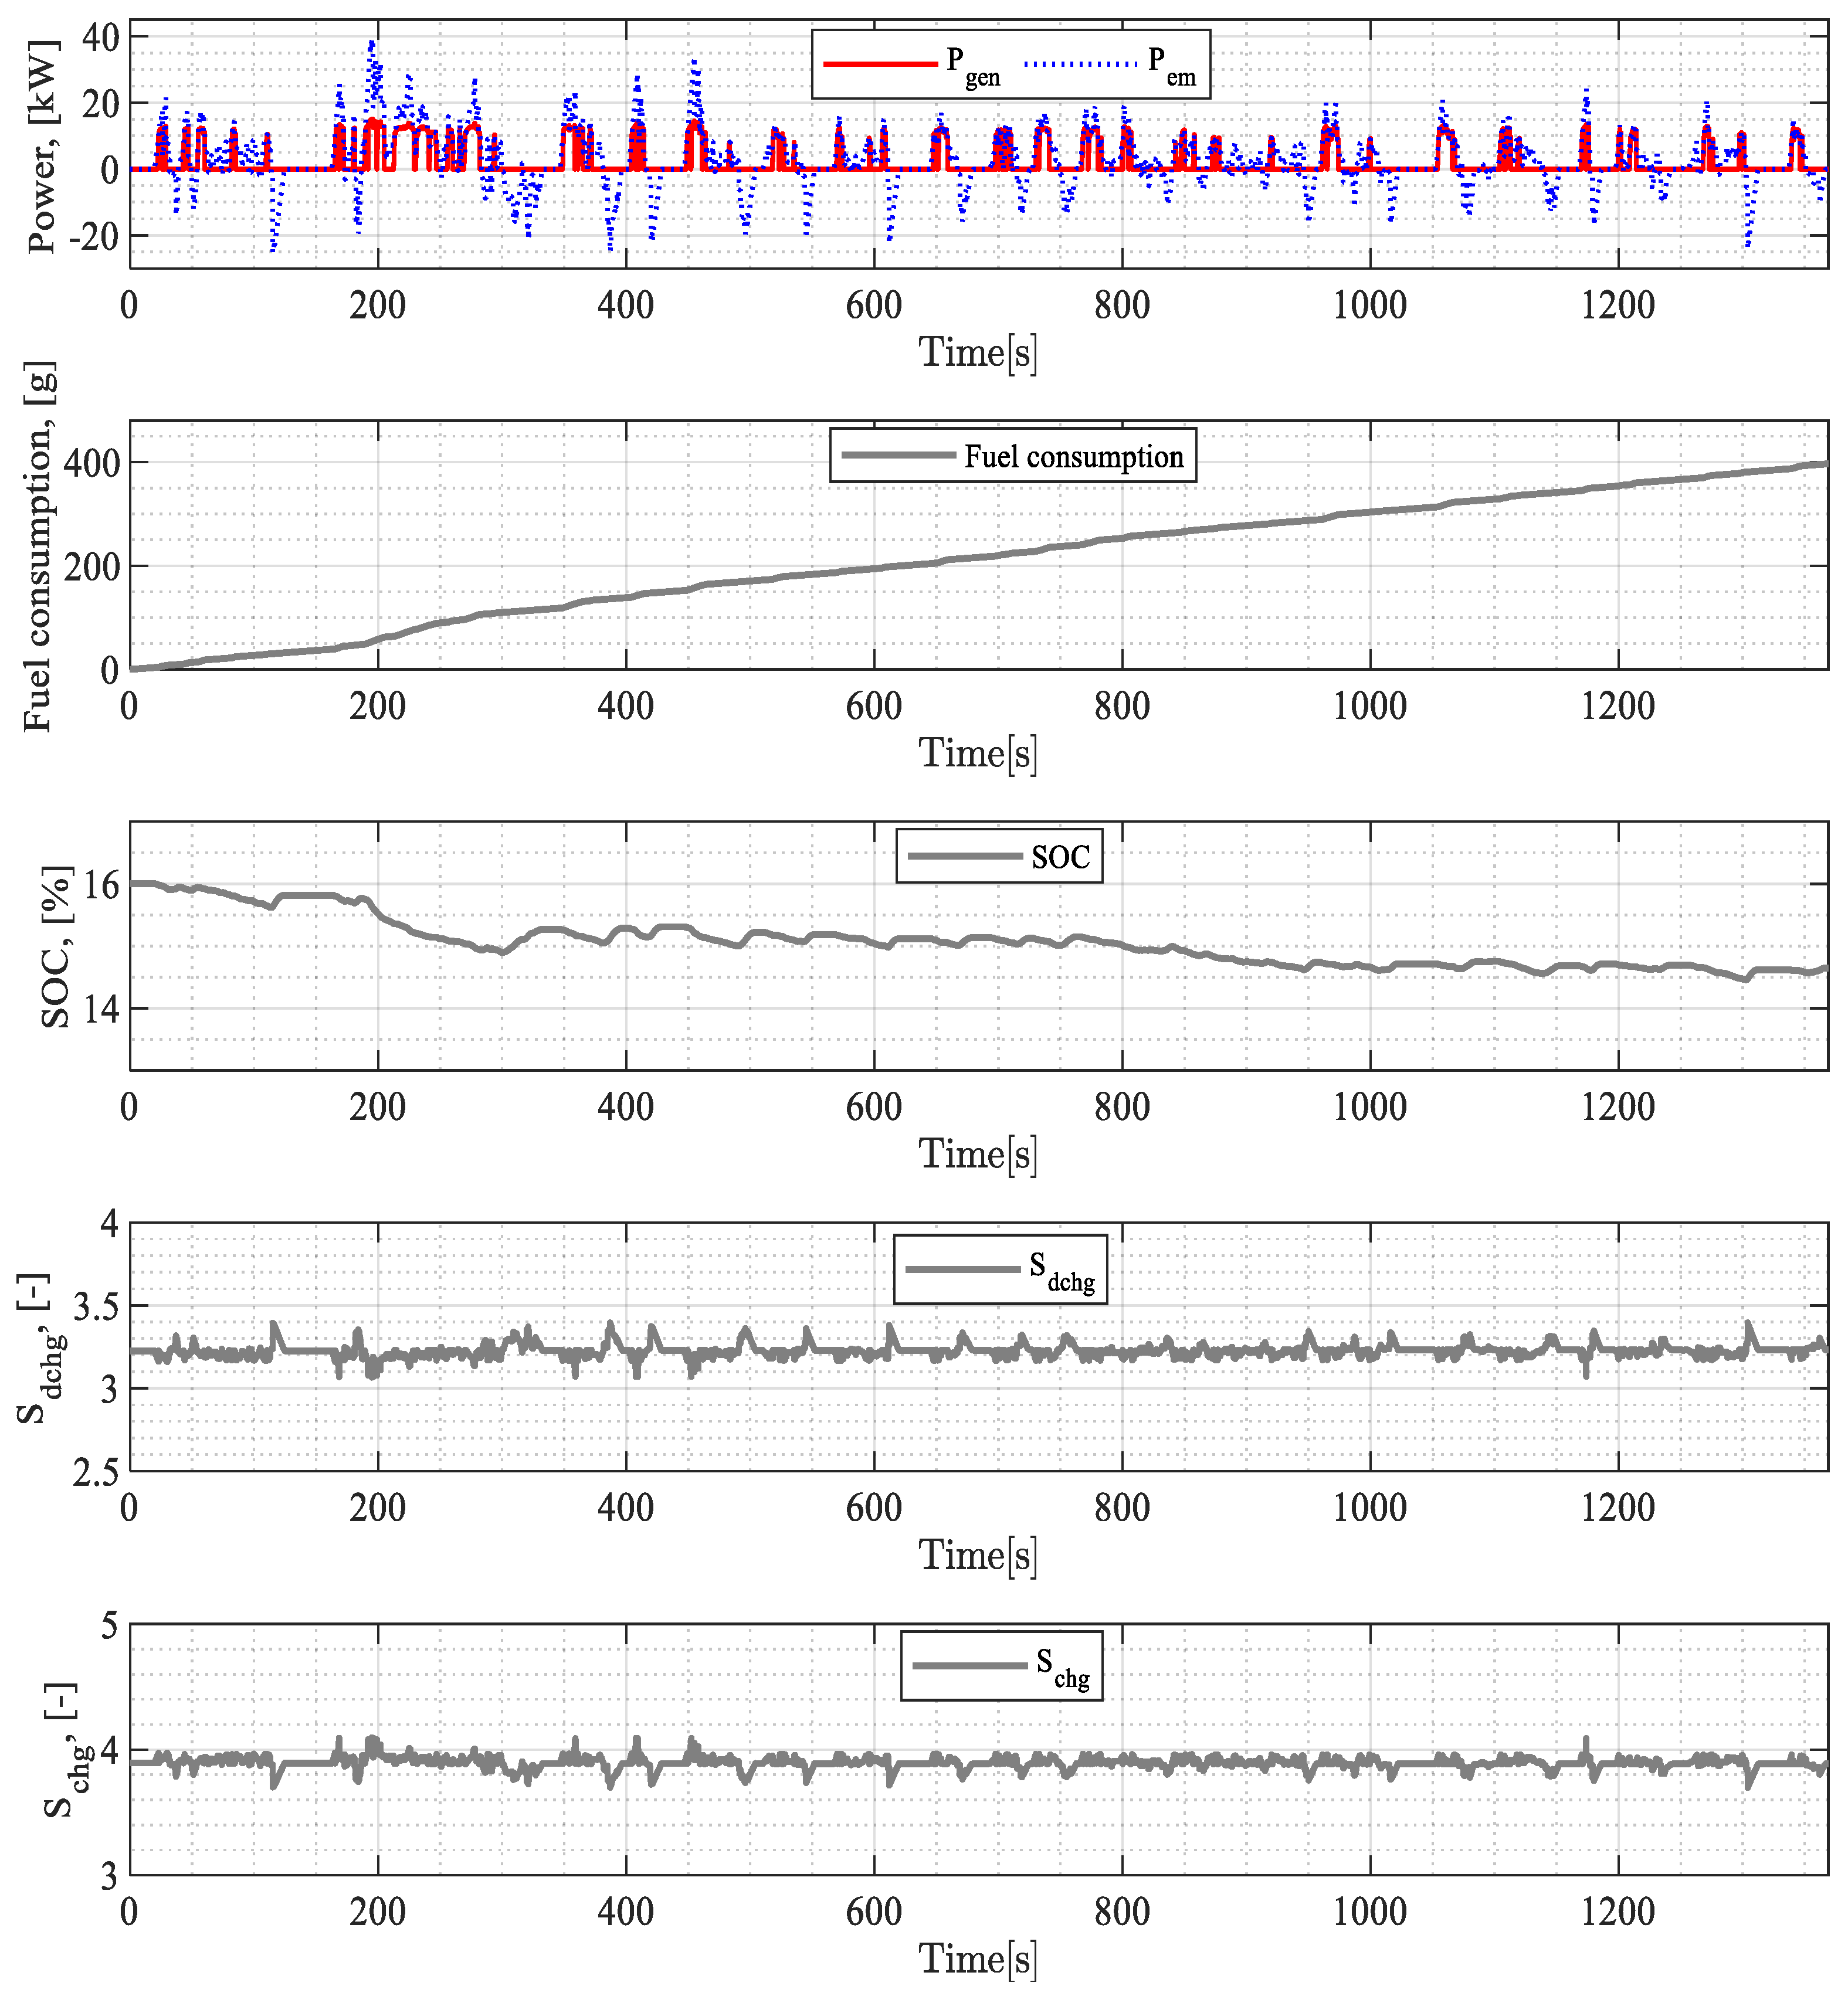
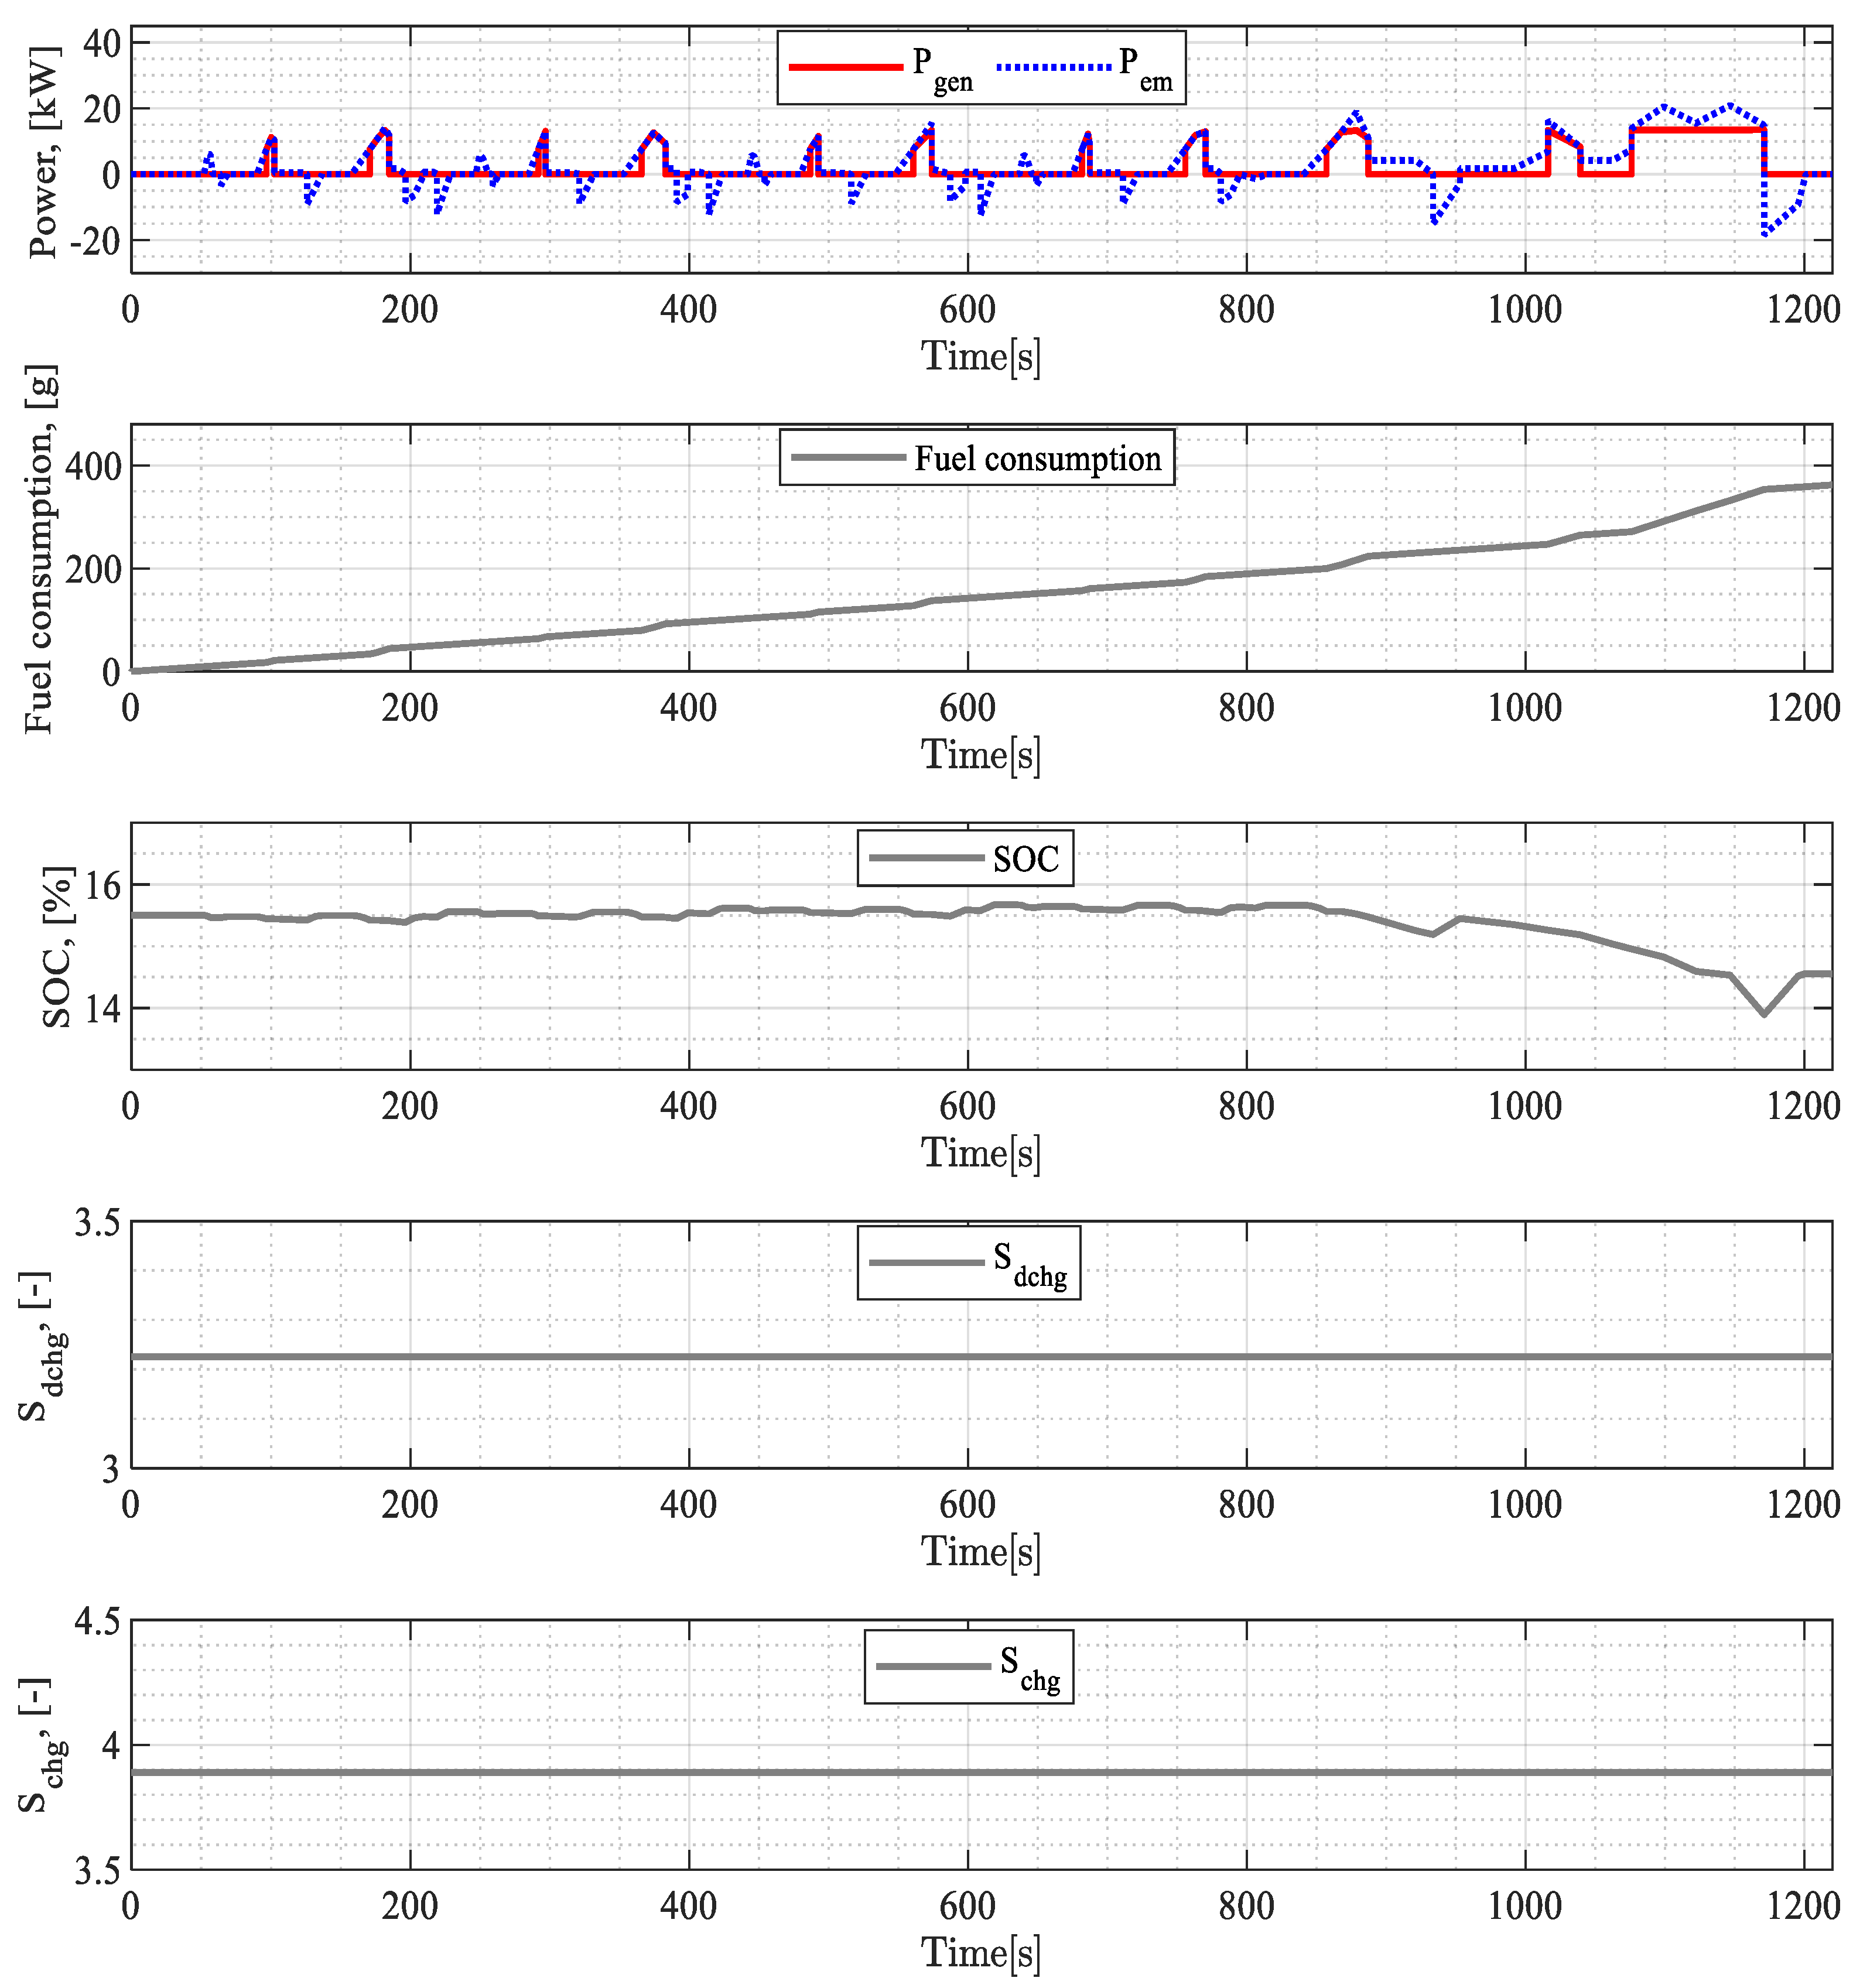
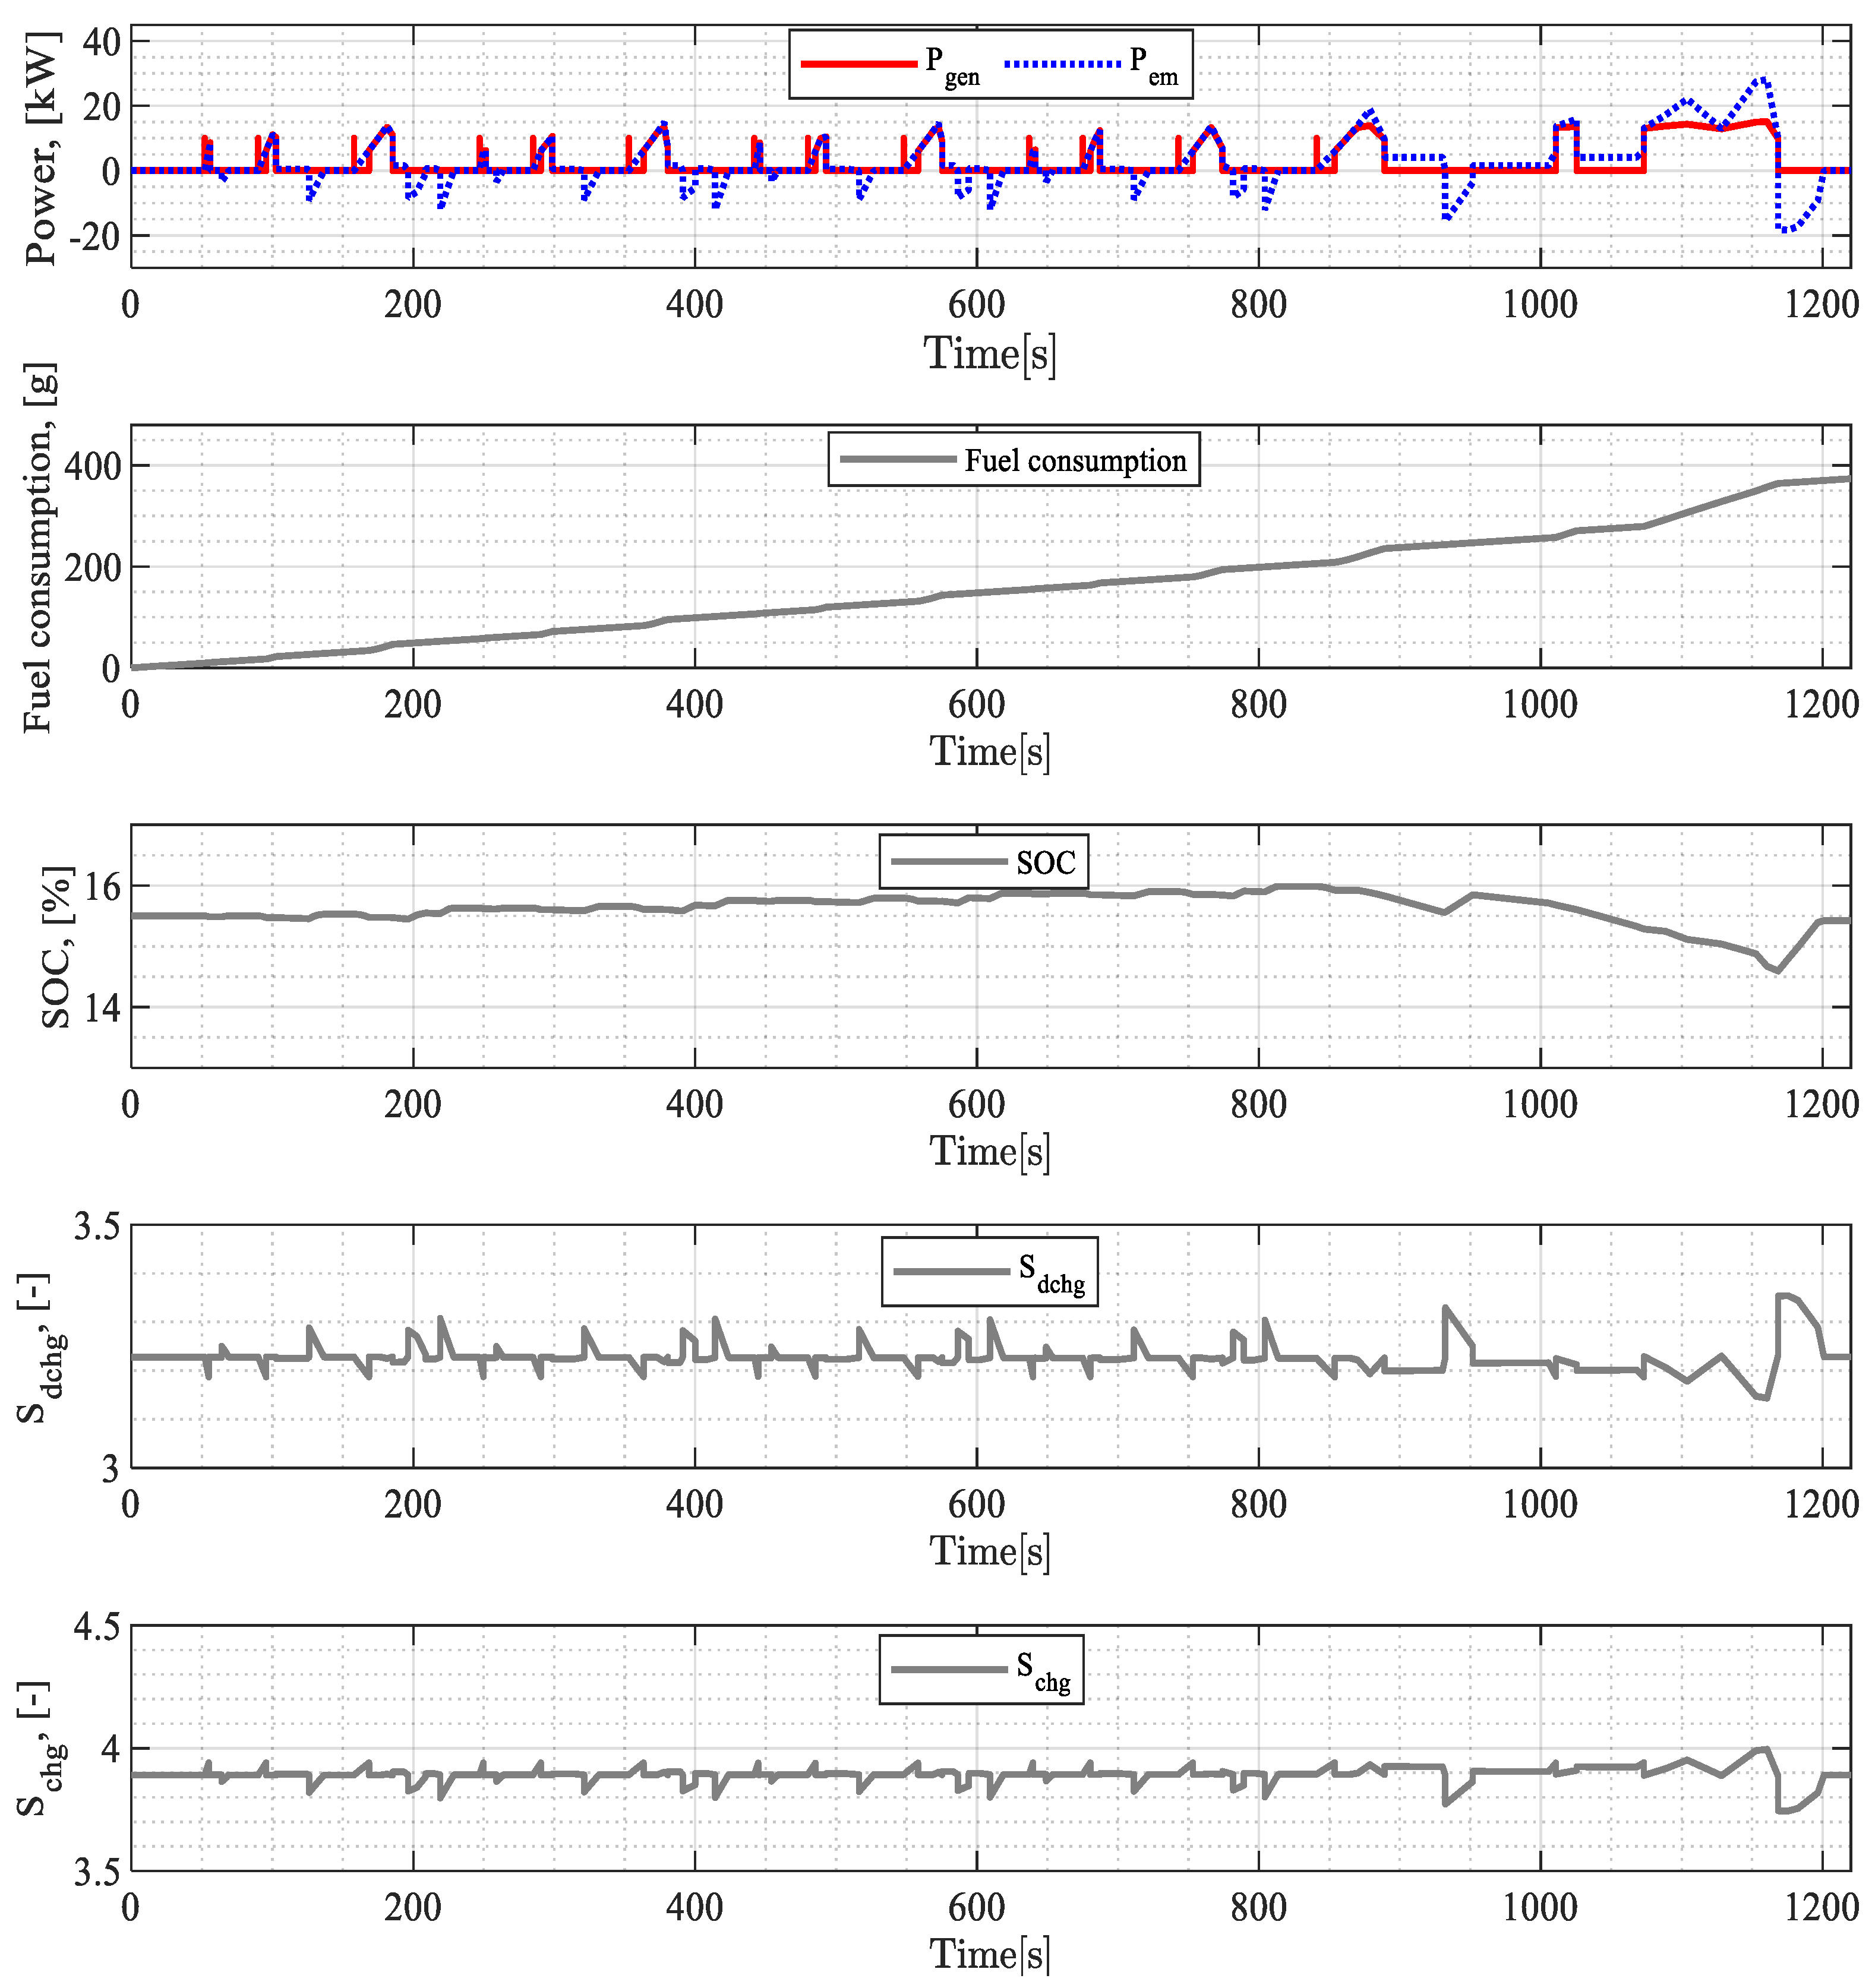
The samples of simulation of REEV under UDDS and NEDC cycles by applying constant and variable equivalence factor are presented in Figure 6, Figure 7, Figure 8 and Figure 9, respectively. The required power of the vehicle together with the output power of APU, battery SOC, fuel consumption, and charging and discharging equivalence factors are indicated, all as functions of time. The simulation results of actual fuel consumption and SOC variation ( S O C = S O C f i n a l S O C i n i t i a l ), considering both constant and variable equivalence factors across the UDDS, NEDC, WLTC, and HWFET cycles, are presented in Table 2. The simulation results clearly show that the final SOC does not precisely match the target value. Therefore, to ensure a fair comparison between the two cases, the actual fuel consumption is corrected by accounting for the SOC variation. A linear correction form is selected to convert the net change in battery energy to an equivalent fuel consumption [8]. The total fuel consumption is calculated as following equation:
m t . f = m a c t u a l . f + E b a t t e r y η I C E L H V
where m t . f is the total fuel consumption, [g]; m a c t u a l . f is the actual fuel consumption, [g]; and E b a t t e r y is the net battery energy corresponding to ∆SOC, [kWh].
The total fuel consumption was calculated for both cases across four different driving cycles. The implementation of the variable equivalence factor resulted in improved fuel efficiency of approximately 2.87% for the UDDS cycle, 2.8% for the NEDC cycle, 1.2% for the HWFET cycle, and 2.25% for the WLTC cycle.

3.2. Penalty Function Results

The vehicle model simulations were conducted under UDDS, NEDC, WLTP, and HWFET drive cycles, utilizing three distinct penalty function formulations. The initial value of battery SOC is set to 15.5% during the simulation. Results, including fuel consumption and final SOC, are summarized in Table 3. The results confirm that the three penalty functions have distinct impacts on the overall performance of the standard ECMS. In the simulated driving cycles, the exponential and PI-controlled penalty functions were found to be less effective as they resulted in greater SOC deviation at the end of the cycle. Conversely, the linear (SOC-based) penalty function proved to be more effective, maintaining the battery SOC within the desired range across different driving cycles.

4. Conclusions

This study compared usability of the equivalence factor and penalty function on the fuel-saving potential of Range Extended Electric Vehicles (REEVs). Although equivalence factors are traditionally described as either constant or cycle-dependent adaptive, this research specifically considers time-varying battery efficiency, which directly affects the equivalence factor. Unlike other hybrid architectures, series HEVs operate in charge-sustaining mode at low SOC levels, where the battery exhibits nonlinear efficiency behavior.
The comparison of the corresponding results of steady-state and adapting efficiency values shows the fact that variable efficiency provides reduction in fuel consumption up to 3% for different considered driving cycles. Moreover, an overview of various forms of penalty functions proves how they can improve the fuel economy for different driving cycles.

Author Contributions

Conceptualization, M.K. and S.R.; methodology, M.K. and S.R.; software, M.K.; validation, M.K. and S.R.; formal analysis, M.K.; investigation, M.K.; resources, S.R. and A.M.; data curation, M.K.; writing—original draft preparation, M.K.; writing—review and editing, U.U. and S.R.; visualization, M.K.; supervision, S.R. and A.M.; project administration, S.R. and A.M. All authors have read and agreed to the published version of the manuscript.

Funding

This research received no external funding.

Institutional Review Board Statement

Not applicable.

Informed Consent Statement

Not applicable.

Data Availability Statement

No data was generated.

Conflicts of Interest

The authors declare no conflict of interest.

Abbreviations

The following abbreviations are used in this manuscript:
APUAuxiliary Power Unit
BSFCBrake Specific Fuel Consumption
CSCharge Sustaining
ECMSEnergy Consumption Minimization Strategy
EMSEnergy Management Strategy
HWFETHighway Fuel Economy Test
INLIdaho National Laboratory
LHVLow Heating Value
NEDCNew European Driving Cycle
PIProportional Integral
REEVRange Extended Electric Vehicle
SHEVSeries Hybrid Electric Vehicle
SOC State Of Charge
UDDSUrban Dynamometer Driving Schedule
WLTP Worldwide Harmonized Light Vehicles Testing Procedure

References

  1. Xu, H.; Chen, Y.; Zhang, L.; Chen, G.; Han, J.; Zhang, Q.; Li, C. Energy Management Strategies for Extended-Range Electric Vehicles with Real Driving Emission Constraints. Appl. Sci. 2024, 15, 142. [Google Scholar] [CrossRef]
  2. Xue, Q.; Zhang, X.; Teng, T.; Zhang, J.; Feng, Z.; Lv, Q. A Comprehensive Review on Classification, Energy Management Strategy, and Control Algorithm for Hybrid Electric Vehicles. Energies 2020, 13, 5355. [Google Scholar] [CrossRef]
  3. Xu, N.; Kong, Y.; Chu, L.; Ju, H.; Yang, Z.; Xu, Z.; Xu, Z. Towards a Smarter Energy Management System for Hybrid Vehicles: A Comprehensive Review of Control Strategies. Appl. Sci. 2019, 9, 2026. [Google Scholar] [CrossRef]
  4. Liang, J.; Li, Y.; Jia, W.; Lin, W.; Ma, T. Comparison of Two Energy Management Strategies Considering Power System Durability for PEMFC-LIB Hybrid Logistics Vehicle. Energies 2021, 14, 3262. [Google Scholar] [CrossRef]
  5. Ehsani, M.; Gao, Y.; Gay, S.E.; Emadi, A. Modern Electric, Hybrid Electric, and Fuel Cell Vehicles; CRC Press: Boca Raton, FL, USA, 2004. [Google Scholar] [CrossRef]
  6. Gao, J.-P.; Zhu, G.-M.G.; Strangas, E.G.; Sun, F.-C. Equivalent fuel consumption optimal control of a series hybrid electric vehicle. Proc. Inst. Mech. Eng. Part D J. Automob. Eng. 2009, 223, 1003–1018. [Google Scholar] [CrossRef]
  7. Nüesch, T.; Cerofolini, A.; Mancini, G.; Cavina, N.; Onder, C.; Guzzella, L. Equivalent Consumption Minimization Strategy for the Control of Real Driving NOx Emissions of a Diesel Hybrid Electric Vehicle. Energies 2014, 7, 3148–3178. [Google Scholar] [CrossRef]
  8. Onori, S.; Serrao, L.; Rizzoni, G. Hybrid Electric Vehicles. In SpringerBriefs in Electrical and Computer Engineering; Springer: London, UK, 2016. [Google Scholar] [CrossRef]
  9. Musardo, C.; Rizzoni, G.; Guezennec, Y.; Staccia, B. A-ECMS: An Adaptive Algorithm for Hybrid Electric Vehicle Energy Management. Eur. J. Control 2005, 11, 509–524. [Google Scholar] [CrossRef]
  10. Li, T.; Li, H.; Li, S.; Li, F.; Li, M.; Liu, H. Energy Management of Hybrid Engineering Vehicles Based on Reinforcement Learning-Based Adaptive Hierarchical Equivalent Consumption Minimization Strategy; Elsevier BV: Amsterdam, The Netherlands, 2024. [Google Scholar] [CrossRef]
  11. Yao, D.; Lu, X.; Chao, X.; Zhang, Y.; Shen, J.; Zeng, F.; Zhang, Z.; Wu, F. Adaptive Equivalent Fuel Consumption Minimization Based Energy Management Strategy for Extended-Range Electric Vehicle. Sustainability 2023, 15, 4607. [Google Scholar] [CrossRef]
  12. Li, J.; Liu, Y.; Qin, D.; Li, G.; Chen, Z. Research on equivalent factor boundary of equivalent consumption minimization strategy for PHEVs. IEEE Trans. Veh. Technol. 2020, 69, 6011–6024. [Google Scholar] [CrossRef]
  13. Wu, J.; Gao, W.; Zhang, Y. A new real-time optimal energy management strategy for range extended electric vehicles considering battery degradation and engine start-up. Adv. Mech. Eng. 2024, 16, 1–15. [Google Scholar] [CrossRef]
  14. Liu, X.; Qin, D.; Wang, S. Minimum Energy Management Strategy of Equivalent Fuel Consumption of Hybrid Electric Vehicle Based on Improved Global Optimization Equivalent Factor. Energies 2019, 12, 2076. [Google Scholar] [CrossRef]
  15. Zhang, H.; Lei, N.; Chen, B.; Li, B.; Li, R.; Wang, Z. Modeling and control system optimization for electrified vehicles: A data-driven approach. Energy 2024, 310, 133196. [Google Scholar] [CrossRef]
  16. Zhang, H.; Lei, N.; Peng, W.; Li, B.; Lv, S.; Chen, B.; Wang, Z. Bi-Level Transfer Learning for Lifelong-Intelligent Energy Management of Electric Vehicles. IEEE Trans. Intell. Transp. Syst. 2025, 26, 16174–16187. [Google Scholar] [CrossRef]
  17. Puma-Benavides, D.S.; Izquierdo-Reyes, J.; Calderon-Najera, J.d.D.; Ramirez-Mendoza, R.A. A Systematic Review of Technologies, Control Methods, and Optimization for Extended-Range Electric Vehicles. Appl. Sci. 2021, 11, 7095. [Google Scholar] [CrossRef]
  18. Guzzella, L.; Sciarretta, A. Vehicle Propulsion Systems, Introduction to Modeling and Optimization, 2nd ed.; Springer: Berlin/Heidelberg, Germany; ETH: Zurich, Switzerland, 2007. [Google Scholar]
  19. QSS Toolbox. Available online: https://idsc.ethz.ch/research-guzzella-onder/downloads.html (accessed on 22 July 2025).
  20. Technical Specifications. BMW i3 94 Ah. Available online: https://www.press.bmwgroup.com/global/article/attachment/T0259598EN/359587 (accessed on 22 July 2025).
  21. Available online: https://www.anl.gov/taps/d3-2014-bmw-i3rex (accessed on 8 July 2022).
  22. Keldiyarova, M.; Ruzimov, S.; Bonfitto, A.; Mukhitdinov, A. Comparison of two control strategies for range extender hybrid electric vehicles. In Proceedings of the 2022 International Symposium on Electromobility (ISEM), Puebla, Mexico, 17–19 October 2022; IEEE: Piscataway, NJ, USA, 2022; pp. 1–6. [Google Scholar] [CrossRef]
  23. Sivertsson, M.; Sundström, C.; Eriksson, L. Adaptive Control of a Hybrid Powertrain with Map-based ECMS. IFAC Proc. Vol. 2011, 44, 2949–2954. [Google Scholar] [CrossRef]
  24. Fotouhi, A.; Auger, D.J.; Propp, K.; Longo, S.; Wild, M. A review on electric vehicle battery modelling: From Lithium-ion toward Lithium–Sulphur. Renew. Sustain. Energy Rev. 2016, 56, 1008–1021. [Google Scholar] [CrossRef]
  25. Battery Pack Laboratory Testing Results–2014 BMW i3 REX–VIN 3436. Available online: https://avt.inl.gov/sites/default/files/pdf/phev/batteryi3436.pdf (accessed on 22 July 2025).
  26. Curve Fitting Toolbox. Available online: https://www.mathworks.com/products/curvefitting.html (accessed on 22 July 2025).
  27. Serrao, L.; Sciarretta, A.; Grondin, O.; Chasse, A.; Creff, Y.; Di Domenico, D.; Pognant-Gros, P.; Querel, C.; Thibault, L. Open Issues in Supervisory Control of Hybrid Electric Vehicles: A Unified Approach Using Optimal Control Methods. Oil Gas Sci. Technol.–Rev. IFP Energ. Nouv. 2013, 68, 23–33. [Google Scholar] [CrossRef]
  28. Zhang, F.; Wang, L.; Coskun, S.; Pang, H.; Cui, Y.; Xi, J. Energy Management Strategies for Hybrid Electric Vehicles: Review, Classification, Comparison, and Outlook. Energies 2020, 13, 3352. [Google Scholar] [CrossRef]
Figure 1. The sequence of calculating virtual fuel consumption: (a) during battery discharging ( P b a t t 0 ) and (b) during battery charging ( P b a t t < 0 ).
J 08 00044 g001
Figure 2. The variation in battery outputs as a function of battery state of charge S O C [-] for single cell of battery: (a) open circuit voltage V O C V , [V]; (b) charge resistance R c h g , [Ohm]; and (c) discharge resistance R c h g , [Ohm].
J 08 00044 g002
Figure 3. The efficiency map of battery system as a function of battery power and SOC: (a) the charging efficiency; and (b) discharging efficiency.
J 08 00044 g003
Figure 4. The effect of varying proportional coefficients and initial values of equivalence factor when S O C t = 0.1 : (a) K p = 0.1 ; (b) K p = 0.5 ; and (c) K p = 2 .
J 08 00044 g004
Figure 5. The variation of S S O C as a function of battery SOC for different values of k s when: (a) S O C t = 0.08 ; (b) S O C t = 0.1 ; and (c) S O C t = 0.12 .
J 08 00044 g005
Figure 6. Sample of results for generator power, fuel consumption, battery SOC, fixed discharging and charging coefficients under UDDS cycle.
J 08 00044 g006
Figure 7. Sample of results for generator power, fuel consumption, battery SOC, variable discharging and charging coefficients under UDDS cycle.
J 08 00044 g007
Figure 8. Sample of results for generator power, fuel consumption, battery SOC, fixed discharging and charging coefficients under NEDC cycle.
J 08 00044 g008
Figure 9. Sample of results for generator power, fuel consumption, battery SOC, variable discharging and charging coefficients under NEDC cycle.
J 08 00044 g009
Table 1. The main specifications of REEV.
ParameterUnitValue
Design curb weightkg1390
Electric machine
Maximum powerkW125
Maximum torqueNm250
Transmission
Transmission ratio-9.7:1
Engine
Displacementl0.647
Power outputkW25
Torque outputNm55
Generator
Power outputkW26.6
Battery
Nominal cell voltageV3.7
Nominal system voltageV355.2
Rated pack capacityAh60
Rated pack energykWh18.8
Table 2. Comparative results of fuel consumption in different drive cycles.
Equivalence FactorDrive Cycle∆SOC, [%]Actual Fuel Consumption, [g]Correction of Fuel Consumption, [g]
ConstantUDDS−0.48371397.4
NEDC−0.82362408
WLTC−4.1573798
HWFET−2.65305451
VariableUDDS−0.2376386
NEDC−0.08392396.5
WLTC−3.28600780
HWFET−2.45311446
Table 3. Comparative results of fuel consumption and final SOC for three distinct penalty functions.
Drive
Cycle
Linear Penalty FunctionExponential Penalty
Function
PI-Controlled Penalty Function
F C , [ g ] S O C f , [%] F C , [ g ] S O C f , [%] F C , [ g ] S O C f
UDDS30815.222.0511.11228.214.13
NEDC274.114.5845.1311.2993.4112.05
WLTP71012.58368.17.5125.85
HWFET39513.0267.88.28535612.49
Disclaimer/Publisher’s Note: The statements, opinions and data contained in all publications are solely those of the individual author(s) and contributor(s) and not of MDPI and/or the editor(s). MDPI and/or the editor(s) disclaim responsibility for any injury to people or property resulting from any ideas, methods, instructions or products referred to in the content.