1. Introduction
Currently, WSNs are widely used in safety-critical applications such as healthcare, military operations, and industrial monitoring applications [
1,
2,
3]. These applications require a high degree of dependability such as service avaliability, reliability, and energy efficiency. In such applications, where system failures can result in catastrophic consequences, ensuring that the network continues to function reliably is paramount importance. Hence, optimizing the key functional objectives, coverage, connectivity, and network lifetime in a resource-constrained WSN environment is a significant challenge. This demands a high-level Quality of Service (QoS) WSN to ensure the dependable operations of the sensor nodes. A bio-inspired approach offers multiple solutions to the MOOP in WSNs, not only enhancing energy optimization but also improving the reliability of network services, which are essential for maintaining the continuous operation of WSNs in hazardous environments [
4].
The bio-inspired approach provides a conceptual foundation and guiding principles for solving the MOOP, leading to the development of many bio-incpired algorithms such as Genetic, Bat, Bird, Greywolf, and Firefly Algorithms. The proposed Bird Flocking Node Scheduling algorithm presents a promising solution for addressing the complex optimization challenges of WSNs. By mimicking the cooperative behavior of bird flocks traveling over long distances, this model enables a decentralized node scheduling solution that minimizes energy consumption while ensuring reliable operation in WSNs. Furthermore, we incorporated the Lyapunov function as it guides the algorithm toward the optimal solution, which is maintaining balance among multiple objectives such as energy effeciency, connectivity, and coverage. That is because a WSN is a dynamic system and Lyapunov funtion is used for stability analysis in optimization algorithms for dynamic systems. In WSN systems, the main goal is to find a connected coverage and a useful network lifetime. This is achieved by adapting the sleep/awake schedule of sensor nodes, ensuring an energy-efficient, scalable, and robust solution for dependable WSN systems.
As discussed in
Section 2, the literature presents a plethora of attempts to address the MOOP in WSNs. However, these approaches do not necessarily aim to find the optimal solution but rather focus on solving a specific problem by addressing one or two of the MOOP objectives. To overcome these limitations, we establish a new foundation based on an evolutionary bio-inspired Bird Flocking approach, enabling a more comprehensive exploration of the solution space to achieve optimal results. Building on this foundation, the main contributions of this paper are twofold. First, we propose a novel implementation of the Bio-Inspired Bird Flocking Node Scheduling algorithm. Second, we evaluate the effectiveness of the proposed algorithm against the BAT Bio-Inspired Node Scheduling algorithm. This evaluation is conducted through MATLAB simulations, where multiple optimal solutions are identified. The results demonstrate significant improvements in network service availability and reliability, which are crucial attributes for ensuring the dependability of WSNs, particularly in safety-critical applications.
This paper is structured as follows:
Section 1 lays the foundation of this work including the problem definition of the MOOP in WSN.
Section 2 discusses related work.
Section 3 introduces the proposed Bird Flocking Node Scheduling algorithm with its mathematical representation,
Section 3.1 presents the formulation of the problem and
Section 3.2 discusses the use-case scenario of the Bird Flocking Node Scheduling algorithm.
Section 4 covers the experimentation and the discussion of the results of this work. Finally,
Section 5 presents our conclusion and future work.
2. Related Work
WSNs have attracted significant research attention due to their critical role in various applications, such as environmental monitoring, military surveillance, and smart infrastructure [
1]. However, optimizing WSN performance remains a complex challenge due to conflicting objectives like energy efficiency, coverage, and network connectivity. To address this, researchers have explored various optimization techniques, utilizing bio-inspired and evolutionary algorithms emerging as promising solutions. These algorithms, inspired by natural processes, provide adaptive and scalable methods for solving the MOOP in WSNs [
5].
Over the years, several bio-inspired algorithms have been proposed to enhance different aspects of WSN performance. While some methods, such as Genetic Algorithms, focus primarily on energy optimization [
6,
7], others, like BAT-based algorithms, employ cost functions to enhance network efficiency [
8]. Additionally, techniques like the Bird Flocking Algorithm have been applied to anomaly detection in WSN data streams [
9]. The following section provide an overview of key bio-inspired approaches that have been utilized to tackle the MOOP in WSNs, highlighting their advantages and limitations.
The author in [
9] explores topology management in WSNs using a flocking model based on sensor node density in a 2D space. Nodes form flocks based on density similarity, allowing for efficient topology adjustments without extensive offline computations. However, this approach assumes that all nodes remain active, which is unrealistic, as WSN nodes alternate between active and sleep states, affecting network dynamics.
In [
10], a distributed energy-efficient Firefly Algorithm is introduced for coverage optimization in WSNs. Nodes with high energy levels move to higher altitudes, while lower-energy nodes descend, balancing energy distribution. A grid-based clustering approach selects high-energy nodes as aggregators, improving coverage and energy efficiency.
The Bat-Naturally Inspired Algorithm (NIA) proposed in [
11] focuses on target-connected coverage by utilizing two bats—one for identifying active nodes and another for determining connectivity paths. Unlike traditional binary-based approaches, this method adapts to continuous search spaces, considering energy depletion. However, the study does not include node scheduling, assuming all nodes remain active.
A fuzzy logic-based clustering approach is explored in [
12] to tackle the MOOP. By constructing a fitness function, the algorithm ensures efficient data transmission to the base station while minimizing energy consumption. This approach is similar to the BAT Node Scheduling algorithm, which leverages Particle Swarm Optimization (PSO) but with different optimization parameters.
Paper [
13] presents a Cuckoo Search Algorithm utilizing Cauchy optimization to enhance both coverage and routing in WSNs. The technique employs dynamic clustering but does not address connectivity or practical scheduling mechanisms like Time Division Multiple Access (TDMA). Moreover, its energy loss estimation is considered overly optimistic, as packet delivery rates are not factored into the analysis.
A hybrid multi-objective optimization technique integrating Firefly and Greywolf Algorithms is introduced in [
14] to improve connectivity, coverage, and network lifetime. This approach leverages the Pareto front to analyze trade-offs among the three objectives. While effective, the increased computational complexity and convergence time pose challenges. Unlike [
14], our work leverages a new approach which utilizes a Lyapunov function that helps toward stabilizing and maintaining variables in the WSN, in particular, extending the network lifetime while stablizing connectivity and coverage metrics.
Another bio-inspired optimization method proposed in [
15] utilizes Firefly Optimization (FA) for target location coverage and connectivity. A multi-objective fitness function is introduced, considering factors such as network survival, distance to the base station, and coverage quality. While effective for homogeneous networks, the approach does not account for heterogeneous deployments, which are common in real-world WSN applications.
In [
16], an improved Greywolf Optimization Algorithm is proposed, introducing an energy-saving coverage model that ensures each point in the target area is covered by at least one sensor node. This enhancement significantly improves coverage and energy efficiency compared to traditional Greywolf methods.
While the existing bio-inspired approaches provide valuable solutions for WSN optimization, they often prioritize one or two MOOP objectives—primarily energy efficiency—while neglecting a holistic approach to coverage, connectivity, and lifetime. In our previous work, we introduced the BAT algorithm [
17], which successfully optimized all three objectives simultaneously, demonstrating its effectiveness for reliable WSN systems. Building on this foundation, we propose further enhancements by integrating the Bird Flocking Algorithm. Inspired by the natural behavior of bird flocks maintaining energy efficiency over long migrations, we adapt this principle to node scheduling and energy optimization in WSNs. Our proposed method aims to achieve a superior balance among coverage, connectivity, and energy efficiency, addressing the limitations observed in prior research.
3. Bird Flocking Node Scheduling Algorithm
The Bird Flocking Optimization Algorithm (BFOA) extends the standard Bird Flocking Algorithm by adding migration to enhance global search efficiency [
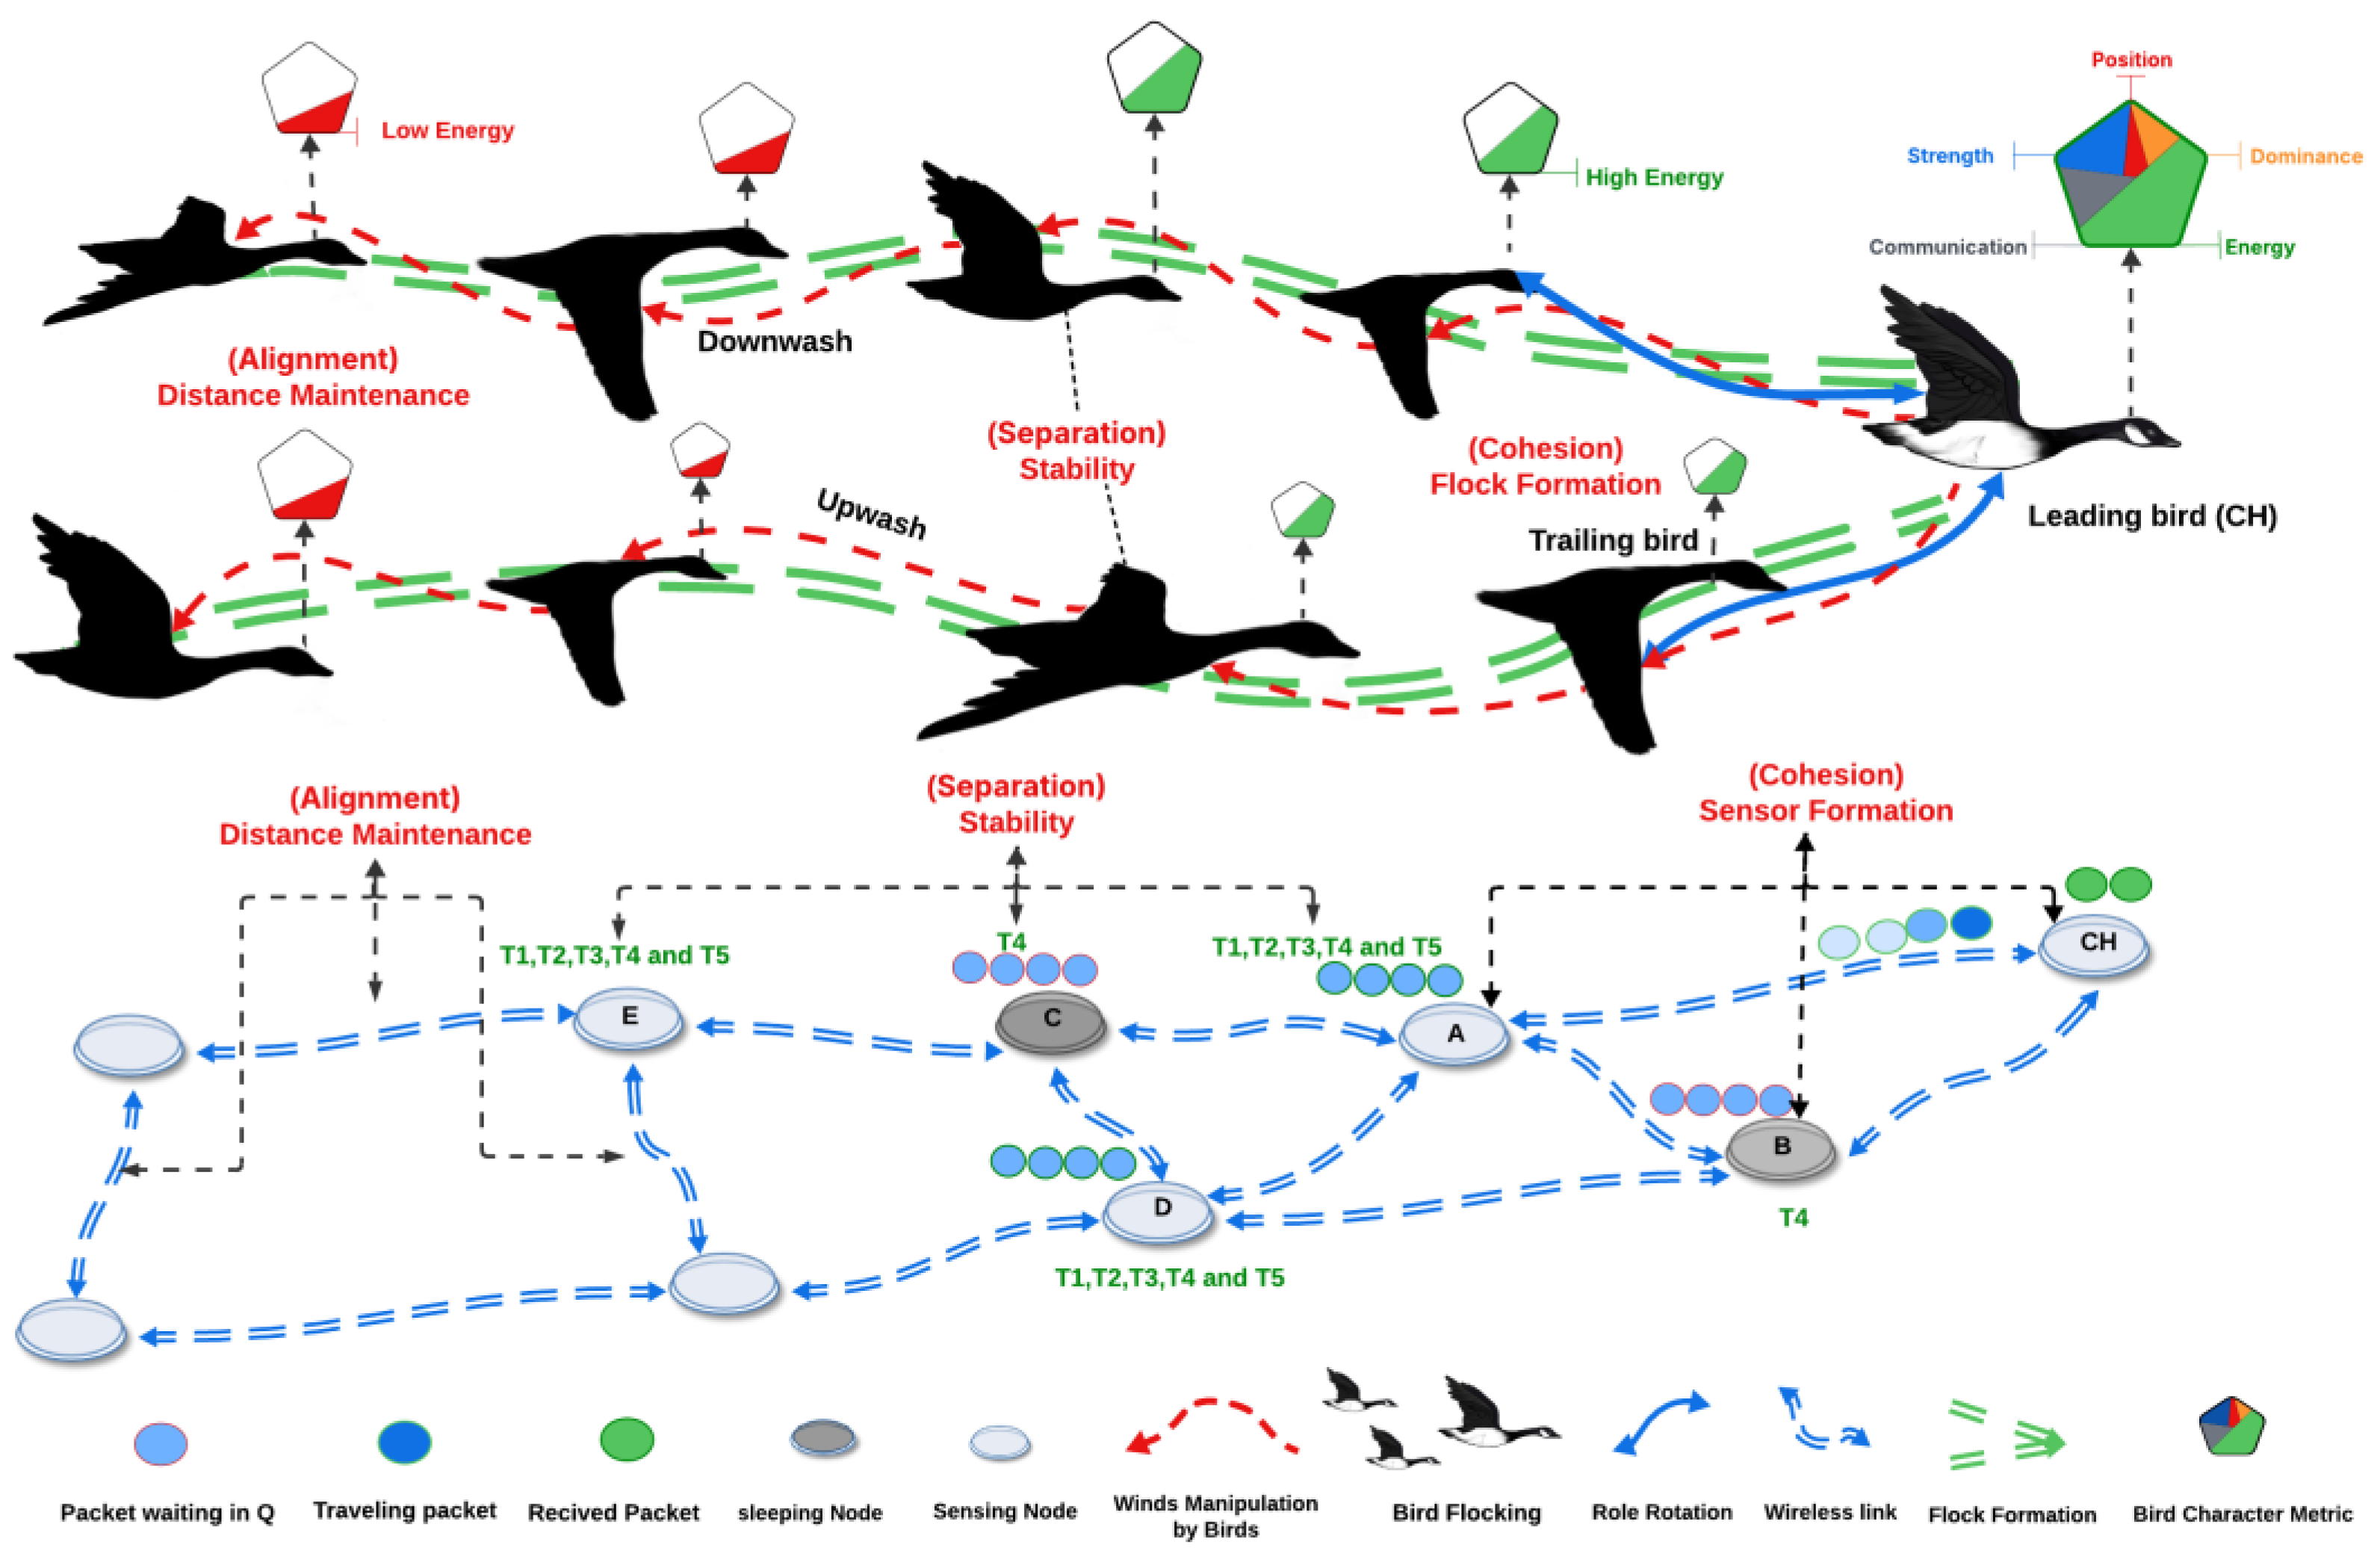
18]. In this work, a Bird Flocking Node Scheduling algorithm based on the natural behaviors of bird flocks traveling over a long distance is proposed. For instance, birds such as geese can fly hundreds to over a thousand kilometers without deviating from their path, relying on energy reserves, environmental cues, and aerodynamic efficiency, as shown in
Figure 1. The process of the Bird Flocking Node Scheduling algorithm involved three key principles: separation, alignment, and cohesion. In the proposed Bird Flocking Node Scheduling algorithm, birds/agents avoid local optima by periodically shifting their search areas, guided by leader–followers dynamics [
19].
This algorithm is widely applied in WSNs for energy-efficient routing, swarm robotics and UAV path planning, as well as various optimization problems [
20]. This algorithm is especially effective in situations requiring distributed, decentralized control, enabling nodes to adapt naturally to environmental changes or network conditions, much like birds flocking together [
21,
22]. By incorporating natural flocking behavior into the WSN model, the Bird Flocking Node Scheduling algorithm is developed to tackle multi-objective optimization challenges, such as energy conservation, connectivity, and extending network lifetime.
Figure 1 presents a bio-inspired, Lyapunov-stabilized scheduling framework for WSNs, modeled after bird flocking behavior. The approach incorporates three core principles: cohesion, which promotes CH formation and maintains network topology; separation, which ensures collision avoidance through distance-based spacing; and alignment, which synchronizes node activity via sleep/awake scheduling. By mapping these flocking behaviors to WSN operations, the algorithm enhances energy efficiency, communication reliability, and overall network stability—facilitating convergence toward an optimal operational state. Each principle in this model is drawn from natural flocking behavior and adapted to the sensor network context, as detailed in
Table 1:
In what follows is a practical example based on
Figure 1 illustrates the WSN framework. Here, nodes A, D, and E form the backbone of the network, remaining continuously active across all time steps (T1–T5). These nodes serve as core transmitters and ensure uninterrupted data flow to the CH. Their role is governed by cohesion principles, where their fixed proximity supports the formation of a connected and robust subgraph, enabling stable communication paths and preserving overall topology (Cohesion–Sensor Formation).
Meanwhile, nodes B and C begin in sleep mode during early time steps (e.g., T1–T3), conserving energy. Although inactive, they continue to contribute to cohesion by forming CHs and coordinated subnetworks, thus preventing topological drift and preserving the virtual structure of the cluster.
At time step T4, increasing queue backlogs at nodes A and D raise localized Lyapunov values Vi(t), signaling potential network instability. This triggers dynamic separation behavior (Separation–Dynamic Stability), where nodes B and C are selectively awakened. Their reactivation ensures that the network adapts to the current load without overcrowding the active nodes, maintaining safe spacing and reducing transmission collisions.
Upon waking, nodes B and C exhibit alignment behavior by synchronizing their sleep/awake schedules with their neighbors (Alignment–Direction Synchronization). This avoids desynchronization or data loss and ensures seamless reintegration into the routing paths (Alignment–Distance Maintenance). By time step T5, all five nodes (A–E) are active and fully synchronized. The Lyapunov function V(t) reflects stable convergence, and the network achieves optimal sensing coverage, full connectivity, and improvement in the network lifetime.
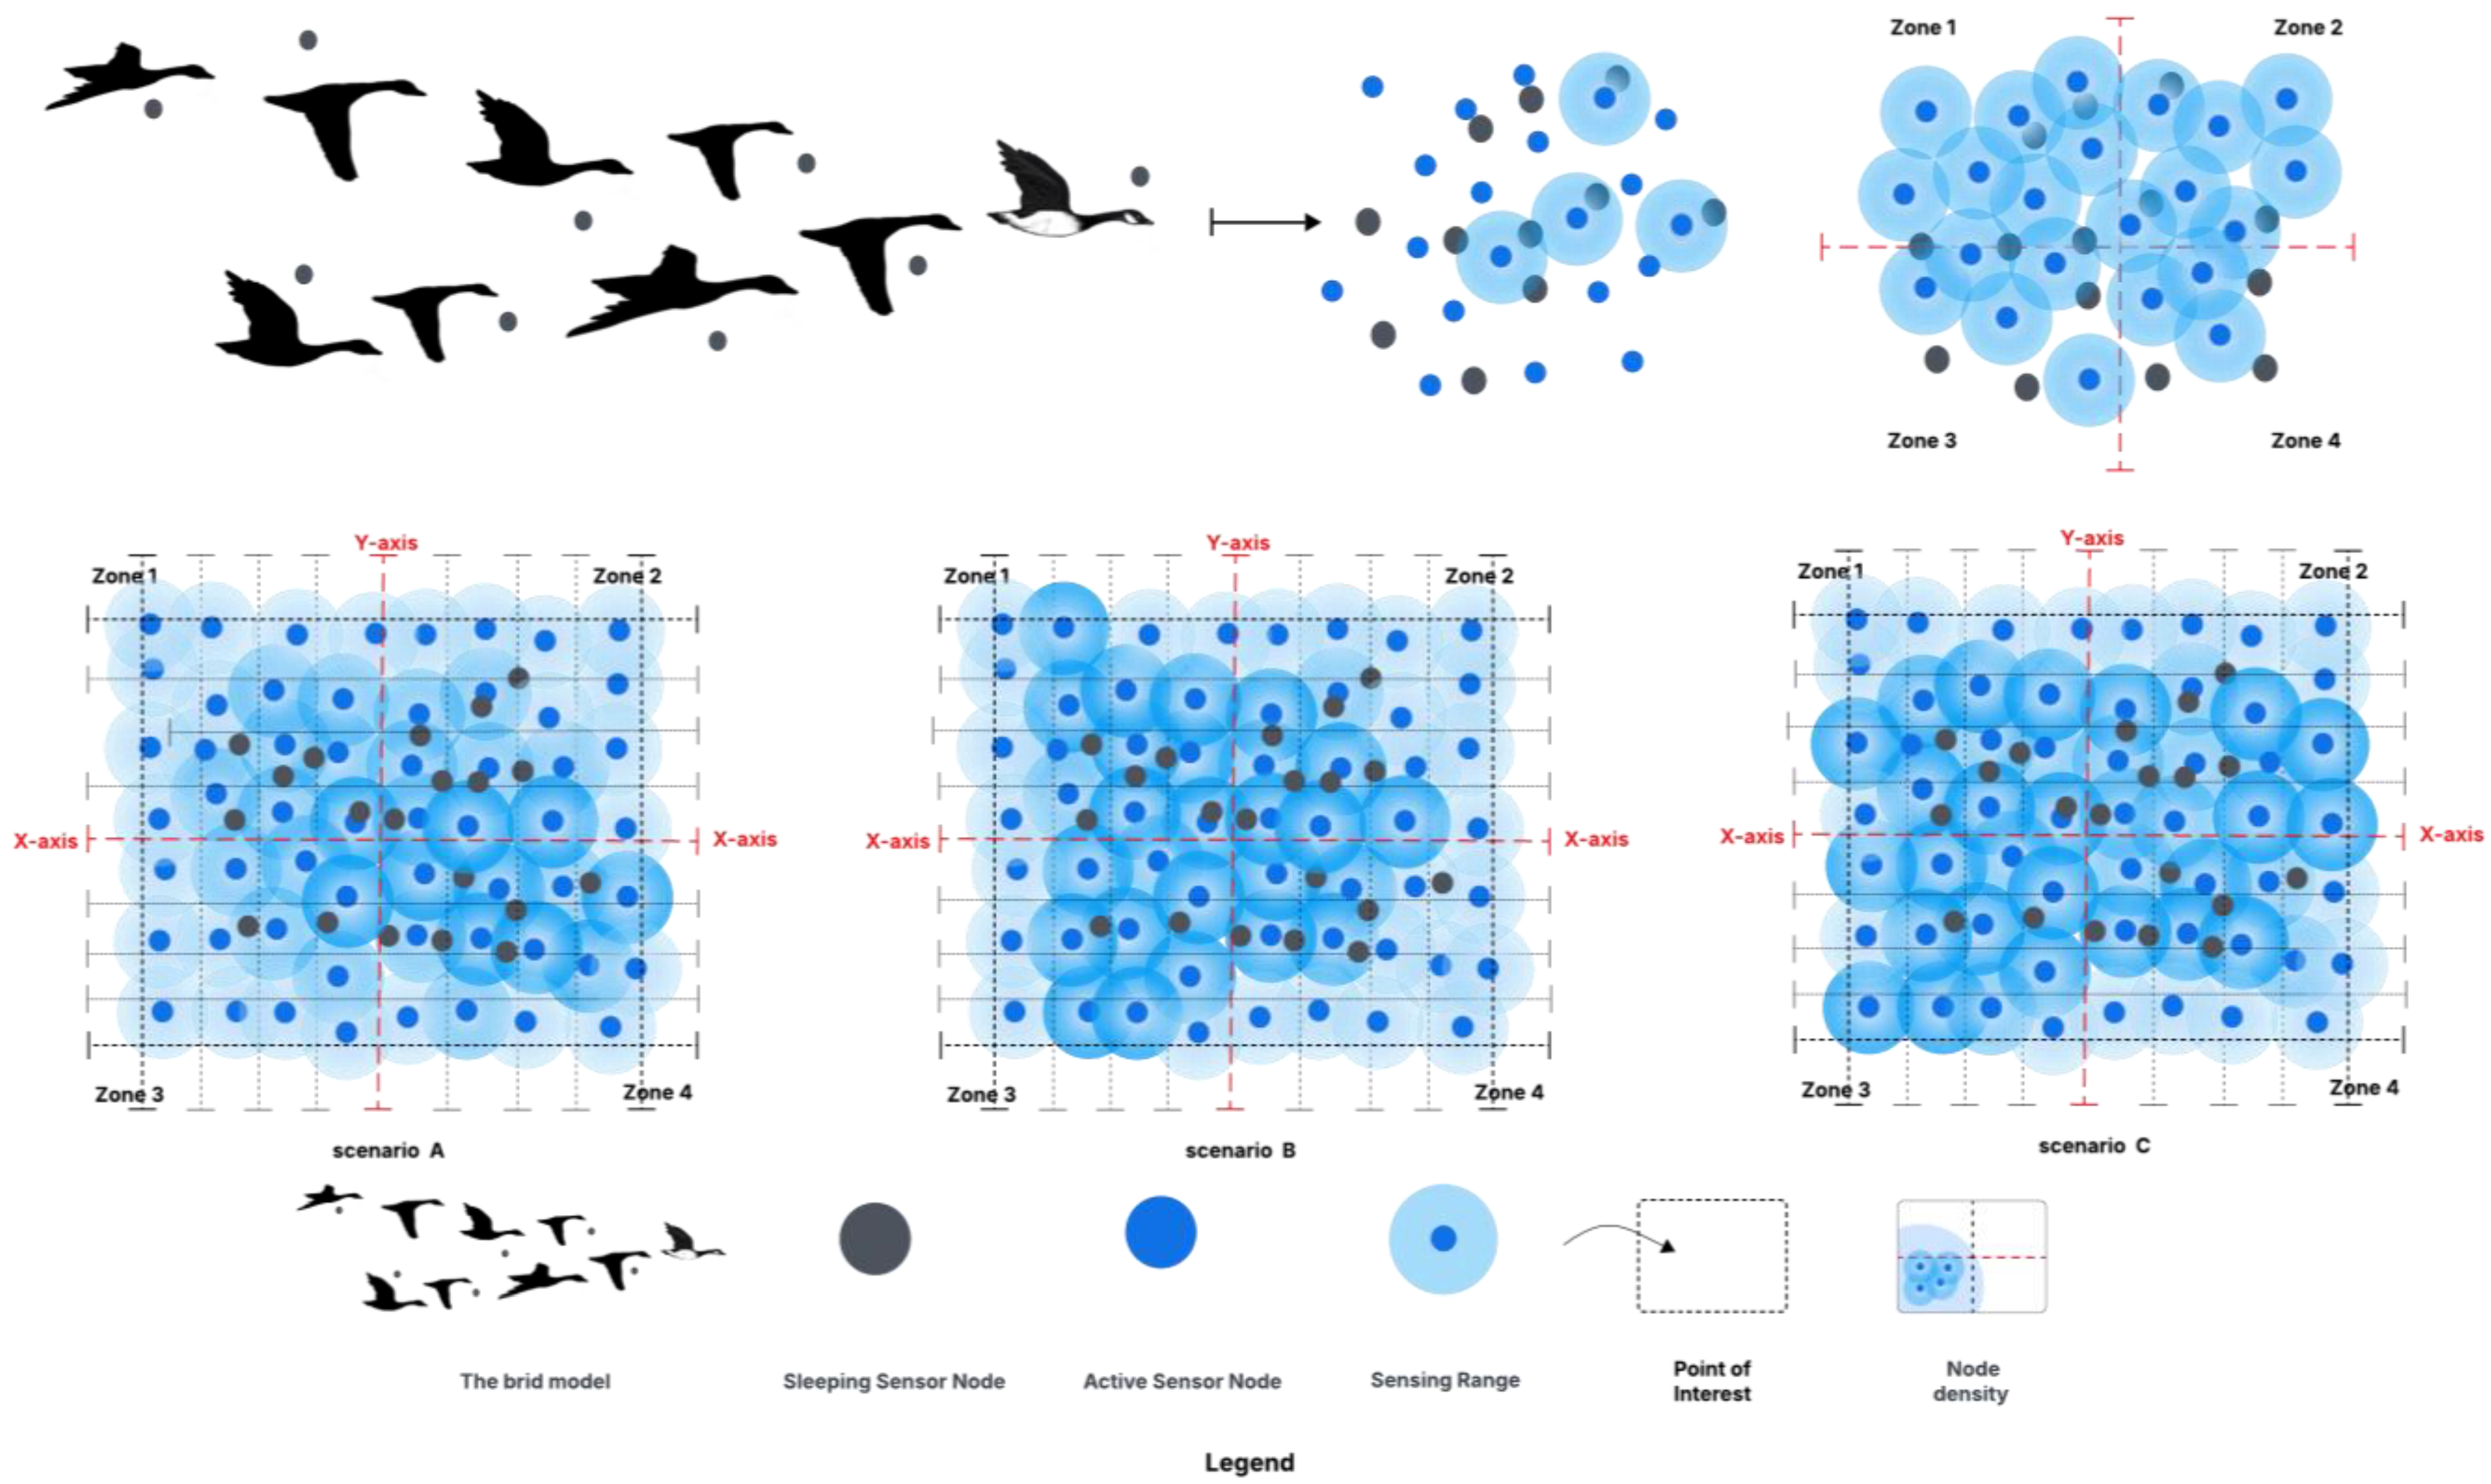
Figure 2 illustrates the integration of the Bird Flocking model with Lyapunov functions to enhance WSN performance by ensuring coverage, connectivity, and extended network lifetime. Active nodes (e.g., CHs) manage queues efficiently, reducing congestion and maintaining sink communication. This bio-inspired, distributed approach enables scalable, stable, and energy-efficient WSN operation—ideal for mission-critical, long-term deployments.
3.1. Problem Formulation and Mathmetical Framework
Inspired by the avian flocking behavior model, we propose an optimized connected coverage and long-lifetime WSN model to enhance network performance. Our solution enables sensor nodes to dynamically switch between ON and OFF states based on a predefined sleep/awake schedule, effectively extending network lifetime. It is worth mentioning that our solution considers CHs rotation based on node residual energy levels, thereby, ensuring balanced energy consumption. Our approach seeks to overcome key challenges such as network fragmentation, excessive energy depletion, and reduced service reliability by ensuring efficiency, and seamless sleep/awake schedule within the network.
To tackle these issues, we introduce a mathematical framework based on the Lýapunov function, which stabilizes CH transitions while optimizing ON/OFF scheduling to minimize energy wastage and enhance overall network longevity.
- 1.
Energy Model with ON/OFF Strategy
Each node i has an energy function defined as
where
Ei(t) is the energy level of node i at time t;
is the node state (0 = OFF, 1 = ON);
is the energy consumed when the node is in the ON state (active mode);
is the energy consumed when the node is in the OFF state (sleep mode, typically small).
When a node is in OFF state , it does not consume significant energy except for minimal maintenance tasks. When the node is in the ON state , it actively participates in data sensing, transmission, and aggregation.
- 2.
Predefined Sleep/Awake Scheduling Rule
The sleep/awake scheduling rule is predefined based on the energy levels of the nodes and a fixed duty cycle. The predefined schedule ensures that nodes alternate between ON and OFF states in a controlled equal manner, contributing to energy efficiency and prolonged network lifetime. The rule follows these conditions:
Energy-Based State Transition:
At each time step t, each node i follows the rule:
Hence, the predefined sleep/awake scheduling rule is as follows:
Nodes follow a duty cycle (fixed period of being ON and OFF) to conserve energy and extend network lifetime.
A node will remain ON (active) when its energy is above a threshold Eth and will enter sleep (OFF) when its energy falls below this threshold.
- 3.
CH Transition Rule
CHs are selected based on energy thresholds:
where
- 4.
Lyapunov Stability Condition
To ensure stable CH transitions, we define the Lýapunov function:
where
is the initial maximum energy level of each node. The stability condition for the system is that the Lyapunov function must decrease over time, ensuring that energy depletion is managed efficiently:
This ensures gradual energy depletion, preventing frequent CH changes and instability.
- 5.
Optimal ON/OFF Scheduling to Minimize Energy Consumption
The goal is to minimize total energy usage while ensuring full network coverage:
subject to the following:
Coverage constraint: At least one node remains active in each sensing region.
CH stability constraint: , preventing excessive role transitions.
Building on the previous mathematical model, the WSN system behavior mirrors the flocking dynamics of birds, where nodes alternate between ON and OFF states to evenly distribute energy consumption across the network. Sensor node rotation ensures that high-energy nodes assume leadership roles, while low-energy nodes enter sleep mode to conserve power.
The Lýapunov function plays a crucial role in stabilizing the system by preventing erratic transitions, maintaining energy balance, and optimizing network performance over time. Consequently, we develop an adaptive scheduling Algorithm 1 that effectively harmonizes energy conservation with continuous network coverage, ensuring long-term reliability, service availability, and minimal energy wastage.
| Algorithm 1: Bird Flocking Node Scheduling Algorithm |
| 1: | Initialize network parameters: |
| 2: | - N: Number of sensor nodes |
| 3: | - E_max: Initial maximum energy level of each node |
| 4: | - E_th: Energy threshold for sleep/awake transitions |
| 5: | - CH: Current cluster head |
| 6: | - Duty_Cycle: Fixed ON/OFF schedule |
| 7: | - Q[i]: Queue backlog for each node i |
| 8: | - V_weight: Lyapunov weighting factor |
| 9: | |
| 10: | Function Initialize_Nodes(): |
| 11: | For each node i in N: |
| 12: | E[i] = E_max # Initialize energy levels (Equation (1)) |
| 13: | S[i] = 1 # All nodes start in ON state (Equation (1)) |
| 14: | Q[i] = 0 # Initialize queue backlog for each node |
| 15: | |
| 16: | Function Update_Energy(i, S[i]): |
| 17: | If S[i] == 1: |
| 18: | E[i] = E[i]-C_ON[i] # Consume ON energy (Equation (1)) |
| 19: | Else: |
| 20: | E[i] = E[i]-C_OFF[i] # Consume minimal OFF energy (Equation (1)) |
| 21: | |
| 22: | Function Sleep_Awake_Schedule(): |
| 23: | For each node i in N: |
| 24: | If E[i] > E_th: |
| 25: | S[i] = 1 # Node stays awake (Equation (2)) |
| 26: | Else: |
| 27: | S[i] = 0 # Node goes to sleep (Equation (2)) |
| 28: | |
| 29: | Function Compute_Lyapunov_Metric(): |
| 30: | For each node i in N: |
| 31: | Lyapunov_Metric[i] = V_weight * Q[i] # Compute Lyapunov metric based on backlog |
| 32: | Sort nodes by Lyapunov_Metric in descending order # Prioritize CHs with high queue backlog |
| 33: | |
| 34: | Function Select_New_CH(): |
| 35: | If E[CH] < E_th: |
| 36: | CH = argmax(E[i] for i in N if i != CH) # Select node with max energy (Equation (3)) |
| 37: | |
| 38: | Function Lyapunov_Stability(): |
| 39: | V_t = sum((E_max-E[i])^2 for i in N) # Lyapunov function at time t (Equation (4)) |
| 40: | V_next = sum((E_max-E[i])^2 for i in N after update) # Lyapunov function at time t+1 (Equation (4)) |
| 41: | Return (V_next-V_t) <= 0 # Stability condition (Equation (5)) |
| 42: | |
| 43: | Function Maintain_Coverage(): |
| 44: | For each CH: |
| 45: | If d(CH, nearest_active_node) > R: # Distance exceeds threshold |
| 46: | Select closest OFF node and activate it # Extra-ON rule |
| 47: | |
| 48: | Main Algorithm: |
| 49: | Initialize_Nodes() |
| 50: | While Network is operational: |
| 51: | Compute_Lyapunov_Metric() # Prioritize nodes with high queue backlog |
| 52: | For each node i in N: |
| 53: | Sleep_Awake_Schedule() |
| 54: | Update_Energy(i, S[i]) |
| 55: | Select_New_CH() |
| 56: | If not Lyapunov_Stability(): |
| 57: | Adjust CH selection and sleep scheduling |
| 58: | Maintain_Coverage() # Ensure at least one node is active per region (Equation (6)) |
| 59: | |
| 60: | End |
This algorithm dynamically schedules cluster heads in a WSN based on energy efficiency, connectivity, and queue backlog using the Lyapunov function. It ensures that nodes are optimally activated while maintaining coverage and network stability.
3.2. Use-Case Scenario of the Bird Flocking Algorithm
In this use-case scenario, the following steps outline the functionality of Algorithm 1, which adapts the behavior of Bird Flocking techniques to address the MOOP in a WSN. The algorithm prioritizes key metrics such as coverage, connectivity, and network lifetime to meet the dependability requirements:
The first step is the group selection of cluster head nodes: The group of cluster heads (CHs) to be turned ON for the current round is determined using (r mod k) + 1, where k is the number of subsets in the network. Cluster heads that belong to this group are identified as ON_CH, while those that do not belong are identified as OFF_CH.
The second step is the identification of the Lyapunov Scheduling function: For each ON_CH, a Lyapunov metric is calculated, which is the queue backlog (Q) at which the CH is weighted by V_weight. The V_weight acts as a knob to tradeoff between stabilizing queues (high V) and minimizing energy (low V). This metric determines the priority of turning cluster heads on. The CHs are then sorted in descending order of the Lyapunov metric to prioritize those with higher backlog, ensuring that nodes with the largest queues get activated.
The third step is turning ON the cluster heads and the children nodes: After calculating the Lyapunov metrics and reordering the cluster heads based on their importance, the corresponding nodes (including the children nodes) are marked as ON in the ON array.
The fourth step is finalizing the nodes in the network: Nodes that are not turned ON are removed from the network by setting their entries in net to 0.
The fifth step is returning the values: The Lyapunov function returns the updated-ON array. It is important to note that the Lyapunov function is used to optimize the scheduling of cluster heads by minimizing queue backlogs across the network. The higher the backlog, the higher the priority for activating the respective cluster head. Additionally, the Extra-ON rule ensures that nodes located too far from active cluster heads have a nearby cluster head turned on to improve coverage. The scheduling decision is made by selecting and scheduling cluster heads based on both their distance and queue backlog, ensuring network stability and efficiency.
4. Experimentation and Discussion
In this study, a simulation-based experiment is conducted to analyze the performance of the proposed Bird Flocking Node Scheduling algorithm. The experiments were conducted using MATLAB R2018b-based event-driven programming simulator. A comparative analysis is performed to evaluate the proposed Bird Flocking Node Scheduling algorithm against the BAT Node Scheduling algorithm. Thus, in this experiment, the following assumptions and parameters are considered, as detailed in
Table 2.
4.1. Experimentation Assumptions
In this study, we assume a uniform deployment with a random distribution of sensor nodes across the monitored area. The area is structured into multiple grids, each representing a Point of Interest (POI). To ensure that events are detected and reported to the base station, we adopt a probability coverage model, where network coverage intensity is maintained at a high level.
A POI is defined as a region that must be covered by at least one sensor node within the WSN. To guarantee sufficient coverage, the coverage metric is set to be greater than or equal to the total area being monitored. Additionally, we assume that once sensor node connectivity is established, all nodes within the WSN remain connected. This ensures that a continuous communication path is maintained between the base station and all deployed nodes.
Furthermore, network lifetime is defined as the period during which the sensor nodes can sustain a connected coverage state, ensuring the expected operational functionality of the WSN.
Figure 3 illustrates potential spatial coverage scenarios, highlighting variations in node density randomly distributed within different zones of the monitored area.
The simulation consists of multiple rounds, with each round involving sensing and reporting of the collected data back to the base station. The parameters used in this study, including simulation settings, coverage, and node configurations, are consistent with those commonly found in the literature [
9,
23,
24,
25]. These values are adopted for the simulator environment. Furthermore, the realistic energy model commonly referenced in [
7] is adopted for this simulation. However, the successful deployment of Flocking Bird systems in WSNs necessitates careful attention to specific various system parameters and considerations such as coverage, connectivity, energy constrains, and adaptive sleep/awake schedule.
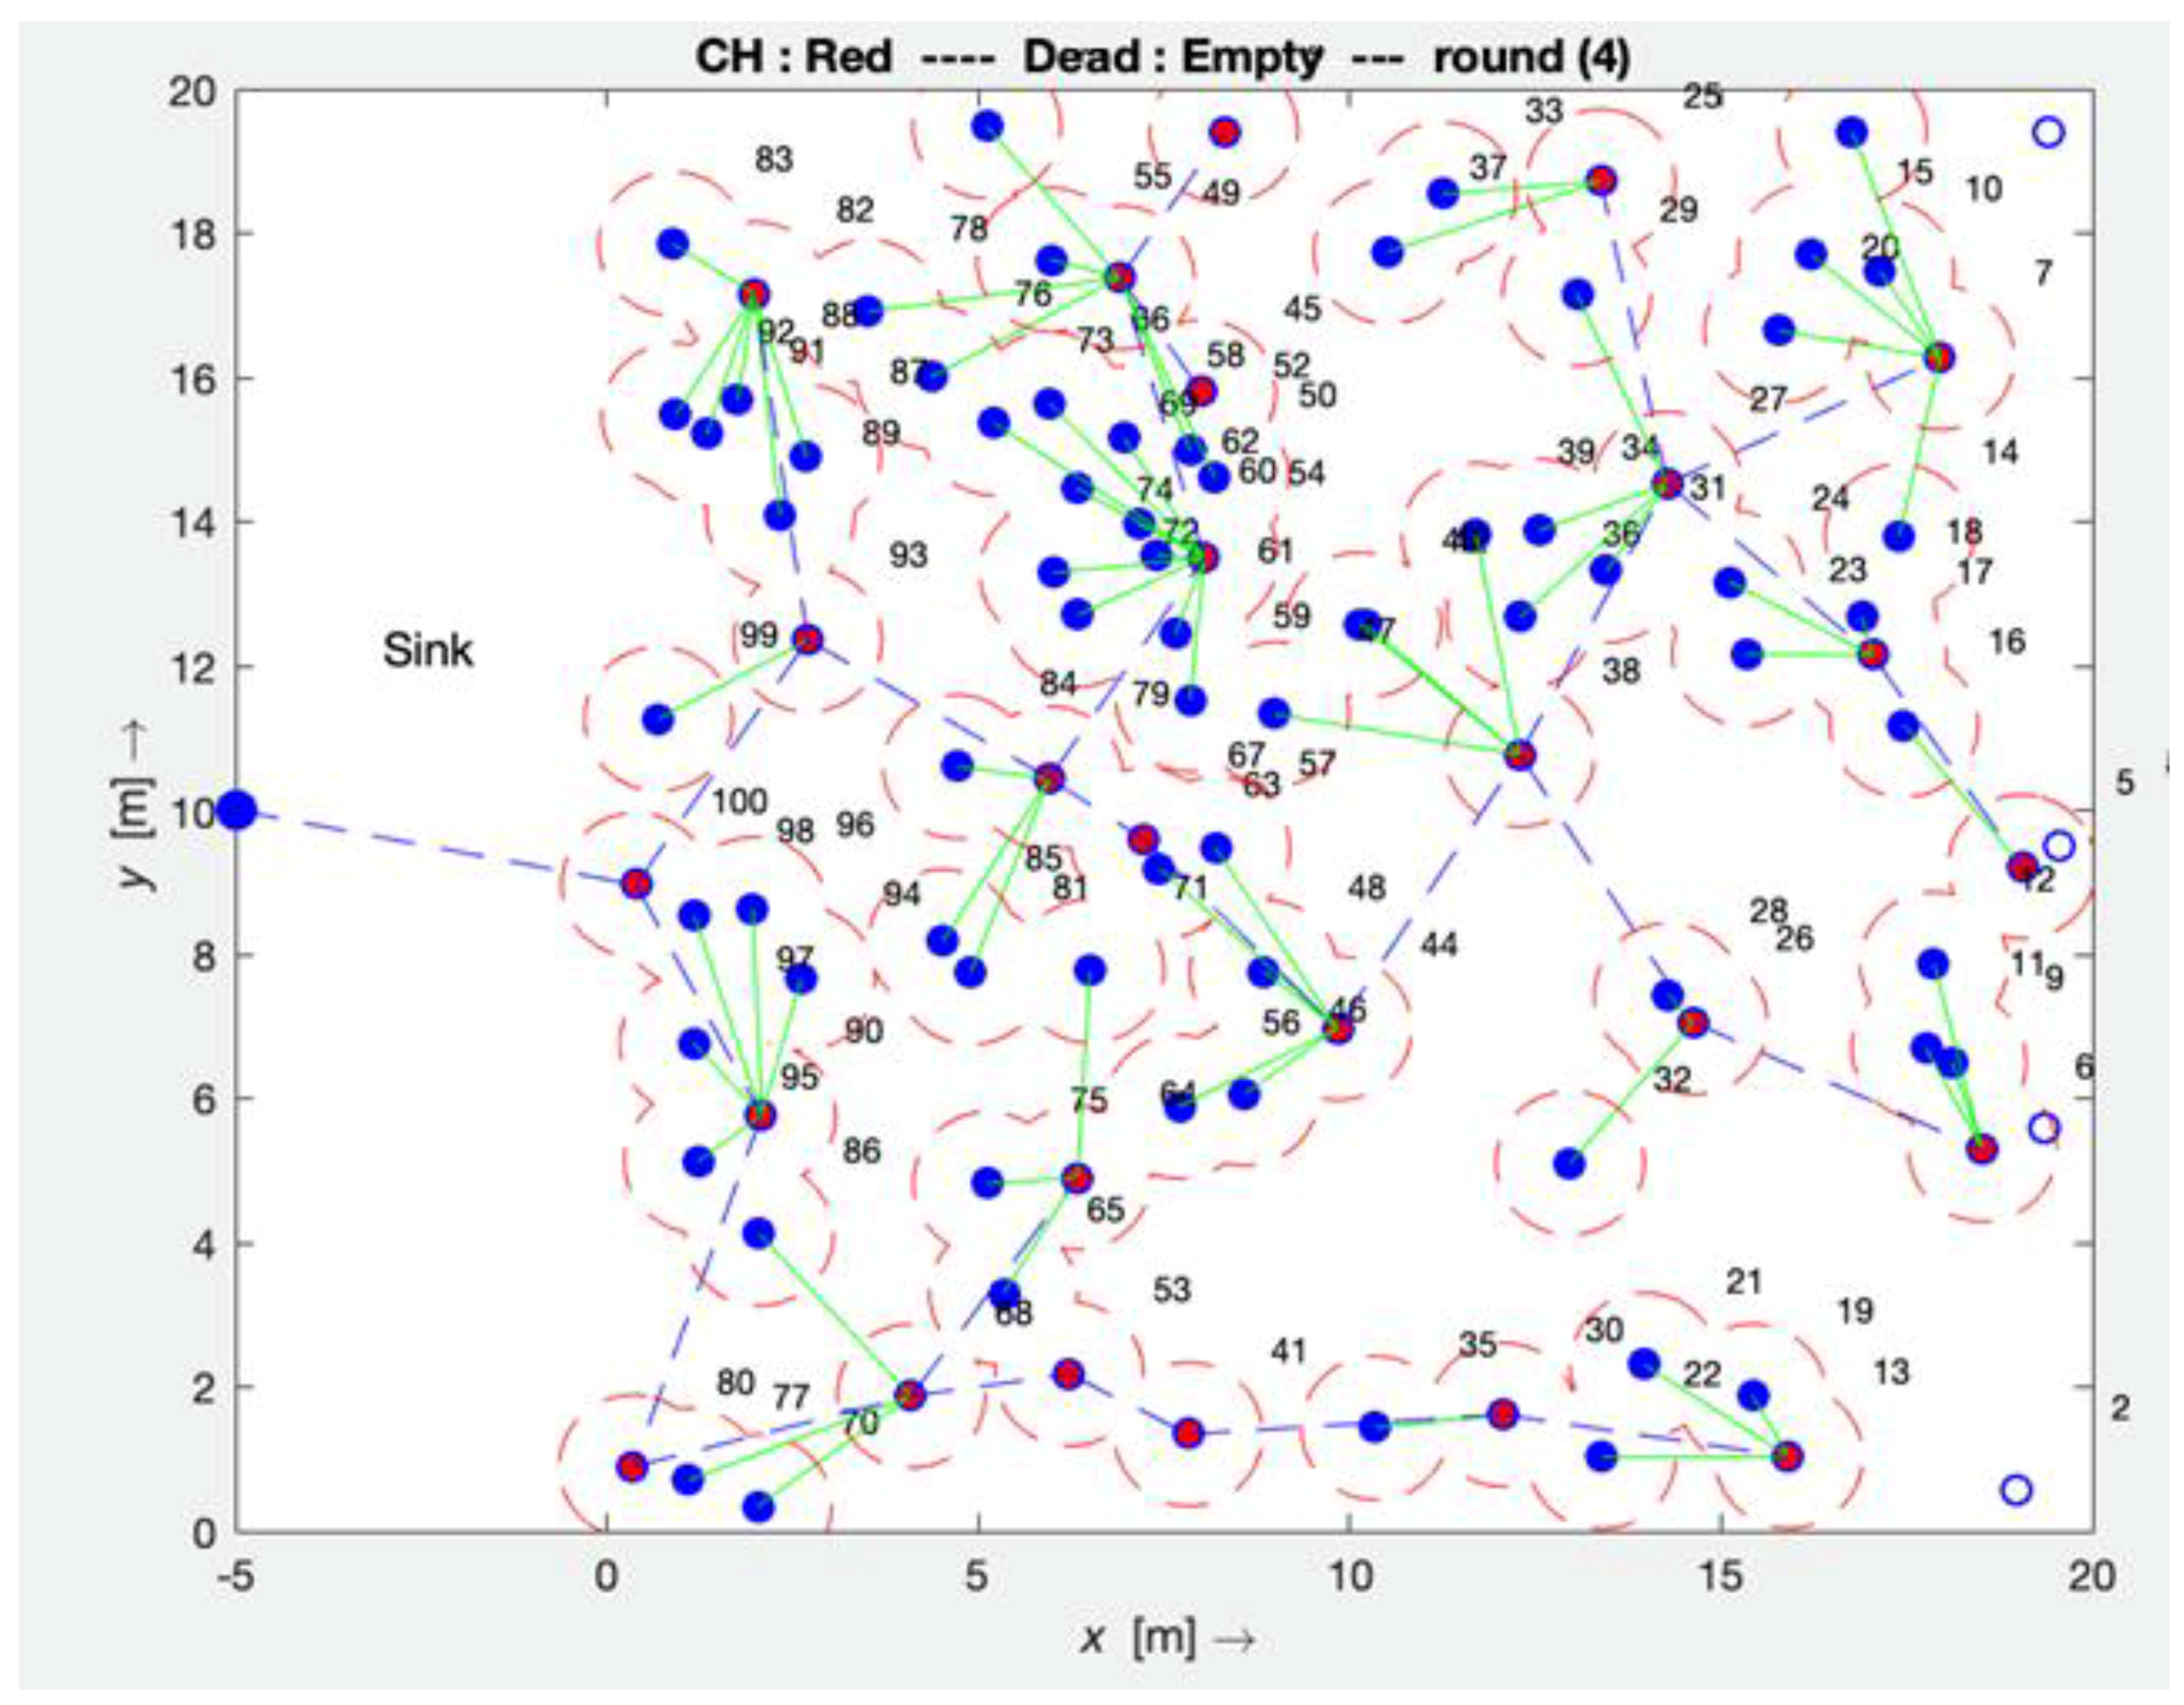
Figure 4 illustrates the simulation step up of the Bird Flocking Node Scheduling algorithm in the WSN. The assumptions and the metrics used to compare the algorithms in this experiment are shown below:
4.2. All Used Energy
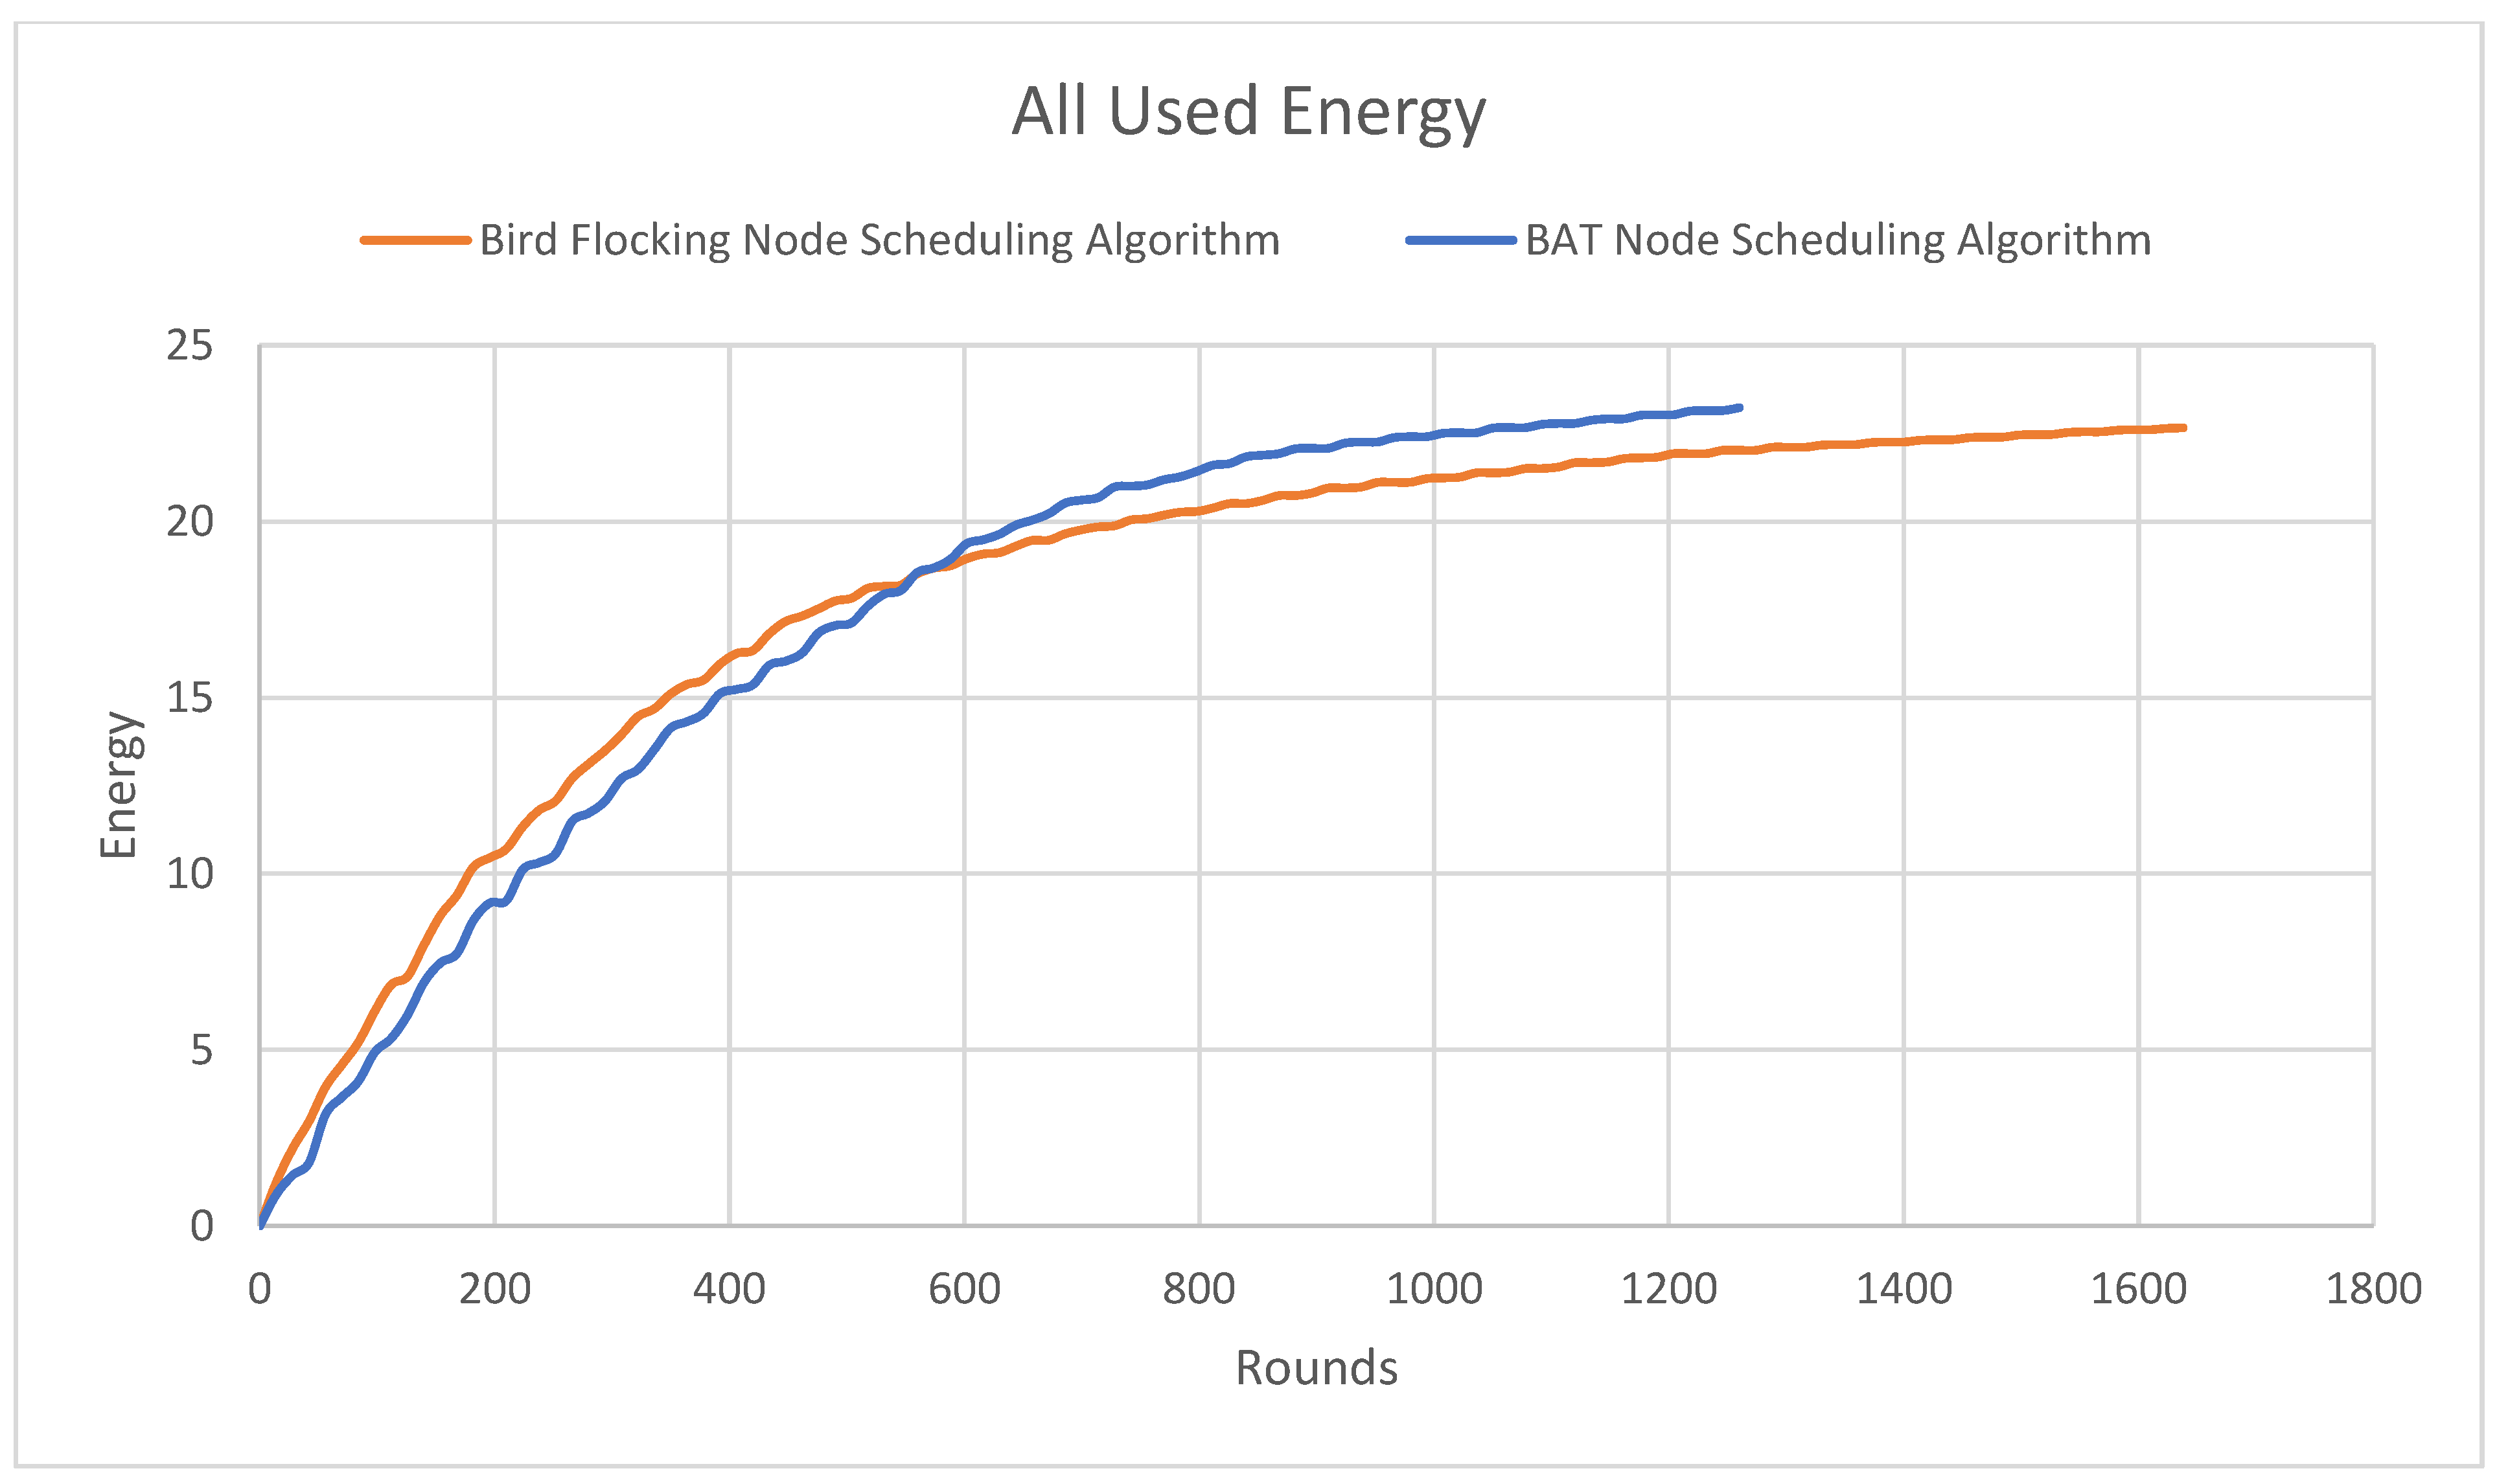
The used energy metric assesses network energy consumption over the simulation rounds.
Figure 5 illustrates this metric, with the
Y-axis representing the energy expended by nodes and the
X-axis indicating the round number. The Bird Flocking Node Scheduling algorithm demonstrated superior energy efficiency compared to the BAT node scheduling algorithm, meeting performance requirements.
The energy consumption trends observed in the Bird Flocking Node Scheduling algorithm demonstrate how Lyapunov analysis contributes to system stability. Specifically, Bird Flocking Node Scheduling reaches 24 joules of energy consumption at the 1650th round, whereas the BAT algorithm consumes the same energy by the 1250th round. This delay in energy depletion in Bird Flocking Node Scheduling reflects a more controlled and stable system behavior, aligning with Lyapunov principles where stability is indicated by a gradual, non-disruptive change in system parameters.
The Lyapunov function, in this context, acts as a stability monitor—ensuring that any increase in energy consumption occurs alongside sustained coverage and connectivity. In Bird Flocking Node Scheduling, the function guides the system toward equilibrium by penalizing instability (e.g., excessive energy usage or connectivity drops) and rewarding system states that preserve balance across energy, coverage, and connectivity.
While both BAT and Bird Flocking Node Scheduling aim to enhance energy efficiency, their strategies diverge: BAT focuses on individual node-level optimization by adjusting transmission power and reducing retransmissions, which may result in uneven energy depletion and potential network fragmentation. In contrast, Bird Flocking Node Scheduling, guided by flocking dynamics and Lyapunov-based control, emphasizes cooperative scheduling, distributed decision-making, and load balancing—ensuring that energy is conserved in a way that supports long-term system-wide stability.
Thus, the Lyapunov function embedded within Bird Flocking Node Scheduling does more than monitor; it shapes node behavior, adjusting sleep/wake schedules and transmission strategies to maintain stable network operation. This stability ensures that even as energy consumption increases over time, the system avoids abrupt failures or degradation in coverage and connectivity. In critical applications like forest fire or skyscraper monitoring, this predictability and resilience are essential, proving the value of Lyapunov-informed scheduling in real-world deployments.
4.3. Lifetime of Sensor Nodes
The lifetime of a sensor node is evaluated by monitoring the number of active nodes across simulation rounds. In this analysis, the
Y-axis represents the count of active nodes, while the
X-axis indicates the simulation rounds. As illustrated in
Figure 6, the Bird Flocking Node Scheduling algorithm demonstrates a significant improvement in energy efficiency and node longevity. Specifically, 16 nodes remain active at the 203rd rounds when using the Bird Flocking Node Scheduling algorithm, whereas with the BAT node scheduling algorithm, only 16 nodes remain at the 117th rounds.
The Lyapunov function ensures stability in the Bird Flocking Node Scheduling algorithm by effectively managing energy consumption, as demonstrated in the sensor node lifetime comparison. From
Figure 6, the Bird Flocking Node Scheduling algorithm (orange line) maintains a higher number of active nodes over a longer period compared to the BAT algorithm (blue line). For instance, at round 50, Bird Flocking Node Scheduling retains approximately 60 active nodes, while BAT has dropped to around 30 nodes, showing a 50% faster depletion rate for BAT. Similarly, at round 100, Bird Flocking Node Scheduling sustains nearly 40 nodes, whereas BAT is already below 20 nodes, further emphasizing that the Bird Flocking Node Scheduling is more efficient. This trend continues, with Bird Flocking Node Scheduling extending network lifetime significantly beyond round 200, whereas BAT approaches near-zero active nodes much earlier. This prolonged operational stability in Bird Flocking Node Scheduling is attributed to the Lyapunov function’s ability to regulate energy consumption, ensuring a gradual, controlled decline in active nodes rather than a sudden drop. By balancing energy consumption and preserving connectivity, the Lyapunov function prevents sudden failures, ensuring a more stable and efficient WSN. In contrast, the BAT algorithm experiences rapid energy depletion and poor coordination, particularly in the final rounds.
4.4. Efficiency
Throughout the network’s lifetime, packets are continuously sent and received, allowing us to compare the throughput of the BAT node scheduling algorithm with the proposed Bird Flocking Node Scheduling algorithm. The correlation observed is that a longer network lifetime results in a greater number of packets sent and received, indicating higher efficiency.
Figure 7 illustrates this efficiency, with the
Y-axis representing the number of packets sent and received and the
X-axis indicating the number of rounds.
Figure 7 illustrates that, in the early stages, between 0 and 1500 rounds, the BAT algorithm initially delivers more packets than Bird Flocking Node Scheduling, suggesting higher short-term efficiency. However, this rapid packet transmission may lead to aggressive energy consumption, potentially causing quicker node depletion. In contrast, beyond 1500 rounds, the Bird Flocking Node Scheduling algorithm begins to outperform the BAT algorithm in terms of packet delivery, surpassing it around the 1600th round. While the BAT algorithm begins to plateau, Bird Flocking Node Scheduling maintains a steady, long-term increase in packet delivery, eventually reaching approximately 2,681,517 packets by the 2898th round. This suggests that Bird Flocking Node Scheduling optimizes energy consumption, keeping nodes active for a longer period and ensuring sustained network operation.
The Lyapunov function plays a key role in regulating energy consumption, preventing nodes from depleting their energy resources too quickly. By enforcing gradual and controlled energy depletion, the Lyapunov function ensures that connectivity and data transmission are sustained over an extended period. Unlike BAT, which suffers from rapid energy consumption and node failure, Bird Flocking Node Scheduling benefits from continuous adaptation and load balancing, ensuring the system remains near equilibrium. This gradual increase in packet delivery aligns with the Lyapunov-based stability control, which helps maintain network performance.
4.5. Connectivity
In this metric, we assess the connectivity of the sensor nodes within the network. As shown in
Figure 8, the
Y-axis represents connectivity performance, measured as a numerical value (e.g., the fraction of nodes connected in the network). The
X-axis represents time, measured in terms of the number of rounds. For this scenario, the network consists of 150 nodes. For example, if the connectivity is 0.98, the total number of connected nodes is calculated as 150 × 0.98 = 149 connected nodes.
As observed in
Figure 8, from the 336th to the 2884th rounds, the Bird Flocking Node Scheduling algorithm maintained a connectivity value of 1, which indicates that the network remained fully active with superior connectivity. The fluctuations in the setup costs were observed for both algorithms, e.g., the BAT algorithm experienced fluctuation between round 28 and 420, and the Bird Flocking Node Scheduling algorithm between round 84 and 500. These fluctuations can be attributed to the initial synchronization, node activation patterns, and energy management strategies. Both algorithms experience these variations as they adjust to optimize energy usage, and connectivity. However, the Lyapunov function helps stabilize these adjustments by enforcing gradual energy depletion, which prevents sudden failures or energy overuse.
The Bird Flocking Node Scheduling algorithm outperforms the BAT algorithm in terms of node connectivity due to its emphasis on adaptability, cooperation, and energy-efficient load balancing. These characteristics ensure that the network remains stable over longer periods, with nodes able to dynamically adjust to changing conditions. In contrast, the BAT algorithm, which focuses more on individual energy optimization, struggles with less effective coordination and poorer connectivity toward the end of the network time. This suggests that the Lyapunov function supports the Bird Flocking Node Scheduling algorithm by promoting cooperative energy management and load balancing, ensuring nodes remain connected and stable for extended periods.
4.6. Coverage
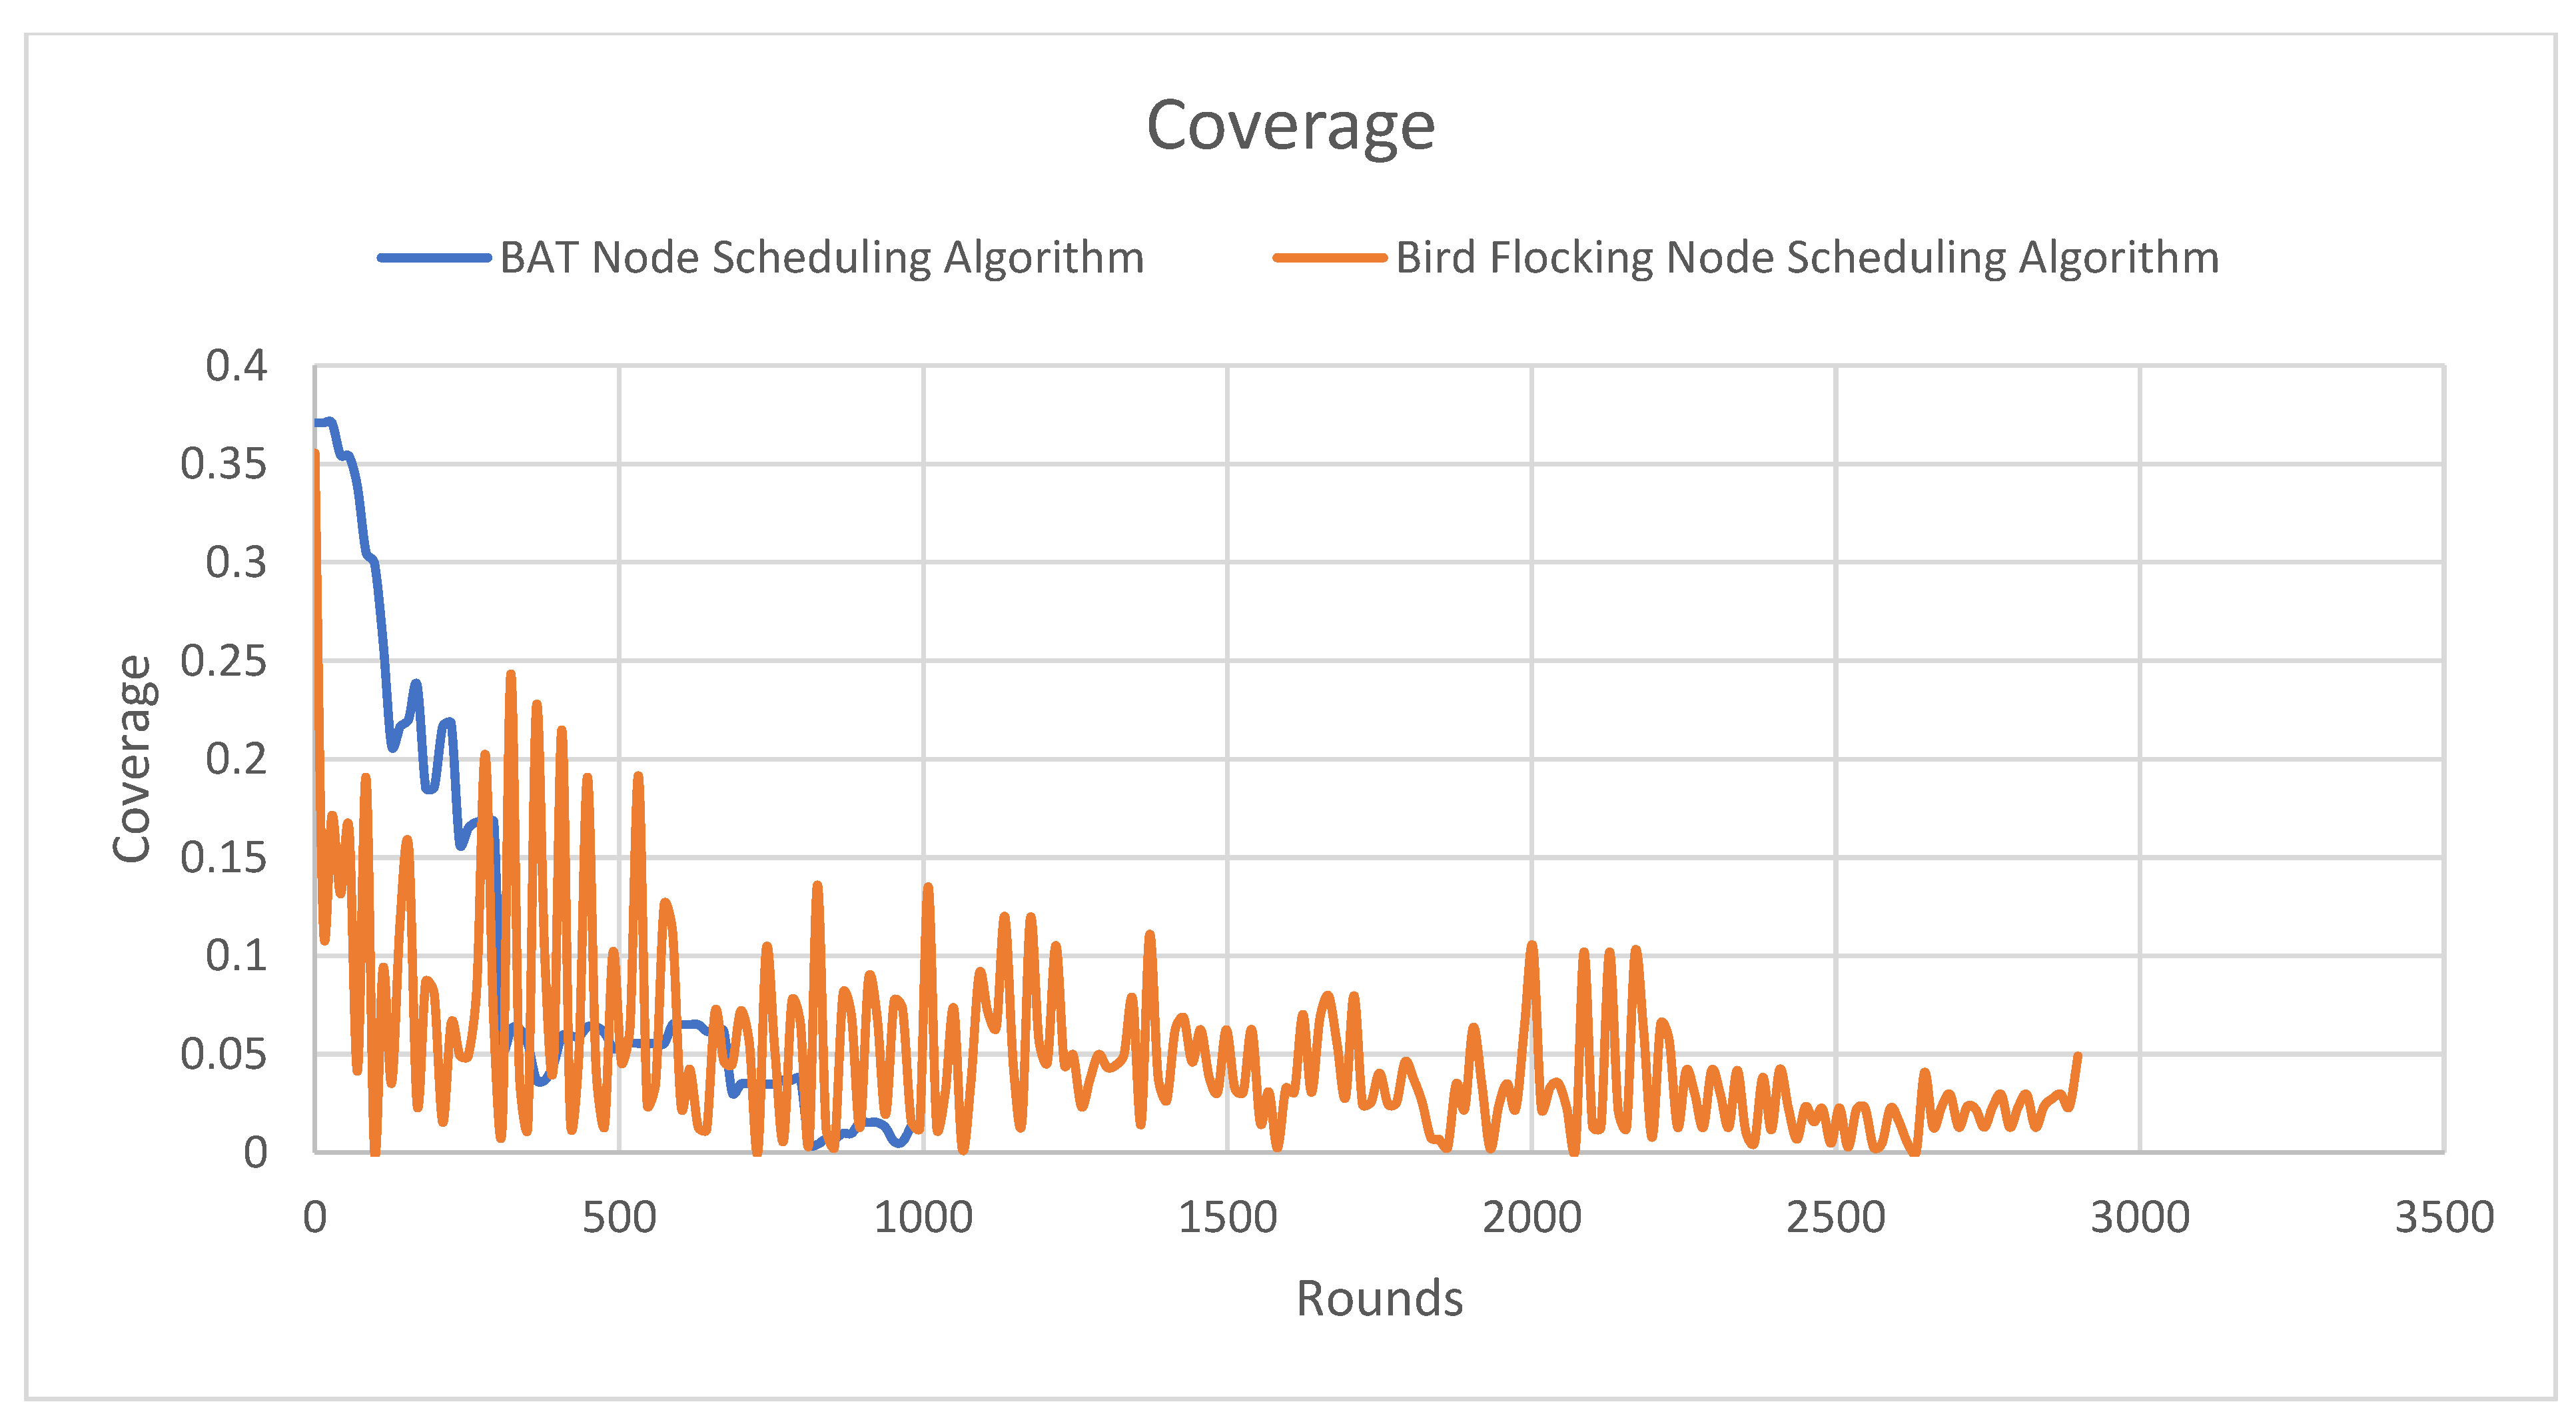
Coverage is a metric that measures the ratio of all node coverage to the area to be monitored. In the Y-axis is the ratio of the coverage to the total area to be monitored, and the X-axis is the number of rounds.
Figure 9 compares the coverage performance of the Bird Flocking Node Scheduling algorithm and the BAT node scheduling algorithm over multiple simulation rounds. Quantitatively, the BAT algorithm begins with a high initial coverage of approximately 0.37 but experiences a steep decline, falling below 0.1 by the 200th round and nearing zero around the 900th round, indicating rapid depletion of sensing capacity. In contrast, the BFNS algorithm starts with a lower but more stable coverage range between 0.10 and 0.15, exhibiting consistent fluctuations due to its adaptive sleep/wake scheduling. Even beyond the 1500th round, Bird Flocking Node Scheduling algorithm maintains intermittent coverage spikes between 0.01 and 0.07, demonstrating sustained sensing capability up to the 3000th round, long after the BAT algorithm fails. This behavior reflects the impact of the Lyapunov function in ensuring stability—by guiding energy-aware scheduling decisions, it prevents abrupt performance collapse and keeps the system operating within bounded, acceptable ranges. The observed oscillations in Bird Flocking Node Scheduling algorithm coverage confirm the system’s ability to adapt under constraints, ensuring prolonged service availability and resilient network behavior.
4.7. Pareto Front Analysis
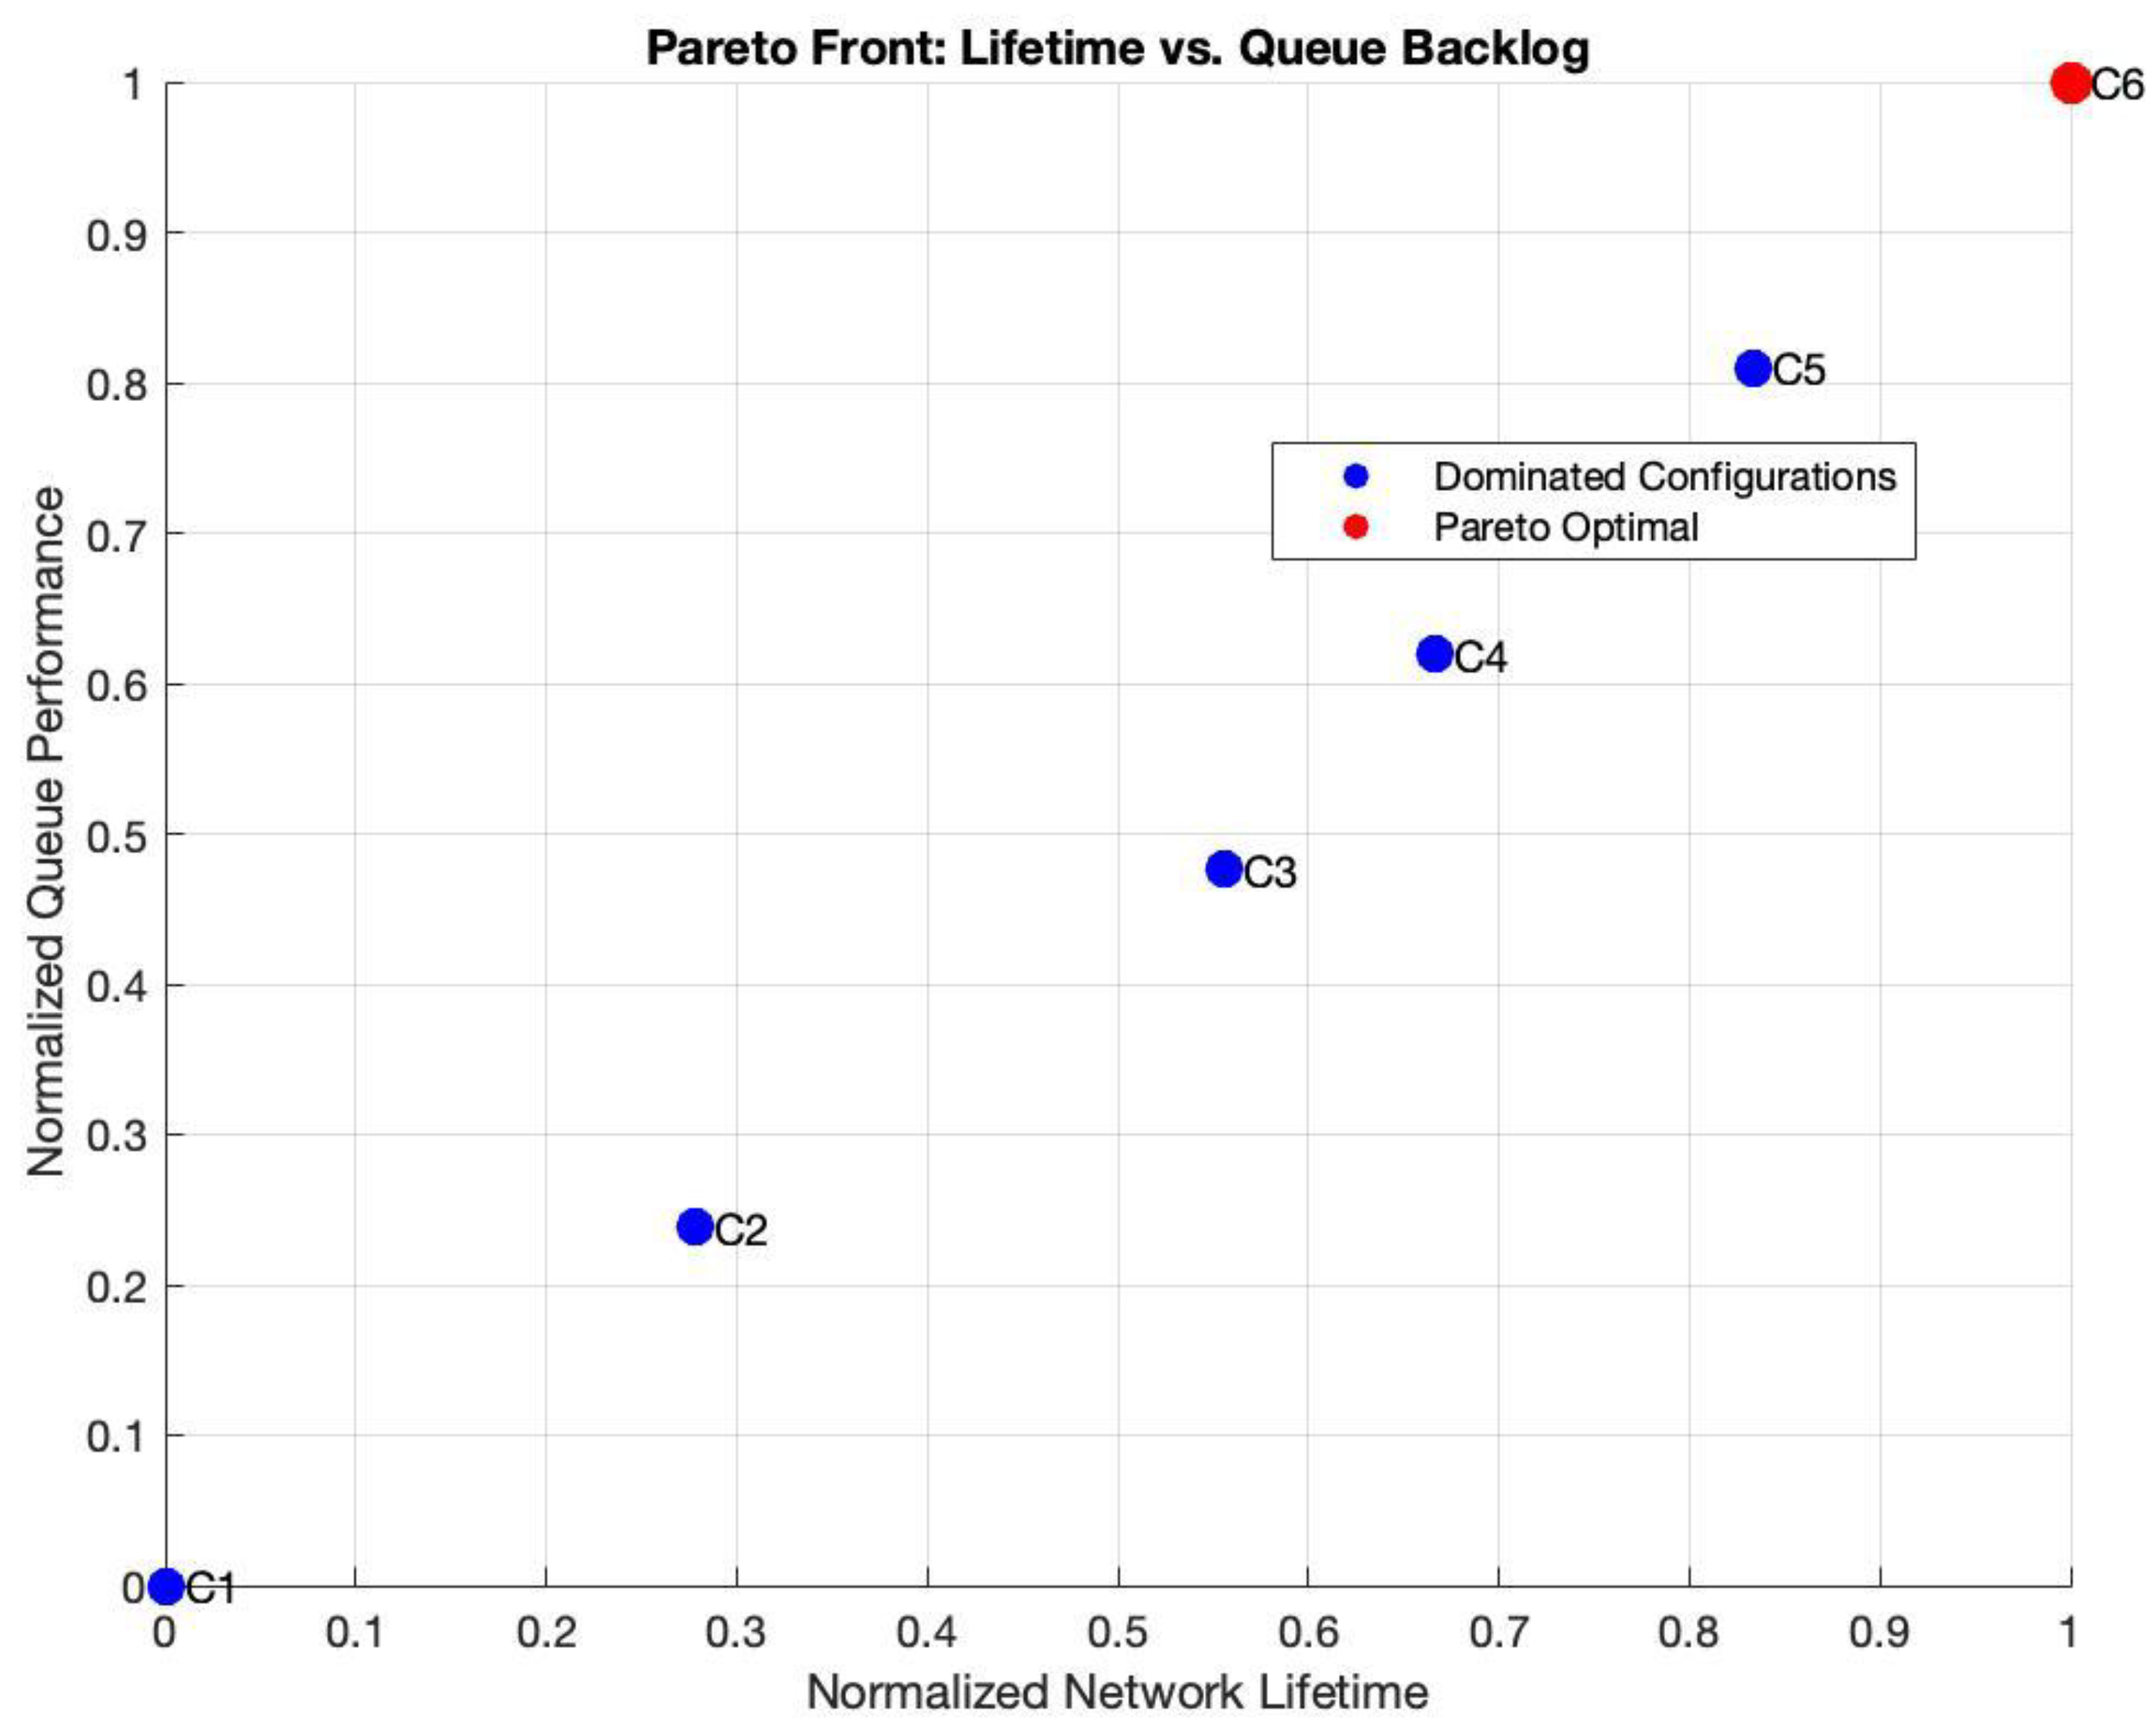
Figure 10 visualizes the trade-offs between two competing objectives: normalized network lifetime (e.g., lifetime, coverage, and connectivity) and normalized queue backlog (e.g., data delay or throughput). The goal here is to visualize how different scheduling strategies affect the performance of the above-mentioned metrics. The six WSN scheduling configurations (C1–C6) are analyzed in
Figure 10 using a Pareto Front approach, highlighting the trade-offs between network lifetime and queue backlog. Higher coverage reduces holes but increases energy drain, while stronger connectivity prevents data loss at the cost of greater energy expenditure from more active nodes. The Pareto optimal solutions demonstrate that improving one metric often degrades another, and configurations minimizing backlog (like C6) typically shorten network lifetime, whereas those maximizing lifetime (like C1) tolerate higher congestion. This analysis enables the selection of the most suitable scheduling strategy based on application priorities, whether emphasizing longer network lifetime, data throughput, full network coverage, or communication reliability, with normalized metrics facilitating direct comparison across all performance dimensions. This has been explained in
Table 3.
4.8. Evaluation of the Stability Analysis
The main goal of this experiment is to show the optimal performance of the Bird Flocking Node Scheduling algorithm by identifying its equilibrium point. This equilibrium represents a stable state where the network maintains both coverage and connectivity, while energy is used at a balanced and controlled rate. In other words, the equilibrium is a state where system metrics such as lifetime, coverage, and connectivity are within an acceptable bound. Reaching this equilibrium state indicates that the Bird Flocking Node Scheduling algorithm can ensure WSN dependability, service availability, reliability, and energy efficiency throughout the network’s lifetime. The stability of the WSN system can be evaluated through the behavior of the Lyapunov function. For instance, a decreasing Lyapunov function over time indicates convergence toward an equilibrium state, reflecting a balanced rate of energy consumption and a maintained coverage and connectivity. Conversely, if coverage and connectivity begin to deteriorate, the Lyapunov function will increase—unless corrective measures are in place. Stability, in this work, ensures that the WSN is dependable without sudden failures, where energy is consumed in a controlled manner. Therefore, the system is considered stable when the Lyapunov function consistently decreases in response to balanced lifetime usage.
It is worth mentioning that while Pareto analysis is valuable for offline planning and benchmarking, Lyapunov optimization remains superior for real-time scheduling due to its computational efficiency and stability guarantees.
5. Conclusions
Bio-inspired computation has advanced the exploration of search spaces, and our main contribution is to investigate whether a Bird Flocking Node Scheduling algorithm offers superior solutions compared to the previously developed BAT Node Scheduling algorithm. The proposed Bird Flocking Node Scheduling algorithm effectively addresses the MOOP in WSNs by balancing coverage, connectivity, and network lifetime. The proposed approach integrates Lyapunov-based scheduling with Pareto optimization to effectively balance multiple conflicting objectives and derive an optimal trade-off solution, thereby enhancing service availability and reliability. MATLAB simulations with demonstrate its superiority over the BAT node scheduling algorithm, achieving notable improvements: an 8% increase in coverage, a 10% boost in connectivity, and an 80% extension in network lifetime. These results highlight the potential of bio-inspired optimization techniques in enhancing WSN dependability, making them more suitable for real-world safety-critical applications such as environmental monitoring, military surveillance, and smart cities. Future work will focus on introducing sensor node mobility to further explore coverage maximization. In addition, our future work will focus on implementing a real-time sleep/awake scheduling mechanism integrated with the Lyapunov stability function to evaluate WSN performance in highly dynamic environments. This can primarily be achieved through the principle of coverage attraction, where nodes dynamically adjust their positions to maximize the monitored area, prioritizing regions with insufficient sensing. Furthermore, we aim to implement the Bird Flocking Node Scheduling testbed to address real-world deployment challenges, including hardware constraints, energy efficiency trade-offs, and scalability issues.
