Article

Energetics of Urban Canopies: A Meteorological Perspective

by
Edson R. Marciotto
1,*,† and
Marcos Vinicius Bueno de Morais
2,†
1
Department of Physics, Federal University of Santa Catarina, Florianópolis 88040-900, Brazil
2
Departamento de Obras Civiles, Facultad de Ciencias de la Ingeniería, Universidad Católica del Maule, Talca 3480112, Chile
*
Author to whom correspondence should be addressed.
These authors contributed equally to this work.
J 2021, 4(4), 645-663; https://doi.org/10.3390/j4040047
Submission received: 21 September 2021 / Revised: 13 October 2021 / Accepted: 15 October 2021 / Published: 25 October 2021
(This article belongs to the Special Issue Sustainable and Resource – Efficient Homes and Communities)

Abstract

:
The urban climatology consists not only of the urban canopy temperature but also of wind regime and boundary layer evolution among other secondary variables. The energetic input and response of urbanized areas is rather different to rural or forest areas. In this paper, we outline the physical characteristics of the urban canopy that make its energy balance depart from that of vegetated areas and change local climatology. Among the several canopy characteristics, we focus on the aspect ratio h / d and its effects. The literature and methods of retrieving meteorological quantities in urban areas are reviewed and a number of physical analyzes from conceptual or numerical models are presented. In particular, the existence of a maximum value for the urban heat island intensity is discussed comprehensively. Changes in the local flow and boundary layer evolution due to urbanization are also discussed. The presence of vegetation and water bodies in urban areas are reviewed. The main conclusions are as follows: for increasing h / d , the urban heat island intensity is likely to attain a peak around h / d 4 and decrease for h / d > 4 ; the temperature at the pedestrian level follows similar behavior; the urban boundary layer grows slowly, which in combination with low wind, can worsen pollution dispersion.

1. Introduction

Oke [1] describes the development of scientific inquiry into natural phenomena, in particular the urban meteorology, in four stages: (i) recognition and description of the phenomenon, (ii) linkage of the feature to other factors, (iii) study of processes causing the phenomenon, and (iv) construction of process–response models to predict the behavior of the phenomenon.
Much has been done about stages (i) and (ii) in past decades. Nowadays, a considerable amount of information has been gained on the urban climatology by scientific community over the last 10–20 years. We are in a privileged moment in which many good urban meteorological databases have become available from field experiments, such as BUBBLE (in Basel, Switzerland [2]), DAPPLE (in London, England [3]), ESCOMPTE (in Marseille, France [4]), JU2003 (in Oklahoma City, USA [5], Goteburg (in Goteburg, Sweden [6]), Kugahara Project (in Tokyo, Japan [7]), MILAGRO (in Mexico City, Mexico [8]), and MID05/MSG05 (in New York, USA [9]); or from scaled experiments, such as OASUS [10], COSMO [11], and MUST [12]. In addition, several wind tunnel experiments have been run for the study of urban dispersion [2,13,14,15]. Along with the growth of available data, many urban models, especially those aiming to simulate energy/momentum/mass balance, are from that period. These databases have made possible the approach of stages (iii) and (iv).
In the following sections, we review how key features of urban canopies distinguishes them from rural or forest areas and how they impact the local climate. Such features are
All of these factors can impact the energetics of an urban area. Thus, understanding their mechanisms of action can aid city planners to design more sustainable and enjoyable cities. At this point, it is important to note that the city energetic does not just involve energy consumption, but is also related to human comfort and health. The so-called urban heat island effect directly affects the thermal comfort, whereas changes in the urban–rural or urban–suburban differential heating may cause an increasing of pollution and even changing the rain regime over large urban areas.

2. Methods of Studying the Meteorology in Urban Areas

The methods of assessing the several (micro)meteorological quantities over an urban area do not differ much from those used in the study of boundary layer over rural or forest areas. One significant difference is that urban sites are usually more heterogeneous than rural areas. This is an issue to be accounted for when designing field experiments. These methods can be summarized as: field experiments, numerical modeling, laboratory experiments and remote sensing.
The state of the art is the synergetic use of two or more techniques to approach a problem. Ground-based observation based on automatic weather station provides local measurements that can be complemented by wind tunnel simulations (surface wind), remote sensing of the air (wind vertical profile). Each technique has its own range of applicability, shortcomings and cost. The choice of a given method should be first related to the problem to be investigated, although the available funds and facilities be often a limiting factor. In the following subsections, each method is discussed.

2.1. Field Experiments

In the first decade of this century, a number of large field experiments were designed and conducted with the aims of collecting and analyzing (micro)meteorological data, mostly for assessing the surface energy fluxes and the flow around buildings for dispersion studies [2,3,5,16].
To stay in one field experiment, for instance, we can mention the Join Urban 2003. The campaign deployed state-of-the-art meteorological and tracer instruments, including lidars, sodars, radars, sonic anemometers, airplane-based meteorological sensors, fast-response tracer analyzers, and helicopter-based remote tracer detectors. Typical surface meteorological variables were measured continuously at nearly 100 locations in and around Oklahoma downtown. Ten intensive 8-hour observation periods were completed from which meteorological, turbulence and tracer measurements were obtained. The amount of instruments deployed and data collected are huge. Despite the main concern of these campaigns be the contaminant dispersion, the surface flux data thus obtained are useful for purposes other than dispersion; for example, a number of NWP models uses surface flux data as lower boundary condition.
For the study of energetics, eddy–covariance systems capable of collecting wind, temperature, and specific humidity at a high sample rate (10–20 Hz) are usually deployed. By applying the eddy–covariance method [17,18], the sensible and latent heat fluxes are obtained. Low-frequency data are also collect for supporting analysis. An important regard when collecting (micro)meteorological data inside the urban canopy is the heterogeneity, which is unavoidable in most real cases. Because of this issue, the World Meteorological Organization (WMO) published a guide addressing siting and exposition of instruments inside urban canopies to obtain representative meteorological observations [19].
Field experiments may also be conducted in scaled models. A scaled model by Pearlmutter et al. [20] employed an urban canyon made of concrete to physically simulate the surface energy budget. It distinguishes between others once the urban energetics problem is focused at the pedestrian level. Such a conception is useful inasmuch as it provides insights into the formulation of the urban energetics problem from a viewpoint of practical measurements. In the same fashion, [7] determined the components of the surface energy balance for an array of cubic blocks. They compare the net radiation R n , the sensible heat flux H, and the conductive heat flux into the blocks G with the correspondent model outputs: the so-called simple urban energy balance model for mesoscale simulations (SUMM). The agreement is good, with major differences of about 40–50 W/m2 during the morning for H and G.

2.2. Numeric Modeling

The urban canopy differs from the rural in several aspects: in the dynamic response to the airflow, due to rigid obstacles, in the response to radiative forcing, related to the geometry of the canopy and the constitutive materials, in the energy balance, which depends on the permeability of the soil, thermal capacity and diffusivity of materials and water availability. A faithful representation of the urban surface is very difficult to obtain because it requires complex models and demands a large amount of empirical data, which in general are difficult to collect. For this reason, simpler models have been widely explored due to the few parameters needed to use them.
In general, urban canopy models (UCMs) have been very useful when used in conjunction with a mesoscale model, which traditionally used to be coupled with some scheme of soil–vegetation–atmosphere interaction. That happened with WRF [21] and TVM [22], for example. Before these urban parameterizations being developed, the urban landscape used to be simulated my means of an to “adaptation” of the vegetation. However, this procedure has limitations and does not reproduce the observations as well as when the proper urban canopy model is used.
One of the main difficulties in UCMs is to establish the aerodynamic parameters of the surface. A set of 12 types of urban land use was proposed based on a broad observational study of the wind profile in different urban areas [23]. Their data show that the ratio between the roughness length and the average height of the buildings, ( z 0 / h ), ranges from 0.06 to 0.20. For the ratio between zero plane displacement and average height, ( d 0 / h ), the values are between 0.35 and 0.85. Other relationships have also been proposed based on the use the frontal roughness density ( λ f ) [24].

2.3. Lab Experiments

Another way to study the urban boundary layer is through laboratory experiments. The great advantage of this methodology is the control of the experiment conditions. The most widespread technique is the deployment of a wind tunnel to simulate the wind. The use of scale models make possible the prediction of the flow patterns in canopy level and also around the building, depending on the physical model resolution and measurement devices available. Historically, the main interest in Meteorology has been in establishing characteristic flow scales as a function of surface roughness [25,26,27]. An overview of the methodology is summarized in [14] and technical details related to wind tunnel design can be found in [28,29,30]. Pollutant dispersion studies for a thermally stratified flow can also be carried out [15]. Statically unstable flows are simulated by heating a plate on the floor. Statically stable flows can simulated by cooling the floor or fixing the physical model on the wind tunnel ceiling and heating it up. The upward buoyant force performs in this case a similar role as in statically stable flows.
The wind can also be simulated in a water channel [31]. The advantage of the water tank is that the flow visualization is easier, and the Reynolds similarity criterion is more easily reached because the kinematic viscosity of water is about 10 times lower than that of air. For example, if the scale between the prototype and the model is 1:100, the Reynolds criterion states that the velocity in the model should be U M = 100 × ν M ν P U P . In fact, to simulate a flow of 1 m/s in the prototype (atmosphere), the velocity in the model must be 100 m/s if it is immersed in air and 10 m/s if it is immersed in water.
To compensate for the fact that the atmospheric boundary layer is rarely neutral, wind tunnel experiments with thermal stratification have been conducted. Uehara et al. [32] conducted wind tunnel experiments to study the effect of static stability in flows over urban canyons. They use the bulk Richardson number as parameter, ranging from an unstable condition, R i b = 0.21 , to a stable condition R i b = 0.79 . They conclude that cavity eddies are weakened under stable stratification. Pollutant dispersion studies for a thermally stratified flow have also beencarried out [15]. The measurement of thermally unstable flow in wind tunnel is discussed in [33]. More recently, there has been great interest in the effect of buoyancy over the urban canyon flow from a wind tunnel research perspective [34,35,36]. A comprehensive review of isothermal (neutral) non-isothermal (thermally stratified) flow simulation over urban canyon models can be found in Zhao et al. [35].
More recently, the concern about non-uniform aspect ratios has been addressed by Park et al. [37] and Zhao et al. [36], who carried out laboratory and numerical experiments. These studies deployed obstacles representing buildings with different heights along them stream wise. Park et al. [37]’s simulations consider a flow with no thermal stratification, different aspect ratios, and different building-height ratios, the ratio between upwind and downwind building height, H up / H down (called steepness ratio by Zhao et al. [36]). Changes in the circulation pattern and vorticity were observed. In particular, an intensification of momentum transfer was observed for the higher a value of H up / H down . A more effective momentum transfer is likely to be accompanied by greater thermal energy removal from inside the canyon to the external flow. Although Park et al. [37] do not approach heat transfer, it seems at a first glance that the heterogeneity might favor the cooling process in urban areas. On the other hand, the effect of buoyancy over the re-circulation patterns is apparent from wind tunnel simulation with thermal stratification. A broader simulation with more obstacles should be necessary to better understand the influence of a non-uniform canopy over the heat fluxes.

2.4. Remote Sensing

Remote sensing of the atmosphere can be passive or active. Remote sensing methods have several advantages over in situ measurements. One of them is its ability to obtain volume averages, which is more representative than point values. Another advantage is the non-interference with the flow properties and therefore with the measured quantity. An overview of the passive remote sensing technique applied to urban areas is found in [38]. Active remote sensing techniques are sodar, radar and lidar.
Among such remote sensing techniques, the light detection and ranging seems to be very useful in the research of several characteristics of the atmospheric boundary layer. For instance, lidar measurements can be used to estimate the entrainment rate into the urban boundary layer [39]. Since the boundary layer height under some conditions is driven by the surface sensible heat flux (see Section 4.2), it can be used the solve the inverse problem of obtaining the sensible heat flux from lidar observation of the boundary layer time-evolution [40,41]. An advantage of this method is that the surface heat fluxes obtained in this way accounts for a larger area than the covariance method, which uses fast response sensors measuring `local’ fluxes. In short, the lidar method is less impacted by the surface heterogeneity. At some a particular height called blending height [42], the sensible heat flux is increasingly horizontally averaged, inasmuch as its effects is determined at greater heights, which makes this method more suitable for inputting H in mesoscale model.

3. The Urban Heat Island

A very important concept for the research of building energetics is the urban heat island (UHI) intensity. The most used definition is the maximum temperature difference between the an urban and a neighbor rural area. In many observations in the northern hemisphere, this maximum occurs in late evening or early dawn.
The UHI has been reported for a long time [43]. The key idea for its understanding is the change in the land use. The urbanization of an area gives rise to a series of modifications in the surface, namely:
  • In land cover materials—by changing the natural land cover (e.g., grass or bare ground) and the thermal and radiometric properties of the surface surfer modifications. The thermal properties of typical natural and construction materials can be found in the literature, such as [44]. The high thermal conductivity of these materials causes urban areas to have temperature variations more quickly than rural areas, while the high thermal capacity provides large energy storage in the urban canopy. The albedo also changes.
  • By creating impervious spots—most civil construction materials make the ground surface impervious. This absolutely changes the surface hydraulic regime: rain water cannot percolate into the soil and runs off to other areas. Moreover, the soil moisture evaporation is halted. Since the water vapor heat capacity is high (2.5 MJ/kg), a substantial change in the surface energy partition between sensible and latent heat fluxes takes place, promoting a rise in the surface temperature during the daytime.
  • By reducing vegetation cover—surface vegetation transpiration promotes the fall in ground surface temperature. The grass texture, for example, can also intercept a greater portion of incoming solar radiation which reduces the surface heating.
  • by producing anthropogenic heat—human activity is marked by the energy consumption which eventually turns into useless heat that makes urban temperatures higher than rural temperatures.
  • Changing the landscape geometry—the geometry of urban landscape is absolutely connected to how the energy coming in and goes out the urban canopy. These geometric features have mainly been parameterized by the aspect ratio, which we will discuss in detail in the next section.
In this paper, we will focus mainly the aspect geometric. In a traditional view, the urban heat island (UHI) intensity is supposed to be enhanced as the aspect ratio increases. Classical studies have concentrated their efforts for relatively low aspect ratios up to 3.5 and suggested that the UHI could be enhanced more, inasmuch as buildings could become increasingly tall. This has been shown for various aspect ratios obtained from a number of cities in North America, Europe, and Australia [44]. Such a relationship was summed up by the empirical formula
Δ T u r ( max ) = 7.54 + 3.97 ln ( h / d ) .
Although the logarithmic behavior does impose a slow growing for high aspect ratios, this empirical formula implies a continuously non-asymptotic enhancement of the UHI as the aspect ratio increases. These expectations seems to discredited currently. It has been argued with base on physical processes that the UHI intensity cannot increase indefinitely with the aspect ratio [45,46,47]. Such results show that h / d 4 may represent a maximum value for the UHI intensity. Regardless, while the study in [45,46,47] does not compare directly urban and rural areas, it does capture a maximum nocturnal temperature for h / d 4 . It is also suggested that the UHI intensity for h / d > 4 decreases at a rate as fast as it increases for h / d < 4 . Hence, not even asymptotic behavior should be expected for higher aspect ratios. Many other studies, from observations or modeling, agree with the premise that UHI intensity starts to reduce from a given aspect ratio [48,49,50,51,52].
The UHI is a local effect that can interact with heat waves of meso or synoptic scale. The question of how UHI interacts to mesoescale heat waves and how to mitigate this has been tackled recently by Kong et al. [53]; while a coupling of UHI and heat waves is not clear yet in the sense that the combined effect of them can be greater than the separate effects, there are indeed investigations that show the all three possibilities: heat waves can enhance or reduce UHI, or still be unchanged to UHI. For example, during a heat wave episode, people are likely to use more air conditioner, and refrigeration systems in general have to consume more power to keep their inner temperature. An explanation for the reduction in UHI during mesoscale heat wave can be attributed to a depletion of latent heat fluxes over rural areas with a subsequent temperature rise. Since the latent heat flux plays a minor role in urban areas the UHI would be reduced. Note, however, that indexes of human comfort will continue to get worse. Further discussion on the interaction between UHI and mesoscale heat waves can be found in Kong et al. [53].

4. Aspect Ratio

Among many urban features that impacts the energetic of the urban landscape, the aspect ratio is one of the most important. Historically, much of the urban climate research has been based on aspect ratio studies or equivalently on the sky view factor. Before discussing the aspect ratio influence in urban areas, we will introduce some concepts.
Firstly, the aspect ratio is defined as the ratio of height of a building to the street plus sidewalks width, that is, the distance d between buildings. This distance can also be referred to as the street width, and street here may signify any ground spot at surface level, such as a park garage. In this sense, street really means ground. For a symmetric urban canyon, this is simply h / d . For more complicate geometries, this simple concept is somewhat difficult to apply. Nevertheless, there is an equivalence between the aspect ratio and a more robust parameter: the sky view factor (SVF). Based on SVFs, the amount of radiant energy impinging a surface (roof, wall or street/ground) can be calculated or measured for any geometry [47,54,55,56,57].
The formulas presented by these authors are not identical and may account for different working hypotheses. Hence, careful attention needs to be paid to choosing the most appropriate among the available formulas. For instance, street and wall sky-view factors provided by [47] are implicitly assumed to be taken at a unique point, namely, the midway of the street for the street SVF and the bottom of the wall for the wall SVF. The SFVs calculated in this fashion is suitable for comparing with observed SVFs obtained from grand ocular lenses at a single point. To summarize qualitatively, a large aspect ratio implies small SVF, and vice versa. We will rather refer to the aspect ratio because it is more intuitive.

4.1. Influence on Energetics

The thermal influence of aspect ratio on the urban energetics can be tracked down by its effect on the temperature of streets and walls. For a typical urban area, the contributions of the aspect ratio to the increase in these temperatures are as follows:
  • Trapping of longwave radiation (+)—the loss of radiant energy in an urban canopy occurs only after the light beam find the open skies. An infrared beam emitted from a surface, such as a street or wall, suffers multiple reflections before eventually leaving the canopy. Since each reflection is not perfectly elastic, a fraction of energy of the beam is left behind and absorbed by the street surface or wall. The higher the aspect ratio, the more reflection and energy are absorbed by the canopy. This process happens throughout the day, but is more relevant at night.
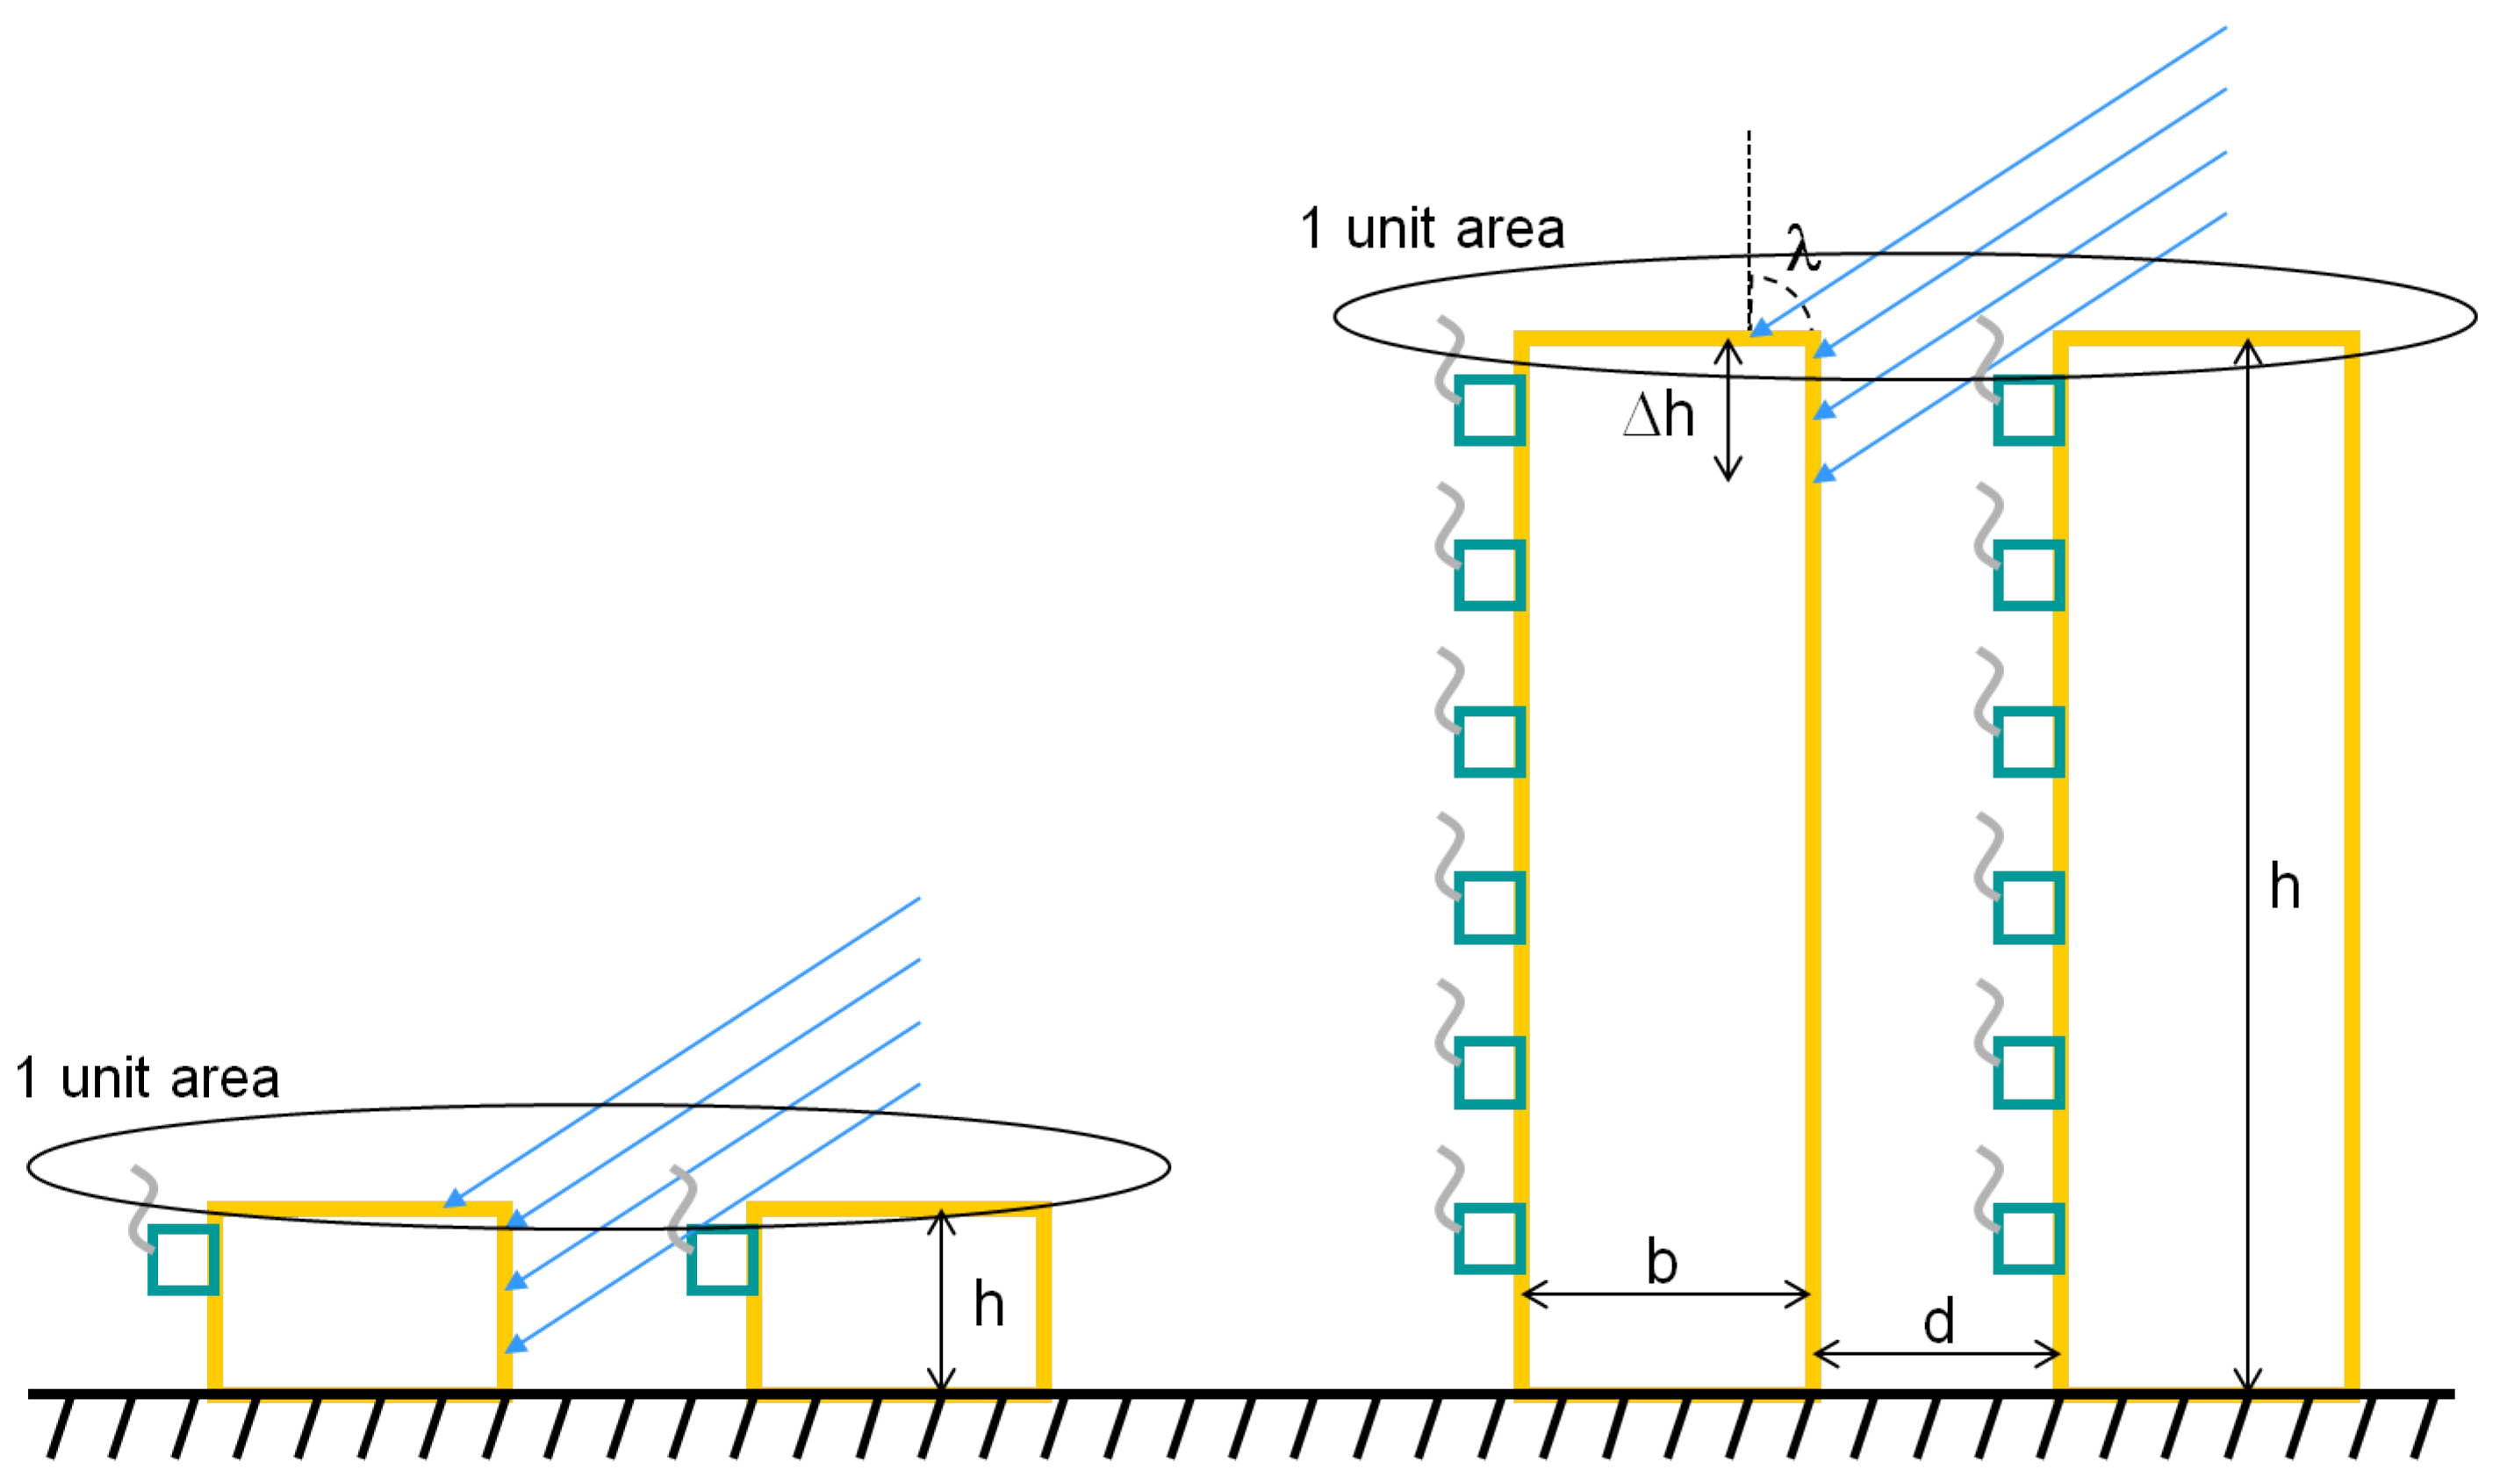
  • Production of anthropogenic heat (+)—this is an indirect consequence of the aspect ratio. In this case, it is more intuitive to think of this in terms of a constant distance among buildings and a varying height (Figure 1). The volume of human activity is clearly proportional to the number of floors in building. As the figure suggests, in a multiple-floor building, the number of air conditioners, boilers, ovens, appliances, light bulbs, etc., is multiplied by the number of floors. The use of central system does not affect at all the reasoning, since the system capacity is likely to be equivalent, with only some energy savings perhaps. Moreover, in regions with more high-rise buildings, such as downtown, the traffic is much heavier. That means that there is more fuel burning per square area.
  • Shading area (−)—in the opposite direction of the longwave trapping, in urban areas with high aspect ratios, there are larger portions of canopy under shade. These portions can be horizontal (streets, sidewalks, etc.) or vertical (walls). Regardless of the orientation, they are closer to the ground surface or the pedestrian level. Often there are areas that never receive direct solar radiation. In such cases, the surfaces heat up at the cost of diffuse solar radiation. As a consequence, the temperatures in these places are much lower.
  • Canopy mass (−)—the two main temperatures forcesover building walls and its interior are the direct solar radiation and the synoptic conditions. Both contribute to an increase in conductive fluxes into the buildings walls, roofs and the interior. A variation in any of these conditions is increasingly damped down and delayed inasmuch as the canopy’s effective heat capacity is larger. Regardless of the construction materials employed, the canopy mass is a measure of its effective heat capacity. A high-rise building can be subjected to the same synoptic forces as low-rise buildings, but the direct solar radiation must be partitioned with a larger mass in the first case. The radiation reaches the urban canopy only in certain portions and heats the air and solid portions locally; this energy is diffused to all canopies.
  • Wind speed inside the urban canopy (+)—this is an indirect effect. Wind speed in urban areas is influenced by urban obstacles and their orientation. This means that the temperature advection is reduced when aspect ratios are higher. Furthermore, the turbulence produced by the wind shear also reduces, making the vertical sensible heat fluxes less. This is a dynamical effect of the aspect ratio on urban energetics. It is worthwhile to mention that the overwhelming majority of urban paramerizations uses bulk formulas such as H = ρ c p C H U ( T T 0 ) easily found in textbooks (e.g., [58]) to compute the sensible heat flux of the urban canopy and, therefore, its cooling rate. It is clear from that that the urban canopy in numeric models is rather sensitive to the wind speed, and consequently to the aspect ratio.
A physically based estimate shows this more quantitatively: consider the urban canyon composed of street, walls and roof as in Figure 1. If λ is the solar zenith angle and S 0 is the direct solar radiation, then the power and per unit length of the canyon that reaches the wall and the roof is, respectively,
E w = Δ h ( 1 α w ) S 0 sin λ ,
E r = b ( 1 α r ) S 0 cos λ .
where Δ h is the wall fraction that receives the direct solar radiation and α is the wall or roof albedo. The total power per unit of length is E w + E r . On the other hand, the building temperature variation due to the radiactive forcing is
T t 1 ρ c radiactive flux × area volume ,
where ρ c is the effective volumetric heat capacity of the building. Taking Equation (2) into Equation (3) yields
T t S 0 b d ρ c Δ h ( 1 α w ) S 0 sin λ + b ( 1 α r ) S 0 cos λ h / d ,
from which we conclude that
T t 1 h / d .
Hence, a decrease in the heating rate during daylight time for higher aspect ratios is indeed expected based on physical considerations. As a consequence, the air temperature has similar behavior. From an observational point of view, a region with higher temperature is found exposed to sun light and one with a lower temperature, under shade. Figure 1 shows schematically these effects.
These effects of shading and trapping are clearly shown from numerical simulations [45,46,47]. In Figure 2, it is shown how the diurnal cycle of the air temperature responds to variation of the aspect ratio. The reason why air temperature reduces as a function of h / d is clear now. A higher aspect ratio canopy takes longer to heat, which leads to a lower “initial” temperature from which it occurs the loss of energy at night. Indeed, an urban surface with high-rise buildings will have a lower average temperature. This result is consistent with Equation (5). Between midnight and sunrise, we see that the cooling rate also decreases with h / d , probably as a consequence of the radiation trapping long wave. In the case of an urban area with a low aspect ratio, such as 0.1 or 0.2, it can be seen that the cooling rate is significantly higher (lines black and red).
That relationship between aspect ratio and urban canopy temperature might seem to be contrary to what has been evaluated in the literature. However, the above estimate not only is physically consistent but also encounters support in the observations [20,48]. Tso et al. [48] studied the effect due to the amount of built mass, which is expressed by G = m c c c Δ T / Δ t , where m c is built-up mass per unit area and c c is the specific heat of the concrete. What they found was a clear dependence on air temperature as a function of the built-up mass. The maximum air temperature in the day cycle decreases from about 3 °C and the minimum grows from about 2 °C when the m c varies from 350 to 1750 kg/m2. This is equivalent to varying h / d by a factor of approximately 5. Temperature variation predicted in the model by of these authors is linear within the range of simulated built-up mass. The reduction in temperature is not as large as in [47], probably because in the model of [48], no shading is included. Moreover, in the scaled-down experiment using a set of canyons made of concrete, more compact canyon arrangements in hot and dry climate regions showed a tendency to have lower temperatures when compared to with more sparse arrangements [20]. Many other investigations have reported the influence of the aspect ratio on local climate of cities [49,50,51,52,59].
Martins et al. [49] have analyzed the effect of urban cool island in the context of a French national research project that discusses procedures mitigate urban heat island and promote less human thermal based on the physiological equivalent temperature [60]. Their analysis compares various suitable urban design strategies focused on mitigating urban heat island effects in summer conditions. With respect to the aspect ratio, they reported that pedestrians have experienced moderate heat stress around noon but under more favorable conditions than in the base-case scenario where the aspect was half of the ‘aspect ratio’ scenario. The authors have attributed this favorable condition to the presence of shadows in the scenario with doubled aspect ratio.
An investigation of the specific role of aspect ratio on the UHI has been conducted by [50]. Their approach used a single-column simulation of the mesoscale model WRF (Weather and Research Forecast model) and observation inside real scale canyons at 2 m agl. The model outcomes temperature for urban (Rotterdam e rural area (Cabauw) fitted quite well the observation of both sites. Their simulations for the aspect ratio sensitivity were in the range 0.3 h / d 3.0 . The UHI showed asymptotic behavior within that range. The most enhanced UHI occurred in summer and spring. This authors’ investigation is restricted to the geometric feature of the aspect ratio; this does not include any human factor linked to the aspect ration as explained in the beginning of this section.
Herrmann and Matzarakis [51] discuss the aspect ratio effect on the radiant mean temperature and wind in a typical urban canyon Freibug, German, considered by the author as a medium-sized western European city. They made use of a model able to transfer global radiation from an area with a free horizon to urban structures. They found that mean radiant temperature and thermal bioclimate conditions in urban areas can be affected strongly by the urban geometry such as width, height and orientation of an urban canyon. In this direction, Ali-Toudert and Mayer [59] have also reported the influence of the aspect ratio on the urban air temperature and on the thermal comfort in urban areas. As they point out, a suitable combination of aspect ratios and canyon orientation can improve thermal comfort at pedestrian level.

4.2. Influence on the Airflow and UBL Dynamics

The impact of the aspect ratio on the air flow inside urban canopies is due to its capability of changing aerodynamics properties of the surface the circulation patterns [13,15,23,31,61].
To understand more easily the impact of the aspect ratio over the boundary layer and airflow over an urban area, we depart from a boundary layer bulk-model proposed by Tennekes (1973), which is a simple and yet captures the essence of the physics involved.

4.2.1. Boundary Layer Growth

Bulk models are those in which the motion equations are written in integral (bulk) form for a whole layer from certain assumptions. Tennekes’ model is a bulk model whose assumptions are: (i) potential temperature is uniform inside the mixed layer and (ii) there is no significant wind shear, so that the ML growing be exclusively due to the heat fluxes divergence. First condition is usually ensured by the strength mixing encountered during a convective period; the second condition can widely vary from city to city, but can usually be found in some cities such as São Paulo-Brazil, where the surface mean wind is as low as 1 m/s. In the Tennekes’ model the dynamics of the mixed layer under an inversion temperature gradient can be approximately described as [41]:
d h d t = 0.2 w θ ¯ | 0 Δ ,
where w θ ¯ | 0 is the surface sensible heat flux and Δ is the temperature step in the entrainment layer, which can also be prognostically calculated. The Tennekes’ model also assumes horizontal homogeneity, no atmospheric sources or sinks, steady synoptic weather, and no cloud cover. In short, given some idealized conditions, the atmospheric boundary layer growth is ruled by the surface sensible heat flux, hence the importance of the city energetics.

4.2.2. Aspect Ratio Impact on Boundary Layer Growth

More sophisticated models than Tennekes’, such as a single-column turbulence model coupled with an urban surface parameterization, can capture the impact of urban heat fluxes over UBL [45]. Urban energy fluxes change the boundary height and also the duration of the convective period.
In Figure 3, the temporal evolution of UBL shows strongly dependent on the aspect ratio. In the case of low-rise buildings, the height of the boundary layer is greater. This fact is directly related to the behavior of the sensible heat flux at the surface level, which promotes the bottom-up growth of the UBL. The height of the UBL is lower over an urban canopy with high-rise buildings. In observational studies, the effective aspect ratio is difficult to establish and is estimated via the sky view factor in locations that may be representative of an entire region [62]. The anthropogenic heat flux combined with the warming of the atmosphere due to the aerosol and the presence of greenhouse gases may lead to observational studies to find values of z i greater than those simulated here. The maximum value of the height of the mixing layer decreases exponentially in function of h / d . The local time at which the boundary layer abruptly decays, T D , also varies with h / d in similar fashion. The increased shading of the canopy causes the positive sensible heat flux to decrease (not shown). Therefore, the UBL grows less and ceases sooner. The evolution of the height of the UBL obtained from this turbulence-urban surface model is consistent with that observed in São Paulo City, Brazil, on hot summer days [41] and in winter [63]. Despite all approximations, this kind of modeling reveals many features consistent with the basic physics of processes.

4.3. Air Quality

The production of pollutants derived from the burning of fossil fuels such as gasoline, diesel, and liquefied petroleum gas can occur at a higher rate than UCL can disperse them, causing recurrent pollution episodes. The urbanization process also affects the radiometric and thermal properties of the surface. A third effect of urban centers on CLU is due to anthropogenic heat production. Thus, urban surface geometry and human activity together directly affect the temperature and moisture near the surface.
First attempts of describing the micrometeorological processes in an urban boundary layer were strongly based on the Monin-Obukhov Similarity Theory (MOST). However, MOST characteristics may be invalidated if the spatial distribution of buildings (obstacles from a dynamicviewpoint) is relatively heterogeneous as in the majority of the cases. For example, Cheng and Castro [64] used a wind tunnel to study the effect of such heterogeneity. They obtained detailed data of turbulence in and above idealized urban canopies, which consisted of cubic and rectangular blocks regularly scattered. Configurations with elements of uniform and variable height were also studied. They found a much thinner surface boundary layer (SBL) over the variable-height element configuration than over the homogeneous-height configuration. Cheng Castro concluded that the SBL may not even be present on a real urban surface. In addition, defining a suitable roughness length z 0 and friction velocity u * can also be a difficult task in heterogeneous surfaces, particularly in urban areas.
The growing rate of the mixed layer in conditions of low wind is a main factor for pollutant dispersion. To study this process, a single-wavelength elastic backscatter lidar and a simple bulk model describing the dynamics of the inversion above the ML were used. The results show that the ML is likely to be lower during the wintertime, causing unfavorable conditions for pollutants dispersion in urban settings. For example, a close relation between the mixed layer height and CO2 concentration near the ground has been observed in the urban boundary layer study conducted in Basel, Switzerland [65].
In Figure 3, the temporal evolution of UBL as discussed previously. Such behavior in relation to the canopy geometry brings an important diagnosis related to the pollution of urban centers. High-rise buildings mean high population density, implying greater consumption of fuel and production of pollutants. Thus, the verticalization of cities contributes with two factors to the increase in urban pollution: an increase in the production of pollutants (a known fact) and a reduction in the height of the boundary layer.

4.4. Sensible Heat Flux and Temperature an Tendency towards Downtown: The JU2003 Case

According to the general framework of the UHI, surface air temperatures are expected to continue rising towards downtown. Data from the JU2003 allow us to check the behavior of temperature and sensible heat flux across the urban and suburban area of Oklahoma City. Complete documentation of the JU2003 campaign can be found in [5] and references there in, and details of the energy fluxes behavior are in [66,67].
In general, the flux into solid material G, related to the canopy stored energy, tends to be higher in downtown, while latent heat flux is systematically higher in uptown. This is expected once uptown sites do lay in a area with much more green cover (lawns and trees), as can be easily checked by satellite images [67]. Figure 4 shows sensible heat fluxes and air temperature near the ground collected in the JU2003 field campaign. Data from sonic anemometers are, in general, 10 min averaged; to obtain a more representative sample,60 min average (co)variance a correction was carried out. Most of sonic data are concentrated in the city center and present great variability. A possible source of this variability is the lack of completeness of some archives which in turn produces less robust statistics. However, we are bound to regard that the microscale is the principal cause of such a variability. For instance, both temperature and wind components, from which the sensible heat flux is derived, are very sensitive to the relative building positioning; building surfaces can be sheltered from direct solar radiation and sheltering instruments from wind as well.
Only a negligible horizontal gradient is observed for H m a x , showing that during daytime the sensible heat flux is likely to homogeneous. Here, is worthwhile to mention that all the JU2003 campaign took place during summer days (mostly in July), a period when heating systems are not in use. This makes anthropogenic contributions to the sensible heat flux less. During nighttime, on the other hand, a tendency to increase H m i n is apparent. This brings the condition in which the urban boundary layer during nighttime can be neutral or even slightly unstable [9,24,67]. This behavior is opposite to what is typically observed in suburban or rural areas. The instability of the nocturnal boundary layer over urban areas may be a responsible agent for the fumigation dispersion of pollutants coming from more stable upwind areas [44].
The horizontal temperature gradient is decreasing of both period of the day. At night, the slope is steeper. In the case of the JU003 observation, the urban heat island is present for the whole diurnal cycle, not only at night.
Table 1 summarizes the slopes and intercepts of linear regression performed for data presented in Figure 4. The units of H and T slopes are, respectively, W m 2 km 1 and ° C km 1 ; the intercept units are W m 2 and ° C .

5. Other Effects: Presence of Vegetation and Water Bodies in Urban Canopies

5.1. Effect of Vegetation

Vegetation plays an important role as urban infrastructure in mitigating local atmospheric effects, such as the urban heat island [68,69,70] and the temperature difference between local climate zones (LCZs) [71,72]. Urban green limits these effects through evapotranspiration from the surface of plants and shading [73]. Therefore, the use of a green roof is often recommended [74,75,76,77].
From the point of view of building energetics, the use of a green roof works by increasing the roofs’ thermal mass and the substrate acting as an additional heat transfer resistor, reducing incoming heat fluxes [78]. In this way, it can work as a thermal insulator during the winter period and a source of moisture during the summer period [79]. Figure 5 shows the roof temperature of affordable housing located in the city of San Javier, Chile, for a simulation with and without a green roof using the EnergyPlus model [80] for a few days in the summer month. The use of green roofs with low costs of maintenance can save up to 30% in electricity [81].
Urban green areas go beyond the green roof, and urban parks are crucial to minimize the effect of local heating, with benefits ranging from canopy, micrometeorological and mesoscale levels [82]. In general, there is a decrease in temperature that can reach up to 500 m near the parks [83], with intensities that can reach up to 4 °C [84] between the central part of the park and the urban surroundings. The differences are related to the type of park, with the height of vegetation having a significant influence [68], as the impact on the surface energy balance is related to the shading and evapotranspiration generated by green areas [85]. The soil-vegetation-atmosphere interaction in urban regions depends fundamentally on the physical characteristics of vegetation since the urban energetics is mainly driven by short-wave and long-wave radiation. Both retention and reflection of radiation are dependent on the physical and geometric structure of the canopy, as discussed in Section 4 and also in [86,87].
The role of vegetation to local circulations in the urban canopy also influences air quality management in urban areas. In general, vegetation works similar to a drag force in urban areas, adding pressure and viscous drag to the momentum equation [88,89,90,91]. In addition to deposition, the aerodynamic effect due to urban greenery must be applied in urban planning to minimize episodes of high levels of environmental contamination [92,93,94,95]. Trees serve as a sink for excess C O 2 in the atmosphere during photosynthesis and can sequester approximately 11 kg of carbon per year [96]. Furthermore, they can minimize the formation of ground-level ozone [97,98,99], even in heatwave episodes [100]. The use of green roofs and urban vegetation is recommended for the deposition of fine and coarse particulate material, which can be encouraged in atmospheric decontamination plans.

5.2. Effect of Water Bodies

As well as vegetation, water bodies play an essential role in urban climatology, being considered one of the sustainable ways to mitigate the effects of UHI [101]. From a local point of view, water bodies develop Urban Cooling Islands (UCI) depending on their extent and can decrease the intensity of the UHI by up to 5.4 °C/km [102]. Knowing the relationship between urban lakes extension and UCI intensity is a crucial piece of information for city planners, since the urbanization process can reduce the extent of urban lakes [103].
Physically, an urban pond acts as a heat absorber. Given the high thermal capacity of water, open water bodies store heat during the day and release it at night, mainly in the form of long-wave radiation [104] and latent heat fluxes. However, during warm summer days episodes, the water temperature can remain relatively hot during transition periods between seasons, maintaining a high UHI throughout the daily cycle [105], resulting in an unexpected effect.
In addition to the UHI effects, urban ponds influence outdoor thermal comfort. Even resulting in a decrease in temperature due latent heat flux release, the increase in humidity in areas close to the lake has negative influencing on the thermal sensation of the inhabitants [106]. From an urban design point of view, larger bodies of water parallel oriented to the prevailing wind, even within urban canyons, can optimize thermal comfort in the regions closest to the pond [107].
Proportionally, green spaces and water bodies have a similar influence in mitigating the intensity of the UHI [108]. However, the cost of maintaining green spaces to mitigate urban effects on the micro-climate can be a much cheaper strategy than urban lakes, in addition to having other benefits, such as pollutant removal [109].

6. Final Remarks

In this paper, we brought key features of the urban climatology in particular the aspect ratio and its effects on the energetics of an urban fabric. It was shown that the aspect ratio by itself is responsible for a large change in the energy balance. Combined with changes in the impervious area and a lack of green cover, most of the radiant energy is used to heat up the surface increasing the amount of sensible heat flux in relation to the latent heat flux. Nevertheless, a systematic increase in the aspect ratio for large areas can produce a counter effect, that is, the reduction in surface temperature. Numerical simulations based on urban surface parameterization and physics rationale lead us to believethat there is a limit for the enhancement of the UHI intensity. In somewhat restrictive conditions, the boundary layer over urban areas can also be impacted, reducing its growing for high aspect ratio. We highlight that such an effect is predicted for homogeneous canopies. In more realist urban configurations, those effects will probably be attenuated. Though compact cities can be cooler according to our analysis, the authors do not imply that city planners should work in this sense. On the contrary, compact cities are likely to present living problems that surpass any advantage of the cooling effect due to the high aspect ratio. Instead, urban planners should better consider in the urban design the use of green areas such as parks or water bodies, since it impacts on the local circulation, directly influencing the outdoor thermal comfort.

Author Contributions

Conceptualization, E.R.M.; writing—original draft preparation, E.R.M. and M.V.B.d.M.; writing—review and editing, E.R.M. and M.V.B.d.M. All authors have read and agreed to the published version of the manuscript.

Funding

This research received no external funding.

Data Availability Statement

Not applicable.

Conflicts of Interest

The authors declare no conflict of interest.

References

  1. Oke, T.R. The urban energy balance. Prog. Phys. Geogr. 2001, 12, 471–508. [Google Scholar] [CrossRef]
  2. Rotach, M.W.; Vogt, R.; Bernhofer, C.; Batchvarova, E.; Christen, A.; Clappier, A.; Feddersen, B.; Gryning, S.-E.; Martucci, G.; Mayer, H.; et al. BUBBLE—An urban boundary layer meteorology project. Theor. Appl. Climatol. 2005, 81, 231–261. [Google Scholar] [CrossRef] [Green Version]
  3. Wood, C.R.; Arnold, S.J.; Balogun, A.A.; Barlow, J.F.; Belcher, S.E.; Britter, R.E.; White, I.R. Dispersion experiments in central London: The 2007 DAPPLE project. Bull. Am. Meteorol. Soc. 2009, 90, 955–970. [Google Scholar] [CrossRef]
  4. Mestayer, P.G.; Durand, P.; Augustin, P. The urban boundary-layer field campaign in marseille (ubl/clu-escompte): Set-up and first results. Bound. Lay. Meteorol. 2005, 114, 315–365. [Google Scholar] [CrossRef]
  5. Allwine, K.J.; Leach, M.J.; Stockham, L.W.; Shinn, J.S.; Hosker, R.P.; Bowers, J.F.; Pace, J.C. 2004: Overview of Joint Urban 2003—An atmospheric dispersion study in Oklahoma City. In Proceedings of the 84th AMS Annual Meeting, Seattle, WA, USA, 11–15 January 2004. [Google Scholar]
  6. Eliasson, I.; Offerle, B.; Grimmond, C.S.B.; Lindqvist, S. Wind fields and turbulence statistics in an urban street canyon. Atmos. Environ. 2006, 40, 1–16. [Google Scholar] [CrossRef]
  7. Kanda, M.; Kasamatsu, F.; Moriwaki, R. Spatial variability of turbulent fluxes and temperature profile in an urban roughness layer. Bound. Lay. Meteorol. 2006, 121, 339–350. [Google Scholar] [CrossRef]
  8. Doran, J.C.; Barnard, J.C.; Arnott, W.P.; Cary, R.; Coulter, R.; Fast, J.D.; Kassianov, E.I.; Kleinman, L.; Laulainen, N.S.; Martin, T.; et al. The T1-T2 Study: Evolution of Aerosol Properties Downwind of Mexico City. Atmos. Chem. Phys. 2007, 7, 1585–1598. [Google Scholar] [CrossRef] [Green Version]
  9. Hanna, S.; White, J.; Zhou, Y. Observed winds, turbulence, and dispersion in built-up downtown areas of Oklahoma City and Manhattan. Bound. Lay. Meteorol. 2007, 125, 441–468. [Google Scholar] [CrossRef]
  10. Pearlmutter, D.; Berliner, P.; Shaviv, E. Evaluation of urban surface energy fluxes using an open-air scale model. J. Appl. Meteor 2005, 44, 532–545. [Google Scholar] [CrossRef]
  11. Kanda, M.; Kawai, T.; Kanega, M.; Moriwaki, R.; Narita, K.; Hagishima, A. Simple energy balance model for regular building arrays. Bound. Lay. Meteorol. 2005, 116, 423–443. [Google Scholar] [CrossRef]
  12. Biltoft, C. 2001: Customer Report for Mock Urban Setting test (MUST). Rep. No. WDTC-FR-01-121, US Army Dugway Proving Ground. Available online: https://my.mech.utah.edu/~pardyjak/documents/MUSTCustReport.pdf (accessed on 21 August 2021).
  13. Kastner-Klein, P.; Fedorovich, E.; Rotach, M.W. A wind tunnel study of organized and turbulent air motions in urban street canyons. J. Wind Eng. Ind. Aerodyn. 2001, 89, 849–861. [Google Scholar] [CrossRef]
  14. Plate, E.J. Methods of investigating urban wind fields—Physical models. Atmos. Environ. 1999, 33, 3981–3989. [Google Scholar] [CrossRef]
  15. Robins, A.; Castro, I.; Hayden, P.; Steggel, N.; Contini, D.; Heist, D.; Taylor, T.J. A wind tunnel study of dense gas dispersion in a stable boundary layer over rough surface. Atmos. Environ. 2001, 35, 2253–2563. [Google Scholar] [CrossRef]
  16. Allwine, J.; Shinn, J.H.; Streit, G.E.; Clawson, K.L.; Brown, B. Overview of URBAN 2000: A multi-scale field study of dispersion through an urban environment. Bull. Am. Meteorol. Soc. 2002, 83, 521–536. [Google Scholar] [CrossRef] [Green Version]
  17. Kaimal, J.C.; Finnigan, J.J. Atmospheric Boundary Layer Flows–Their Structure and Measurement; Oxford University Press: Oxford, UK, 1994; p. 289. [Google Scholar]
  18. Aubinet, M.; Vesala, T.; Papale, D. (Eds.) Eddy Covariance—A Practical Guide to Measurement and Data Analysis; Springer: Berlin/Heidelberg, Germany, 2012. [Google Scholar] [CrossRef]
  19. Oke, T.R. Initial Guidance to Obtain Representative Meteorological Observations at Urban Sites, WMO/TD-No. 1250. 2006. Available online: http://blogs.ubc.ca/toke/files/2015/12/IOM-81-UrbanMetObs.pdf (accessed on 21 August 2021).
  20. Pearlmutter, D.; Berliner, P.; Shaviv, E. Physical modeling of pedestrian energy exchange within the urban canopy. Build. Environ. 2006, 41, 783–795. [Google Scholar] [CrossRef]
  21. Martilli, A. Numerical Study of Urban Impact on Boundary Layer Structure: Sensitivity to Wind Speed, Urban Morphology, and Rural Soil Moisture. J. Appl. Meteorol. 2002, 41, 1247–1266. [Google Scholar] [CrossRef]
  22. Hamdi, R.; Schayes, G. Sensitivity study of the urban heat island intensity to urban characteristics. Int. J. Climatol. 2008, 28, 973–982. [Google Scholar] [CrossRef]
  23. Grimmond, C.S.B.; Oke, T.R. Aerodynamic properties of urban area derived from analysis of surface form. J. Appl. Meteor. 1999, 38, 1261–1292. [Google Scholar] [CrossRef]
  24. Britter, R.E.; Hanna, S.R. Flow and dispersion in urban areas. Annu. Rev. Fluid Mech. 2003, 35, 469–496. [Google Scholar] [CrossRef]
  25. Antonia, R.; Luxton, R. The response of a turbulent boundary layer to a step change in surface roughness Part 1. Smooth to rough. J. Fluid Mech. 1971, 48, 721–761. [Google Scholar] [CrossRef]
  26. Antonia, R.; Luxton, R. The response of a turbulent boundary layer to a step change in surface roughness. Part 2. Rough-to-smooth. J. Fluid Mech. 1972, 53, 737–757. [Google Scholar] [CrossRef]
  27. Raupach, M.R.; Thom, A.S.; Edwards, I. A wind-tunnel study of turbulent flow close to regularly arrayed rough surfaces. Bound. Lay. Meteorol. 1980, 18, 373–397. [Google Scholar] [CrossRef]
  28. Barlow, J.B.; Rae, W.H., Jr.; Pope, A. Low-Speed WindTunnel Testing, 3rd ed.; John Wiley and Sons: New York, NY, USA, 1999. [Google Scholar]
  29. Counihan, J. An improved method of simulating an atmospheric boundary layer in a wind tunnel. Atmos. Environ. 1969, 3, 197–200. [Google Scholar] [CrossRef]
  30. Mehta, R.D.; Bradshaw, P. Design rules for small low speed wind tunnels. Aeronaut. J. 1979, 83, 443–449. [Google Scholar]
  31. Baik, J.J.; Park, R.E.; Chun, H.Y.; Kim, J.J. A laboratory model of urban street-canyon flows. J. Appl. Meteor. 2000, 39, 1592–1600. [Google Scholar] [CrossRef]
  32. Uehara, K.; Murakami, S.; Oikawa, S.; Wakamatsu, S. Wind tunnel experiments on how thermal stratification affects flow in and above urban street canyons. Atmos. Environ. 2000, 34, 1553–1562. [Google Scholar] [CrossRef]
  33. Allegrini, J.; Dorer, V.; Carmeliet, J. Wind tunnel measurements of buoyant flows in street canyons. Build. Environ. 2013, 59, 315–326. [Google Scholar] [CrossRef]
  34. Cui, P.-Y.; Li, Z.; Tao, W.-Q. Buoyancy flows and pollutant dispersion through different scale urban areas: CFD simulations and wind-tunnel measurements. Build. Environ. 2016, 104, 76–91. [Google Scholar] [CrossRef] [Green Version]
  35. Zhao, Y.; Chew, L.W.; Kubilay, A.; Carmeliet, J. Isothermal and non-isothermal flow in street canyons: A review from theoretical, experimental and numerical perspectives. Build. Environ. 2020, 184, 107163. [Google Scholar] [CrossRef]
  36. Zhao, Y.; Li, H.; Kubilay, A.; Carmeliet, J. Buoyancy effects on the flows around flat and steep street canyons in simplified urban settings subject to a neutral approaching boundary layer: Wind tunnel PIV measurements. Sci. Total. Environ. 2021, 797, 149067. [Google Scholar] [CrossRef]
  37. Park, S.-J.; Kim, J.-J.; Choi, W.; Kim, E.-R.; Song, C.-K.; Pardyjak, E.R. Flow Characteristics Around Step-Up Street Canyons with Various Building Aspect Ratios. Bound.-Layer Meteorol. 2020, 174, 411–431. [Google Scholar] [CrossRef] [Green Version]
  38. Jin, M.; Shepherd, J.M. Inclusion of Urban Landscape in a Climate Model. Bull. Amer. Meteor. Soc. 2005, 86, 681–689. [Google Scholar] [CrossRef] [Green Version]
  39. Menut, L.; Flamant, C.; Pelon, J.; Flamant, P.H. Urban boundary-layer height determination from lidar measurements over the Paris area. Appl. Opt. 1999, 38, 945–954. [Google Scholar] [CrossRef]
  40. Eichinger, W.E.; Cooper, D.I. Using lidar remote sensing for spatially resolved measurements of evaporation and other meteorological parameters. Agron. J. 2007, 99, 255–271. [Google Scholar] [CrossRef]
  41. Marciotto, E.R.; Nakaema, W.N.; Landulfo, E. Evolution of the atmospheric boundary layer: LIDAR observations and modeling. In Proceedings of the 26th International Laser Radar Conference (ILRC26), Porto Heli, Greece, 25–29 June 2012; Volume II. [Google Scholar] [CrossRef]
  42. Mahrt, L. Surface Heterogeneity and Vertical Structure of the Boundary Layer. Bound.-Layer Meteorol. 2000, 96, 33–62. [Google Scholar] [CrossRef]
  43. Redway, J.W. Urban versus suburban temperatures. Mon. Weather Rev. 1919, 47, 28–29. [Google Scholar] [CrossRef]
  44. Oke, T.R. Boundary Layer Climates, 2nd ed.; Routledge: Methuen, MA, USA, 1987; ISBN 9780203407219. [Google Scholar]
  45. Marciotto, E.R. Estudo da Influência de um Dossel Urbano sobre o Balanço de Energia na Superfície e Implicações na Estrutura Vertical da Camada Limite Atmosférica. Ph.D. Thesis, Universidade de São Paulo, São Paulo, Brazil, 2008. [Google Scholar]
  46. Marciotto, E.R. Impact of city verticalization on urban surface energy budget: A modeling study. In Proceedings of the Seventh International Conference on Urban Climate, Yokohama, Japan, 29 June–3 July 2009. [Google Scholar]
  47. Marciotto, E.R.; Oliveira, A.P.; Hanna, S.R. Modeling study of the aspect ratio influence on urban canopy energy fluxes with a modified wall-canyon energy budget scheme. Build. Environ. 2010, 45, 2497–2505. [Google Scholar] [CrossRef]
  48. Tso, C.P.; Chan, B.K.; Hashim, M.A. An Improvement to the Basic Energy Balance Model for Urban Thermal Environment Analysis. Ener. Build 1990, 14, 143–152. [Google Scholar] [CrossRef]
  49. Martins, T.; Adolphe, L.; Bonhomme, M.; Faraut, S.; Ginestet, S.; Michel, C.; Guyard, W. Impact of Urban Cool Island measures on outdoor climate and pedestrian comfort: Solutions for a new district of Toulouse, France. Sustain. Cities Soc. 2016, 26, 2–26. [Google Scholar] [CrossRef]
  50. Theeuwes, N.E.; Steeneveld, G.J.; Ronda, R.J.; Heusinkveld, B.G.; Van Hove, L.W.A.; Holtslag, A.A.M. Seasonal dependence of the urban heat island on the street canyon aspect ratio. Q. J. R. Meteorol. Soc. 2014, 140, 2197–2210. [Google Scholar] [CrossRef]
  51. Herrmann, J.; Matzarakis, A. Mean radiant temperature in idealised urban canyons-examples from Freiburg, Germany. Int. J. Biometeorol. 2012, 56, 199–203. [Google Scholar] [CrossRef] [PubMed]
  52. Emmanuel, R.; Fernando, H. Urban heat islands in humid and arid climates: Role of urban form and thermal properties in Colombo, Sri Lanka and Phoenix, USA. Clim. Res. 2007, 34, 241–251. [Google Scholar] [CrossRef] [Green Version]
  53. Kong, J.; Zhao, Y.; Carmeliet, J.; Lei, C. Urban Heat Island and Its Interaction with Heatwaves: A Review of Studies on Mesoscale. Sustainability 2021, 13, 10923. [Google Scholar] [CrossRef]
  54. De Morais, M.V.B.; Marciotto, E.R.; Urbina Guerrero, V.V.; de Freitas, E.D. Effective albedo estimates for the Metropolitan Area of São Paulo using empirical sky-view factors. Urban Clim. 2017, 21, 183–194. [Google Scholar] [CrossRef]
  55. Johnson, G.T.; Watson, I.D. The Determination of View-Factors in Urban Canyons. J. Clim. Appl. Meteorol. 1984, 23, 329–335. [Google Scholar] [CrossRef]
  56. Chapman, L.; Thornes, J.E.; Bradly, A.V. Rapid Determination of Canyon Geometry Parameters for Use Surface Radiation Budgets. Theor. Appl. Climatol. 2001, 69, 81–89. [Google Scholar] [CrossRef]
  57. Lee, D.I.; Woo, J.W.; Lee, S.H. An analytically based numerical method for computing view factors in real urban environments. Theor. Appl. Climatol. 2018, 131, 445–453. [Google Scholar] [CrossRef]
  58. Garratt, J.R. The Atmospheric Boundary Layer; Cambridge University Press: Cambridge, UK, 1994; ISBN 0-521-38052-9. [Google Scholar]
  59. Ali-Toudert, F.; Mayer, H. Numerical study on the effects of aspect ratio and orientation of an urban street canyon on outdoor thermal comfort in hot and dry climate. Build. Environ. 2006, 41, 94–108. [Google Scholar] [CrossRef]
  60. Höppe, P.R. The physiological equivalent temperature—A universal index for the bioclimatological assessment of the thermal environment. Int. J. Biometeorol. 1999, 4, 71–75. [Google Scholar]
  61. Marciotto, E.R.; Fisch, G. Wind tunnel study of turbulent flow past an urban canyon model. Environ. Fluid Mech. 2013, 13, 403–416. [Google Scholar] [CrossRef]
  62. Morais, M.V.B.; Freitas, E.D.; Marciotto, E.R.; Urbina Guerrero, V.V.; Martins, L.D.; Martins, J.A. Implementation of Observed Sky-View Factor in a Mesoscale Model for Sensitivity Studies of the Urban Meteorology. Sustainability 2018, 10, 2183. [Google Scholar] [CrossRef] [Green Version]
  63. Nair, K.N.; Freitas, E.D.; Sanchez-Ccoyllo, O.R.; Dias, M.S.; Silva Dias, P.L.; Andrade, M.F.; Massambani, O. Dynamics of urban boundary layer over São Paulo associated with mesoscale processes. Meteorol. Atmos. Phys. 2004, 86, 87–98. [Google Scholar] [CrossRef]
  64. Cheng, H.; Castro, I.P. Near Wall Flow over Urban-like Roughness. Bound. Lay Meteorol. 2002, 104, 229–259. [Google Scholar] [CrossRef]
  65. Vogt, R.; Christen, A.; Rotach, M.W.; Roth, M.; Satyanarayana, A.N.V. Temporal dynamics of CO2 fluxes and profiles over a Central European city. Theor. Appl. Climatol. 2006, 84, 117–126. [Google Scholar] [CrossRef]
  66. Marciotto, E.R. Variability of energy fluxes in relation to the net-radiation of urban and suburban areas: A case study. Meteorol. Atmos. Phys. 2013, 121, 17–28. [Google Scholar] [CrossRef]
  67. Hanna, S.; Marciotto, E.R.; Britter, R. Urban Energy Fluxes in Built-Up Downtown Areas and Variations across the Urban Area, for Use in Dispersion Models. J. Appl. Meteorol. Climatol. 2011, 50, 1341–1353. [Google Scholar] [CrossRef]
  68. De Morais, M.V.B.; de Freitas, E.D.; Urbina Guerrero, V.V.; Martins, L.D. A modeling analysis of urban canopy parameterization representing the vegetation effects in the megacity of São Paulo. Urban Clim. 2016, 17, 102–115. [Google Scholar] [CrossRef]
  69. De Morais, M.V.B.; Urbina Guerrero, V.V.; De Freitas, E.D.; Marciotto, E.R.; Valdés, H.; Correa, C.; Agredano, R.; Vera-Puerto, I. Sensitivity of Radiative and Thermal Properties of Building Material in the Urban Atmosphere. Sustainability 2019, 11, 6865. [Google Scholar] [CrossRef] [Green Version]
  70. Sharma, A.; Conry, P.; Fernando, H.J.S.; Hamlet, A.F.; Hellmann, J.J.; Chen, F. Green and cool roofs to mitigate urban heat island effects in the Chicago metropolitan area: Evaluation with a regional climate model. Environ. Res. Lett. 2016, 11, 064004. [Google Scholar] [CrossRef]
  71. Stewart, I.D.; Oke, T.R. Local climate zones for urban temperature studies. Bull. Am. Meteorol. Soc. 2012, 93, 1879–1900. [Google Scholar] [CrossRef]
  72. Martilli, A.; Krayenhoff, E.S.; Nazarian, N. Is the Urban Heat Island intensity relevant for heat mitigation studies? Urban Clim. 2020, 31, 100541. [Google Scholar] [CrossRef]
  73. Masson, V.; Lemonsu, A.; Hidalgo, J.; Voogt, J. Urban climates and climate change. Annu. Rev. Environ. Resour. 2020, 45, 411–444. [Google Scholar] [CrossRef]
  74. Lee, J.S.; Kim, J.T.; Lee, M.G. Mitigation of urban heat island effect and greenroofs. Indoor Built Environ. 2014, 23, 62–69. [Google Scholar] [CrossRef]
  75. Kibert, C.J. Sustainable Construction: Green Building Design and Delivery; John Wiley & Sons, Ltd.: Hoboken, NJ, USA, 2016; ISBN 9781119055174. [Google Scholar]
  76. Santamouris, M. Cooling the cities—A review of reflective and green roof mitigation technologies to fight heat island and improve comfort in urban environments. Sol. Energy 2014, 103, 682–703. [Google Scholar] [CrossRef]
  77. Masson, V.; Marchadier, C.; Adolphe, L.; Aguejdad, R.; Avner, P.; Bonhomme, M.; Bretagne, G.; Briottet, X.; Bueno, B.; de Munck, C.; et al. Adapting cities to climate change: A systemic modelling approach. Urban Clim. 2014, 10, 407–429. [Google Scholar] [CrossRef]
  78. Vera, S.; Pinto, C.; Tabares-Velasco, P.C.; Bustamante, W. A critical review of heat and mass transfer in vegetative roof models used in building energy and urban enviroment simulation tools. Appl. Energy 2018, 232, 752–764. [Google Scholar] [CrossRef]
  79. Maiolo, M.; Pirouz, B.; Bruno, R.; Palermo, S.A.; Arcuri, N.; Piro, P. The role of the extensive green roofs on decreasing building energy consumption in the Mediterranean climate. Sustainability 2020, 12, 359. [Google Scholar] [CrossRef] [Green Version]
  80. Brackney, L.; Parker, A.; Macumber, D.; Benne, K. Building Energy Modeling with OpenStudio: A Practical Guide for Students and Professionals; Springer: Cham, Switzerland, 2018; ISBN 9783319778082. [Google Scholar]
  81. Niu, H.; Clark, C.; Zhou, J.; Adriaens, P. Scaling of economic benefits from green roof implementation in Washington, DC. Environ. Sci. Technol. 2010, 44, 4302–4308. [Google Scholar] [CrossRef]
  82. Duarte, D.H.S. Vegetation and climate-sensitive public places. In Urban Climate Challenges in the Tropics: Rethinking Planning and Design Opportunities; Emmanuel, R., Ed.; Imperial College Press: London, UK, 2016; pp. 111–162. [Google Scholar]
  83. Wong, N.H.; Kardinal Jusuf, S.; Aung La Win, A.; Kyaw Thu, H.; Syatia Negara, T.; Xuchao, W. Environmental study of the impact of greenery in an institutional campus in the tropics. Build. Environ. 2007, 42, 2949–2970. [Google Scholar] [CrossRef]
  84. Jauregui, E. Influence of a Large Urban Park on Temperature and Convective Precipitation in a Tropical City. Energy Build. 1990, 15–16, 457–463. [Google Scholar] [CrossRef]
  85. Wong, N.H.; Chen, Y. Tropical Urban Heat Islands: Climate, Building and Greenery; Taylor & Francis: New York, NY, USA, 2009; ISBN 0203931297. [Google Scholar]
  86. Duarte, D.H.S.; Shinzato, P.; dos Santos Gusson, C.; Alves, C.A. The impact of vegetation on urban microclimate to counterbalance built density in a subtropical changing climate. Urban Clim. 2015, 14, 224–239. [Google Scholar] [CrossRef]
  87. Redon, E.; Lemonsu, A.; Masson, V.; Morille, B.; Musy, M. Implementation of street trees in solar radiative exchange parameterization of TEB in SURFEX v8.0. Geosci. Model Dev. Discuss. 2016, 1–46. [Google Scholar] [CrossRef] [Green Version]
  88. Fernando, H.J.S. Fluid dynamics of urban atmospheres in complex terrain. Annu. Rev. Fluid Mech. 2010, 42, 365–389. [Google Scholar] [CrossRef]
  89. Dupont, S.; Otte, T.L.; Ching, J.K.S. Simulation of meteorological fields within and above urban and rural canopies with a mesoscale model (MM5). Bound.-Layer Meteorol. 2004, 113, 111–158. [Google Scholar] [CrossRef]
  90. Smith, A.B.; Jackson, D.W.T.; Cooper, J.A.G.; Hernández-Calvento, L. Quantifying the role of urbanization on airflow perturbations and dunefield evolution. Earth’s Futur. 2017, 5, 520–539. [Google Scholar] [CrossRef]
  91. Imran, H.M.; Kala, J.; Ng, A.W.M.; Muthukumaran, S. Effectiveness of green and cool roofs in mitigating urban heat island effects during a heatwave event in the city of Melbourne in southeast Australia. J. Clean. Prod. 2018, 197, 393–405. [Google Scholar] [CrossRef]
  92. Johansson, E.; Spangenberg, J.; Gouvêa, M.L.; Freitas, E.D. Scale-integrated atmospheric simulations to assess thermal comfort in different urban tissues in the warm humid summer of São Paulo, Brazil. Urban Clim. 2013, 6, 24–43. [Google Scholar] [CrossRef]
  93. Aboelata, A.; Sodoudi, S. Evaluating urban vegetation scenarios to mitigate urban heat island and reduce buildings’ energy in dense built-up areas in Cairo. Build. Environ. 2019, 166, 106407. [Google Scholar] [CrossRef]
  94. Badach, J.; Dymnicka, M.; Baranowski, A. Urban vegetation in air quality management: A review and policy framework. Sustainability 2020, 12, 1258. [Google Scholar] [CrossRef] [Green Version]
  95. Smolova, D.; Friedman, A. Potential Use of Indoor Living Walls in Canadian Dwellings. J 2021, 4, 116–130. [Google Scholar] [CrossRef]
  96. Akbari, H.; Pomerantz, M.; Taha, H. Cool surfaces and shade trees to reduce energy use and improve air quality in urban areas. Sol. Energy 2001, 70, 295–310. [Google Scholar] [CrossRef]
  97. Kumar, P.; Druckman, A.; Gallagher, J.; Gatersleben, B.; Allison, S.; Eisenman, T.S.; Hoang, U.; Hama, S.; Tiwari, A.; Sharma, A.; et al. The nexus between air pollution, green infrastructure and human health. Environ. Int. 2019, 133, 105181. [Google Scholar] [CrossRef] [PubMed]
  98. Eisenman, T.S.; Churkina, G.; Jariwala, S.P.; Kumar, P.; Lovasi, G.S.; Pataki, D.E.; Weinberger, K.R.; Whitlow, T.H. Urban trees, air quality, and asthma: An interdisciplinary review. Landsc. Urban Plan. 2019, 187, 47–59. [Google Scholar] [CrossRef]
  99. Urbina-Guerrero, V.V.; Morais, M.V.B.; De Freitas, E.D.; Martins, L.D. Numerical study of meteorological factors for tropospheric nocturnal ozone increase in the metropolitan area of São Paulo. Atmosphere 2021, 12, 287. [Google Scholar] [CrossRef]
  100. Churkina, G.; Kuik, F.; Bonn, B.; Lauer, A.; Grote, R.; Tomiak, K.; Butler, T.M. Effect of VOC Emissions from Vegetation on Air Quality in Berlin during a Heatwave. Environ. Sci. Technol. 2017, 51, 6120–6130. [Google Scholar] [CrossRef] [Green Version]
  101. Masi, F.; Rizzo, A.; Regelsberger, M. The role of constructed wetlands in a new circular economy, resource oriented, and ecosystem services paradigm. J. Environ. Manage. 2018, 216, 275–284. [Google Scholar] [CrossRef]
  102. Sun, R.; Chen, L. How can urban water bodies be designed for climate adaptation? Landsc. Urban Plan. 2012, 105, 27–33. [Google Scholar] [CrossRef]
  103. Deng, Y.; Jiang, W.; Tang, Z.; Li, J.; Lv, J.; Chen, Z.; Jia, K. Spatio-temporal change of lake water extent in Wuhan urban agglomeration based on Landsat images from 1987 to 2015. Remote Sens. 2017, 9, 270. [Google Scholar] [CrossRef] [Green Version]
  104. Solcerova, A.; van de Ven, F.; van de Giesen, N. Nighttime cooling of an urban pond. Front. Earth Sci. 2019, 7, 1–10. [Google Scholar] [CrossRef]
  105. Steeneveld, G.J.; Koopmans, S.; Heusinkveld, B.G.; Theeuwes, N.E. Refreshing the role of open water surfaces on mitigating the maximum urban heat island effect. Landsc. Urban Plan. 2014, 121, 92–96. [Google Scholar] [CrossRef]
  106. Imam Syafii, N.; Ichinose, M.; Kumakura, E.; Jusuf, S.K.; Chigusa, K.; Wong, N.H. Thermal environment assessment around bodies of water in urban canyons: A scale model study. Sustain. Cities Soc. 2017, 34, 79–89. [Google Scholar] [CrossRef]
  107. Syafii, N.I.; Ichinose, M.; Kumakura, E.; Jusuf, S.K.; Hien, W.N.; Chigusa, K.; Ashie, Y. Assessment of the Water Pond Cooling Effect on Urban Microclimate: A Parametric Study with Numerical Modeling. Int. J. Technol. 2021, 12, 461. [Google Scholar] [CrossRef]
  108. Tan, X.; Sun, X.; Huang, C.; Yuan, Y.; Hou, D. Comparison of cooling effect between green space and water body. Sustain. Cities Soc. 2021, 67, 102711. [Google Scholar] [CrossRef]
  109. Targino, A.C.; Coraiola, G.C.; Krecl, P. Green or blue spaces? Assessment of the effectiveness and costs to mitigate the urban heat island in a Latin American city. Theor. Appl. Climatol. 2019, 136, 971–984. [Google Scholar] [CrossRef]
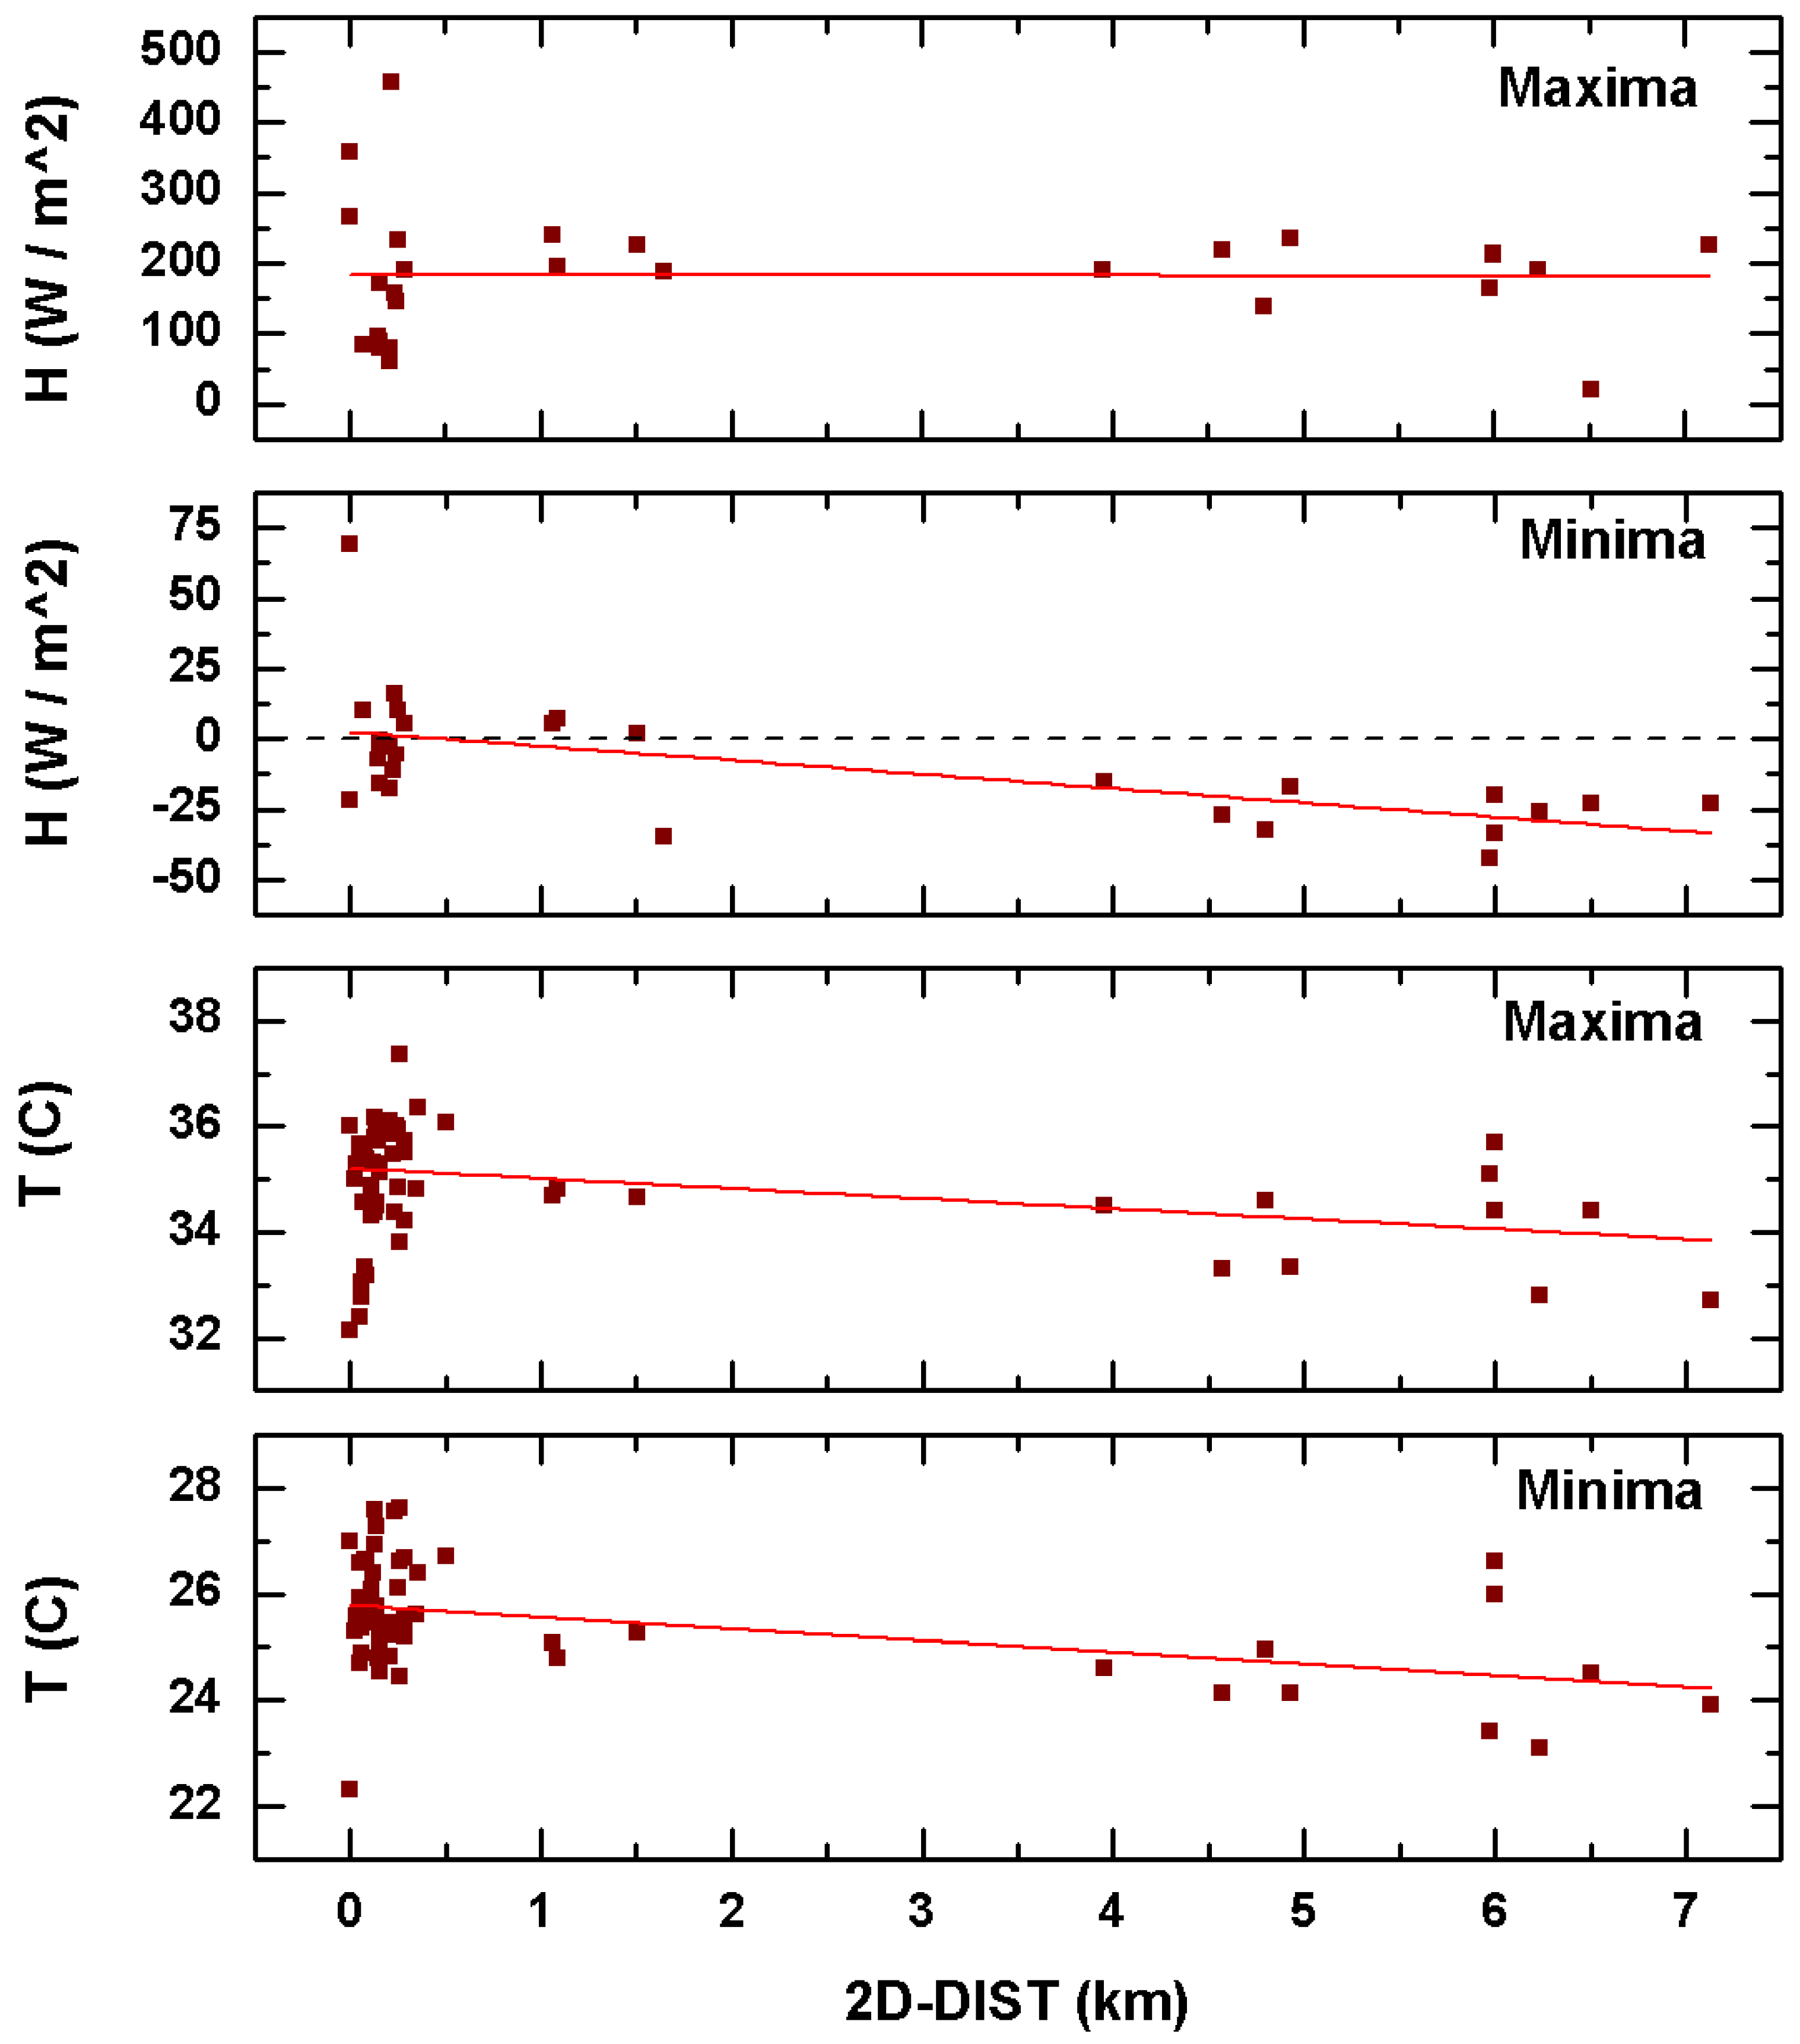
Figure 1. A typical urban canyon model. Buildings are all alike with width b and spacing across the street d. In this simple model, there is no space between buildings on the same side of the street. The figure also shows varied aspect ratios ( h / d ) by changing the building height. Anthropogenic heat is likely to be proportional to building height, thereby proportional to h / d . Blue arrows represent the incoming solar radiation flux over the building under an zenith angle λ .
J 04 00047 g001
Figure 2. Diurnal temperature cycle variation as a function of aspect ratio. It is noticeable the behavior of temperature in the second half of the night period. It is possible to notice that for lower h / d the cooling rate is higher, indicating the effect the trapping of longwave radiation (After Marciotto, 2008).
J 04 00047 g002
Figure 3. The evolution of the boundary layer height in function of the aspect ratio simulated for a winter day (DOY 211) for a set of urban canyons. The canyons were set all parallel to each other in the direction south-north (after Marciotto, 2008 [45]).
J 04 00047 g003
Figure 4. Variation across Oklahoma downtown of maxima and minima sensible heat flux and temperature from sonic anemometers of the JU2003 experiment. ‘2D’ represents the Cartesian distance from Business District Center.
J 04 00047 g004
Figure 5. Simulations output of hourly roof temperature evolution (in °C) with greenroof (red line) and without greenroof (blue line).
J 04 00047 g005
Table 1. Slopes and intercepts of linear regression of sensible heat flux and temperature variation across data are presented in Figure 4. The units of H and T slopes are, respectively, W m 2 km 1 and ° C km 1 ; the intercept units are W m 2 and ° C .
Quantity2D-Distance
SlopeIntercept
H max −0.54184
H min −5.062.51
T max −0.1935.2
T min −0.2225.8
Publisher’s Note: MDPI stays neutral with regard to jurisdictional claims in published maps and institutional affiliations.

