Sensitivity of Planaria to Weak, Patterned Electric Current and the Subsequent Correlative Interactions with Fluctuations in the Intensity of the Magnetic Field of Earth

Abstract
1. Introduction
2. Methods
2.1. Planaria
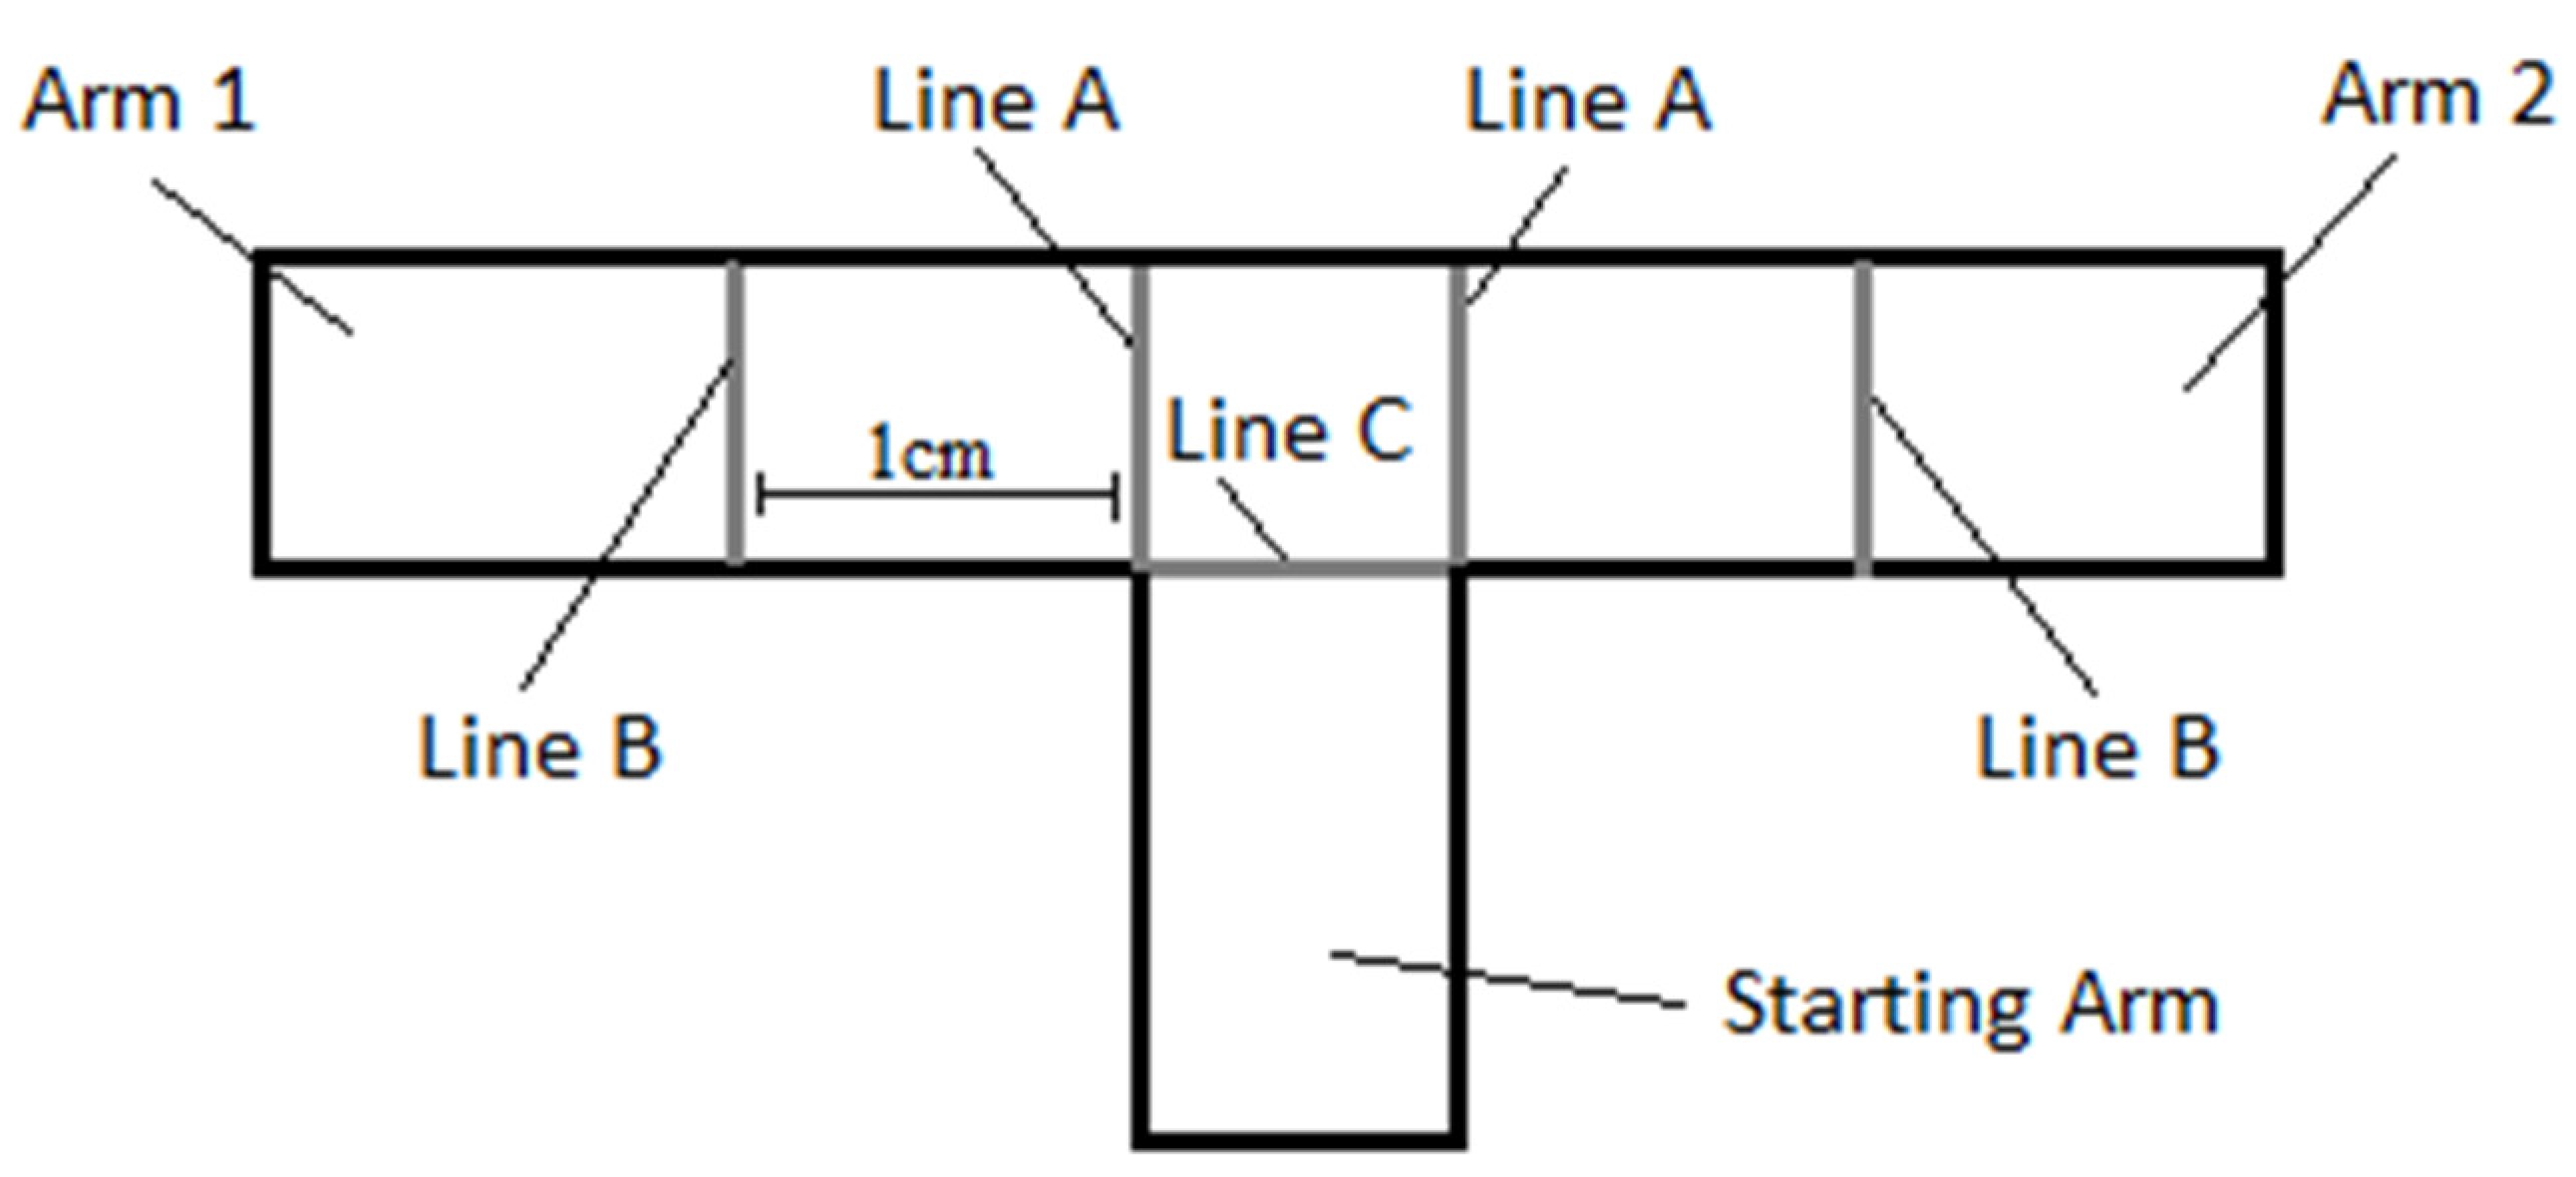
2.2. Electric Field Application
2.3. Behavioral Measures
2.4. Statistical Analysis
3. Results
4. Discussion
Author Contributions
Funding
Acknowledgments
Conflicts of Interest
References
- Meyer, C.G.; Holland, K.N.; Papastamatiou, Y.P. Sharks can detect changes in the geomagnetic field. J. R. Soc. Interface 2004, 2, 129–130. [Google Scholar] [CrossRef]
- Salazar, V.L.; Krahe, R.; Lewis, J.E. The energetics of electric organ discharge generation in gymnotiform weakly electric fish. J. Exp. Biol. 2013, 216, 2459–2468. [Google Scholar] [CrossRef] [PubMed]
- Bellono, N.W.; Leitch, D.B.; Julius, D. Molecular tuning of electroreception in sharks and skates. Nat. Lett. 2018, 558, 122–126. [Google Scholar] [CrossRef] [PubMed]
- Putzier, I.; Kullmann, P.H.; Horn, J.P.; Levitan, E.S. Cav1.3 channel voltage dependence, not Ca2+ selectivity, drives pacemaker activity and amplifies bursts in nigral dopamine neurons. J. Neurosci. 2009, 29, 15414–15419. [Google Scholar] [CrossRef] [PubMed]
- Liu, Y.; Harding, M.; Pittman, A.; Dore, J.; Striessnig, J.; Rajadhyaksha, A.; Chen, X. Cav1.2 and Cav1.3 L-type calcium channels regulate dopaminergic firing activity in the mouse ventral tegmental area. J. Neurophysiol. 2014, 112, 1119–1130. [Google Scholar] [CrossRef]
- Chen, J.; Chu, H.; Xiong, H.; Chen, Q.; Zhou, L.; Bing, D.; Liu, Y.; Gao, Y.; Wang, S.; Huang, X.; et al. Expression patterns of CaV1.3 channels in the rat cochlea. Acta Biochim. Biophys. Sin. 2012, 44, 513–518. [Google Scholar] [CrossRef]
- Persinger, M.A. The Weather Matrix and Human Behavior; Praeger Publishers: New York, NY, USA, 1980. [Google Scholar]
- McCraty, R. Science of the Heart: Exploring the Role of the Heart in Human Performance (Volume 2); HeartMath: Boulder Creek, CA, USA, 2015. [Google Scholar]
- Xiang, J.; Liu, Y.; Wang, Y.; Kotecha, R.; Kirtman, E.G.; Chen, Y.; Huo, X.; Fujiwara, H.; Hemasilpin, N.; deGrauw, T.; et al. Neuromagnetic correlates of developmental changes in endogenous high-frequency brain oscillations in children: A wavelet-based beamformer study. Brain Res. 2009, 1274, 28–39. [Google Scholar] [CrossRef]
- Pobachenko, S.V.; Kolesnik, A.G.; Borodin, A.S.; Kaliuzhin, V.V. The contingency of the parameters of the human brain electroencephalograms and electromagnetic fields of the Schuman resonator based on monitoring studies. Biofizika 2006, 51, 534–538. [Google Scholar]
- Saroka, K.S.; Vares, D.E.; Persinger, M.A. Similar spectral power densities within the Schumann resonance and a large population of quantitative electroencephalographic profiles: Supportive evidence for Koenig and Pobachenko. PLoS ONE 2016, 11, e0146595. [Google Scholar] [CrossRef]
- Ribeiro, P.; El-Shehabi, F.; Patocka, N. Classical transmitters and their receptors in flatworms. Parasitology 2005, 131, S19–S40. [Google Scholar] [CrossRef]
- Brown, F.A. Responses of the planarian, Dugesia, and the protozoan, Paramecium, to very weak horizontal magnetic fields. Biol. Bull. 1962, 123, 264–281. [Google Scholar] [CrossRef]
- Brown, F.A.; Park, Y.H. Phase-shifting a lunar rhythm in planarians by altering the horizontal magnetic vector. Biol. Bull. 1965, 129, 79–86. [Google Scholar] [CrossRef]
- Oviedo, N.J.; Nicolas, C.L.; Adams, D.S.; Levin, M. Establishing and maintaining a colony of planarians. CSH Protocols 2008. [Google Scholar] [CrossRef] [PubMed]
- Stokely, P.S.; Brown, T.S.; Kuchan, F.; Slaga, T.J. The Distribution of Fresh-Water Triclad Planarians in Jefferson County, Ohio. Ohio J. Sci. 1965, 65, 305–318. [Google Scholar]
- Murugan, N.J.; Persinger, M.A. Comparisons of responses by planarian to micromolar to attomolar dosages of morphine or naloxone and/or weak pulsed magnetic fields: Revealing receptor subtype affinities and non-specific effects. Int. J. Radiat. Biol. 2014, 90, 833–840. [Google Scholar] [CrossRef] [PubMed]
- Rostoker, G. Geomagnetic indices. Rev. Geophys. 1972, 10, 935–950. [Google Scholar] [CrossRef]
- Mayaud, P.-N. The aa indices: A 100-year series characterizing the magnetic activity. J. Geophys. Res. 1972, 77, 6870–6874. [Google Scholar] [CrossRef]
- Bureau, Y.R.J.; Persinger, M.A. Decreased latencies for limbic seizures induced in rats by lithium-pilocarpine occur when daily average geomagnetic activity exceeds 20 nanoTesla. Neurosci. Lett. 1995, 192, 142–144. [Google Scholar] [CrossRef]
- Persinger, M.A. Increased geomagnetic activity and the occurrence of bereavement hallucinations: Evidence for melatonin-mediated microseizuring in the temporal lobe? Neurosci. Lett. 1988, 88, 271–274. [Google Scholar] [CrossRef]
- Bureau, Y.R.J.; Persinger, M.A. Geomagnetic activity and enhanced mortality in rats with acute (epileptic) limbic lability. Int. J. Biometeorol. 1992, 36, 226–232. [Google Scholar] [CrossRef]
- Persinger, M.A.; Richards, P.M. Vestibular experiences of humans during brief periods of partial sensory deprivation are enhanced when daily geomagnetic activity exceeds 15-20 nT. Neurosci. Lett. 1995, 194, 69–72. [Google Scholar] [CrossRef]
- Persinger, M.A. Out-of-body-like experiences are more probable in people with elevated complex partial epileptic-like signs during periods of enhanced geomagnetic activity: A nonlinear effect. Percept. Mot. Skills 1995, 80, 563–569. [Google Scholar] [CrossRef] [PubMed]
- O’Connor, R.P.; Persinger, M.A. Brief communication: Increases in geomagnetic activity are associated with increases in thyroxine levels in a single patient: Implications for melatonin levels. Int. J. Neurosci. 1996, 88, 243–247. [Google Scholar] [CrossRef] [PubMed]
- Galic, M.A.; Persinger, M.A. Lagged association between geomagnetic activity and diminished nocturnal pain thresholds in mice. Bioelectromagnetics 2007, 28, 577–579. [Google Scholar] [CrossRef]
- Sukul, N.C.; Croll, N.A. Influence of Potential Difference and Current on the Electrotaxis of Caenorhaditis elegans. J. Nematol. 1978, 10, 314–317. [Google Scholar]
- Manière, X.; Lebois, F.; Matic, I.; Ladoux, B.; Meglio, J.-M.D.; Hersen, P. Running Worms: C. elegans Self-Sorting by Electrotaxis. PLoS ONE 2011, 6, e16637. [Google Scholar] [CrossRef]
- Salam, S.; Ansari, A.; Amon, S.; Rezai, P.; Selvaganapathy, P.R.; Mishra, R.K.; Gupta, B.P. A microfluidic phenotype analysis system reveals function of sensory and dopaminergic neuron signaling in C. elegans electrotactic swimming behavior. Worm 2013, 2, e24558. [Google Scholar] [CrossRef]
- Van Bladel, J.G. Electromagnetic Fields; IEEE Press: Hoboken, NJ, USA, 2007. [Google Scholar]


| Planaria Behaviour Measurements | Sham Mean (SEM) | Thomas Mean (SEM) | F Statement for Effect of Field | |
|---|---|---|---|---|
| Percent that entered arm of electrode | 36.2 (6.29) | 23.0 (6.53) | F(1,35) = 2.07, p = 0.160 | |
| Time to cross Line C (seconds) | Mean | 102.0 (13.9) | 97.8 (11.7) | F(1,35) = 0.28, p = 0.599 |
| SD | 45.3 (7.80) | 47.7 (8.55) | F(1,35) = 0.00, p = 0.995 | |
| Time to cross Line A (seconds) | Mean | 119.2 (9.77) | 106.0 (10.7) | F(1,35) = 1.00, p = 0.325 |
| SD | 62.9 (7.28) | 54.4 (8.83) | F(1,35) = 1.66, p = 0.206 | |
| Total number of arms visited | Mean | 0.97 (0.09) | 0.84 (0.11) | F(1,35) = 0.80, p = 0.377 |
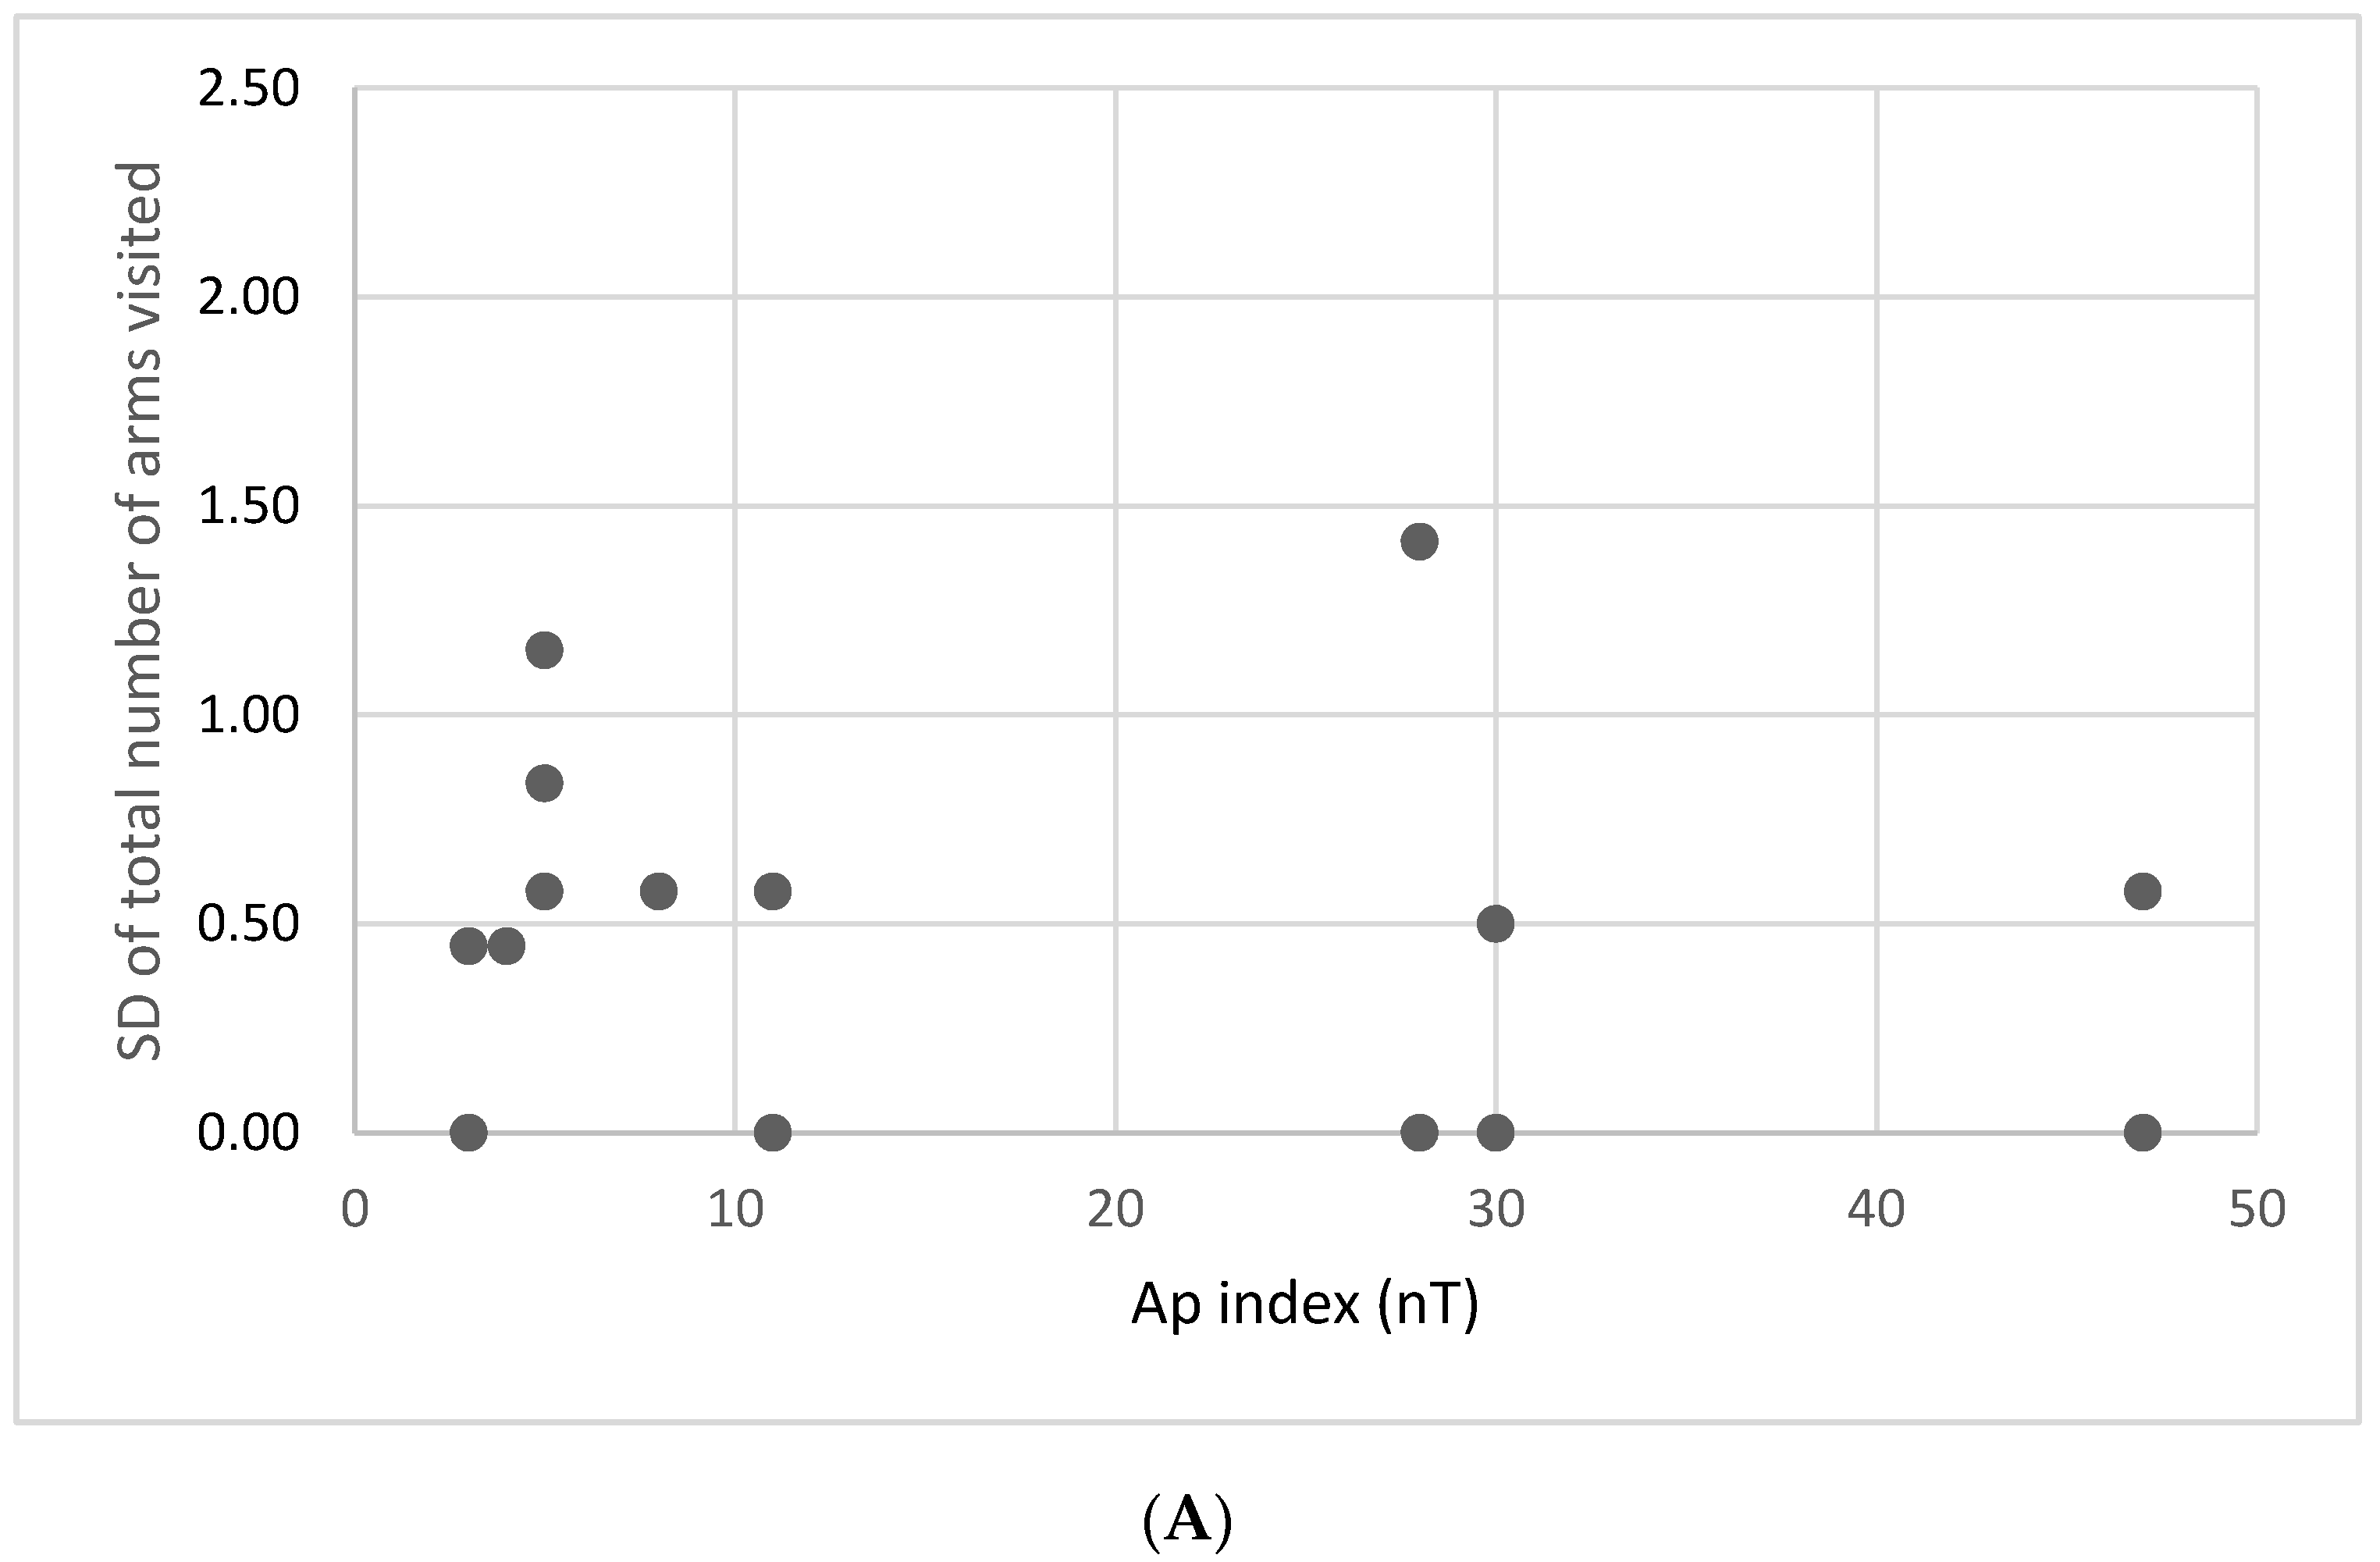
| SD | 0.50 (0.10) | 0.74 (0.13) | F(1,35) = 1.82, p = 0.187 | |
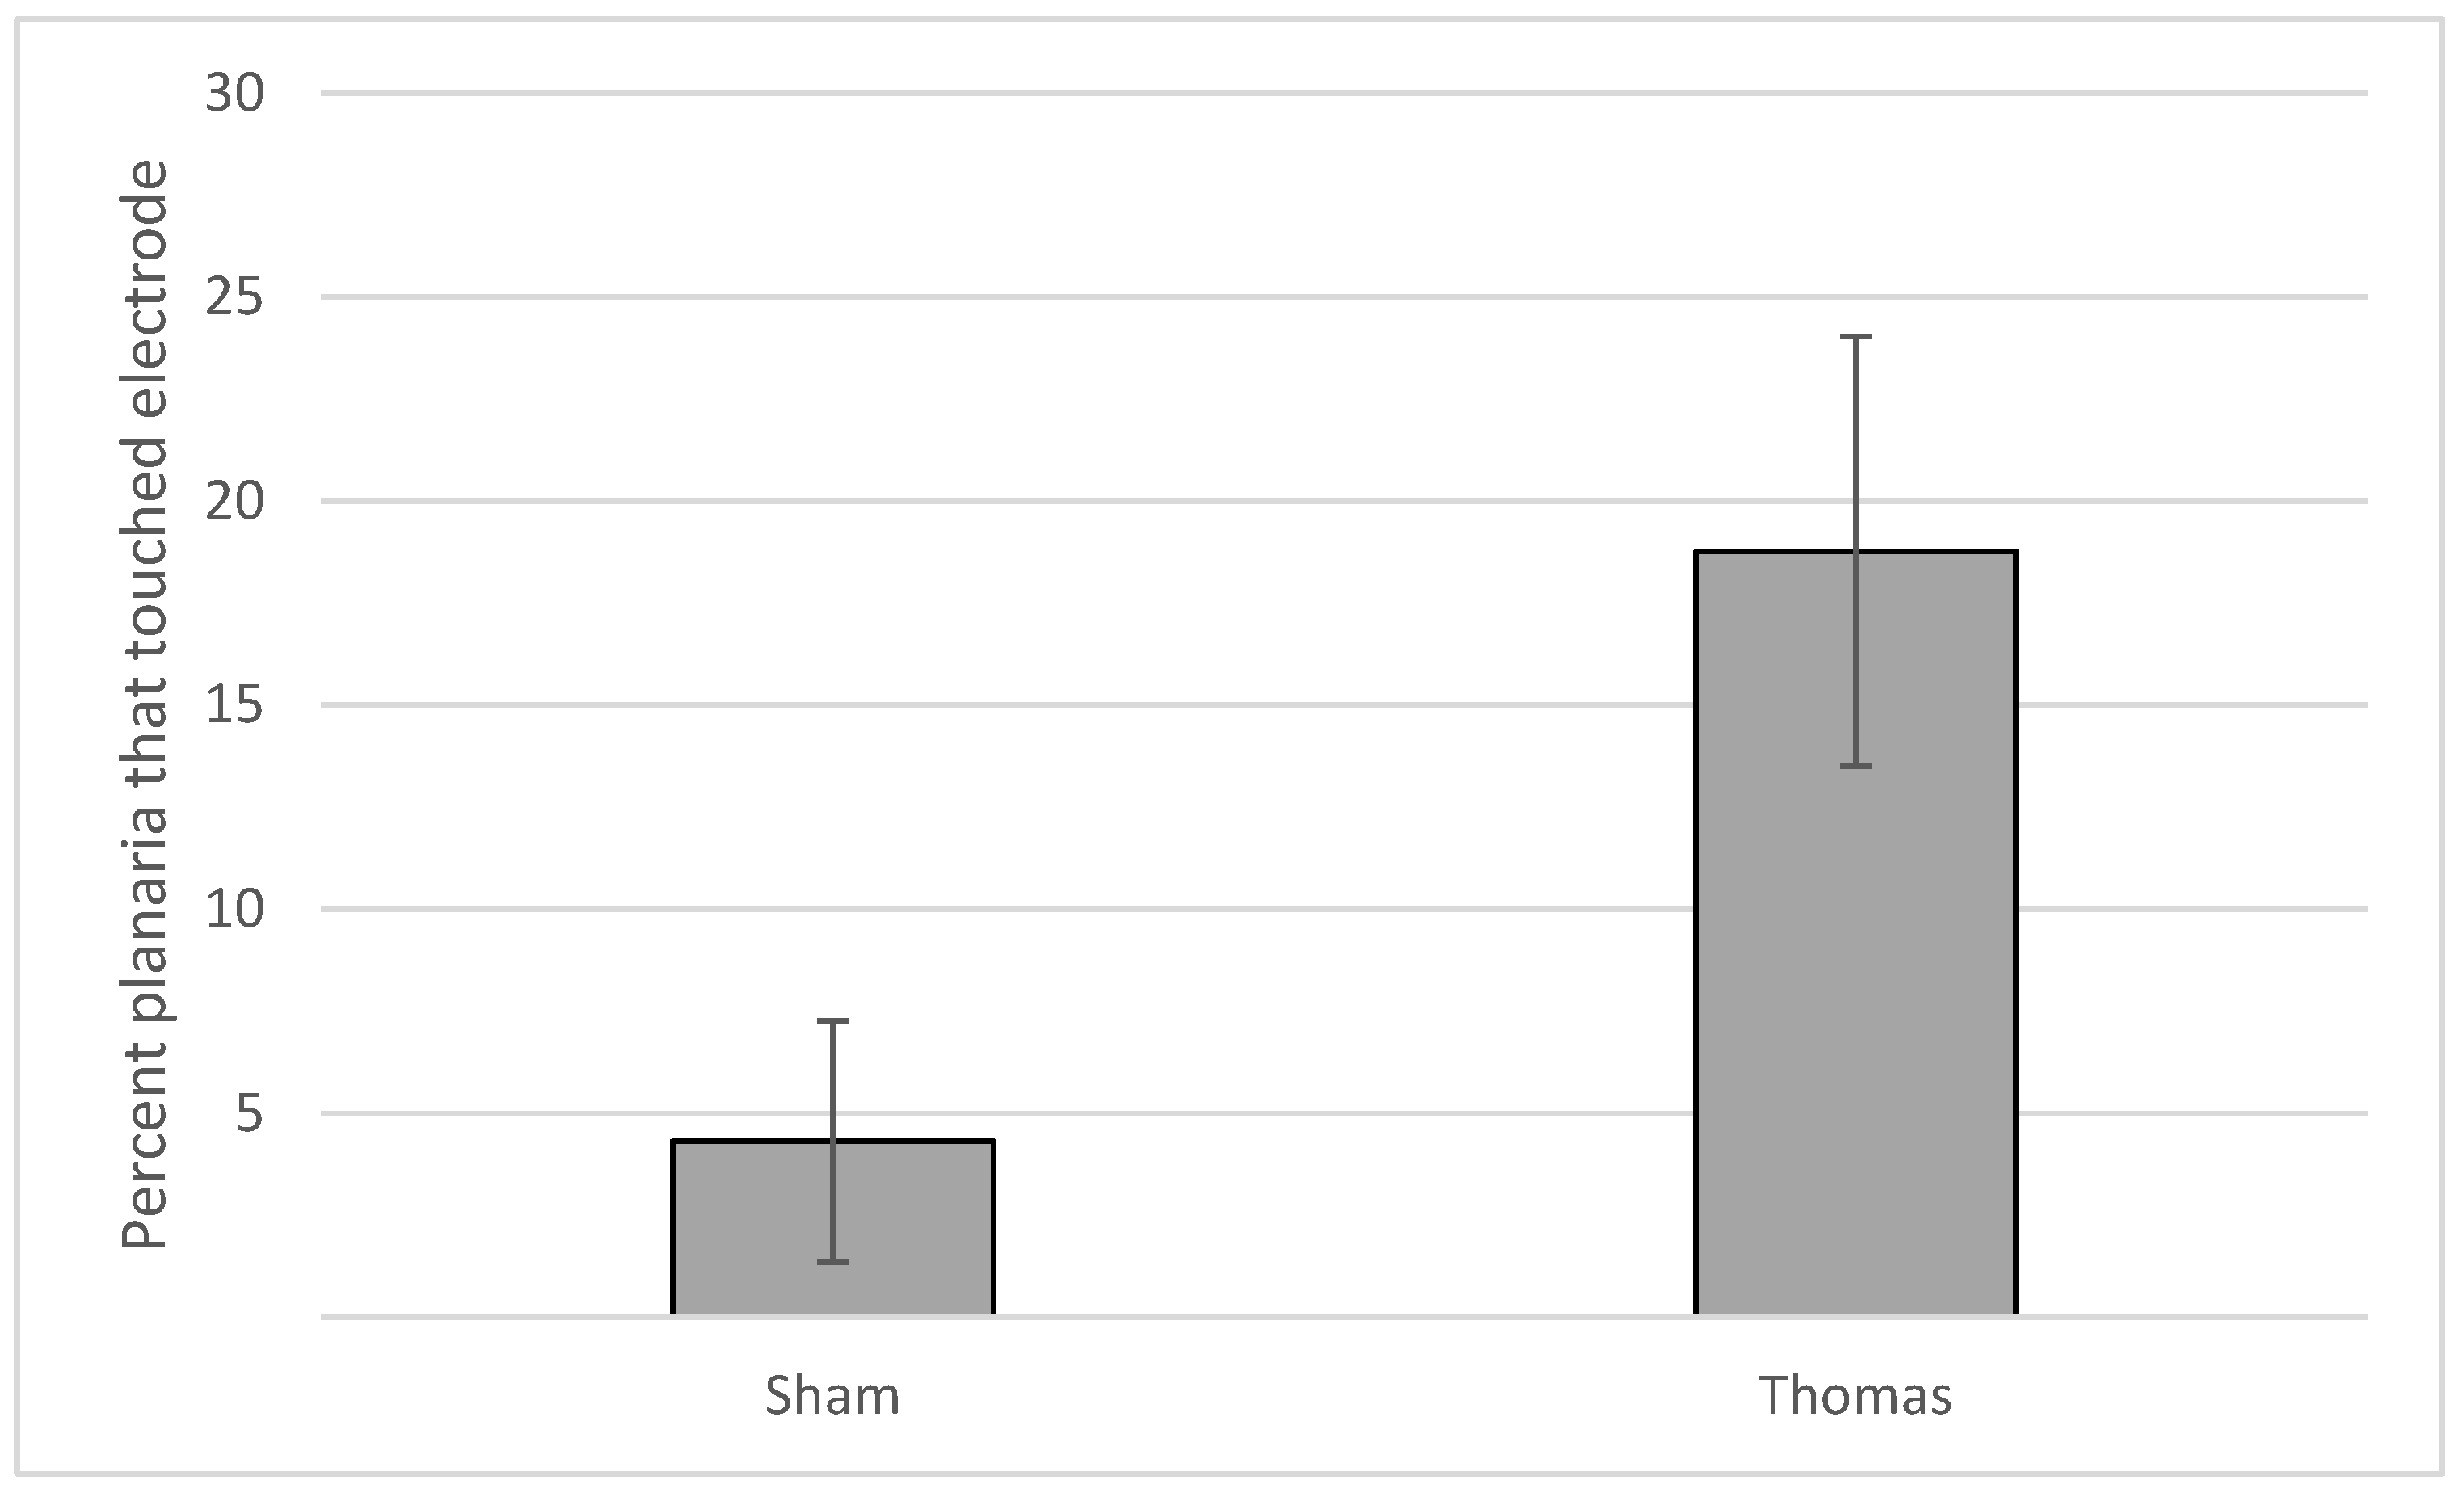
| Percent that touched an electrode | 4.31 (2.97) | 18.8 (5.27) | F(1,35) = 5.67, p = 0.023; Ω2 = 0.14 | |
| Day | Sham | Thomas | Fischer r to z Score |
|---|---|---|---|
| −6 days | r = −0.132; rho = −0.156 | r = 0.476 *; rho = 0.653 * | z = −1.78; p = 0.075 |
| −5 days | r = −0.389; rho = −0.354 | r = 0.283; rho = 0.359 | - |
| −4 days | r = −0.373; rho = −0.304 | r = 0.465 *; rho = 0.449 | - |
| −3 days | r = −0.179; rho = −0.098 | r = 0.478 *; rho = 0.531 * | z = −1.92; p = 0.055 |
| −2 days | r = −0.334; rho = −0.181 | r = 0.151; rho = 0.156 | - |
| −1 day | r = −0.467; rho = −0.272 | r = 0.128; rho = 0.036 | - |
| Day 0 | r = −0.338; rho = −0.058 | r = 0.111; rho = 0.112 | - |
| +1 day | r = 0.170; rho = 0.313 | r = −0.008; rho = 0.042 | - |
| +2 days | r = 0.013; rho = 0.128 | r = −0.218; rho = −0.305 | - |
| +3 days | r = −0.175; rho = −0.137 | r = −0.386; rho = −0.400 | - |
| +4 days | r = −0.024; rho = 0.021 | r = −0.484 *; rho = −0.374 | - |
| +5 days | r = 0.188; rho = 0.196 | r = −0.380; rho = −0.352 | - |
| +6 days | r = 0.060; rho = 0.070 | r = −0.474 *; rho = −0.235 | - |
| Day | Sham | Thomas | Fischer r to z Score |
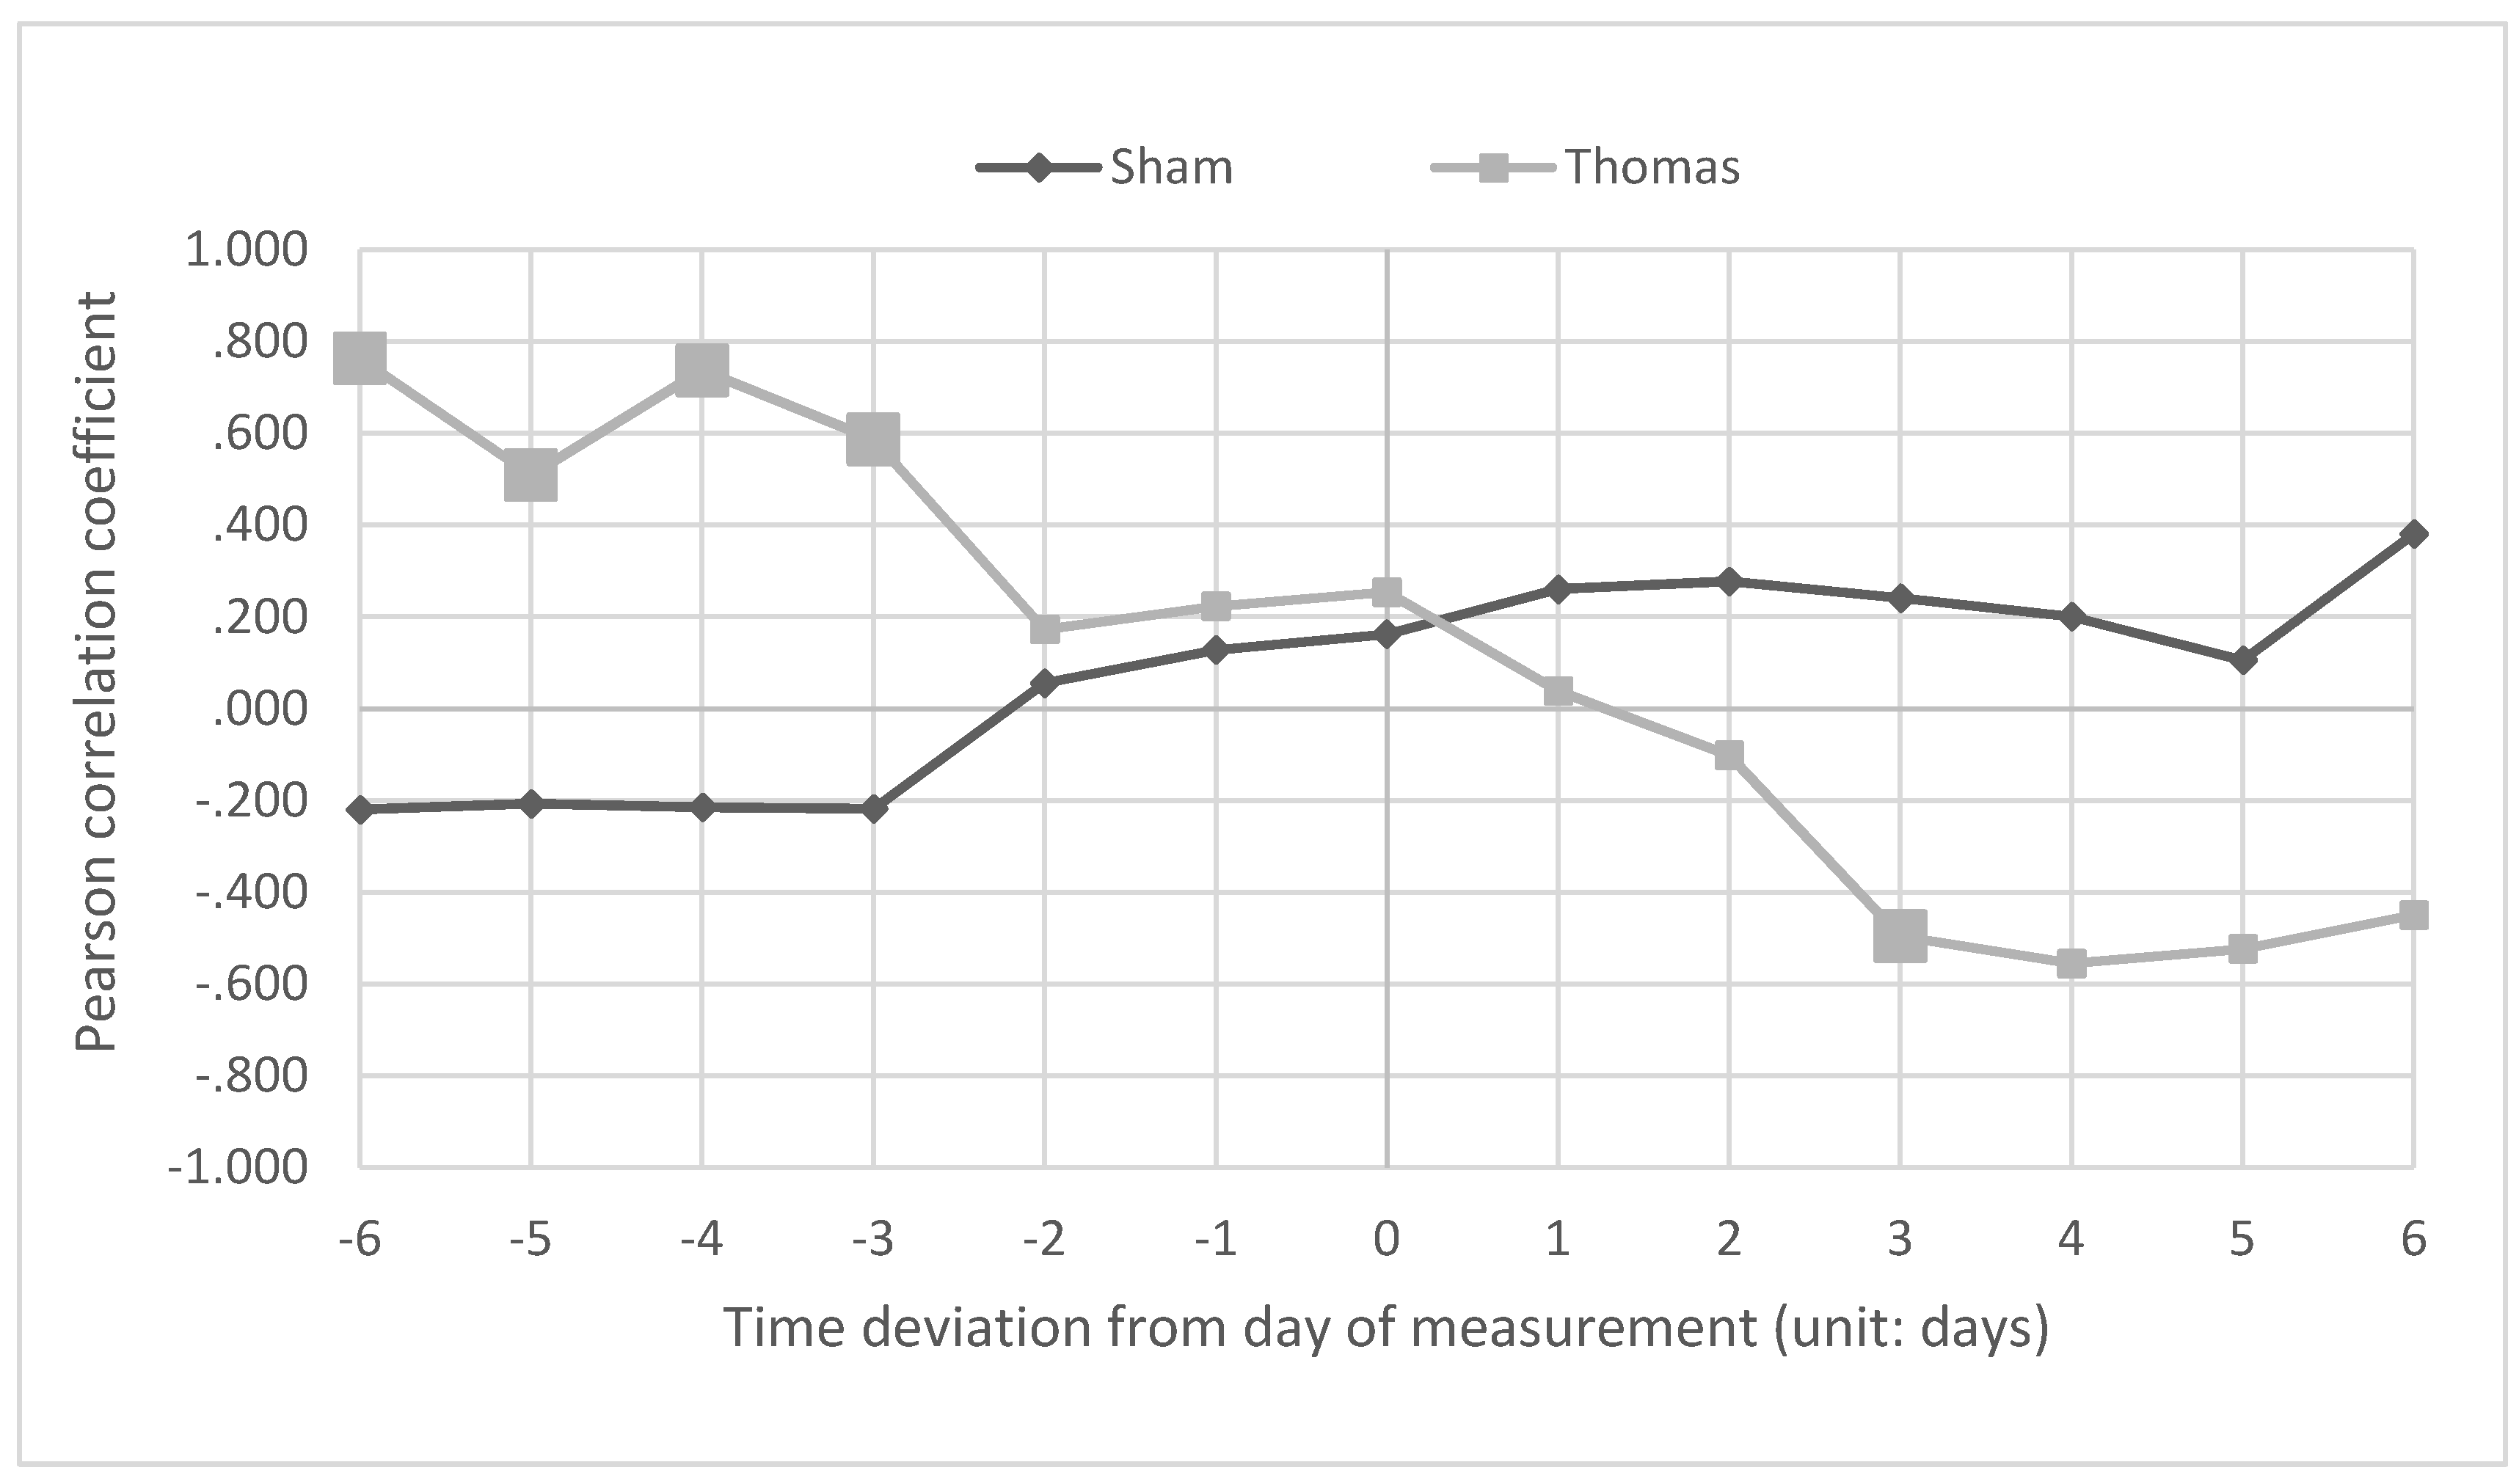
| −6 days | r = −0.220; rho = −0.314 | r = 0.763 **; rho = 0.692 * | z = −3.35, p < 0.001 |
| −5 days | r = −0.208; rho = −0.201 | r = 0.509 *; rho = 0.461 * | z = −2.11, p = 0.035 |
| −4 days | r = −0.215; rho = −0.154 | r = 0.737 **; rho = 0.561 * | z = −3.18, p = 0.002 |
| −3 days | r = −0.218; rho = −0.137 | r = 0.587 *; rho = 0.556 * | z = −2.44, p = 0.015 |
| −2 days | r = 0.055; rho = 0.085 | r = 0.173; rho = 0.250 | - |
| −1 day | r = 0.128; rho = −0.022 | r = 0.223; rho = 0.225 | - |
| Day 0 | r = 0.162; rho = 0.034 | r = 0.254; rho = 0.324 | - |
| +1 day | r = 0.260; rho = 0.098 | r = 0.039; rho = 0.048 | - |
| +2 days | r = 0.277; rho = 0.192 | r = −0.101; rho = −0.356 | - |
| +3 days | r = 0.241; rho = 0.195 | r = −0.495 *; rho = −0.529 * | z = 2.15, p = 0.032 |
| +4 days | r = 0.200; rho = 0.322 | r = −0.555 *; rho = −0.428 | - |
| +5 days | r = 0.106; rho = 0.270 | r = −0.523 *; rho = −0.486 * | z = 1.88, p = 0.060 |
| +6 days | r = 0.380; rho = 0.435 | r = −0.450; rho = −0.288 | - |
© 2020 by the authors. Licensee MDPI, Basel, Switzerland. This article is an open access article distributed under the terms and conditions of the Creative Commons Attribution (CC BY) license (http://creativecommons.org/licenses/by/4.0/).
Share and Cite
Hossack, V.; Persinger, M.; Dotta, B. Sensitivity of Planaria to Weak, Patterned Electric Current and the Subsequent Correlative Interactions with Fluctuations in the Intensity of the Magnetic Field of Earth. J 2020, 3, 79-89. https://doi.org/10.3390/j3010008
Hossack V, Persinger M, Dotta B. Sensitivity of Planaria to Weak, Patterned Electric Current and the Subsequent Correlative Interactions with Fluctuations in the Intensity of the Magnetic Field of Earth. J. 2020; 3(1):79-89. https://doi.org/10.3390/j3010008
Chicago/Turabian StyleHossack, Victoria, Michael Persinger, and Blake Dotta. 2020. "Sensitivity of Planaria to Weak, Patterned Electric Current and the Subsequent Correlative Interactions with Fluctuations in the Intensity of the Magnetic Field of Earth" J 3, no. 1: 79-89. https://doi.org/10.3390/j3010008
APA StyleHossack, V., Persinger, M., & Dotta, B. (2020). Sensitivity of Planaria to Weak, Patterned Electric Current and the Subsequent Correlative Interactions with Fluctuations in the Intensity of the Magnetic Field of Earth. J, 3(1), 79-89. https://doi.org/10.3390/j3010008