Article

Rural and Urban Population Differences in the Association of Dietary Calcium with Blood Pressure and Hypertension Occurrence: Analysis of Longitudinal Data from the China Health and Nutrition Survey

by
Victorine-Raïssa Ngo Nkondjock
1,*,
Ying Li
1,*,
Cheteu Wabo Thérèse Martin
1 and
Alariqi Reem
2
1
Department of Nutrition and Food Hygiene, the National Key Discipline, School of Public Health, Harbin Medical University, 157 Baojian Road, Harbin 150081, China
2
Department of Pathogenbiology, the National Key Discipline, School of Basic Medical Sciences, Harbin Medical University, 157 Baojian Road, Harbin 150081, China
*
Authors to whom correspondence should be addressed.
J 2020, 3(1), 90-99; https://doi.org/10.3390/j3010009
Submission received: 23 January 2020 / Revised: 24 February 2020 / Accepted: 26 February 2020 / Published: 5 March 2020

Abstract

:
The relationship of dietary calcium intake (DCI) to blood pressure (BP) and hypertension occurrence (HTN) in the general population is controversial. Few studies have reported the impact of DCI on high blood pressure (HBP) and HTN in rural and urban populations (RPs and UPs, respectively). In this study, we assessed how DCI is related to BP and HTN among the RP and the UP. This retrospective study used data from the Chinese Health and Nutrition Survey (CHNS) for 2000–2009. We analyzed 12,052 records from 3013 participants using path analysis and logistic regressions. DCI and HTN were significantly higher in the UP compared to the RP. When UPs and RPs were analyzed together, a 1 unit increase in DCI decreased systolic blood pressure (SBP) by 0.01 (p = 0.002) but had no effect on diastolic blood pressure. Males vs. females from the RP presented significant risk of HTN by the high DCI (OR = 2.3 (1.6–3.6)). DCI and its association with BP varied based on living environment and sex.

1. Introduction

Hypertension, which is indicated through blood pressure, is a leading risk factor for cardiovascular disease, causing almost half of the deaths from cardiovascular disease [1,2]. The effects of ingested calcium on hypertension occurrence are controversial, whereas disease burden among populations differs for different races and locations, and chronic disease unequally affects populations [3,4,5,6,7,8,9]. Calcium is a macronutrient needed from birth to old age [10,11]. Its consumption in reasonable quantities is therefore recommended (800–1000 mg daily on average for men and women aged from 19 to 70) [12,13], and is emphasized for the elderly to guarantee their health and improve their bone health [14,15,16].
Strong substantiations on molecules, animals and humans is based on the association between calcium consumption and the occurrence of cardiovascular disease. A clinical trial in rats has shown that sensitization of basal and active calcium has a mediating effect on genetic and induced hypertension [17]. This study suggests a probable association between ingested calcium and hypertension. Additionally, several systematic reviews have revealed that dietary calcium has an effect on the central blood pressure control system [18]. An association between calcium supplementation and a significant decrease in mean systolic blood pressure of 2.5 mm Hg (95% CI, −4.5 to −0.6) in patients with hypertension was demonstrated in a Cochrane review of 13 randomized controlled trials with a sample of 485 participants [19]. An epidemiological study showed that the dietary calcium intake reduced mean systolic and diastolic blood pressure of 1.53 mmHg (95% confidence interval: −2.84 to −0.21) and 1.83 mmHg (95% confidence interval: −3.49 to −0.19), respectively, in children with calcium intake below the recommendations range [20].
In addition, observational studies have established that low calcium intake is associated with a risk of cardiovascular disease [21]. In the above-mentioned Cochrane study, there was no alteration effect of the calcium supplementation on the diastolic blood pressure [19]. A recent cohort study conducted in Chinese populations indicated inconclusive results on the consumption of calcium related to blood pressure or the risk of hypertension [22]. A prospective cohort study in 28,886 middle-aged and older women by Wang and colleagues showed a lower rate of hypertension in participants with high calcium consumption (1679 mg/day) (RR 1.12, 95% CI 1.05–1.20), while participants over 45 years of age with low calcium consumption (<558 mg/day) had a higher rate of hypertension [23]. In a city–rural cohort study of participants of the Korean Genome and Epidemiology study, Daily et al. found that low calcium intake was significantly associated with higher risk of increase blood pressure in participants with the ATP2B1 rs17249754 dominant alleles [24]. This study prompts the exploration of calcium consumption in rural and urban areas, areas with often different lifestyles.
The difference in lifestyles in urban and rural areas differs, reflecting the health profile in the two areas. As a conclusion of a review on physical activity in rural and urban areas of Poland, the authors pointed out that emphasis should be placed on the promotion of health and especially on the provision of sports facilities in rural areas [25]. A cross-sectional study conducted in India relates the difference in the amount of calcium consumed in rural and urban areas. The amount was lower in rural areas, which was associated with poorer bone health quality in these areas [26]. A cross-sectional study using data from the Prospective Urban Rural Epidemiology (PURE)-China study showed that the trend of people without cardiovascular disease along with healthy lifestyle habits was found in rural areas compared to urban areas [27].
The association between the dietary calcium intake (DCI), blood pressure, and hypertension in general populations has been addressed by several studies, with sparse focus on the association with population characteristics. As such, we aimed to evaluate the association between DCI, blood pressure, and hypertension within rural and urban populations using panel data.

2. Materials and Methods

2.1. Study Population

We based our study on longitudinal data collected as part of the China Health and Nutrition Survey (CHNS), the validity and authenticity details of which are available online [28]. The CHNS started in 1989 with its most recent follow-up in 2015. The CHNS study population presents a set of several related demographic, socio-economic, health, and nutritional characteristics. The individuals participating in the survey are from provinces and autonomous cities of China. Sampling in each province was done in several stages by random clustering followed by stratification by low, middle, or high income of participants. A weighted sampling system was used to randomly select four counties in each province. Villages and townships in the counties and urban and suburban neighborhoods in the cities were randomly selected. The CHNS considers 4400 households, or about 19,000 individuals. Follow-up is done annually for each participant, but migration from one community to another is considered as a drop-out. In our population, all included participants presented available records on blood pressure, dietary calcium intake, and hypertension status on at least 2 survey years. Excluding all participants who reported either pregnancy, cancer, calcium supplementation intake, or blood pressure lowering medications, we ended-up with 12,052 consecutive records from 3013 participants. Our study baseline survey year was 2000, and the last follow-up survey year was 2009; there was no drop-out recorded in our 4 surveys.

2.2. Outcome Variables

2.2.1. Hypertension Occurrence

Hypertension was defined as having been diagnosed with high blood pressure at least once. The participants themselves reported their previous diagnosis of high blood pressure.

2.2.2. Blood Pressure

Blood pressure was collected at each data collection point of the survey years. At each collection point, blood pressure was measured 3 times for each participant. In the present study, the blood pressure values resulted from the arithmetical mean of three blood pressure values. The blood pressure was expressed in mmHg. All participants with reported traditional, spiritual, or modern blood pressure lowering medications were not included in our analysis.

2.3. DCI

The DCI values used results from the average of 3 daily values. For each survey, all other dietary components along with the dietary calcium ingested were measured from a 24-h dietary individual recall three consecutive times. For three consecutive days, each family member, regardless of age, independently reported his or her food intake. Individual records were collected in households by well-trained interviewers who passed a test prior to data collection [29]. At each point of the data collection, the latest version available of the food composition table (FCT) for China served for the nutrient values estimations. The DCI in the analysis was assessed both as a continuous variable and a categorical variable (quartiles).

2.4. Covariates

The following covariates were used in our analysis: Age was categorized into <30, 30–50, 51–70, or >70 years; sex was categorized into female or male; frequency of alcohol consumption was categorized into non-drinkers, 1–4 times per week, or 5 or more times per week; smoking status was categorized into nonsmoker or smoker. Participants’ weights and heights were assessed using body mass index (BMI), calculated as weight (kg)/height (m2). Physical activity was determined from a self-reported 7-day physical activity recall defined as metabolic equivalent (MET), corresponding to the hours spent per week in leisure time and all physical activities such as gymnastics, track-and-field sports, ball sports, swimming, dancing, and other sports. Systolic and diastolic blood pressures were assessed as the mean of three measurements. Energy intake was expressed in kilocalories per day (kcal/day) and was assessed following the China Food Composition, the details of which are available online [30].
The missing values, when existing in covariates, were less than the acceptable percentage of 10 percent [31].

2.5. Statistical Analysis

In order to adjust the skewness of the distribution, metric variables (physical activity, DCI, BMI, systolic blood pressure (SBP), and diastolic blood pressure (DBP)) were log-transformed before their use in the analysis.
The Kruskal–Wallis H test was used to compare the DCI and the hypertension occurrence between the urban population (UP) and the rural population (RP). This comparison was done though the estimation of the mean ranks’ chi square on the DCI and on the hypertension occurrence across all survey years.
Path analysis was used to evaluate the effect of DCI on the blood pressure in the general population, regardless of their living location (rural or urban). For this analysis, we drew a path diagram where DCI predicted the SBP; we used 3 confounder categories that we related to the DCI and the SBP, and we considered energy intake and physical activity as occasional confounders, BMI as a past confounder, and diastolic blood pressure as a co-movement confounder. The model specification included physical activity, dietary calcium, and energy intake as endogenous variables and BMI, SBP, and DBP as exogenous variables. The use of the path analysis permitted us to estimate the p-value of the association between the DCI and the SBP while controlling for the effects of the confounders by specifying the relationship among the independent variables.
We used generalized binary logistic regression to determine odd ratios and 95% CI of the hypertension risk associated with the DCI in two purposes. Firstly, we analyzed how DCI could predict the occurrence of hypertension according to their locations, and secondly, we performed a deeper analysis according to the participants’ sex.
We used SPSS 24 (IBM Corp., Armonk, NY, USA) and R 1.2. 1335 (R Core Team, Vienna, Austria) for data analysis. Data used for the present study analysis are available online, under the following: doi:10.21227/yff3-hj04.

3. Results

3.1. Variable Characteristics

Table 1 lists the variable characteristics by living location at our study baseline survey year (2000) and follow-up (2009). Participants living in rural areas were higher in number compared to participants living in urban areas. The UP had higher means in age, smoking percentage, SBP and DBP, DCI, and diagnosed high blood pressure. A higher percentage of people had low physical activity hours in the UP.

3.2. Hypertension Prevalence and DCI in Both the RP and the UP

Table 2 shows the results of the Kruskal–Wallis H test performed to analyze the prevalence of hypertension and the DCI in the RP and the UP over the survey years. In all years, hypertension occurrence and DCI mean ranks were significantly lower in the RP compared to the UP. For the hypertension occurrence, the mean rank at the baseline and follow-up was, respectively, 1480.9 in the RP versus 1570.6, (χ2 = 31.6, p-value < 0.001), and 1467.6 in the RP versus 1603.1, (χ2 = 34.3, p-value < 0.001).

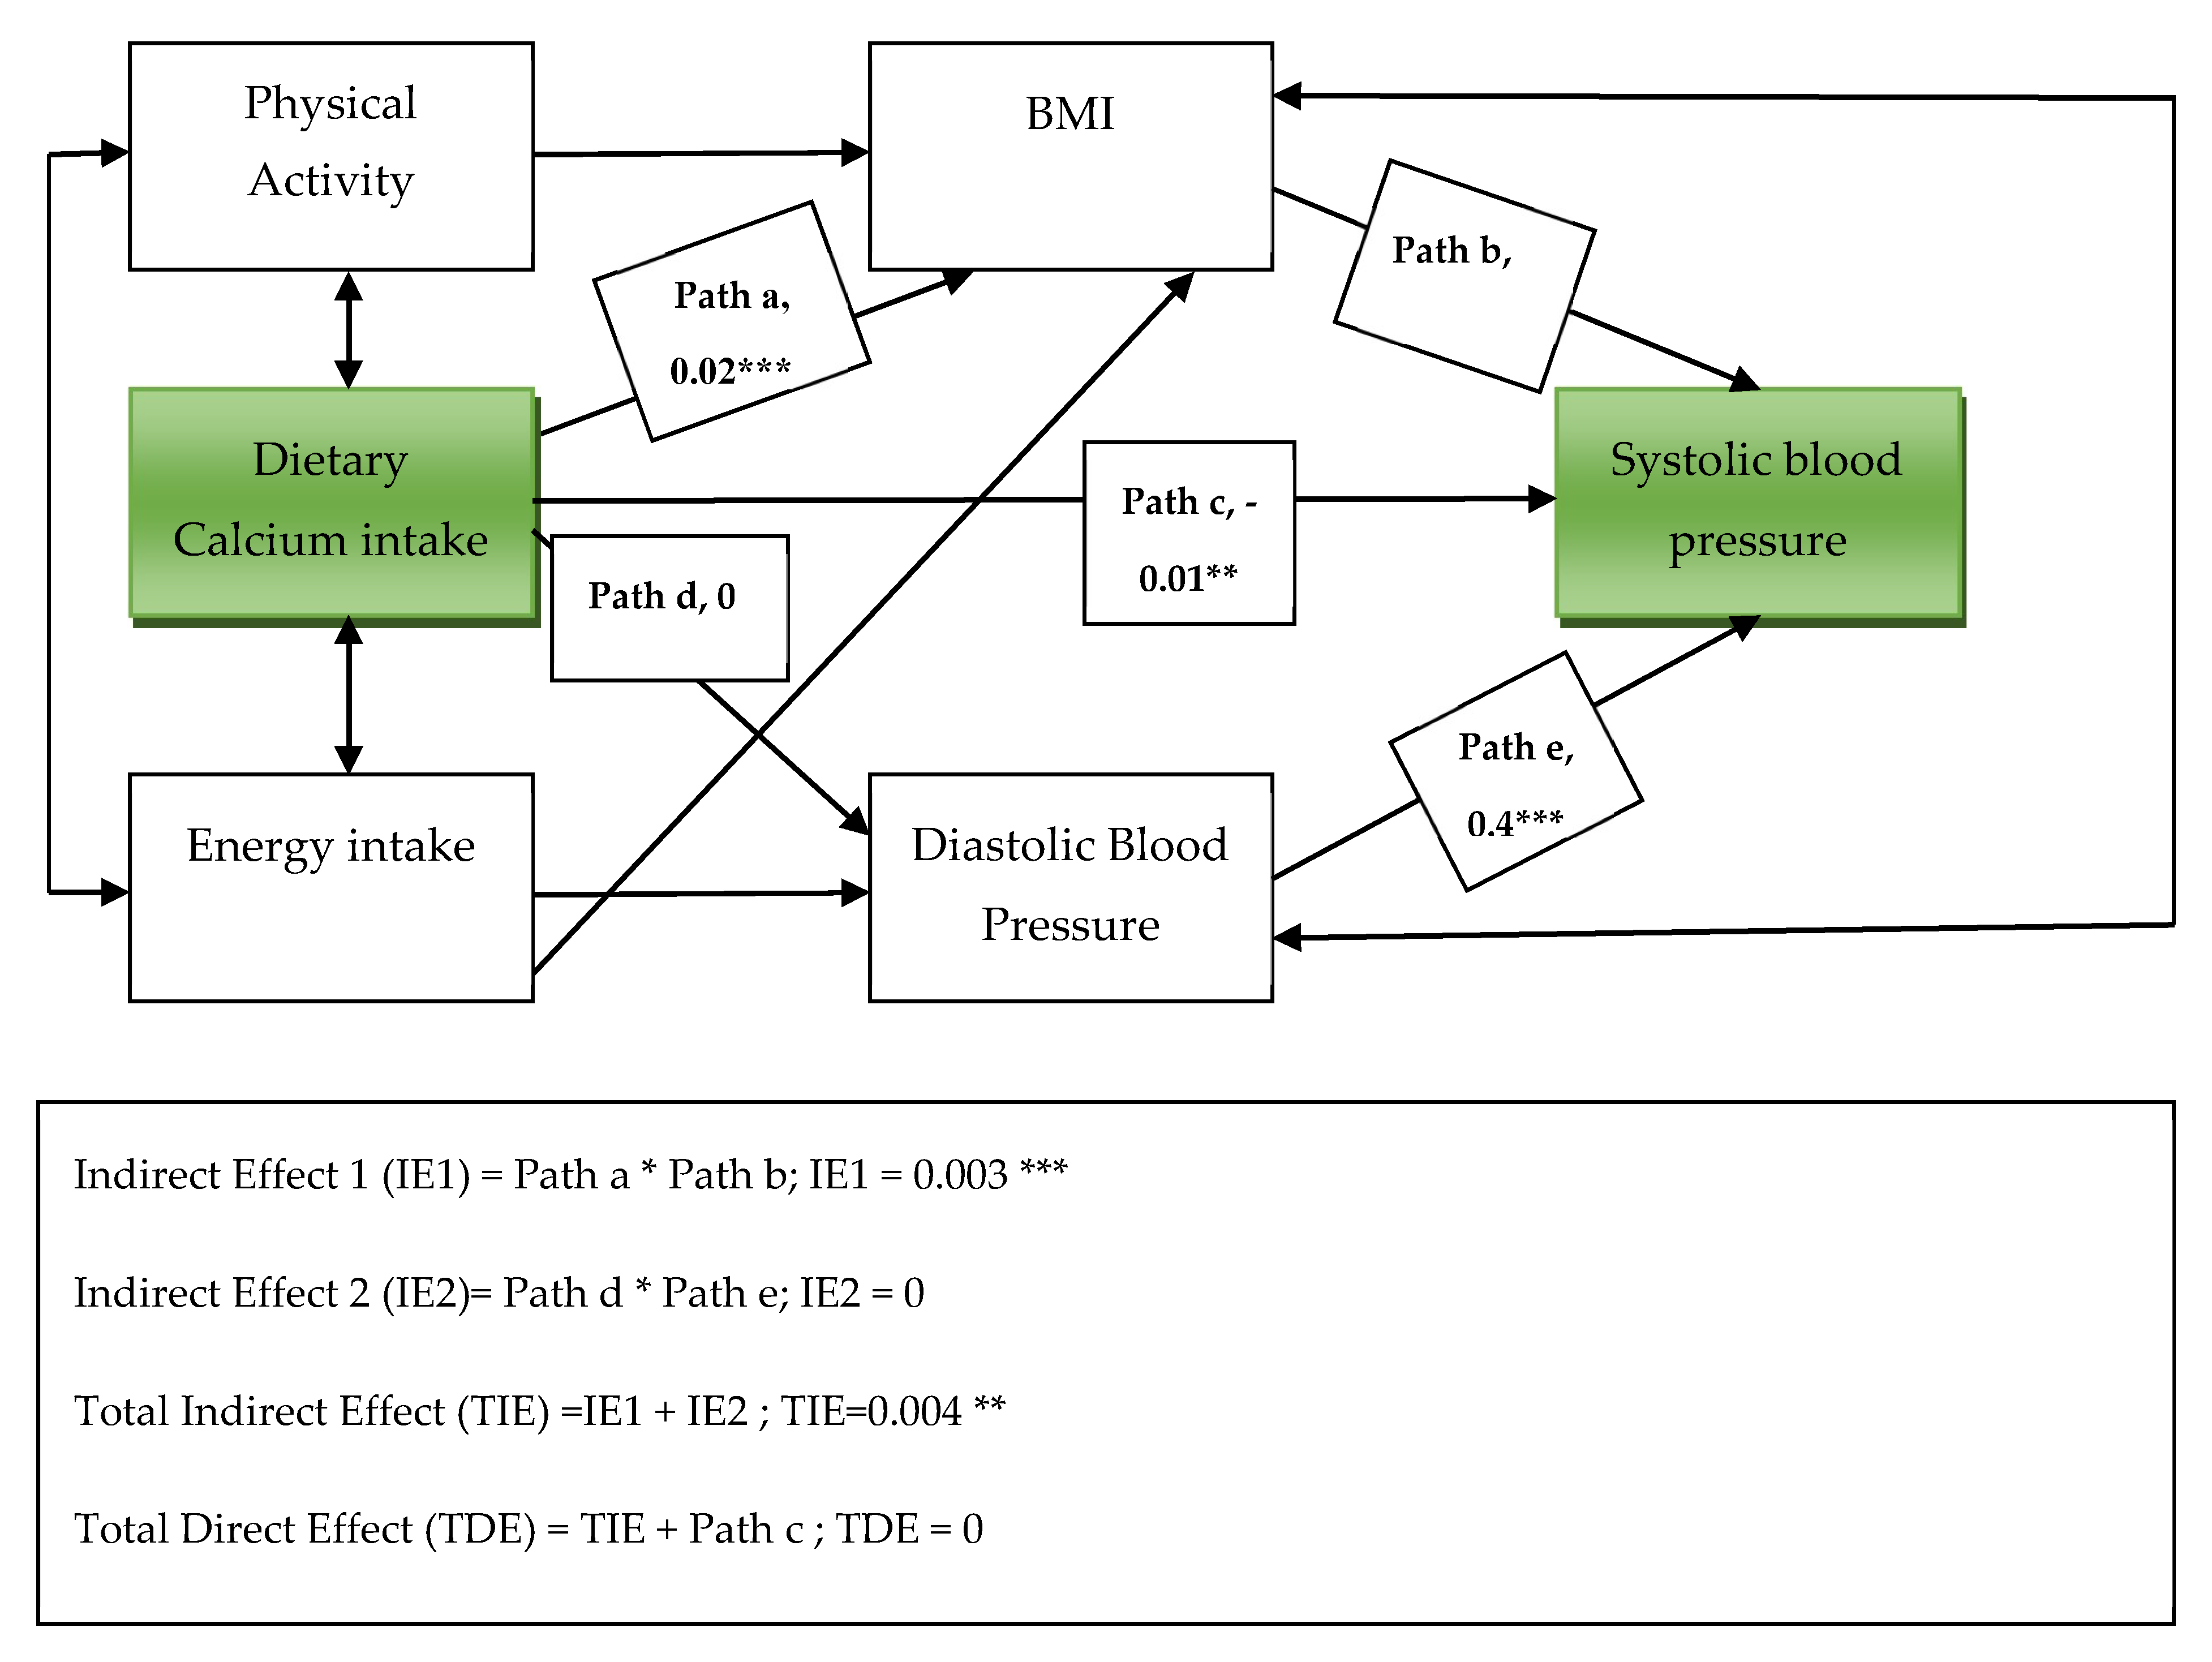
3.3. Association between DCI and Blood Pressure in the General Population

We analyzed the relationship between DCI and SBP in a cross-path model among all participants (Figure 1). We found that DCI was inversely correlated with SBP but had no effect on DBP; the estimate path coefficients were β3 = −0.01 (p = 0.002) and β4 = 0, respectively. However, we found a non-significant total direct effect in our model; significance was observed in the total indirect effects. Similar significance in direct and indirect effects was found when building the model separately in the UP and RP; hence, we present the global results. The analysis results infer an inverse association between DCI and SBP in both populations assessed together.

3.4. Association between DCI and HTN

3.4.1. Association between DCI and HTN among the RP and the UP

We performed a binary logistic regression to analyze the occurrence of hypertension according to the DCI in the RP and UP. Quartiles of the DCI served to organize four categories of the CDI. A significant association between hypertension occurrence and dietary calcium was found only in the UP. Table 3 provides the outputs of the analysis by the RP and UP.

3.4.2. Dietary Calcium Intake and HTN in the Populations by Sex

Binary logistic regression was carried out to analyze the association between the hypertension occurrence (HTN) and the DCI by sex. DCI was assessed into their quartiles with the first quartiles as reference across the UP and RP. Quartiles of DCI were calculated separately in the different groups. In the female groups, there was a significant association between the DCI and the HTN only in the UP; the multivariate analysis showed a greater risk in higher quartiles of DCI (OR = 1.9, 95% CI = (1.2–2.8). In the male groups, significant risks were found across both rural and urban populations. However, in the UP’s male group, only the highest quartile compared to lower quartiles, presented the HTN risk (OR = 2.3, 95% CI = (1.5–3.5)) (Table 4).

4. Discussion

In this study, we conducted an analysis of panel data on middle-aged adults and elderly people living in rural and urban areas in China. We found that DCI and SBP were inversely correlated in the overall population, while the association between DCI and HTN was different by location, and then by sex, after adjusting for age, physical activity, and smoking status. Dietary calcium was found to significantly predict hypertension occurrence in the UP, which was unlikely in the RP. However, a more sex-specific analysis showed that sex influences the prediction of hypertension through dietary calcium intake.
DCI was demonstrated in previous cohort studies in general populations to be inversely correlated with blood pressure [23,32]. Jayedi and Zargar [33], in a meta-analysis of eight prospective studies on DCI, showed that higher calcium intake (with a study considering calcium supplement intake) was inversely correlated with hypertension risk; in the same study, they found that dietary calcium, assessed separately without including calcium supplement intake and other hypertensive-related minerals, was still inversely associated with hypertension risk. The Tromsø study examined the use of serum parathyroid hormone levels to predict heart coronary disease and hypertension of 27,159 participants in Norway, and the findings suggest that low calcium intake could increase blood pressure through the parathyroid serum hormone [34]. The present study findings, combined with the above-cited studies, indicate an inverse relationship between dietary low calcium intake and SBP. However, this association differed in both populations. No such outcome was found in the UP, and we found a positive correlation between DCI and DBP in a lower quintile in the UP.
Michaëlsson et al. reported that DCI is positively associated with hypertension and cardiovascular disease risk [35]. Here, we found an increased hypertension risk in the UP; however, we observed no significant associations in the RP. Similarly, Ziqi et al. found no significant association between DCI and hypertension in Chinese adults [22]. In our rural group, we identified a non-conclusive association of hypertension occurrence and DCI. Nonetheless, implication of the sex in the analysis showed a hypertension risk-associated in male from the RP. The following paragraph discusses the disparities found in both rural and urban populations according to the results.
We found that the burden of hypertension was different for the different groups. Hypertension occurrence was higher in the UP for all survey years, and this prevalence was significantly associated with DCI. Dastan et al. studied hypertension risk factor differences in rural and urban populations in 16,227 Turkish adults [36] and found urban living to be a risk factor for hypertension occurrence, with an odds ratio of 1.24 for men and 1.20 for women.
Beyond the disparities observed in terms of living environments, gender has shown a characteristic influence in the prediction of hypertension through dietary calcium consumption. This finding is consistent with Waib et al. who suggested in their studies that men and women have different prevalences in terms of hypertension induced by dietary calcium consumption; this was linked to nutritional parameters observed in both males and females [37]. Indeed, in our study, DCI was unrelated to the occurrence of hypertension in the RP, up to the sex-based analyses. The group of men living in rural areas with high DCI had a higher risk of hypertension than men with lower DCI. In the group of men living in urban areas, only the people with the highest dietary calcium consumption were at risk of hypertension. In the group of women, we had different observations; in women living in rural areas, there was no demonstrated risk of hypertension, regardless of the amount of calcium consumed. The disparities in the disease between population locations are attributed to everyday lifestyle, including food consumption. Wang et al. [38] assessed the differences in nutrient intake between urban and rural populations in a northeastern region in China, where they found a higher intake of energy and carbohydrates. Similarly, Roberts et al. examined tobacco use in the RP and the UP in the United States as a factor causing health disparities among both populations; they found a higher use of tobacco in rural compared to urban populations [39]. The literature indicates that many more lifestyle differences may be related to health disparities in rural and urban populations [40,41,42].
Our study presents the following strengths: We used data from the CHNS, with its potential to capture in time and space a population with plural characteristics [43]. We were able to examine the association between calcium and the occurrence of hypertension in populations with different lifestyle characteristics. In this study we were able to examine the association between calcium and blood pressure in the theoretical path analysis model, controlling for confounding factors in a directional manner. However, we want to specify possible limitations to our study. Data collection on the DCI was done through 24-h recall, which is based on memory recalls; 24-h recall could lead to information omitted by the participants at the time of data collection. The results of this study need to be validated in other studies using up-to-date methods like the National Cancer Institute (NCI) method. In our population, some participants did not present the totality of information regarding blood pressure over the four years of the study. In the present study, we identified a remarkable difference between the RP and UP, which was driven by sex. Among other characteristics, we found a higher prevalence of smoking status, sedentary lifestyle, and a higher DCI in the UP compared the RP. This suggests that the lifestyle differences might influence the hypertension occurrence disparity according to the DCI. Further studies could focus on how population lifestyle mediates the association between dietary calcium and blood pressure and hypertension occurrence. A better knowledge of how hypertension affects the population is key to the prevention of this significant cause of mortality around the world.

Author Contributions

Conceptualization, Y.L. and V.-R.N.N.; Methodology, V.-R.N.N.; Validation, Y.L. and V.-R.N.N.; Formal Analysis, V.-R.N.N.; Investigation, V.-R.N.N.; Data Curation, V.-R.N.N. and C.W.T.M.; Writing—Original Draft Preparation, V.-R.N.N.; Writing—Review and Editing, V.-R.N.N. and A.R.; Visualization, V.-R.N.N.; Supervision, Y.L.; Project Administration, Y.L.; Funding Acquisition, V.-R.N.N., C.W.T.M, and A.R. All authors have read and agreed to the published version of the manuscript.

Funding

This research received no external funding.

Acknowledgments

This research uses data from the China Health and Nutrition Survey (CHNS). We thank the National Institute of Nutrition and Food Safety, China Center for Disease Control and Prevention, Carolina Population Center, the University of North Carolina at Chapel Hill, the NIH (R01-HD30880, DK056350, and R01-HD38700), and the Fogarty International Center, NIH for financial support for the CHNS data collection and analysis files from 1989 to 2006 and both parties plus the China-Japan Friendship Hospital, Ministry of Health for support for CHNS 2009 and future surveys.

Conflicts of Interest

The authors declare no conflict of interest.

References

  1. O’Connell, S. Assessing and managing primary hypertension. Nurs. Times 2014, 110, 1–14. [Google Scholar]
  2. Castro, I.; Waclawovsky, G.; Marcadenti, A. Nutrition and physical activity on hypertension: Implication of current evidence and guidelines. Curr. Hypertens. Rev. 2015, 11, 91–99. [Google Scholar] [CrossRef]
  3. Osman, S.; Costanian, C.; Annan, N.B.; Fouad, F.M.; Jaffa, M.; Sibai, A.M. Urbanization and Socioeconomic Disparities in Hypertension among Older Adult Women in Sudan. Ann. Glob. Health 2019, 85, 29. [Google Scholar] [CrossRef] [PubMed] [Green Version]
  4. Bâ, H.O.; Camara, Y.; Menta, I.; Sangaré, I.; Sidibé, N.; Diall, I.B.; Coulibaly, S.; Kéita, M.A.; Millogo, G.R.C. Hypertension and Associated Factors in Rural and Urban Areas Mali: Data from the STEP 2013 Survey. Int. J. Hypertens. 2018, 2018, 1–7. [Google Scholar] [CrossRef] [PubMed] [Green Version]
  5. Mills, K.T.; Bundy, J.D.; Kelly, T.N.; Reed, J.E.; Kearney, P.M.; Reynolds, K.; Chen, J.; He, J. Global Disparities of Hypertension Prevalence and Control: A Systematic Analysis of Population-Based Studies From 90 Countries. Circulation 2016, 134, 441–450. [Google Scholar] [CrossRef] [PubMed]
  6. Egan, K.B.; Suh, M.; Rosen, R.C.; Burnett, A.L.; Ni, X.; Wong, D.G.; McVary, K.T. Rural vs. urban disparities in association with lower urinary tract symptoms and benign prostatic hyperplasia in ageing men, NHANES 2001–2008. Int. J. Clin. Pract. 2015, 69, 1316–1325. [Google Scholar] [CrossRef]
  7. Chow, C.K.; Teo, K.K.; Rangarajan, S.; Islam, S.; Gupta, R.; Avezum, A.; Bahonar, A.; Chifamba, J.; Dagenais, G.; Diaz, R.; et al. Prevalence, Awareness, Treatment, and Control of Hypertension in Rural and Urban Communities in High-, Middle-, and Low-Income Countries. JAMA 2013, 310, 959–968. [Google Scholar] [CrossRef] [Green Version]
  8. Downey, L.H. Rural Populations and Health: Determinants, Disparities, and Solutions. Prev. Chronic Dis. 2013, 10. [Google Scholar] [CrossRef] [Green Version]
  9. Darmawan, J.; Valkenburg, H.A.; Muirden, K.D.; Wigley, R.D. Epidemiology of rheumatic diseases in rural and urban populations in Indonesia: A World Health Organisation International League against Rheumatism COPCORD study, stage I, phase 2. Ann. Rheum. Dis. 1992, 51, 525–528. [Google Scholar] [CrossRef] [Green Version]
  10. Omidvar, N.; Tirang, R.N.; Hajifaraji, M.; Eshraghian, M.-R.; Rezazadeh, A.; Armin, S.; Haidari, H.; Zowghi, T.; Neyestani, T.R. Calcium Intake, Major Dietary Sources and Bone Health Indicators in Iranian Primary School Children. Iran. J. Pediatr. 2015, 25, e177. [Google Scholar] [CrossRef] [Green Version]
  11. Center, National Institutes of Health Osteoporosis and Related Bone Diseases National Resource. Calcium and Vitamin D: Importance at Every Age. National Institutes of Health Webpage. Available online: https://www.bones.nih.gov/sites/bones/files/pdfs/cal-vit-d-important-any-age-508.pdf. (accessed on 6 December 2019).
  12. Daily News for Senior Citizens. Senior Journal. Senior Citizens at High Risk of Bone Fractures May Find Safety Taking Vitamin D with Calcium. Available online: http://www.seniorjournal.com/NEWS/Health/2014/20140604 (accessed on 3 October 2019).
  13. Corleone, J. Live Well. Percentage of Daily Values Based on a 2000 Calorie Diet. Available online: https://livewell.jillianmichaels.com/percentage-daily-values-based-2000-calorie-diet-5401.html (accessed on 4 October 2019).
  14. Schrager, S. Dietary Calcium Intake and Obesity. J. Am. Board Fam. Pract. 2005, 18, 205–210. [Google Scholar] [CrossRef] [PubMed] [Green Version]
  15. Li, K.; Wang, X.-F.; Li, D.-Y.; Chen, Y.-C.; Zhao, L.-J.; Liu, X.-G.; Guo, Y.-F.; Shen, J.; Lin, X.; Deng, J.; et al. The good, the bad, and the ugly of calcium supplementation: A review of calcium intake on human health. Clin. Interv. Aging 2018, 13, 2443–2452. [Google Scholar] [CrossRef] [PubMed] [Green Version]
  16. Mayo Clinic Staff. Nutrition and Healthy Eating. Mayoclinic. Available online: https://www.mayoclinic.org/healthy-lifestyle/nutrition-and-healthy-eating/in-depth/calcium-supplements/art-20047097 (accessed on 12 December 2019).
  17. Behuliak, M.; Bencze, M.; Vaneckova, I.; Kunes, J.; Zicha, J. Basal and Activated Calcium Sensitization Mediated by RhoA/Rho Kinase Pathway in Rats with Genetic and Salt Hypertension. BioMed Res. Int. 2017, 2017, 1–13. [Google Scholar] [CrossRef] [PubMed] [Green Version]
  18. Pörsti, I.; Mäkynen, H. Dietary calcium intake: Effects on central blood pressure control. Semin. Nephrol. 1995, 15, 550–563. [Google Scholar]
  19. Dickinson, H.O.; Nicolson, N.; Cook, J.V.; Campbell, F.; Beyer, F.R.; Ford, G.A.; Mason, J.M. Calcium supplementation for the management of primary hypertension in adults. Cochrane Database Syst. Rev. 2006, 2, CD004639. [Google Scholar] [CrossRef]
  20. Magalhães, E.I.D.S.; Pessoa, M.C.; Franceschini, S.D.C.C.; De Novaes, J.F. Dietary calcium intake is inversely associated with blood pressure in Brazilian children. Int. J. Food Sci. Nutr. 2016, 68, 1–8. [Google Scholar] [CrossRef]
  21. Bostick, R.M.; Kushi, L.H.; Wu, Y.; Meyer, K.A.; Sellers, T.A.; Folsom, A.R. Relation of calcium, vitamin D, and dairy food intake to ischemic heart disease mortality among postmenopausal women. Am. J. Epidemiology 1999, 149, 151–161. [Google Scholar] [CrossRef] [Green Version]
  22. Liu, Z.; Fang, A.; He, J.; Shen, X.; Gao, R.; Zhao, X.; Li, K. Association of Habitually Low Intake of Dietary Calcium with Blood Pressure and Hypertension in a Population with Predominantly Plant-Based Diets. Nutr. 2018, 10, 603. [Google Scholar] [CrossRef] [Green Version]
  23. Wang, L.; Manson, J.E.; Buring, J.E.; Lee, I.-M.; Sesso, H.D. Dietary Intake of Dairy Products, Calcium, and Vitamin D and the Risk of Hypertension in Middle-Aged and Older Women. Hypertension 2008, 51, 1073–1079. [Google Scholar] [CrossRef]
  24. Daily, J.W.; Kim, B.C.; Liu, M.; Park, S. People with the major alleles of ATP2B1 rs17249754 increases the risk of hypertension in high ratio of sodium and potassium, and low calcium intakes. J. Hum. Hypertens. 2017, 31, 787–794. [Google Scholar] [CrossRef]
  25. Sygit, K.M.; Sygit, M.; Wojtyła, C.; Lubiniec, O.; Stelmach, W.; Krakowiak, J. Physical activity as an important element in organizing and managing the lifestyle of populations in urban and rural environments. Ann. Agric. Environ. Med. 2018, 26, 8–12. [Google Scholar] [CrossRef] [PubMed]
  26. Harinarayan, C.V.; Ramalakshmi, T.; Prasad, U.V.; Sudhakar, D.; Srinivasarao, P.V.; Sarma, K.V.; Kumar, E.G. High prevalence of low dietary calcium, high phytate consumption, and vitamin D deficiency in healthy south Indians. Am. J. Clin. Nutr. 2007, 85, 1062–1067. [Google Scholar] [CrossRef] [PubMed]
  27. Wang, C.; Li, W.; Yin, L.; Jian, B.; Peng, Y.G.; Wang, Y. Comparison of healthy lifestyle behaviors among individuals with and without cardiovascular diseases from urban and rural areas in China: A cross-sectional study. PLoS ONE 2017, 12, e0181981. [Google Scholar] [CrossRef] [PubMed] [Green Version]
  28. Zhang, B.; Zhai, F.Y.; Du, S.F.; Popkin, B.M. The China Health and Nutrition Survey, 1989-2011. Obes. Rev. 2014, 15, 2–7. [Google Scholar] [CrossRef] [Green Version]
  29. Fang, A.; Li, K.; Li, H.; Guo, M.; He, J.; Shen, X.; Song, J. Low Habitual Dietary Calcium and Linear Growth from Adolescence to Young Adulthood: Results from the China Health and Nutrition Survey. Sci. Rep. 2017, 7, 9111. [Google Scholar] [CrossRef]
  30. Ershow, A.G.; Wong-Chen, K. Chinese food composition tables. J. Food Compos. Anal. 1990, 3, 191–434. [Google Scholar] [CrossRef]
  31. Bennett, D.A. How can I deal with missing data in my study? Aust. N. Z. J. Public Health 2001, 25, 464–469. [Google Scholar] [CrossRef]
  32. Jorde, R.; Sundsfjord, J.; Haug, E.; Bønaa, K.H. Relation between low calcium intake, parathyroid hormone, and blood pressure. Hypertension 2000, 35, 1154–1159. [Google Scholar] [CrossRef] [Green Version]
  33. Jayedi, A.; Zargar, M.S. Dietary calcium intake and hypertension risk: A dose–response meta-analysis of prospective cohort studies. Eur. J. Clin. Nutr. 2018, 73, 969–978. [Google Scholar] [CrossRef]
  34. Kamycheva, E.; Sundsfjord, J.; Jorde, R. Serum parathyroid hormone levels predict coronary heart disease: The Tromsø Study. Eur. J. Cardiovasc. Prev. Rehabilitation 2004, 11, 69–74. [Google Scholar] [CrossRef]
  35. Michaelsson, K.; Melhus, H.; Lemming, E.W.; Wolk, A.; Byberg, L. Long term calcium intake and rates of all cause and cardiovascular mortality: Community based prospective longitudinal cohort study. BMJ 2013, 346, f228. [Google Scholar] [CrossRef] [Green Version]
  36. Dastan, I.; Erem, A.; Çetinkaya, V. Urban and rural differences in hypertension risk factors in Turkey. Anatol. J. Cardiol. 2017, 18, 39–47. [Google Scholar] [CrossRef] [PubMed]
  37. Waib, P.H.; Papini-Berto, S.J.; Habermann, F.; Burini, R.C. Calcium-intake assessment in essential-arterial hypertensive patients. Rev. Saúde Pública 1992, 26, 27–33. [Google Scholar] [CrossRef] [PubMed] [Green Version]
  38. Wang, Y.-M.; Mo, B.-Q.; Takezaki, T.; Imaeda, N.; Kimura, M.; Wang, X.-R.; Tajima, K. Geographical variation in nutrient intake between urban and rural areas of Jiangsu province, China and development of a semi-quantitative food frequency questionnaire for middle-aged inhabitants. J. Epidemiology 2003, 13, 80–88. [Google Scholar] [CrossRef] [PubMed] [Green Version]
  39. Roberts, M.E.; Doogan, N.J.; Kurti, A.N.; Redner, R.; Gaalema, D.E.; Stanton, C.A.; White, T.J.; Higgins, S.T. Rural tobacco use across the United States: How rural and urban areas differ, broken down by census regions and divisions. Health Place 2016, 39, 153–159. [Google Scholar] [CrossRef] [Green Version]
  40. O’Connor, A.; Wellenius, G.A. Rural–urban disparities in the prevalence of diabetes and coronary heart disease. Public Health 2012, 126, 813–820. [Google Scholar] [CrossRef]
  41. Xing, L.; Jing, L.; Tian, Y.; Lin, M.; Du, Z.; Yan, H.; Ren, G.; Dong, Y.; Sun, Q.; Liu, S. Urban-Rural disparities in status of hypertension in northeast China: A population-based study, 2017-2019. Clin. Epidemiol. 2019, 11, 801–820. [Google Scholar] [CrossRef] [Green Version]
  42. Li, J.; Shi, L.; Li, S.; Xu, L.; Qin, W.; Wang, H. Urban-rural disparities in hypertension prevalence, detection, and medication use among Chinese Adults from 1993 to 2011. Int. J. Equity Health 2017, 16, 50. [Google Scholar] [CrossRef] [Green Version]
  43. Li, M.; Shi, Z. Dietary Pattern during 1991–2011 and Its Association with Cardio Metabolic Risks in Chinese Adults: The China Health and Nutrition Survey. Nutrients 2017, 9, 1218. [Google Scholar] [CrossRef] [Green Version]
Figure 1. Association between DCI and blood pressure in the general population.
J 03 00009 g001
Table 1. Participants’ characteristics by location.
VariablesUrban 876Rural 1342p-Value
BaselineFollow-upBaselineFollow-up
Sex (%) 0.53
Male555555.655.6-
Female454544.444.4-
Age in years49.4 (12.8)58.4 (12.9)48.8 (11.4)57.8 (11.4)0.012
Smoking status (%) 0.001
Non-smoking 67.570.963.166.2-
Smoking32.529.136.933.8-
Frequency of alcohol consumption (%) <0.0001
Non-drinkers60.361.063.465.4-
1 to 4 times/week36.933.134.131.8-
More than 5 times/week2.95.92.62.8-
Hypertension diagnostics (%) <0.0001
No94.385.390.278.2-
Yes5.714.79.821.8-
Dietary calcium intake (mg/day)433.8 (594.5)429.8 (243.3)403.5 (321.82)388.5 (243.3)<0.0001
Systolic blood pressure (mmHg)123.1 (17.6)130.3 (18.6)121.1 (17.7)129.5 (19.22)<0.0001
Diastolic blood pressure (mmHg)79.1 (11.4)82.3 (10.8)78.4 (10.7)81.30 (10.9)0.02
BMI23.6 (3.3)23.9 (3.5)22.9 (3.2)23.4 (3.5)<0.0001
Energy intake (kcal/day)2206.2 (1343.7)2102.1 (1118.8)2346.8 (1029.9)2345.2 (1480.3)<0.0001
Physical activity (%) 0.009
Few21.621.612.912.9-
Moderate 16.816.922.822.7-
High61.461.464.364.3-
Metric variable means are given with standard deviation (*): p-values from independent sample t-test for metric variables and Pearson χ2 for categorical variables.
Table 2. Hypertension occurrence (HTN) and dietary calcium intake (DCI) by living location.
Survey Years2000200420062009
Hypertension Occurrence—Mean rank (Chi square)MaleUrban N = 441803.5804.1705.2846.9
Rural N = 1102759.4786.5696.0812.8
χ2 (p-value)
FeMaleUrban N = 876567.8673.0614.9712.1
Rural606.91630.6580.5644.1
χ25.1 *8.7 **
Dietary Calcium intake—Mean rank (Chi square)MaleUrban878.3930.2893.4910.4
Rural818.8797.8812.7805.8
χ25.2 *25.8 ***9.6 **16.1 ***
FeMaleUrban733.5753.3758.4751.9
Rural645.7637.5625.4638.0
χ214.3 ***24.9 ***28.0 ***24.0 ***
***: p-Value less than 0.001, **: p-Value less than 0.01, *: p-Value less than 0.05, ἠ: Non-significant p-Value.
Table 3. DCI and HTN among rural population (RP) and urban population (UP).
ModelLiving Location
Rural Urban
Model 1--
OR1.031.13
95% CI(0.96–1.09)(1.04–1.22)
Model 2--
OR1.051.14
95% CI(0.98–1.12)(1.06–1.24)
Model 3--
OR1.041.16
95% CI(0.97–1.12)(1.06–1.26)
Model 1: bivariate analysis. Model 2: adjustment for sex. Model 3: Multivariate analysis including age and sex, BMI, physical activity, alcohol intake, smoking status, and energy intake.
Table 4. Dietary calcium intake and hypertension occurrence by sex.
ModelsLiving Locations FemaleMale
Q1Q2Q3Q4Q1Q2Q3Q4
Model 1Urban 11.81.731.771n1.4n1.11.9
OR (95% CI) (1.2–2.7)(1.2–2.6)(1.2–2.6)(0.9–2.1)(0.7–1.6)(1.3–2.8)
Rural 11.20.90.911.01.41.6
OR (95% CI)(0.9–1.6)(0.6–1.2)(0.7–1.2)(0.7–1.4)(1.1–1.9)(1.2–2.1)
Model 2Urban121.981.8811.61.22.3
OR (95% CI)(1.3–3)(1.2–2.9)(1.2–2.7)(1.0–2.4)(0.8–1.9)(1.56–3.5)
Rural 11.30.90.911.11.61.7
OR (95% CI)(0.9–1.7)(0.7–1.3)(0.7–1.3)(0.8–1.5)(1.2–1.3)(1.3–2.3)
Model 3Urban 12.01.81.911.41.22.3
OR (95% CI)(1.3–3.2)(1.2–2.8)(1.2–2.8)(0.9–2.3)(0.7–1.9)(1.6–3.6)
Rural11.20.80.911.11.41.6
OR (95% CI)(0.9–1.6)(0.6–1.1)(0.6–1.2)(0.7–1.5)(1.0–1.9)(1.1–2.1)
Model 1: Bivariate analysis. Model 2: Analysis with control for age. Model 3: Multivariate analysis including age, BMI, physical activity, smoking status, alcohol consumption, and energy intake. ἠ) No significance.

