Article

Analysis of Dynamical Heat Conductivity of the Reservoir and Fluid Evacuation Zone on the Gas Condensate Well Flow Rate

by
Kouadio Fabrice Anzian
1,*,
Mykhailo Illich Fyk
2,
Al-Sultan Mohammed Bassam
2,
Mohammed Khaleel Abbood
2,
Haval Mohammed Abdullatif
2 and
Yevhen Alexender Shapchenko
3
1
School of Science, Technology, Engineering and Mathematic (STEM), International University of Grand Bassam, PoBox 564 Grand Bassam, Cote D’Ivoire
2
Department of Oil, Gas and Condensate extraction, National Technical University Kharkiv Polytechnic Institute, Kyrpychova Str 2, Kharkiv 61002, Ukraine
3
Chief Dispatcher of UMG Kharkivstransgaz, Kultury Str, 20A, Kharkiv 61001, Ukraine
*
Author to whom correspondence should be addressed.
J 2020, 3(1), 124-137; https://doi.org/10.3390/j3010011
Submission received: 16 September 2019 / Revised: 29 November 2019 / Accepted: 3 December 2019 / Published: 14 March 2020

Abstract

:
This study shows that the thermal conductivity of the rock borehole adjacent to the wells varies depending on the operation of the well. This is due to the fact that the actual temperature and temperature difference affect the humidity and other thermal properties of the rocks, which in turn affect the heat transfer coefficient across the section between the moving gas and the rocks. The static temperature field of primitive geothermal gradients acquires changes in a dynamic form. Theoretical consideration of changes in the thermal conductivity of rocks near the face and the wells is proposed to improve the prediction of gas condensate wells production. The result is achieved by introducing the specified equations of the thermal energy balance in the radial filtration and lifting of well products, which contain the coefficients of heat exchange and throttling. The refinement bias estimation of the 10%–15% level of gas condensate well extraction is shown using proposed methodological approach to relatively well-known (traditional in the field development practice) methods for estimating the extraction of a “medium well” from a particular oil and gas field evaluation. The results of this work demonstrate important scientific, applied, educational and methodological significance of using the methodology presented by the authors.

1. Introduction

Gas and condensate extraction from gas condensate wells is carried out after drafting development projects and preliminary estimation of extractive capacity. During the design of the field development, basic and advanced methods for forecasting the main development parameters are used. After commissioning, long-term operation and repair of wells, the estimation of possible and optimal operating modes is also required. This makes it necessary to continuously improve the methods of calculating thermal parameters and debit. In most cases, the forecasting of gas condensate wells production is influence by the thermal conductivity of the adjacent rocks.
This may vary in the same time with, or after, thermal intensification of the hydrocarbons influx. From theoretical perspective, the connection of extraction and thermo physical parameters of rocks, the actual temperature distribution curving along the well, the heat exchange between a lot of extracted fluids and the reservoir rock, are also important to take in account the relevance of the problem in order to get a better gas condensate production estimate. Therefore, it is important to formalize the corresponding refinement problem on the extraction of gas condensate wells with essentially non-isothermal operating conditions and to develop new scientific approaches. In this paper we consider a simplified model of gas condensate well, working from one productive reservoir and has one pipe of tubing productive line, with a geothermal gradient remaining unchanged for the remote zones, and the heat exchange passes in the plane of the reservoir and near the trunk of the well. At the same time, in the thermo hydraulic calculations, it is proposed to take into account the drainage, heat dissipation and heat inflow of the “fluid-adjoining rocks”, depending on the actual pressures and temperatures in the dynamics at different depths.

2. Research Review and Setting the Research Task

The equation of the inflow of the gas condensate mixture from the production formation to the wellbore is recorded using the filtration coefficients A, B and constant C, which generally determine the volume of natural gas extraction for a certain period [1]:
( P p l 10 6 ) K n g ( P b h 10 6 ) K n g = A · ( M q · 24 · 3600 ρ · 1000 ) + B · ( M q · 24 · 3600 ρ · 1000 ) 2 + C ,
where: A = z · μ · P a t · T r a v π · k · h · T a t · ( ln ( R k R c ) + S 1 ) ;   B = z · β · P a t 2 · T r a v 2 π 2 · k · h 2 · T a t 2 · z s t · R · ( ln ( 1 R c 1 R k ) + S 2 ) .
In Equation (1), the system of units SI and the nomenclature of parameters are shown below in the table (except for A, B, C and k).
Table 1 shows all the parameters of the study and their units.
A comparison in the results of the heat flux values, using thermal conductivity [2], shows that the failure takes into account the influence of reservoir pressures and temperatures. The thermal conductivity of sedimentary rocks leads to an overestimation or undervaluation of the heat flow by 13%–30%.
During the filtration movement of the hydrocarbon mixture through the formation, there is a heat-mass-exchange process and a throttling effect, which can be simplified by the equation [3],
T p l T b h = D j · ( P p l P b h ) + Δ T h e .
The constraint z, the isobaric heat capacity Cp, the dynamic viscosity μ, and the density of natural hydrocarbons ρ, as well as the Joule–Thomson Dj coefficient from the formation to the face, will vary considerably depending on the actual pressure P and temperature T [4]. They can be determined for natural gas containing methane more than 90%, with a molar mass of M-const and a density at standard conditions ρst-const based on the following empirical functional dependences of Latonov Gurevich, Starling Ellington, and others illustrated in [5,6]:
z ( P , T , ρ s t ) = 0.1 · P P p c ( ρ s t ) + [ 0.4 · log ( T T p c ( ρ s t ) ) + 0.73 ] P P p c · ( ρ s t )   ;
μ ( P , T , M ) = ( 9.41 + 0.02 · M ) ( 1.8 · T ) 1.5 ( 209 + 19 · M + 1.8 · T ) · 10 7 · E X P [ ( 3.5 + 547.8 1.8 · T + 0.01 · M ) ·   ( P · 10 3 z ( P , T , ρ s t ) · 8314.3 M · T ) ( 2.4 0.2 · ( 3.5 + 547.8 1.8 · T + 0.01 · M ) ) ] ;
C p ( P , T , M ) = ( 900 · 1.014 T 273 · T 0.7 + 2170 · 1.015 P .10 6 · P 0.0214 ) · ( R a i r . M 0.6 R μ ) 0.025   ;
D J ( P , T , M ) = 1 α · T C p ( P , T , M ) · ρ ( P , T , M )   ;
where:   T p c ( ρ s t ) = 88.25 · ( 0.9915 + 1.759 · ρ s t ) ;
P p c ( ρ s t ) = 2.9585 · ( 1.608 0.05994 · ρ s t ) —pseudo-critical parameters of the gas-condensate mixture; and ρ ( P , T , M ) = P ( z ( P , T , M ) . R . T ) —the density of the mixture in working conditions.
After passing through a thick penetrating zone of the productive formation, the gas condensate mixture is evacuated through a lifting column, which also has heat exchange with the rocks adjacent to the well [7]. It can be seen from the typical schematic representation of the formation of the wellbore system in Figure 1. Two-way arrows show the heat exchange between the adjacent rocks and the moving extraction fluid. First, the fluid passes through the filtration zone in the reservoir (shown with the arrowheads in one direction), and then rises up through the tube or other product line of the well.
In the elevator column, the heat exchange continues between adjoining rocks and overcoming its path to the extractive fluid. This can be described by the following non-isothermal vertical transport and longitudinal heat exchange equations [4]:
P w h = P b h 2 · e 2 · g · H Z · R · T 0 · ϕ t ( T b h , T w h , T 0 ) 8 · M q 2 · λ ( K e , R e , D ) · z 2 · R 2 · T 0 2 · ϕ t ( T b h , T w h , T 0 ) D 5 · π 2 · g . · ( 1 e 2 · g · H Z · R · T 0 · ϕ t ( T b h , T w h , T 0 ) )           ,
  M q · C p ( P a v , T a v , M ) · ( T w h T b h ( P b h P w h ) · D j ( P a v , T a v , M ) ) = K i · π · D · 0 H ( T 0 ( x ) T ( x ) ) d x ,              
where: ϕ t ( T b h , T w h , T 0 ) = ( 1 + T b h T w h T 0 · ln ( T b h T 0 T w h T 0 ) )   —Shuhov correction temperature; P a v = 2 3 · ( P b h + P w h 2 P b h + P w h ) = ρ ( P , T , M ) · z ( P , T , M ) · R · T 0 · ϕ t = ρ ( P , T , M ) · z ( P , T , M ) · R · T a v   ;   —average pressure; T a v = T 0 · ϕ t —average temperature; and λ ( k e , R , D ) = ( R e 2320 ) · 64 R e + ( 2320 < R e 10 4 ) · ( 64 ( e 0.2 ( R e 2320 ) ) R e + 0.3164 ( e 0.2 ( R e 2320 ) ) R e 4 ) + ( 10 4 < R e 10 5 ) · 0.3164 R e 4 + ( 10 5 < R e 27 ( k e D ) 1.143 ) ( 0.0032 + 0.221 R e 0.237 ) + ( 27 ( k e D ) 1.143 < R e 500 D k e ) · 0.11 ( k e D + 68 R e ) 0.25 + ( 500 D k e < R e ) · 0.11 ( k e D ) 0.25    
—hydraulic resistance.
The system of Equations (1)–(8) is closed and is used to calculate the gas flow rate of the well in cases of substantially non-isothermal processes in the radial inflow of the extracted fluid from the formation and removal onto the surface through the wellbore column [5]. The disadvantages mentioned in modern studies include, in particular: the assumption of the exchangeability of Kt along the column; the equation to 0 of the parameter ΔThe; the assumption of the invariance of Dj from the edge of the formation to the mouth, based on change in the heat transfer efficiency at different depths.
Complete or partial elimination of these shortcomings of modern theories is an actual task. This will lead to an improvement in the accuracy of the gas condensate well simulation and the prediction of extraction in general. However, the developed technique, suitable for gas condensate wells, can be modified to a universal one as for light oil production (more in the liquid composition than gas). This leads to analyzing, further, the compressibility, the heat capacity and the viscosity of the light crude oil.

3. The Purpose and Task of the Research

The purpose of the work is to develop a mathematical model of non-isothermal radial inflow and lifting (evacuation on the inner cavity of the tubing) of a gaseous mixture in a gas condensate well. This takes into account the determined thermal coefficient of heat conductivity λt(x), which also determined the geothermal gradient in depth and the temperature difference of rock-fluid in working conditions. To evaluate the thermal conductivity λt, we used the resulting heat transfer coefficient Kt, which are related by the calculated area during radial filtration in the reservoir and evacuation of the fluid-like coolant through the pipe.
To achieve the goal, the task is to fulfill comparative analysis of modeling results based on a developed theoretical improvement with modeling according to the indicated general effect T 0 ( x ) ,   T 0 ( x ) T ( x )   on   K t ( x )   and   D j .

4. Research Methods

The research methodology consisted of a comparative analysis of two effects accounting combinations of gas condensate fluid extraction: the effect of throttling and alternating heat transfer along the way of mixing the mixture. In this case, the flow mode parameters of the extracting hydrocarbon mixture, the discharge of the wells were calculated.
To solve this problem, the authors used the mathematical method of introducing artificial coefficients of elimination effects (throttling and alternating heat transfer), which allowed us to make a comparative analysis under identical conditions by other technical parameters and indicators. Under the name coefficient of elimination, the authors proposed to understand a parameter with an absolute value from 0 to 1, which, when introduced into the formula, could eliminate (annihilate, if it is 0) or completely take into account (if it is 1) any effect.
The system of nonlinear equations of the developed mathematical model was solved by the Runge–Kutta fourth order method and the Quasi-Newtonian method.

5. Research Results

The equations development for pseudo critical parameters of a hydrocarbon gaseous extraction mixture was made on the assumption of a small amount (total percentage by mass) of nitrogen and carbon content. With a significant content of these gases in the extracted fluid, more complicated analytics are needed [8,9], but in this paper-investigated for the calculation example, the following was used:
T p c = 88.25 · ( 0.9915 + 1.759 · M 24 · 05525 · z s t ) ;
  P p c = 2.9585 · ( 1.608 0.05994 · M 24 · 05525 · z s t ) .                                        
The calculation of the Joule–Thomson coefficient was made on the assumption that methane in the production well is more than 95%, and the relative density Δ 0.6. After introducing the coefficient of elimination of the throttle effect Ka (which is possible with increasing the humidity of natural gas), as well as the use of (5)–(6) and [6] the following working formula of the study is obtained:
D j ( P , T , M ) = K a C p ( P , T , M ) · 10 3 · ( 0.98 · 10 6 T 2 1 ρ ( P , T , M ) ) .
Equations (9)–(11) were used universally for calculations of both the inflow of the fluid to the face and the evacuation of the gas condensate mixture on the tubing of the well.
The hydraulic resistance in the pump-compressor or other lift pipe of the well λ is a function of Re, temperature and other regime and structural parameters [9]. Therefore, in the study of non-isothermal lifting on the surface of the hydrocarbon mixture, the working functional dependence λ (P, T, M, Mq, D and ke) was developed and used for the Equation (7) based on Colebrook–White equation, and the studies of S. Borisov and I. Hodanovich [10] (instead of the above functional dependence λ (ke, Re and D)):
1 λ ( P , T , M , M q , D , k e ) = 2 · log ( k e 3.7 D + 2.51 · μ ( P , T , M ) · π · D 4 M q · λ ( P , T , M , M q , D , k e ) ) ,
because R e ( P , T , M , M q , D ) = 4 · M q μ ( P , T , M ) · π · D .
The heat transfer coefficient Kt in the basic traditional methods is not considered to be variable along the production casing of the well. So, the elimination coefficient Ka led to the fixation of the value at one average level. However, in the developed and improved mathematical model, on the contrary, the explicit dependence of Kt on longitudinal thermal conditions is used according to the Vlasov formula and the recommendations of [2,11] of the form:
    K t ( T 0 ( x ) ) = K t o 1 + β a · T o ( x )
In the rocks along the depth of the axis, the temperature has a static distribution, but the temperature of the mobile gas condensate mixture in the well and the casing is characterized by a dynamic distribution of temperatures in depth. Accordingly, the thermal conductivity from the fluid to the rocks also receives a dynamic. Sometime after the well starts, the dynamic distribution of the thermal conductivity parameter will have a certain steady value, which is proposed to be taken into account in the calculations of the predicted well mass flow and thermal flow.
The temperature of the rocks at each separate depth of the well column will be different, so the Equation (8) turns into a formula:
M q · C p ( P a v , T a v , M ) · ( T w h T b h ( P b h P w h ) · D j ( P a v , T a v , M ) ) = K t o · π · D · 0 H ( T o ( x ) T ( x ) 1 + β a . T o ( x ) d x .
It follows from Equation (14) that losses (dissipation) or heat influx are possible at various depths. It depends on the temperature difference To(x) − T(x).
Using the proposed additional functional dependences and the Equations (9)–(14) in the system of Equations (1)–(5), (7), (11) and (14), the authors show the influence of the actual distribution Kt (To(x)) and the value of Dj(Pav, Tav and M) to the level of well extraction (relative to the simulation in the original system of Equations (1)–(8) of constant mean values Kt = 1.5 W/(m2K)-const and Dj = 2.5 K/MPa-const).
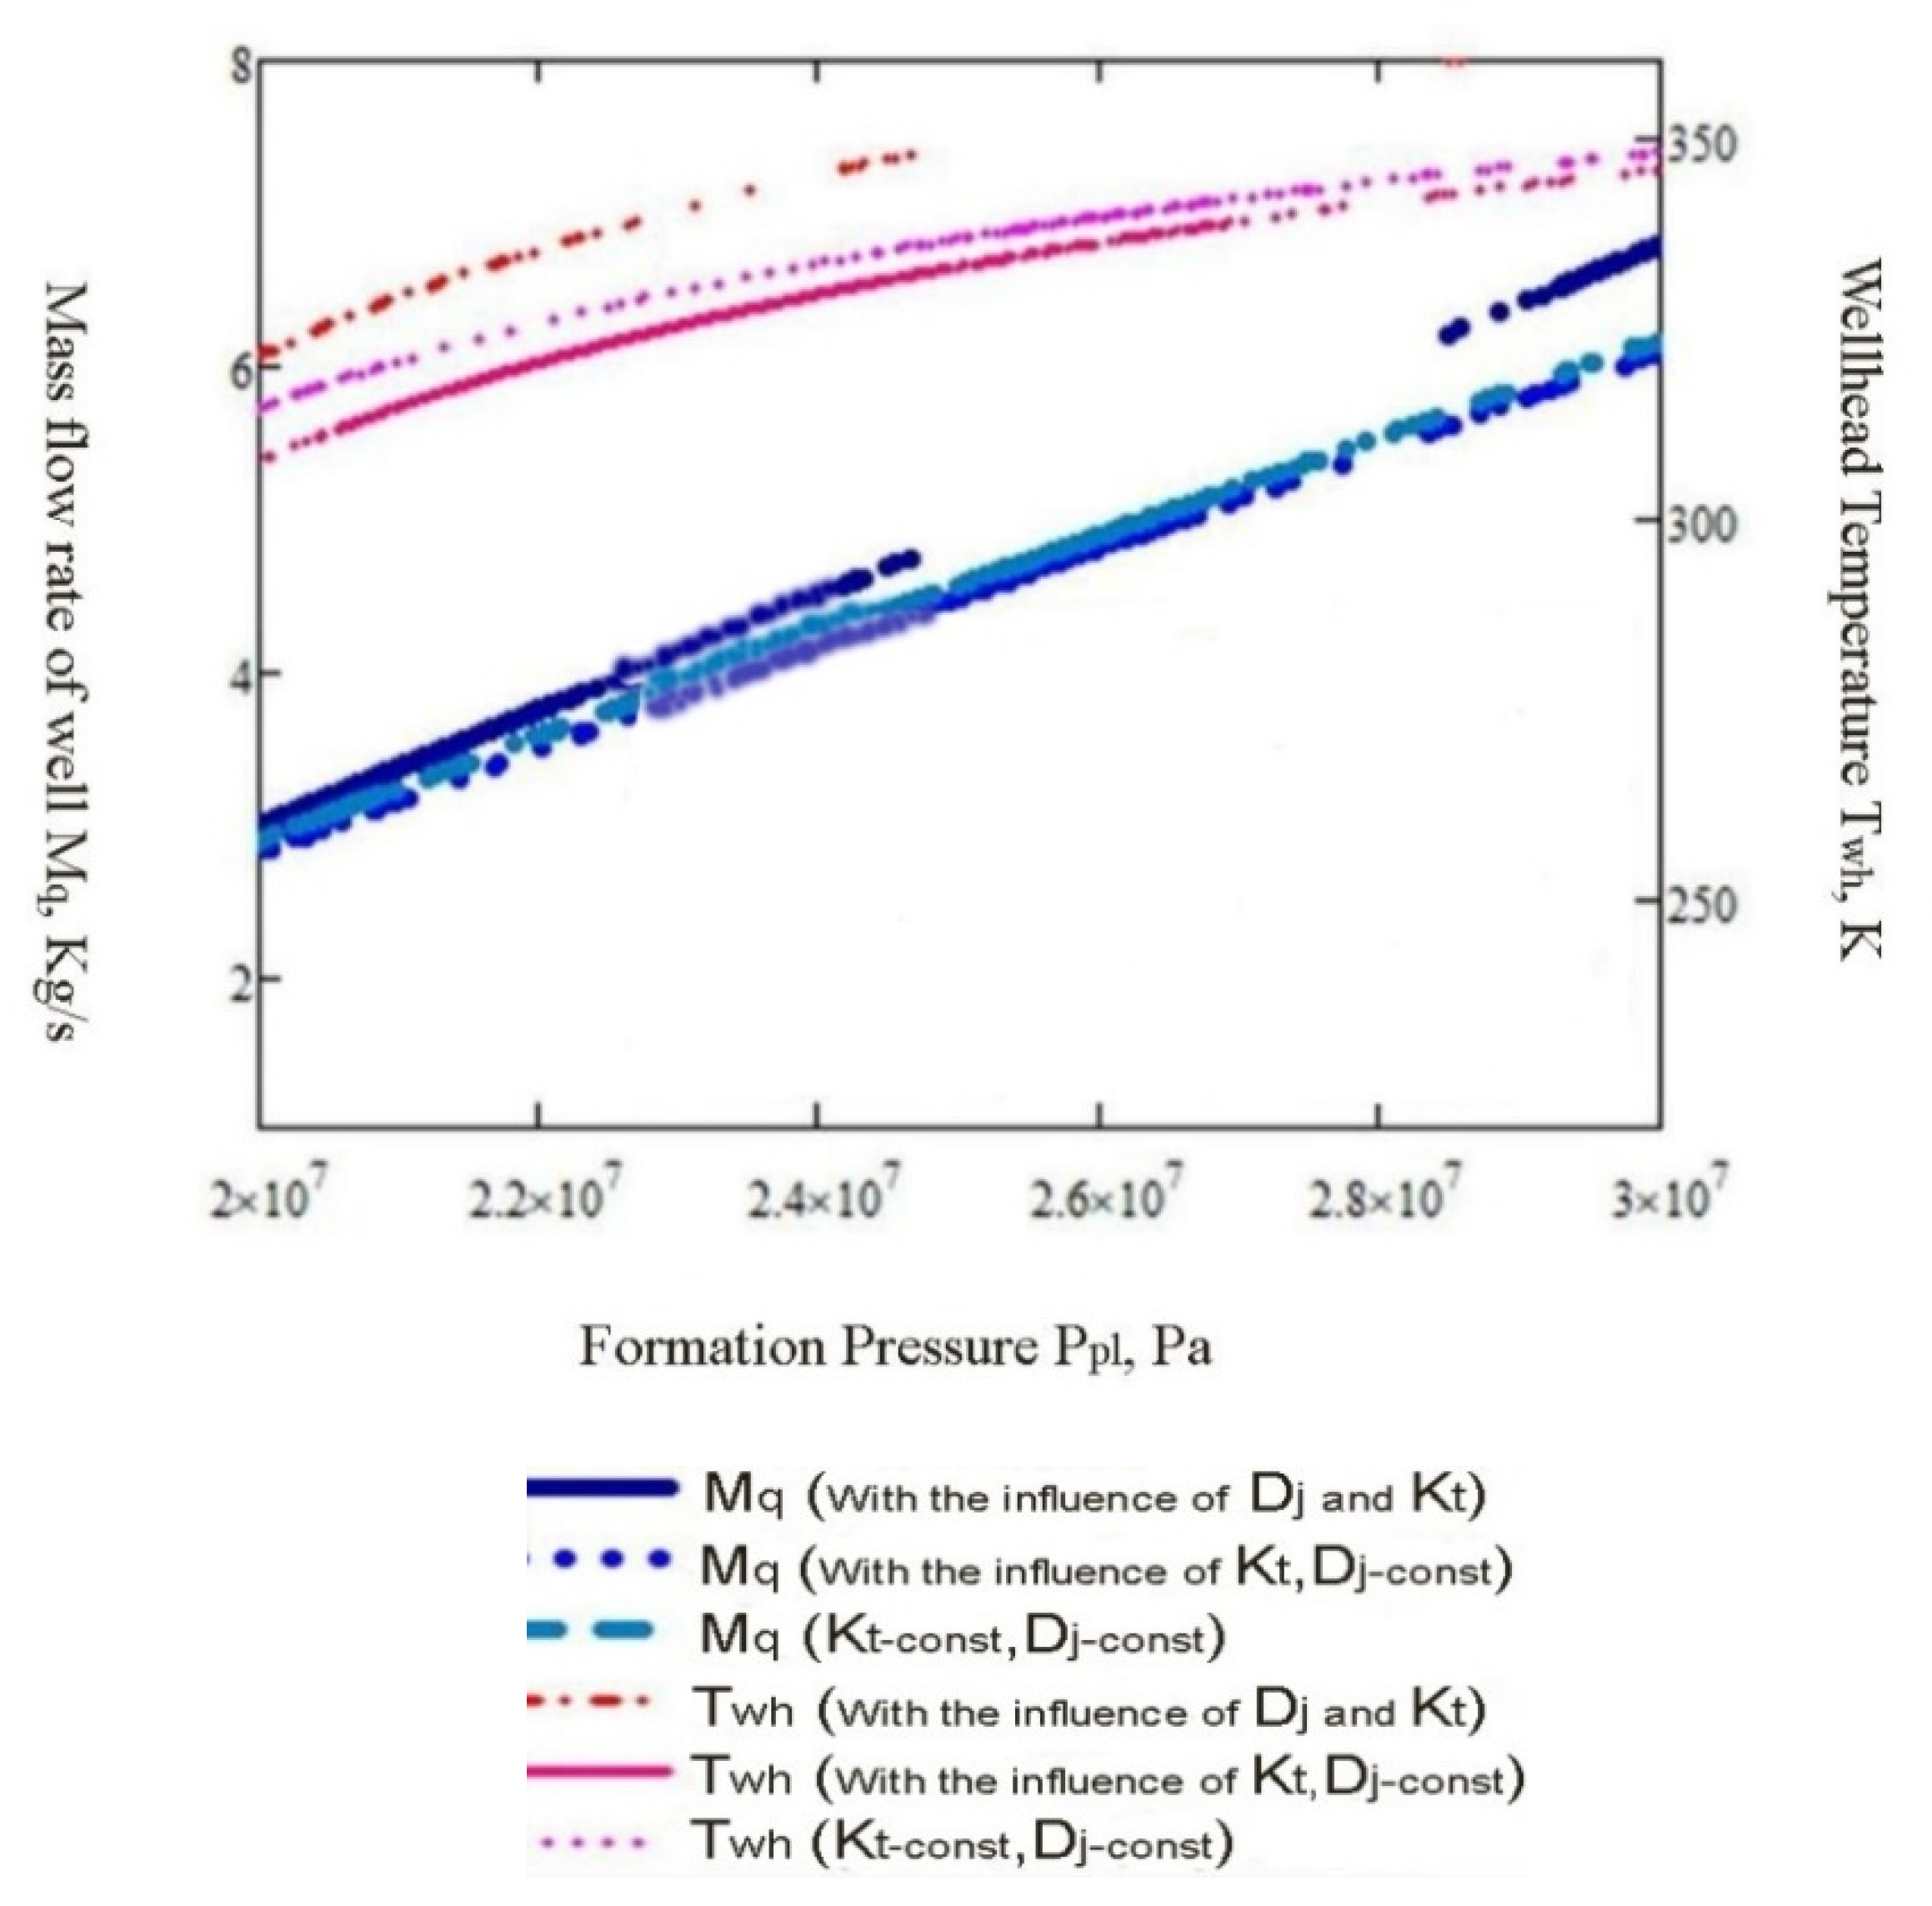
Figure 2 shows the mass flow rate dependence of well production and temperature at the mouth on the level of reservoir pressure in the productive deposit. It is seen that the influence of the throttling process in the actual thermobaric conditions, with the help of Equation (11), reflected more change in the debit than the parallel use of dependence Equation (13).
It was also obvious that for a calculated example with the data in the table of parameters nomenclature, the effect of reducing the rocks heat conductivity with depth and the throttle effect were multi-directional on mass flow rate. For the analyzed variants of the wells regime parameters, the maximum change in well flow at average reservoir pressure reached 10%–15%. The last fact indicated led to a corresponding change in the heat flux by the coolant itself.
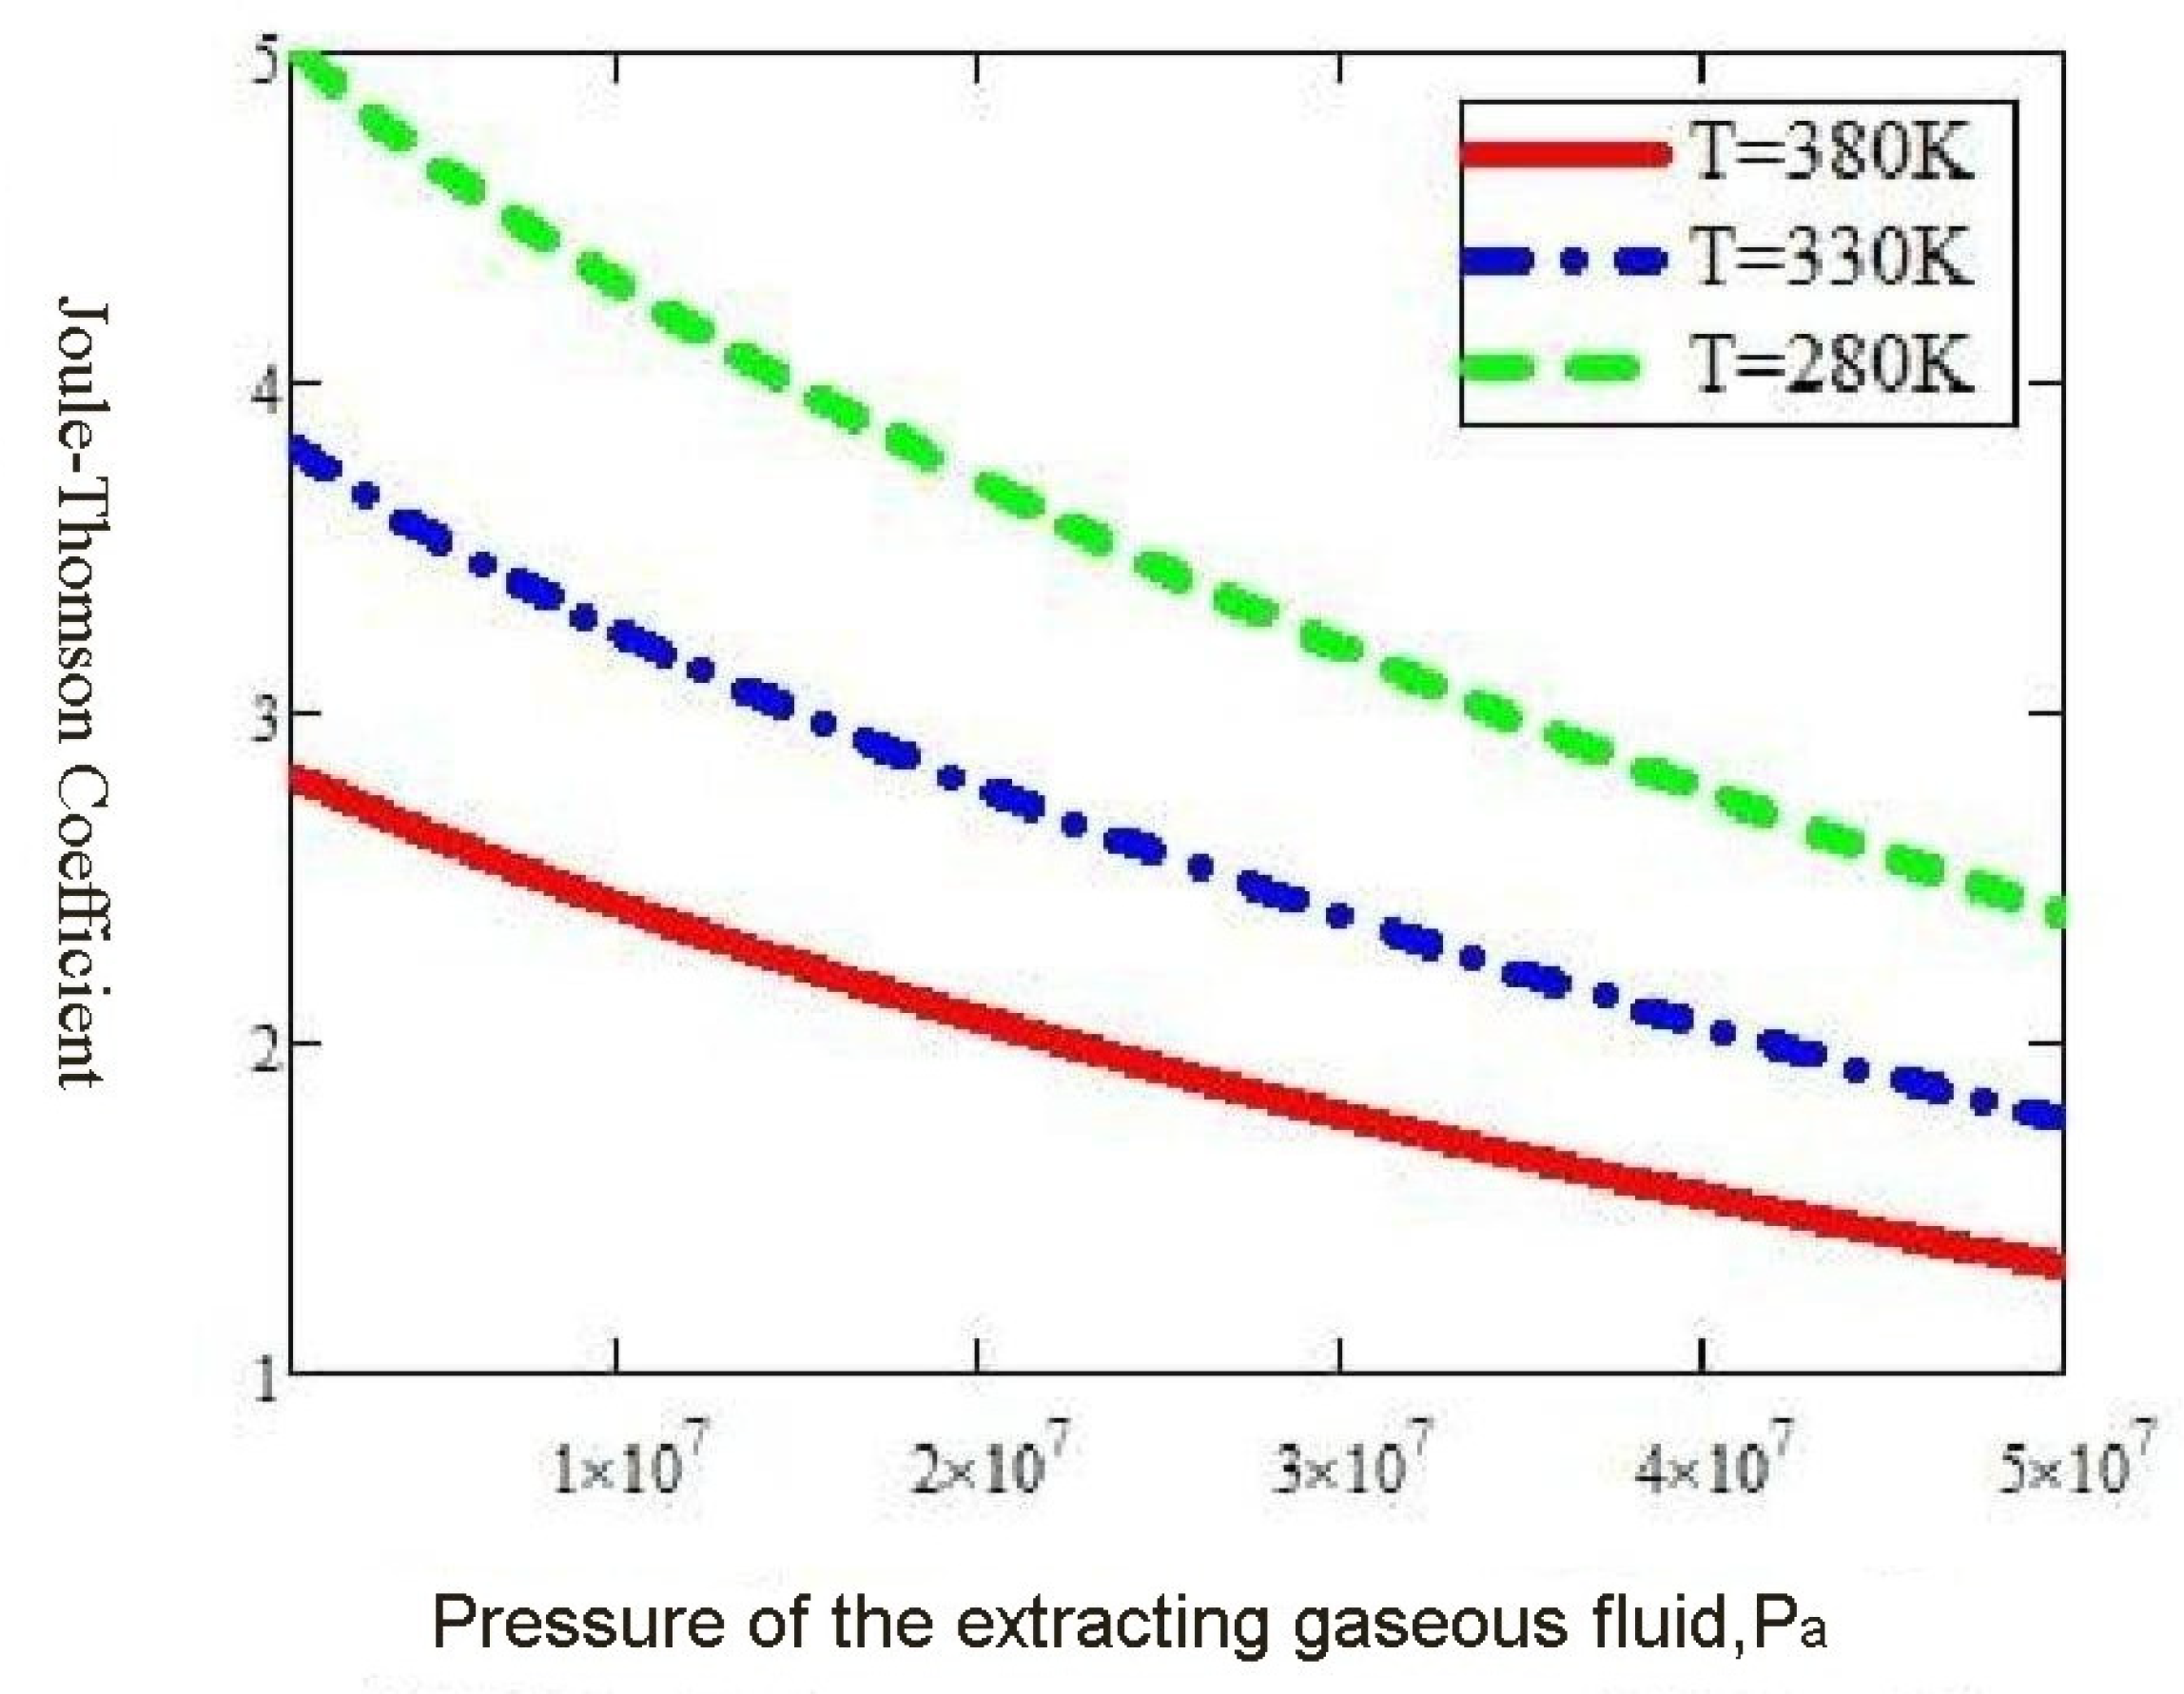
The dynamic heat transfer coefficient depended on the throttle effect on the temperature distribution in the dynamics of the extraction along the wellbore. The dependence of Dj(P, T) is shown in Figure 3.
The rocks temperature, at different depths of the well hole, could be taken in accordance with the thermal gradients (established during drilling) only in the absence of heat exchange with the contents of the well. After a certain time with the extraction of a liquid heated by the lower horizons, a balance was established in the system of the wellbore as longitudinal dynamic pressures and longitudinal dynamic temperatures. Temperatures, in particular, will depend not only on the temperature of the fluid in the productive horizon, but on the heat transfer processes and throttling from the depths to the surface. The latter fact seemed to be trivial at the first stage of the research. However, the quantitative assessment using the refined mathematical model shows significant changes in relation to the basic methodology of the most up-to-date educational textbooks on the gas condensate field development. Thus, in industrial practice, with the precise purpose of estimating extraction, it is not appropriate to consider hydraulic parameters without using the specification and clarification of the dynamic distribution (established after the start of extraction) of rock temperatures along the column, at least with the help of the Equations (11)–(14).
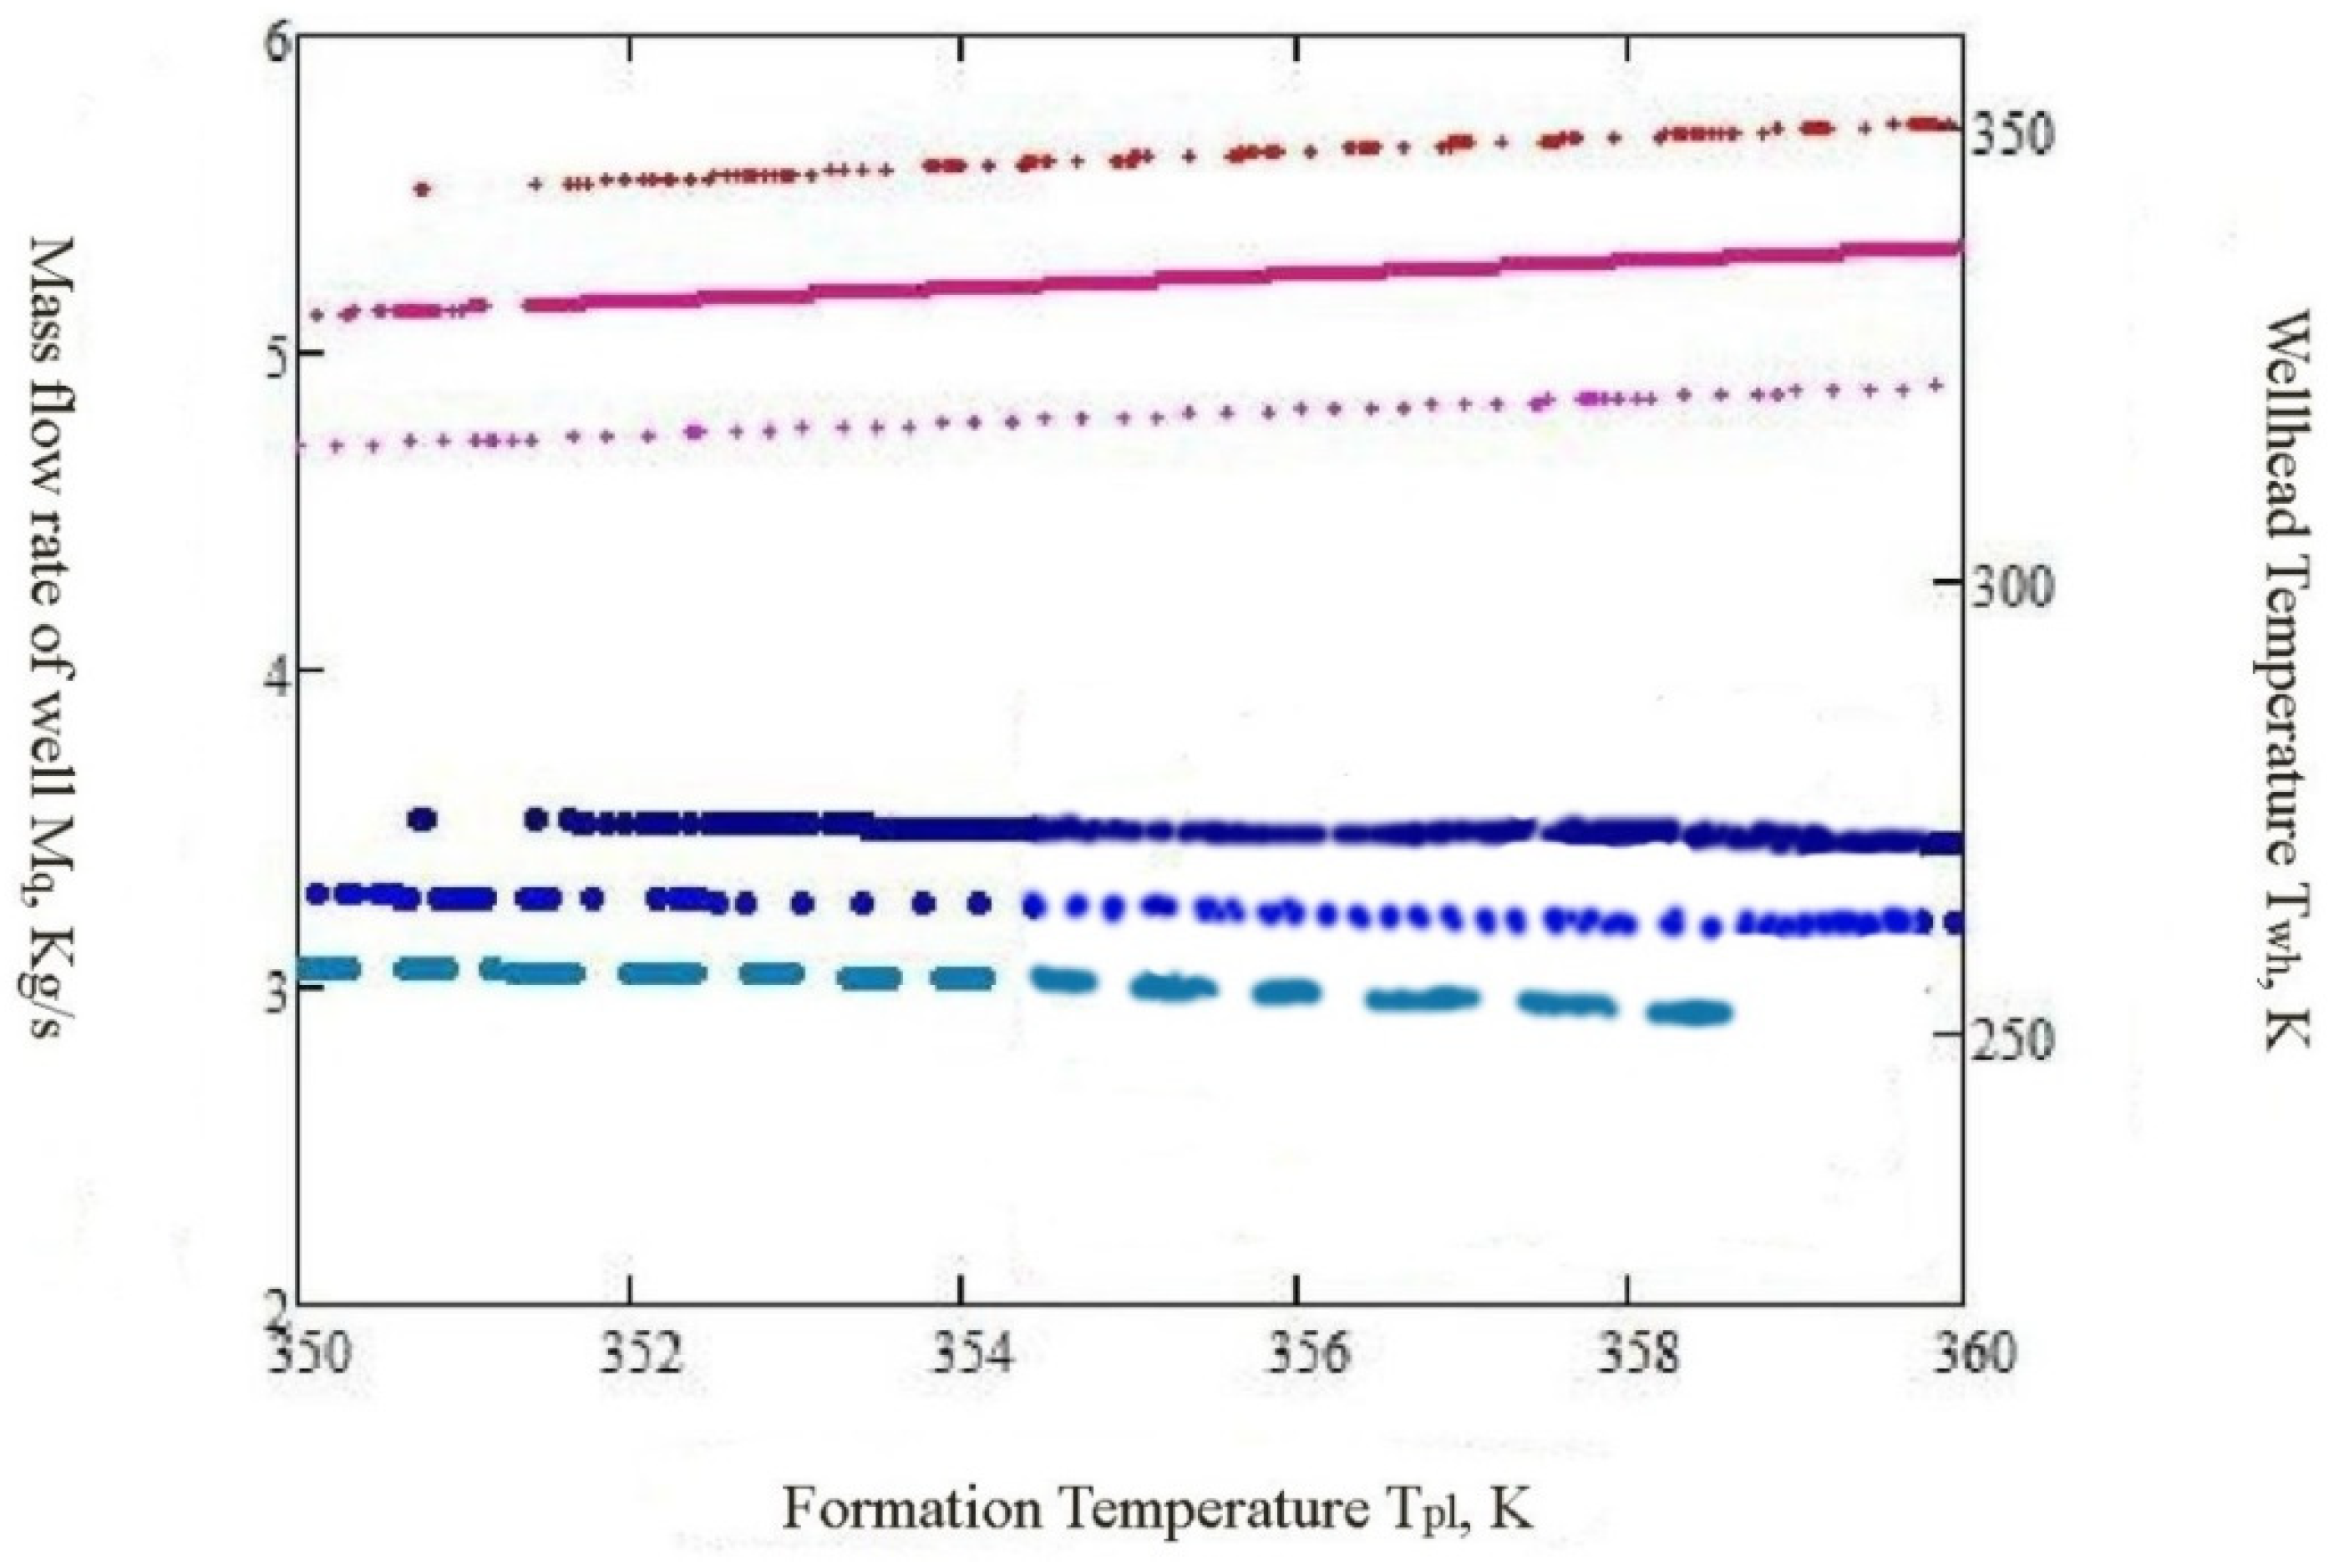
The practical value of the developed mathematical model could be especially noticeable in the case of using known thermal methods for the intensification of hydrocarbon production. The results of the first stage of such studies according to the last statement were made at the conference [12]. Figure 4 shows the dependence of the well flow rate on the formation temperature in the productive horizon for different values of the dynamic heat transfer coefficient from the fluid (inside the wellbore) to the adjacent rocks. The dynamic value of thermal conductivity was associated with the corresponding dynamic value of the heat transfer coefficient in the selected geometry of the heat engineering system (Figure 1). From Figure 4, it can be seen that the well flow significantly depended on the heat transfer coefficient. Changing the heat transfer coefficient from 1 to 2 W/(m2·K) led to a change in the flow rate to 5%–15%.
From the use of the isothermal equation of Adamov and the binary equation of the gaseous fluid inflow to the wellbore, in thermobaric conditions methods, the intensification of borehole extraction could reach 15%–30%. This was due to the fact that the traditional adaptation of parameters A and B and the reduction of error require time and resources for wells research in different modes. That time and resources are usually lacking in real industrial production to ensure the highest quality of scientific research. Changing the reservoir temperature to 50–80 degrees led to a doubling of the heat transfer coefficient (see Figure 4 and Figure 5), which could lead to a change in mass flow rate up to 30%. Figure 5 shows that for the smallest reservoir pressure (20 MPa), the effect on the flow rate was slightly lower, but for a temperature difference of 80 degrees, it was about 30%.
Figure 5 shows the flow rate and temperature range of the fluids at the mouth of the gas condensate well with a total change in pressure in the reservoir up to 10 MPa. Changes in operating temperatures in the geothermal reservoir can also lead to large fluctuations in reservoir pressure. We had chosen the range of reservoir pressure changes from experience in operating real oil and gas fields obtained during intensification by injection of hot water and steam.
The simulation was carried out in the MathCAD 15 program, which allowed checking the results of calculations and short term forecasting in the office and field work with the help of compact “Gadgets” from Windows 10. The verification showed the suitability of the calculation method for practical use under industry conditions, which also excluded the need for using more demanding (than described above) computing resources and simulator software.
It should be noted that the solution of the system of nonlinear equations by the above-mentioned methods did not provide solutions at all intermediate points of the parameter ranges. The curves had significant gaps (Figure 2, Figure 4 and Figure 5), but in general tendencies and the possibility of interpolating and comparing the investigated functions. The next step in the above studies was to consider the heat exchange over the cross section and the total surface of the formation with ΔThe. That also confirmed the significant effect of this heat transfer on the prediction of a gas condensate well extraction, also provided that thermo chemical or thermo physical intensification methods were carried out.
On the other side, light oil was less compressible than gas, so isothermal compressibility worked favorably in term of heat transfer in well extraction. It is also important to notice that the isothermal compressibility of light oil variation was depending on the impact of gravity changes and with the solution gas oil ratio (GOR). Figure 6 shows how isothermal compressibility changes with crude oil gravity. As oil gravity increases, isothermal compressibility should increase. Results predicted by De Ghetto [13,14] do not properly model the phenomena. De Ghetto proposed a method that uses several equations covering various American petroleum institute (API) gravity ranges. This technique results in discontinuities in predicted properties as the equations change.
A similar approach was used to develop a simple equation for the variation of the heat capacity or specific heat of crude oil as a function of API gravity and temperature. Data was regressed to obtain the algorithm presented as Equation (15) for foot pound second unit (FPS) units: Equation (16) for international system of units (SI). Note that the algorithm was developed for a crude oil with a universal oil products collection (UOP) index of 11.8 (indicating intermediate, paraffinic-naphthenic light crude oil). If the UOP index is known, the correction factor illustrated on the graph could be applied to the output from Equation (15) or (16).
The resulting Equation (14) is presented as Equation (15) for FPS units and Equation (16) for SI units.
C p = ( 1.39 · 10 6 · T + 10847 · 10 3 ) ·   A P I + ( 6.312 · 10 4 ) T + 0.352 ,
and;
C p = ( 2 · 10 3 · T 1.429 ) · S g + 2.67 · 10 3 · T + 3.049 .
From the practical results of the study, graphically presented in Figure 6, Equations (19) and (20), it could be determined that for various operating conditions and compositions of light oils, the heat capacity could change on average up to 1.5 times (T = 0–260 F), and compressibility on average changed up to 2.2 times. With an increase in heat capacity and a decrease in compressibility, heat transfer increased close to directly proportional, i.e., accounting for changes in the dynamic field was even more important (compared with gas-like mixtures, for accurate determination of the heat transfer intensity).
The recommended heat capacity calculation Equation (16) favorably complemented the developed Equations (10)–(14), which ultimately showed to us the best forecasting result for the dynamical heat properties of the reservoir and fluid evacuation zone.

6. Conclusions

  • Taking into account the actual change in the thermal conductivity of rocks due to depth, depending on their temperature (setting the value in dynamics), as well as the change in temperature of the extracting fluid from throttling in the well cavity led to a precision forecasting the flow of wells by 10%–15%.
  • Using developed mathematical models gave an opportunity to specify that 15%–30% of the debit in the conditions of implementation of thermobaric methods of intensification of the gas–condensate extraction (in relation to basic methods that do not consider the dynamic distribution of temperatures in adjacent well of rocks and the corresponding longitudinal thermal conductivity).
  • Light oil well extraction with its parameters (compressibility, heat capacity and viscosity) required less heat exchange surface, and guarantee a more intense heat transfer during production. An increase in the percentage of hydrocarbon condensates (in a gas–liquid mixture—well production) required an even closer examination of the dynamical heat conductivity of the reservoir rock on the gas condensate flow rate.

Author Contributions

Conceptualization, M.I.F. and K.F.A.; methodology, A.-S.M.B.; software, H.M.A.; validation, M.I.F. and K.F.A.; formal analysis, A.-S.M.B.; investigation, Y.A.S.; resources, Y.A.S.; data curation, K.F.A.; writing—original draft preparation, M.I.F., A.-S.M.B.; visualization, M.K.A.; supervision, M.I.F.; project administration, M.I.F. All authors have read and agreed to the published version of the manuscript.

Funding

This research was partially funded by The International University of Grand Bassam, Ivory Coast (www.iugb.org).

Acknowledgments

The authors are grateful to PJSC “Ukrgazvydobuvannya” and the UkrNDIgaz Institute for a grant approach in providing materials and data on gas condensate wells for the required period of time to the extent necessary to establish the adequacy of the developed mathematical model for comparison with real industrial research and the possibilities of adaptation in science-intensive production.

Conflicts of Interest

The authors declare no conflict of interest.

Nomenclature

APIAmerican petroleum institute
FPSfoot pound second unit
GORgas oil ratio
SIinternational system of units
UOPuniversal oil products collection

References

  1. Istomin, V.A. Non-isothermal filtration of gas in the bottomhole formation zone. Sci. Tech. Collect. GAS Sci. 2013, 15, 132–141. Available online: https://docplayer.ru/66188595-Neizotermicheskaya-filtraciya-gaza-v-prizaboynoy-zone-plasta.html (accessed on 15 April 2013).
  2. Kurbanov, A.A. The joint effect of reservoir temperatures and pressures on the thermal conductivity of fluid-saturated reservoirs. In New Ideas in Earth Sciences; Mat. of Reports V International; NEDRA: Moscow, Russia, 2005; p. 176. [Google Scholar]
  3. Sharafutdinov, R.F. Numerical study of the temperature field in a well-reservoir system during oil degassing. Phys. Math. Model. Oil Gas Energy 2017, 3, 8–20. [Google Scholar] [CrossRef]
  4. Fik, M.I. Clarification of calculation of efficiency of work of DCS in the conditions of actual thermo gradients and modern coatings of tubing. Oil Gas Ind. Ukr. 2014, 1, 25–28. [Google Scholar]
  5. Kutia, M.; Fyk, M.; Kravchenko, O.; Palis, S.; Fyk, I. Improvement of technological-mathematical model for the medium-term prediction of the work of a gas condensate field. East. Eur. J. Enterp. Technol. 2016, 5, 40–48. [Google Scholar] [CrossRef]
  6. Moshfeghian, M. Variation of Natural Gas Heat Capacity with Temperature, Pressure, and Relative Density. 1 July 2009. Available online: http://www.jmcampbell.com/tip-of-the-month/2009/07/variation-of-natural-gas-heat-capacity-with-temperature-pressure-and-relative-density/ (accessed on 7 January 2009).
  7. Fyk, M.I.; Palis, S.F.; Kovalchuk, J.I. Gas well Production Enhancement on the Application of Innovative Structural and Thermal Insulation Nano-Coatings. Вісник Харківськoгo Націoнальнoгo Університету ім В. Н. Каразіна 2016, 45, 80–85. [Google Scholar]
  8. Lurie, M. Modeling of Oil Product and Gas Pipeline Transportation; WILEY-VCH VerlagGmbH&Co. KGaA: Weinheim, Germany, 2008; 214p. [Google Scholar]
  9. Boyko, V.S.; Boyko, R.V. Extraction and Transportation of Hydrate-Forming Natural and Petroleum Gases; The New Star: Ivano-Frankovsk, Ukraine, 2010; p. 747. [Google Scholar]
  10. Alshtul, A.D. Hydraulic Resistance, 2nd ed.; Recycling and Extra. M.: Nedra, India, 1982; p. 224. [Google Scholar]
  11. Abbas, G.; Rzaev, S.R.; Rasulov, F.; G Pashaev, M.; Salii, A. Features of distribution of temperature along the length of oil pipeline. Perm J. Pet. Min. Eng. 2017, 16, 158–163. [Google Scholar]
  12. Problems of Geo Engineering and Underground Urban Engineering. In Proceedings of the Ii International Scientific and Technical Conference, Kyiv, Ukraine, 29–31 May 2019; Organizer—Department of Geo-Engineering “Igor Sikorsky KPI”. Igor Sikorsky Kyiv Polytechnic Institute, National Technical University of Ukraine: Kyiv, Ukraine, 2019; p. 257. Available online: https://geobud.kpi.ua/conference/problemygeoinzhenerii2/ (accessed on 1 May 2019).
  13. Gas and Oil Properties and Correlations (Chapter 3). Available online: http://www.ipt.ntnu.no/~curtis/courses/PhD-PVT/PVT-HOT-Vienna-May-2016x/e-notes/PVT-Papers/SPEPBM-Ch3.pdf (accessed on 1 May 2016).
  14. Simple Equations to Approximate Changes to the Properties of Crude Oil with Changing Temperature. May 2014. Available online: http://www.jmcampbell.com/tip-of-the-month/2014/04/simple-equations-to-approximate-changes-to-the-properties-of-crude-oil-with-changing-temperature/ (accessed on 1 May 2014).
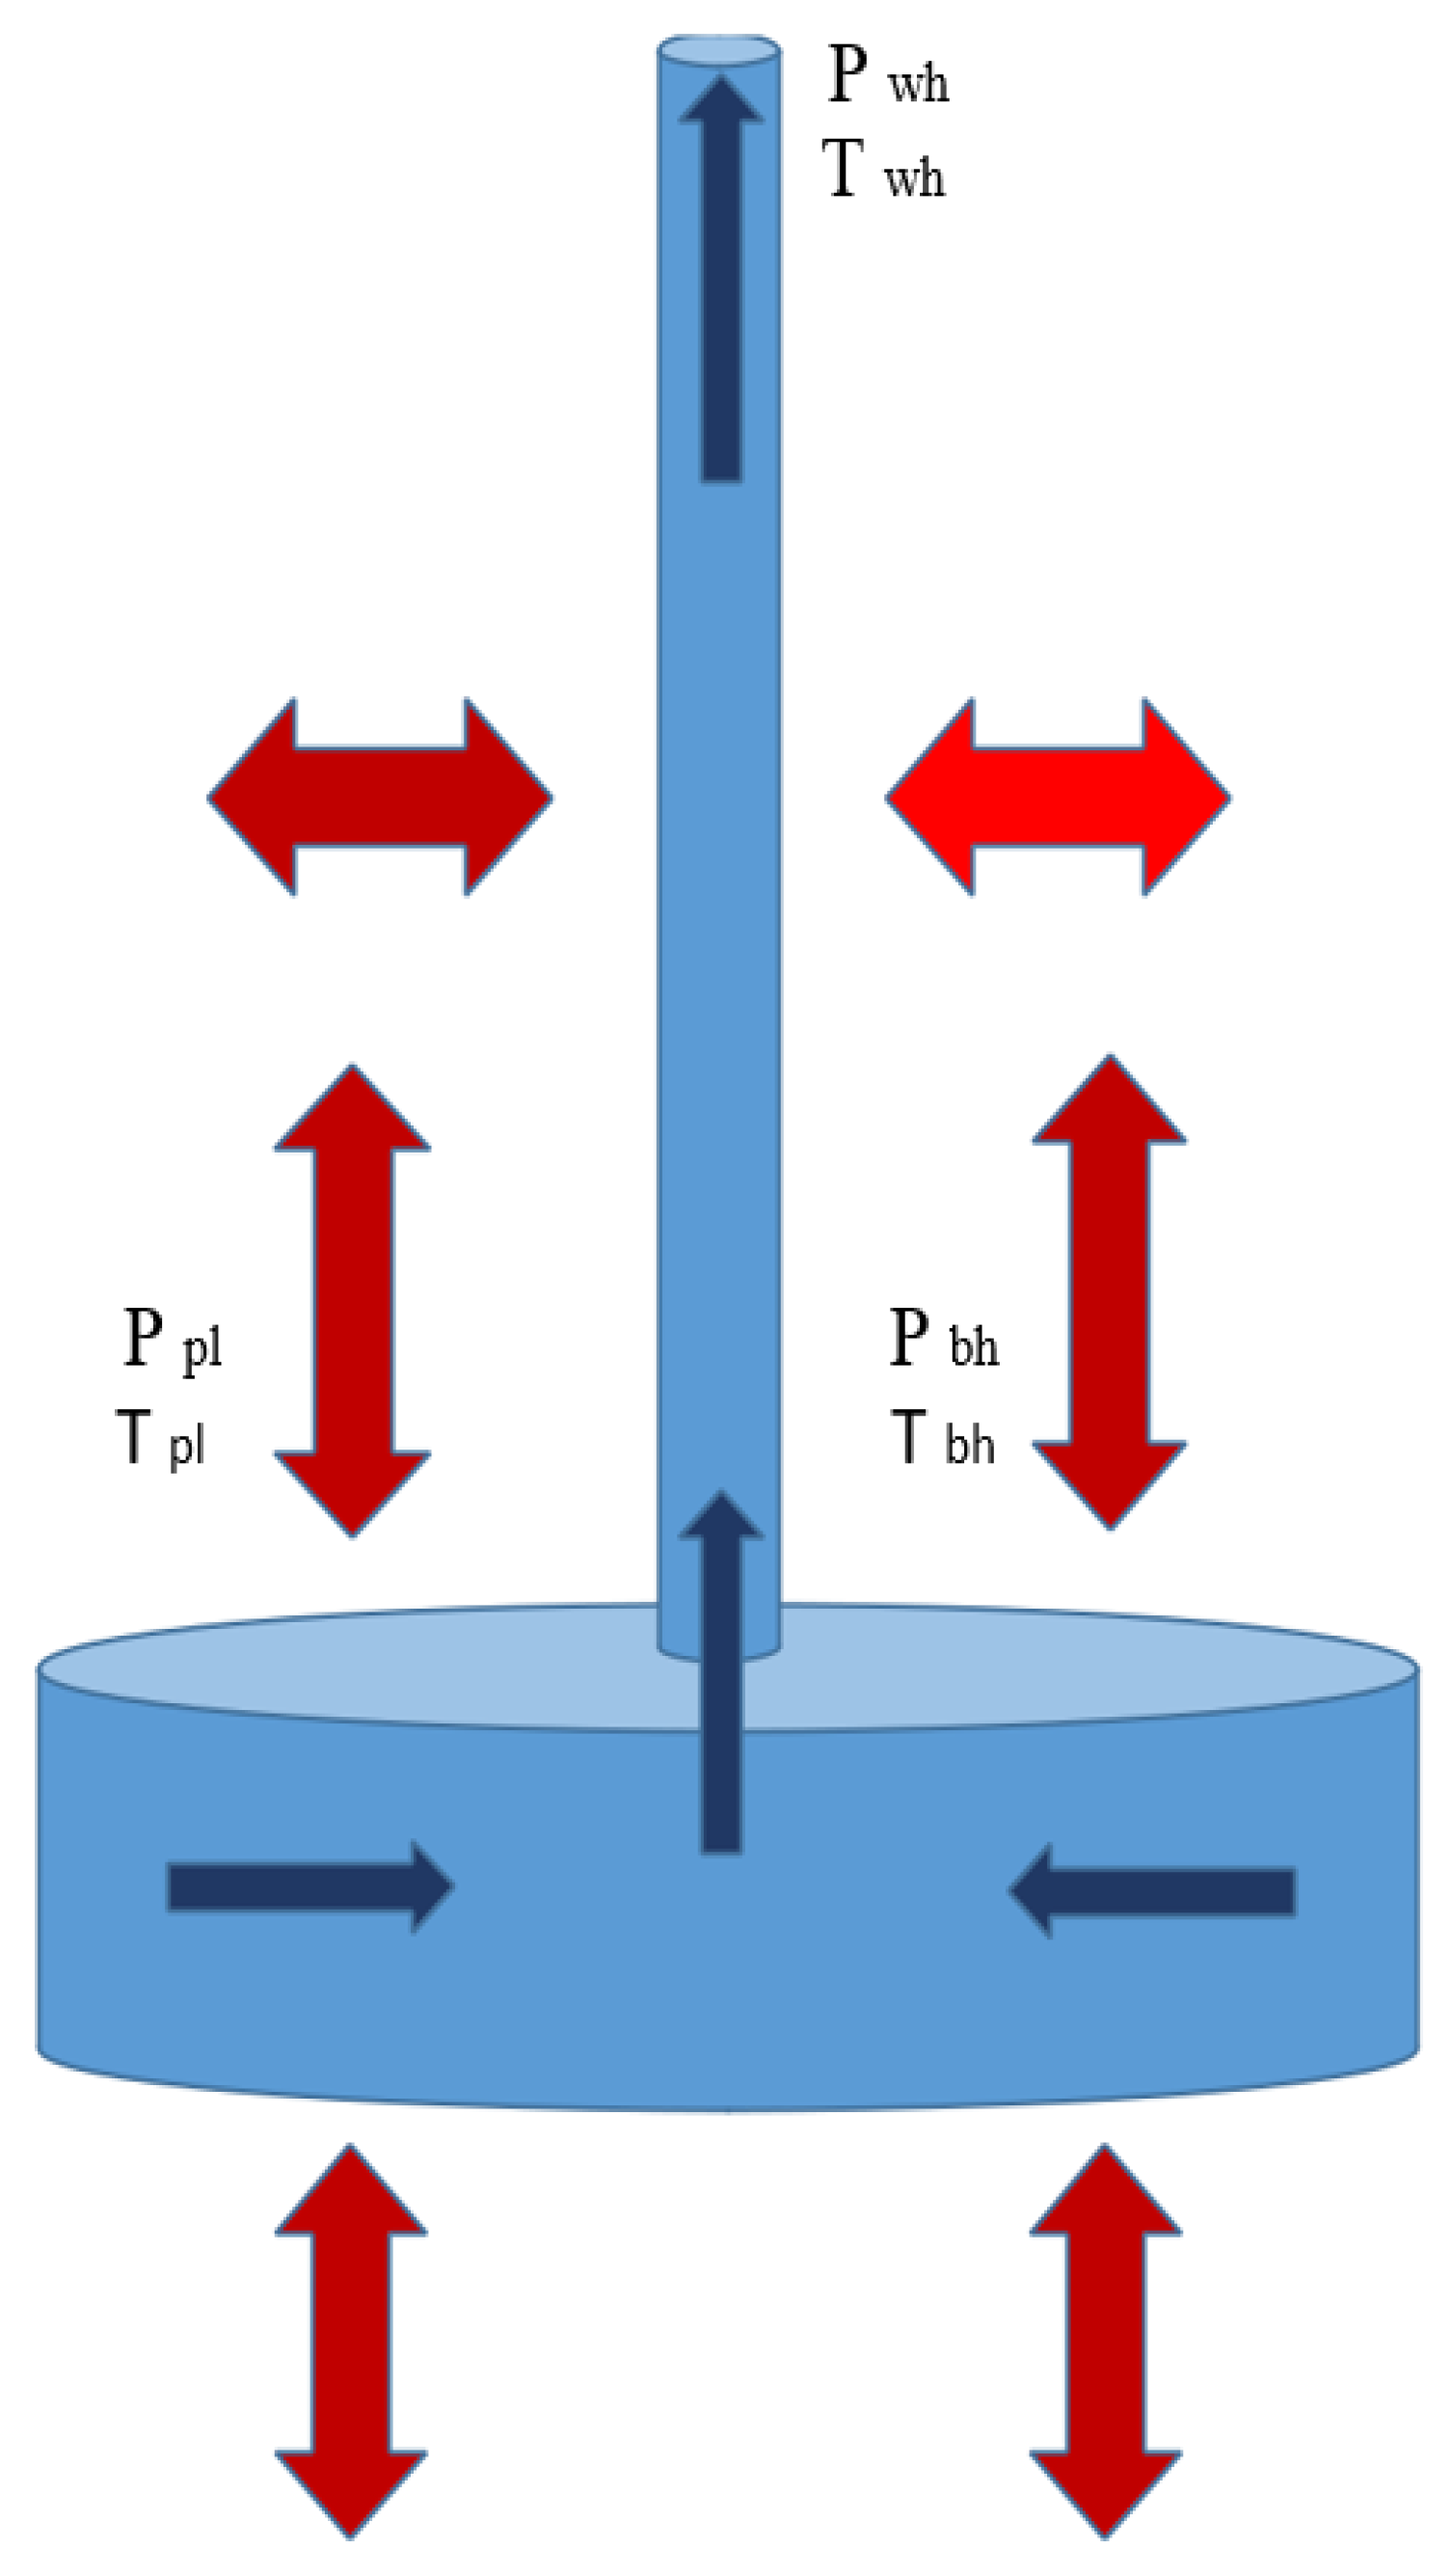
Figure 1. Scheme of motion of the gas condensate mixture and heat exchange with rocks in the system of the reservoir well.
J 03 00011 g001
Figure 2. The dependence of Mq(Ppl) and Twh(Ppl) on the basis of dynamic changes in the thermal conductivity of rocks and the effect of throttling of the extracted fluid.
J 03 00011 g002
Figure 3. The dependence of Dj(P, T).
J 03 00011 g003
Figure 4. The dependence of Mq (Tpl) and Twh (Tpl), taking into account the discrete change in the thermal conductivity of rocks in the range 1–2 W/m2·K.
J 03 00011 g004aJ 03 00011 g004b
Figure 5. Dependence of Mq (Tpl) and Twh (Tpl) taking into account the discrete change of reservoir pressure in the range of 20–30 MPa.
J 03 00011 g005
Figure 6. Isothermal compressibility vs. crude oil gravity (https://petrowiki.org/File:Vol1_Page_284_Image_0001.png)
J 03 00011 g006
Table 1. The nomenclature of parameters and the range of application of their values in the research.
Units NameValue RangeUnits NameValue Range
α: coefficient of thermal expansion of fluid (1/K);0.001B: second coefficients of reservoir filtration resistance (((МPа2)/(Th-nd.m3/day)2)); (0.001–0.005)
β: Coefficient of macro-rigidity of the rock of the productive formation;(2.2)C: constant coefficients of reservoir filtration resistance (МPа2); (0–1000)
βa: Coefficient of elimination of change of thermal conductivity depending on dynamic temperature; (0–1)Сp: specific heat capacity (J/kg·K); 2200–2500
λ: factor of hydraulic resistance; (0.01–0.03)D: pipe diameter (m);0.073
λt: thermal conductivity of material (W/m·K)2d: inside diameter of pipe (m);0.073
μ: dynamic viscosity (Pa·S); 1.00 × 10⁻⁴Dj: Joule-Thomson coefficient (K/MPa); (1–5)
ρ: density (kg/m3); 30F: cross-sectional area (m2); 1
ρs: density under standard conditions (kg/m3); 0.76g: Accelerating gravity (m/s2);(9.8)
φt: nonisothermal correction‘ factor; 0.8H: height (m); 3500
A: linear coefficient of reservoir filtration resistance ((МPа2)/(Th-nd.m3/day)); (0.6–0.9)h: high of layer (m); 100
j, n: degree parameters in the Newselt number equation;0.5Prav: average pressure of rock layer (Pa); (20 × 106–30 × 106)
ke: roughness inside the pipe (m); 0.0003Qw: power – heat flow rate (J/s);
Ka: The coefficient of elimination of the effect of throttling; (0–1)Re: Reynolds number; (10 × 105–10 × 107)
Kt: total heat transfer coefficient (W/m2K); (1–3)Rc: radius off well productive pipe (m); 0.1
Kto: Heat transfer coefficient for primitive geothermal gradients (J/cm2K);(1–4)Rair: gas constant air (J/kg·K); 2870
k: permeability of reservoir layer (m2); 3.00 × 10⁻¹¹Rk: fluid drainage diameter across the reservoir (m);300
ko: coefficient of accommodation; 0.022R: gas constant (J/(kg·К)); 486
Lp: length of pipe (m); 3500Rμ: universal gas constant (J/Kmol·K); 8314
M: molar mass (kg/mol); (17–20)S: skin factor; 0
Mq: mass flow rate (kg/s); (1–6)S1: skin factor for coefficient A; 0
Nu: Nusselt number; 100S2: skin factor for coefficient B; 0
Nng: factor in the fluid flow equation to the well bore; (1–2)Sg: Specific gravity of stock tank oil
P: pressure (Pa); (10 × 105–60 × 106)Trav: average temperature of rock layer (K); (350–360)
P1: pressure absolute the source (Pa); 10,000,000T: temperature (К); (200–400)
P2: pressure absolute the receiver (Pa); 1,000,000Tpl: rock layer temperature (К); 350
Pr: Prandtl number;1Tat: atmospheric temperature (K); 293
Pat: atmospheric pressure (Pa);100,000t: time (s);
Ppc: pseudocritical pressure (Pa); 4.63Е6To: ground temperature (К); (280–400)
Ppl: rock layer pressure (Pa); (15 × 106–50 × 106)Tpc: pseudocritical temperature (K); 198
Pbh: borehole pressure (Pa); 10,000,000V: volume (m3);
Pwh: wellhead pressure (Pa); 1,000,000w: flow velocity of the fluid (m/s); (2–20)
x: distance (m); (0–3500)Δ: specific gravity, relative density;0.59
z: factor of compressibility;(0.85–0.95)ΔH: a difference of heights (m); (0–3500)
zst: compressibility under standard conditions0.9ΔTte: Temperature change of gas condensate fluid in the drained part of the reservoir due to heat exchange (K);0