Article

Effects of Imagery as Visual Stimuli on the Physiological and Emotional Responses

by
Nadeesha M. Gunaratne
,
Claudia Gonzalez Viejo
,
Thejani M. Gunaratne
,
Damir D. Torrico
,
Hollis Ashman
,
Frank R. Dunshea
* and
Sigfredo Fuentes
School of Agriculture and Food, Faculty of Veterinary and Agricultural Sciences, University of Melbourne, Parkville, VIC 3010, Australia
*
Author to whom correspondence should be addressed.
J 2019, 2(2), 206-225; https://doi.org/10.3390/j2020015
Submission received: 23 May 2019 / Revised: 7 June 2019 / Accepted: 10 June 2019 / Published: 12 June 2019

Abstract

:
Study of emotions has gained interest in the field of sensory and consumer research. Accurate information can be obtained by studying physiological behavior along with self-reported-responses. The aim was to identify physiological and self-reported-responses towards visual stimuli and predict self-reported-responses using biometrics. Panelists (N = 63) were exposed to 12 images (ten from Geneva Affective PicturE Database (GAPED), two based on common fears) and a questionnaire (Face scale and EsSense). Emotions from facial expressions (FaceReaderTM), heart rate (HR), systolic pressure (SP), diastolic pressure (DP), and skin temperature (ST) were analyzed. Multiple regression analysis was used to predict self-reported-responses based on biometrics. Results showed that physiological along with self-reported responses were able to separate images based on cluster analysis as positive, neutral, or negative according to GAPED classification. Emotional terms with high or low valence were predicted by a general linear regression model using biometrics, while calm, which is in the center of emotion dimensional model, was not predicted. After separating images, positive and neutral categories could predict all emotional terms, while negative predicted Happy, Sad, and Scared. Heart Rate predicted emotions in positive (R2 = 0.52 for Scared) and neutral (R2 = 0.55 for Sad) categories while ST in positive images (R2 = 0.55 for Sad, R2 = 0.45 for Calm).

1. Introduction

The study of emotional responses from consumers has gained interest in the field of sensory science [1]. The self-reported and physiological responses from consumers towards different types of stimuli (e.g., images) are important perceptual dimensions to be considered. According to the 7-38-55 rule from Sarma and Bhattacharyya [2], 7% of messages are conveyed by verbal communication, 38% by voice intonation, and 55% by body language and facial expressions. As shown in a review on autonomic nervous system (ANS) activity and emotions conducted by Kreibig (2010), the ANS activity has been incorporated as a major component of the emotional responses in many recent theories of emotions. Therefore, the present study identifies the ANS responses in emotions and the self-reported responses of panelists towards visual stimuli.
The Geneva Affective PicturE Database (GAPED) is an image-based repository that consists of 730 images developed by The Department of Psychology of the University of Geneva, Switzerland, to increase the availability of visual emotion stimuli for mental state assessments and emotional responses towards images. It consists of negative, positive, and neutral images [3]. The individual pictures have been rated according to arousal, valence, and the compatibility of the represented scene with respect to external (legal) and internal (moral) standards. The EsSense® profile developed by King and Meiselman [1] is a method used to assess the self-reported emotional responses of consumers towards products by providing a list of emotional attributes. A disadvantage of many verbal self-reported approaches is that it makes the panelists bored and more tired when they make a large number of evaluations per sample [4]. Several studies have been conducted using the self-reported responses of consumers by using questionnaires or through online surveys [5,6]. However, the outputs of these studies can have considerable variability and bias as the self-reported responses may differ from one individual to another, mainly based on the personal judgement and oral expressions from individuals [7]. Self-reported responses of consumers are considered as indirect measurements of sensory experiences [8]. Thus, self-reported responses do not always represent consumer attitudes and preferences. This arouses the need for more research conducted using physiological responses to understand consumer implicit reactions. ANS activity may help explain a different dimension of the emotional experiences of consumers [9].
Biometric techniques are commonly used to identify people based on their unique physical and biological characteristics. They are used to verify the identity of an individual by using one or more of their personal characteristics [10]. Heart rate (HR), skin or body temperature (ST or BT), skin conductance (SC), eye pupil dilation (PD), and finger prints (FP) are some of the most familiar biometrics. On the other hand, FaceReader™ (Noldus Information Technology, Wageningen, Netherlands) is a software that analyzes facial expressions of participants via the detection of changes in their facial movements and relates them to emotions using machine learning models. FaceReader™ has been trained to classify facial changes to obtain intensities of eight emotions: (i) happy, (ii) sad, (iii) angry, (iv) surprised, (v) scared, (vi) disgusted, (vii) contempt, and (viii) neutral [11]. When compared to most biometric systems, such as the use of sensors in direct contact with the bodies of participants, face recognition for facial expressions analysis has the advantage of being a non-invasive process based on the video analysis of participants [12]. There have been recent studies conducted using FaceReader™ to evaluate images to obtain human emotions. For example, Ko and Yu [13] and Yu [14] studied facial expressions to understand the emotional responses towards two sets of images, with and without shading and texture. It was used as a guide for graphic designers to establish emotional connections with viewers by using design elements to reflect consumers interests.
Regarding other biometric techniques, different studies and discussions on how Skin Temperature (ST) affects emotions of humans show contradicting results. According to Barlow [15], decreases in ST were associated with anxiety, fear, tension, and unpleasantness. However, studies conducted by Cruz Albarran et al. [16] found that the ST was lower with joy and higher when angry and disgusted. Furthermore, Brugnera, et al. [17] concluded that the Heart Rate (HR) and ST decreased during experiences of happiness and anger. Also, according to studies conducted by Kreibig [9], fear, sadness, and anger were associated with lower ST. The HR is another biometric technique that can be correlated with emotions, as stress can increase blood pressure (BP, systolic pressure (SP) and diastolic pressure (DP)) [18]. There are several views on HR and BP towards emotional experiences. It has been found that the pleasantness of stimuli can increase the maximum HR response, and HR decreases with fear, sadness, and happiness [18]. Dimberg [19] concluded that the HR decreased during happiness and anger. Studies conducted by McCaul et al. [20] have shown that fear increased the HR of subjects. Ekman et al. [21] used some emotions to collect details about the physiological measures. They concluded that happiness, disgust, and surprise showed lower HR, while fear, anger, and sadness showed higher HR. de Wijk et al. [22] concluded that liking scores were positively correlated with increases in HR and ST. The measurement of BP is mostly used in medical research and is limited in studies used as a physiological response to associate emotions [23]. However, a study conducted by Barksdale et al. [24] on racial discrimination using black Americans showed that BP was negatively correlated with sadness and frustration.
Due to the high discrepancy in the results of previous research, the present study focused on both physiological and self-reported responses measured using FaceReader™, HR, SP, DP, and ST combined with a simplified face scale measurement and the EsSense profile®, respectively. The main objective was to understand differences in the self-reported and physiological responses towards the perception of positive, neutral, and negative images by consumers. The specific objective was to predict the self-reported responses using significant biometric parameters. Results showed that physiological along with self-reported responses were able to separate images based on cluster analysis as positive, neutral, and negative according to GAPED classification. Emotional terms with high or low valence were predicted by a general linear regression model using biometrics, while calm, which is in the center of emotion dimensional model, was not predicted.

2. Materials and Methods

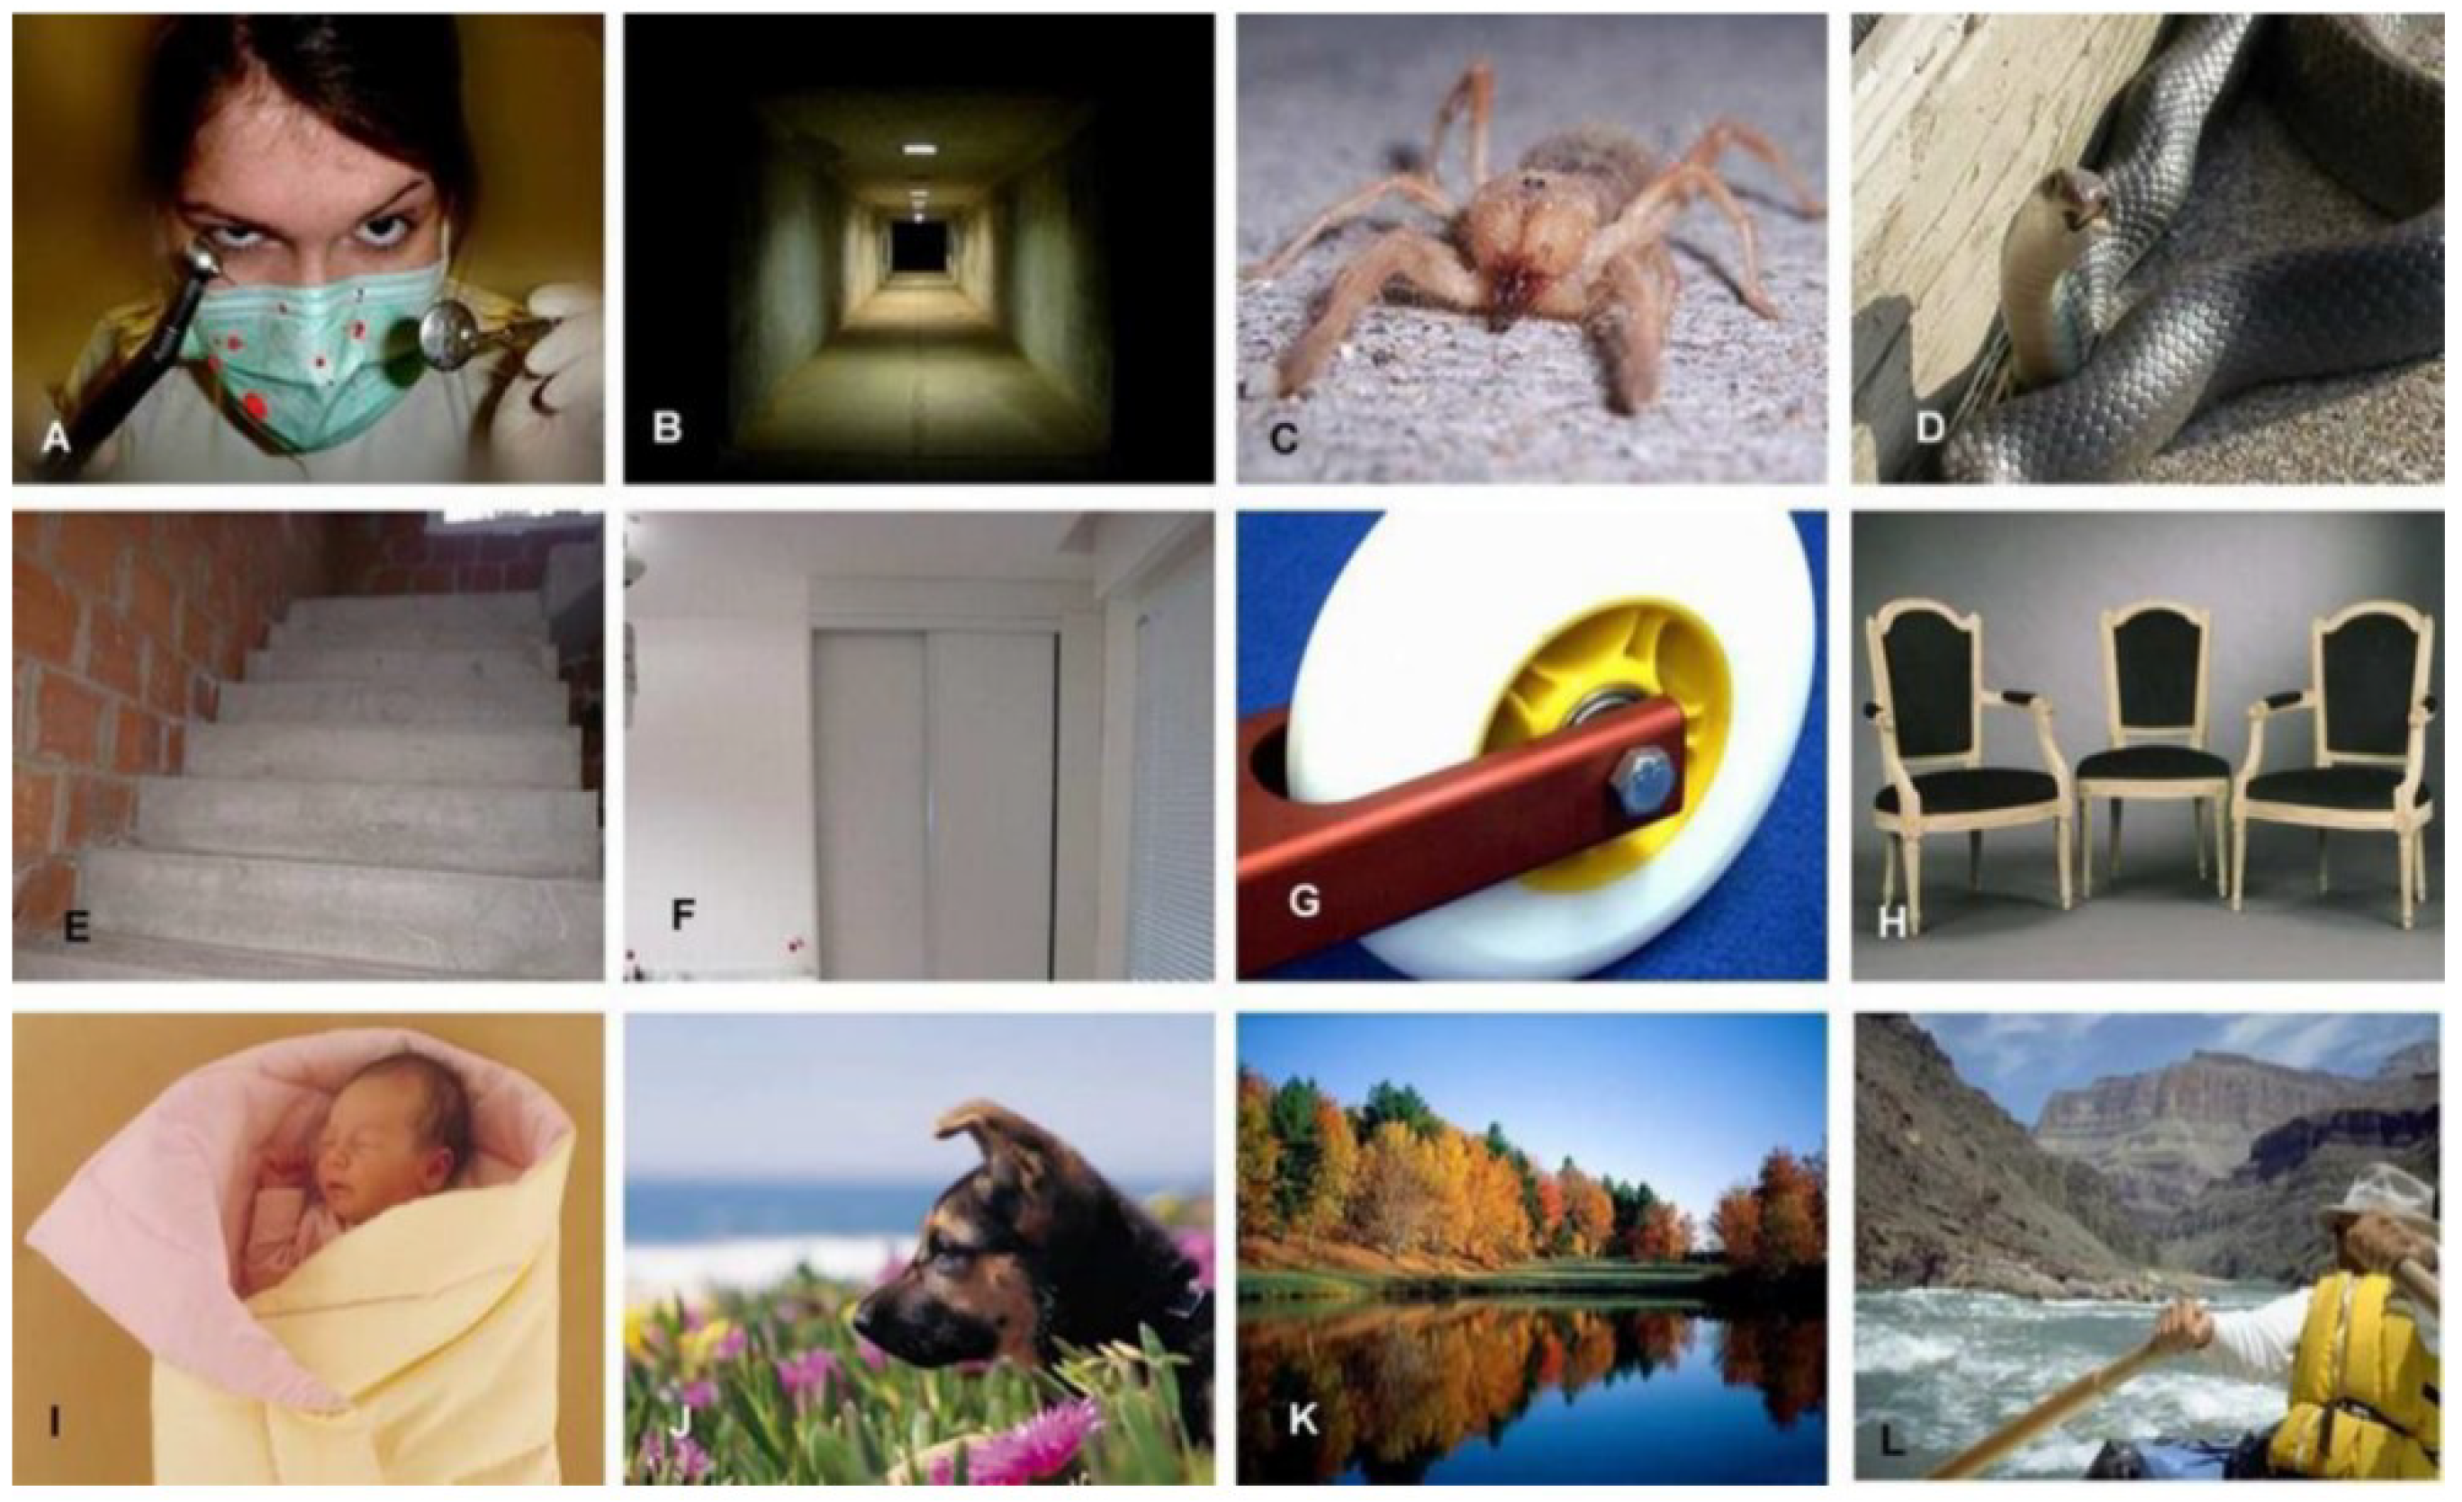
2.1. Participants and Stimuli Description

Panelists were recruited from the staff and students at The University of Melbourne, Australia, via e-mail. A total of N = 63 participants from different nationalities attended the session; however, due to issues with the video and thermal image quality (incorrect position of the participants), only 50 participants between 25–55 years old were used for the analysis. Panelists received chocolate and confectionary products as incentives for their participation in the study. According to the Power analysis (1 − β > 0.999) conducted using SAS® Power and Sample Size 14.1 software (SAS Institute Inc. Cary, NC, USA), the sample size of 50 participants was enough to find significant differences between samples. The experimental procedure was approved by the Ethics Committee of the Faculty of Veterinary and Agricultural Sciences at The University of Melbourne, Australia (Ethics ID: 1545786).
A total of 12 images (the number of images were decided as 12 to avoid fatigue from panelists by exposing to too many stimuli)—ten from GAPED and two chosen based on common fears, four from each emotion, positive, neutral and negative—were selected as stimuli, based on the valence and arousal scores proposed by Dan-Glauser and Scherer [3] using continuous scales ranging from 0 to 100 points for valence and arousal scores. From the latter reference, the images defined as positive were rated above 71 points and negative below 64 points for the valence scores. The values in-between (40–69) were considered as the neutral images. Neutral pictures were slightly above the scale midpoint. This may be due to the relative comparison with many negative pictures. Regarding arousal ratings, neutral (below 25) and positive (below 22) images obtained relatively low values. Negative images had mildly arousing levels ranging from 53 to 61. Due to ethical reasons, the panelists could not be exposed to extreme negative images, so as a result the other two negative images were selected from a previous study [25]. The images were displayed on a computer screen (HP Elite display, E231 monitor, Palo Alto, CA, USA) with a 1080 × 1920-pixel resolution for 10 s each (Figure 1). The order of images exposed to panelists was positive, neutral, and negative, respectively, to avoid the contrast effect of changing form one extreme condition to another. During the recruitment, panelists did not know about the study. However, prior to the experiment, panelists attended a briefing session in which they were asked to sign a written consent form to acknowledge video recording and instructed with the experimental steps of the session as per ethical approval requirements.

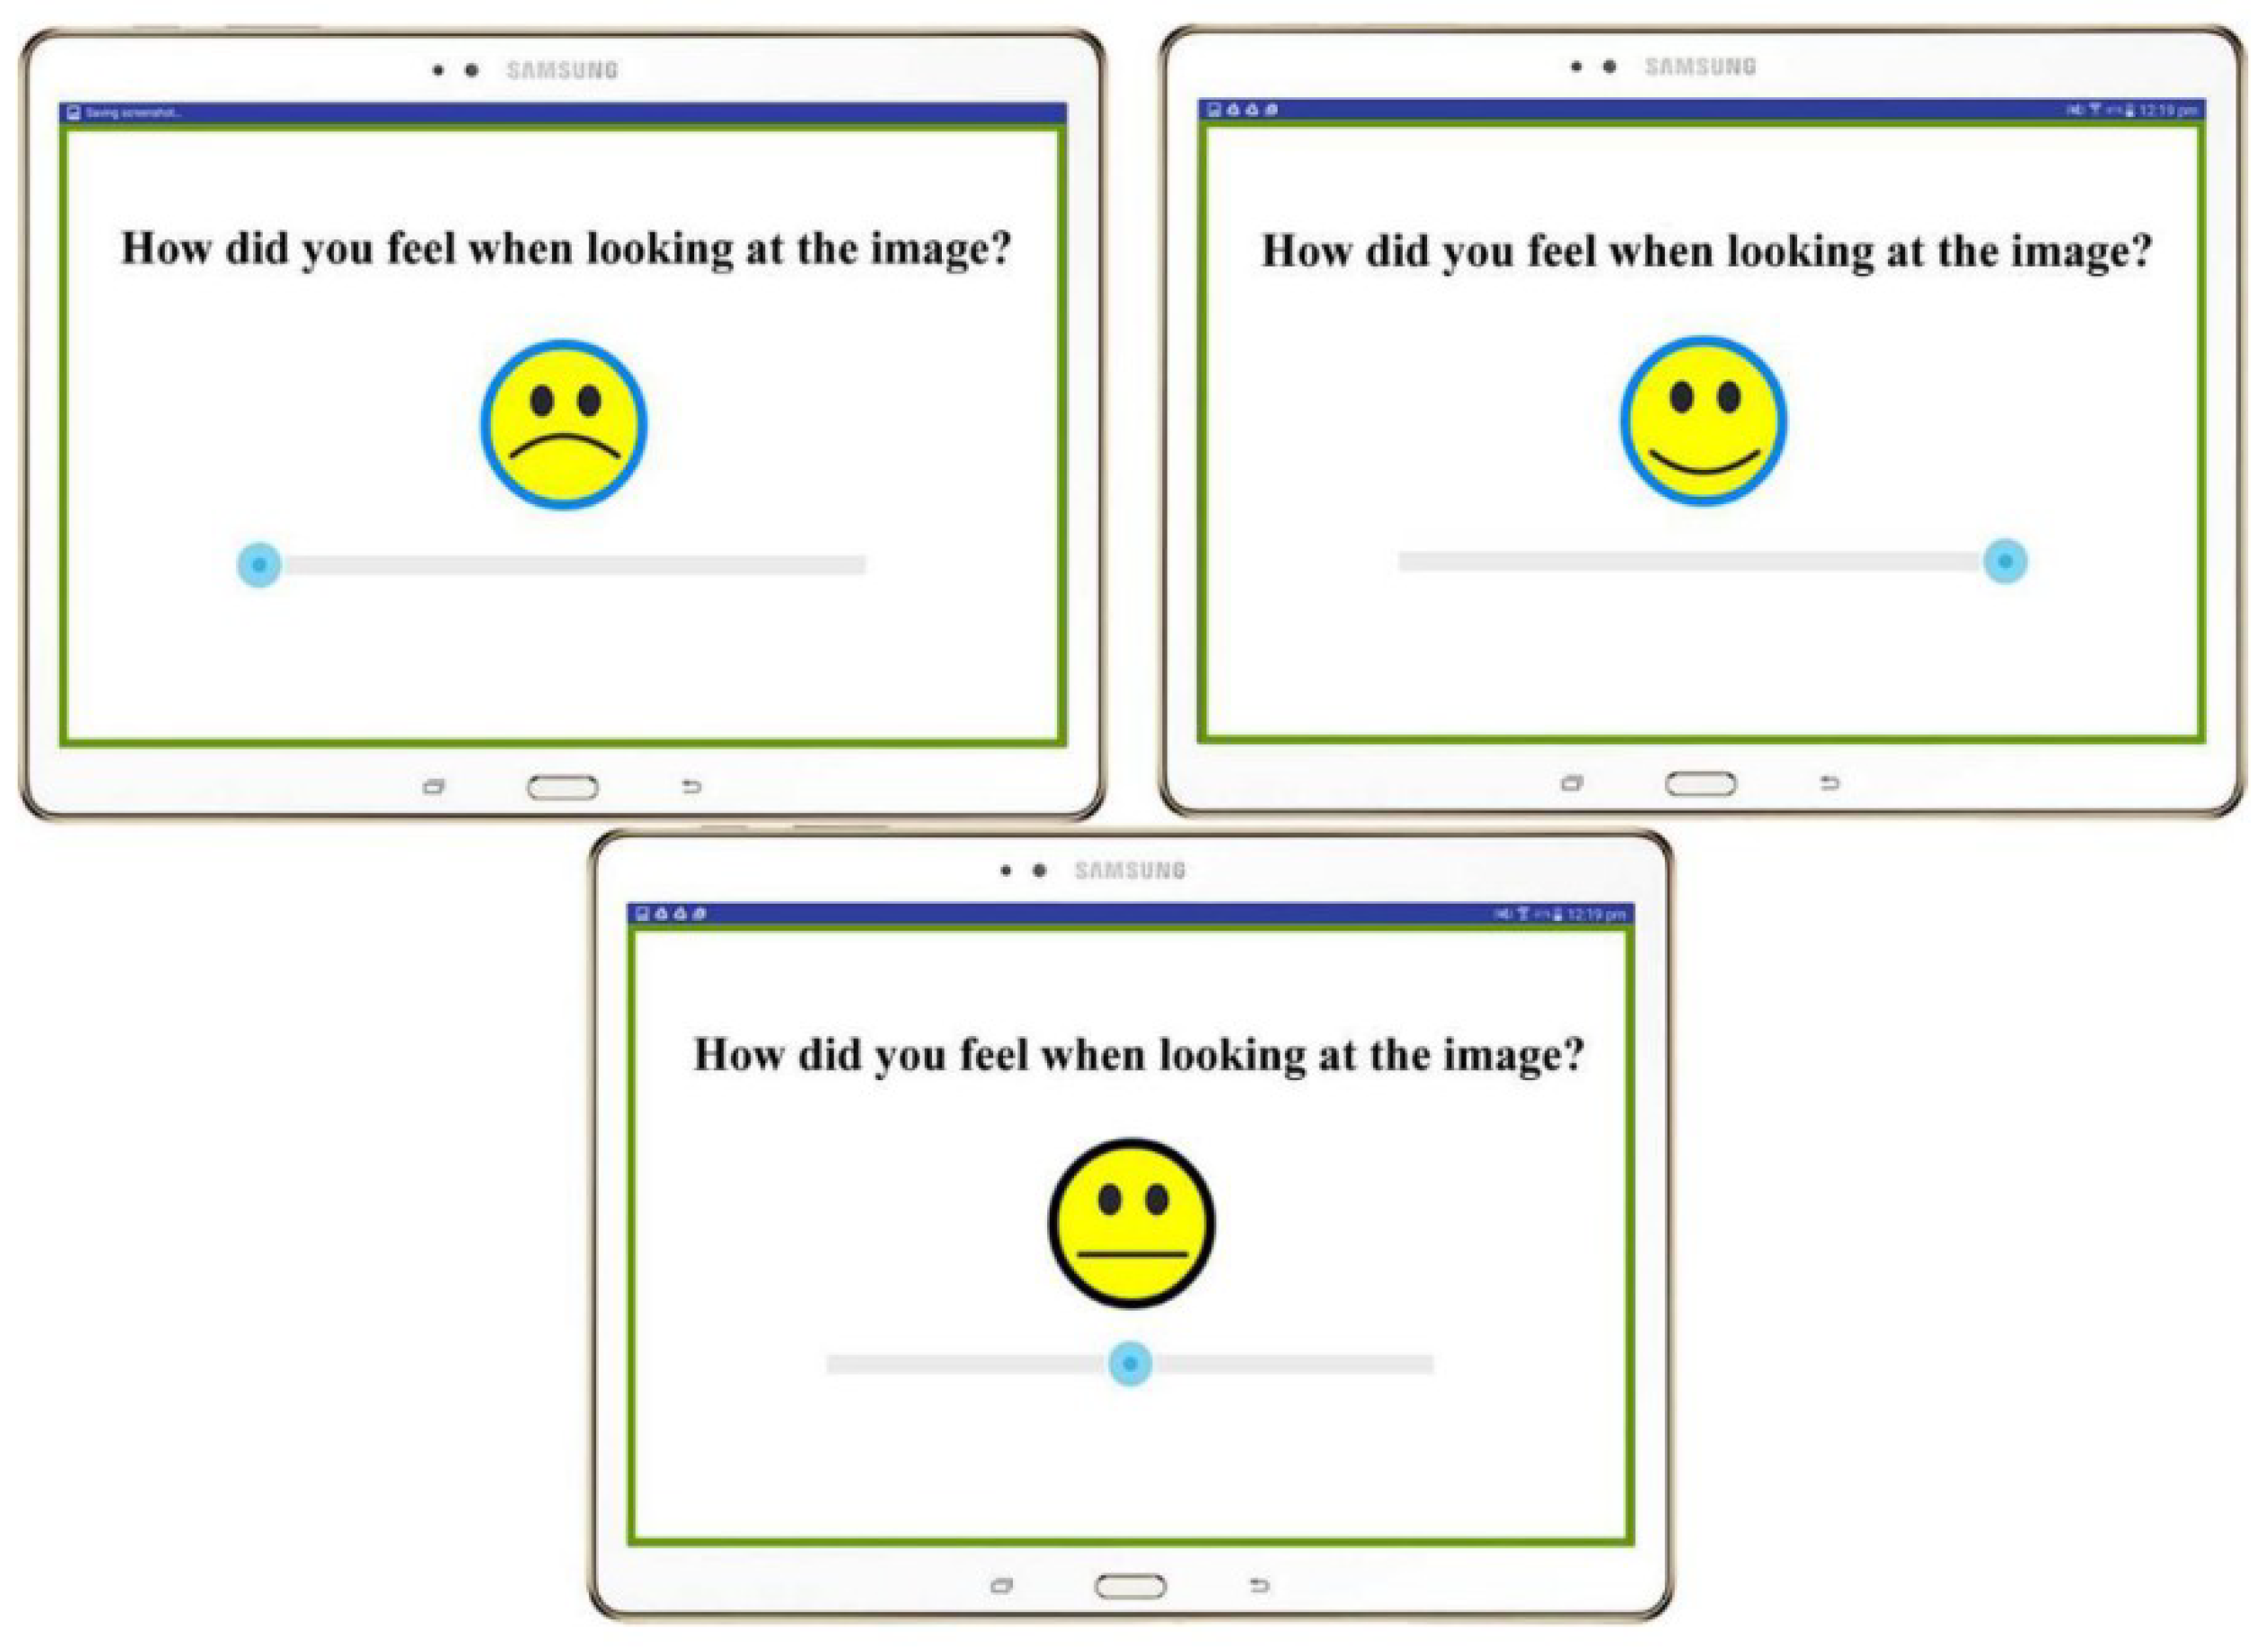
2.2. Sensory Session and Self-reported Response Acquisition

The study was conducted using individual portable booths in a conference-type room, which isolated the panelists, and there was no interaction between them. Each booth contained a Hewlett Packard (HP) computer screen (Hewlett Packard, Palo Alto, CA, USA) to present the images, a video camera Point 2 View USB Document Camera (IPEVO Sunnyvale, CA, USA) to record videos from participants during the session, a FLIR ONE (FLIR Systems, Wilsonville, OR, USA) infra-red camera (thermal resolution 80 × 60, ±2 °C/ ±2% accuracy, sensitivity 0.1 °C) to obtain thermal images, and a Samsung tablet PC (Samsung, Seoul, South Korea) displaying a bio-sensory application (App) that is capable of showing the sensory questionnaire and collating the data from each participant, which was developed by the sensory group from The University of Melbourne. Participants were seated 30–40 cm from the cameras, and room temperature was within 24–25 °C, which is within the temperature range that the infrared thermal camera operates normally (0–35 °C).
Panelists were asked to observe the images for 10 s and immediately after, respond to a questionnaire in the bio-sensory App [26]. The sensory form consisted of two types of questions: (i) a simplified version of the face scale used for tests with children [27] consisting of a 15-cm continuous non-structured face scale and with no anchors showing faces that changed from very sad to very happy, passing through the neutral state (Figure 2); and (ii) EsSense profile® questions using a 5-points scale categorized as: 1 = “Not at all”, 2 = “Slightly”, 3 = “Moderately”, 4 = “Very”, and 5 = “Extremely”. The reason for using a modified face scale from that used with children was because it is easier for consumers to reflect their emotions with the face when they are looking instead of using words, and this also avoids the use of more than one scale to assess positive, neutral, and negative scales separately [25]. Further, the EsSense profile® scale was used for five emotion-based words (sad, scared, calm, peaceful, and happy). The emotion-based words happy (HappyEs), peaceful (PeacefulEs), sad (SadEs), and scared (ScaredEs) were selected from the EsSense profile® as they best represent the emotions obtained by the FaceReader™ 7 (Noldus Information Technology, Wageningen, Netherlands); furthermore, each selected term represents an area of the arousal-valence dimension—happy has a high valence and high arousal, sad has a low valence and low arousal, peaceful is high valence and low arousal, and scared has low valence and high arousal. On the other hand, calm (CalmEs) was selected as the closest to represent the neutral emotion from the FaceReader™ as its valence and arousal scores place this term in the center of the two-dimensional (arousal versus valence) emotions model according to Jun et al. [28] and Markov and Matsui [29]. There was a five second blank screen before the panelist was exposed to the next image.

2.3. Video Acquisition and Facial Expressions Analysis

Videos from each participant were recorded during the whole session and post-processed by cutting 12 shorter videos from the parts in which the participant was looking at the stimulus. These videos were further analyzed in FaceReader™ using the default settings. Two different models were used for facial expressions analysis: The East Asian model for the Asian participants, and the General model for Non-Asians, as recommended by the software manufacturer (Noldus Information Technology, 2016). The outputs from FaceReader™ consist of eight emotions: (i) neutral, (ii) happy, (iii) sad, (iv) angry, (v) surprised, (vi) scared, (vii) disgusted and (viii) contempt on a scale from 0 to 1, two dimensions (ix) valence and (x) arousal on a scale from −1 to 1, head orientation in the three axes (xi) X (Xhead), (xii) Y (Yhead), and (xiii) Z (Zhead), (xiv) gaze direction (GazeDir; −1 = left; 0 = forward; 1 = right), and five facial states (xv) mouth (0 = closed; 1 = opened), (xvi) left eye and (xvii) right eye (0 = closed; 1 = opened), (xviii) left eye brow, and (xix) right eyebrow (−1 = lowered; 0 = neutral; 1 = raised). Each emotion was averaged and summed, this value was taken as 100%, then the percentage of each emotion was calculated ( p e r c e n t a g e   o f   e m o t i o n   =   a v e r a g e   e m o t i o n   s u m   o f   a v e r a g e   a l l   e m o t i o n s ) ; for the two emotional dimensions and head orientation movements the maximum value was used, while for the face states the mean values were obtained due to the nature of the data, which, as previously explained, was transformed to 0 and 1.
Images obtained using FLIR ONE™ infra-red thermal camera and the radiometric data files in comma separated values format (csv) obtained using FLIR Tools™ (FLIR Systems, Wilsonville, OR., USA) were processed using Matlab® R2018b (MathWorks, Inc., Natick, MA, USA) with a customized algorithm that is able to automatically detect the area of interest (rectangular area including both eyes) using the cascade object detector algorithm [30] to extract the maximum temperature value (°C) of each image [25,31]; the average of the maximum value extracted from all images of the participant that corresponded to the same sample was used for further analyses. The videos captured were analyzed using the raw video analysis method (RVA) using customized codes written in Matlab® R2018b. The videos were manually cropped to analyze forehead, right cheek, and left cheek of panelists to obtain a higher accuracy. The areas of the cropped rectangles were in the range of 120–150 × 50–70 pixels for forehead and 50–80 × 60–90 pixels for each of the cheeks. These Areas of Interest (AOIs) were selected because these are the areas in which there is higher blood flow, and therefore the heart rate measurement has higher accuracy [23,32]. The outputs obtained from this method were the average and standard deviation values for the HR, Amplitude, and Frequency of forehead, right cheek, and left cheek. These results were further processed using machine learning models developed using Levenberg-Marquardt backpropagation algorithm with high accuracy (R = 0.85) [23] to obtain HR, SP, and DP. The biometrics presented in this paper do not have a medical grade but are accurate enough to compare differences and find changes between participants [23,25,31,33,34,35].

2.4. Statistical Analysis

Multivariate data analysis based on principal components analysis (PCA), cluster analysis, and correlation matrix (CM) were developed for the data from the self-reported responses along with the FaceReader™ outputs, HR, ST, SP, and DP using a customized code written in Matlab® (Mathworks Inc., Natick, MA, USA) to assess relationships (PCA) and significant correlations (CM; p-value < 0.05) among the different parameters [25]. Furthermore, data from the self-reported responses and biometrics (facial expressions, HR, SP, DP, and ST) were analyzed for significant differences using Analysis of variance (ANOVA) for the effect of images nested within the classification group and the least squares means post-hoc test (α = 0.05) in SAS® software 9.4 (SAS Institute Inc. Cary, NC, USA). Multiple regression analysis using Minitab® 18.1 software was used to obtain predictions of self-reported responses towards stimuli using the physiological (biometric) responses as predictors. A general model was developed using all positive, neutral, and negative images selected for the study, while three other models as positive, negative, and neutral were developed specifically for each image category. A forward selection stepwise procedure (α = 0.05) was used to obtain a model in each case. Physiological responses that were not significant for a given condition were not considered as potential predictors. The aim of this step was to determine which self-reported response may be best predicted using biometrics.

3. Results

3.1. Self-reported and Biometric Responses

The ANOVA results for the effects of the images nested within each group (positive, neutral, and negative) showed that significant differences were found for all the self-reported responses except for SadEs. As shown in Table 1, all negative images had low and similar responses for face scale and were significantly different to neutral and positive images. Among the neutral images, for face scale, “stairs” was rated significantly different and with lower scores than “chairs” and “wheel”, but similar to “door”. On the other hand, from the positive images, “nature” was rated with the highest face scale score and showed significant differences with “baby” and “boat”, with the latter being the lowest rated from this group. For HappyEs all images from the negative and neutral groups were rated with low values (1.15–1.90) between “not at all” and “slightly” happy, while positive images were rated between “moderately” and “very” happy (3.21–3.98). Most of the images within the groups presented significant differences, such as between “nature”, and “baby” and “boat”, between “chairs”, “stairs” and “wheel”, and “door”, but not within the negative images. The negative images presented the highest scores for ScaredEs (2.92–3.54; “slightly” to “very” scared) and with significant differences between “snake”, and “dark hole” and “dentist”. On the contrary, neutral and positive images were rated as “not at all” to “slightly” scared (1.04–1.77); however, there were also significant differences between the images within each group, such as “stairs” being a different image from the neutral group and “boat” within the positive images. For CalmEs, the negative images were rated as “not at all” to “slightly” calm (1.25–1.67), while the neutral group images were scored as “slightly” to “moderately” calming (2.20–2.44) and the positive images as “slightly” to “very” calming. However, there were non-significant differences between all neutral images and “boat”, but the latter was significantly different to “baby”, “dog”, and “nature” (Table 1). PeacefulEs obtained similar results as CalmEs, with slightly lower scores for the negative and neutral images and slightly higher for the positive group.
The ANOVA results for the effects of the images nested within each group (positive, neutral, and negative) on the biometric responses showed non-significant differences in HR, SP, DP, ST, and facial expressions for all images (Table 2). The emotion “neutral” had the highest emotion intensity (0.42–0.47) towards all images compared to other emotions (0.04–0.27). The image “baby” obtained significantly higher scores (p < 0.05) for the left eye (0.34) and right eye (0.33) movement when compared to “spider” (0.13, 0.13), “chairs” (0.13, 0.14), “wheel” (0.11. 0.12), and “nature” (0.13, 0.11) respectively.

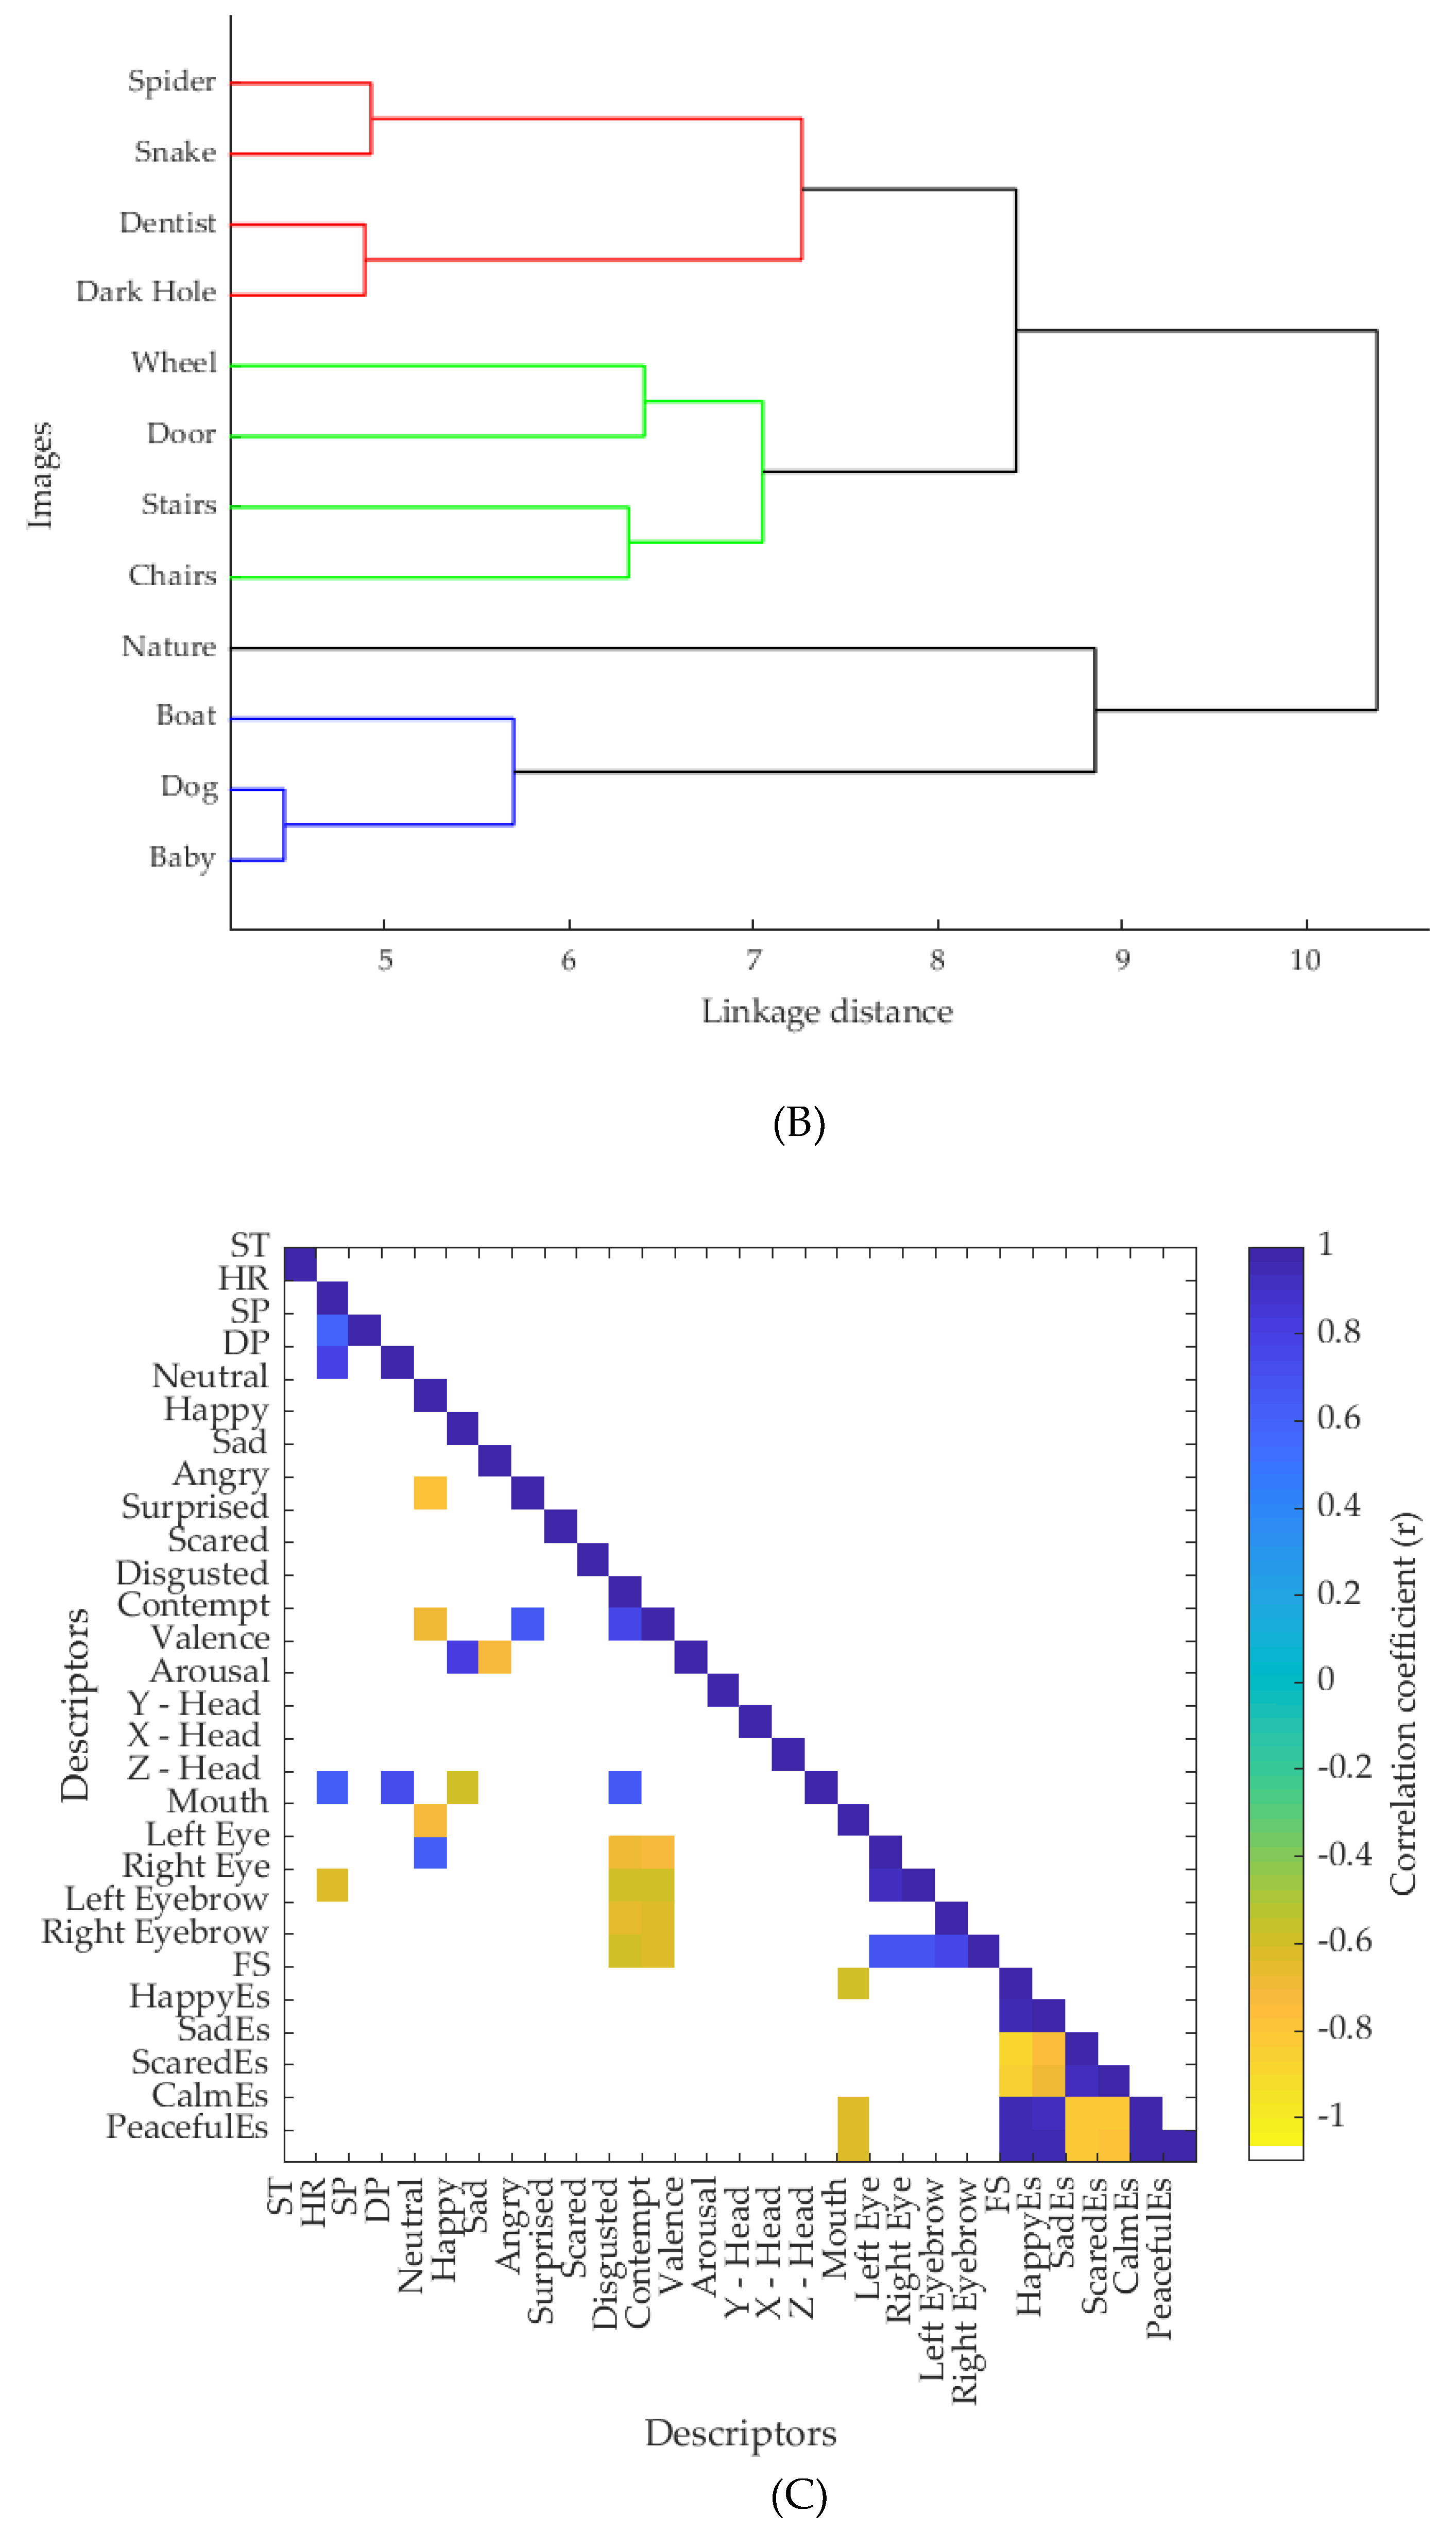
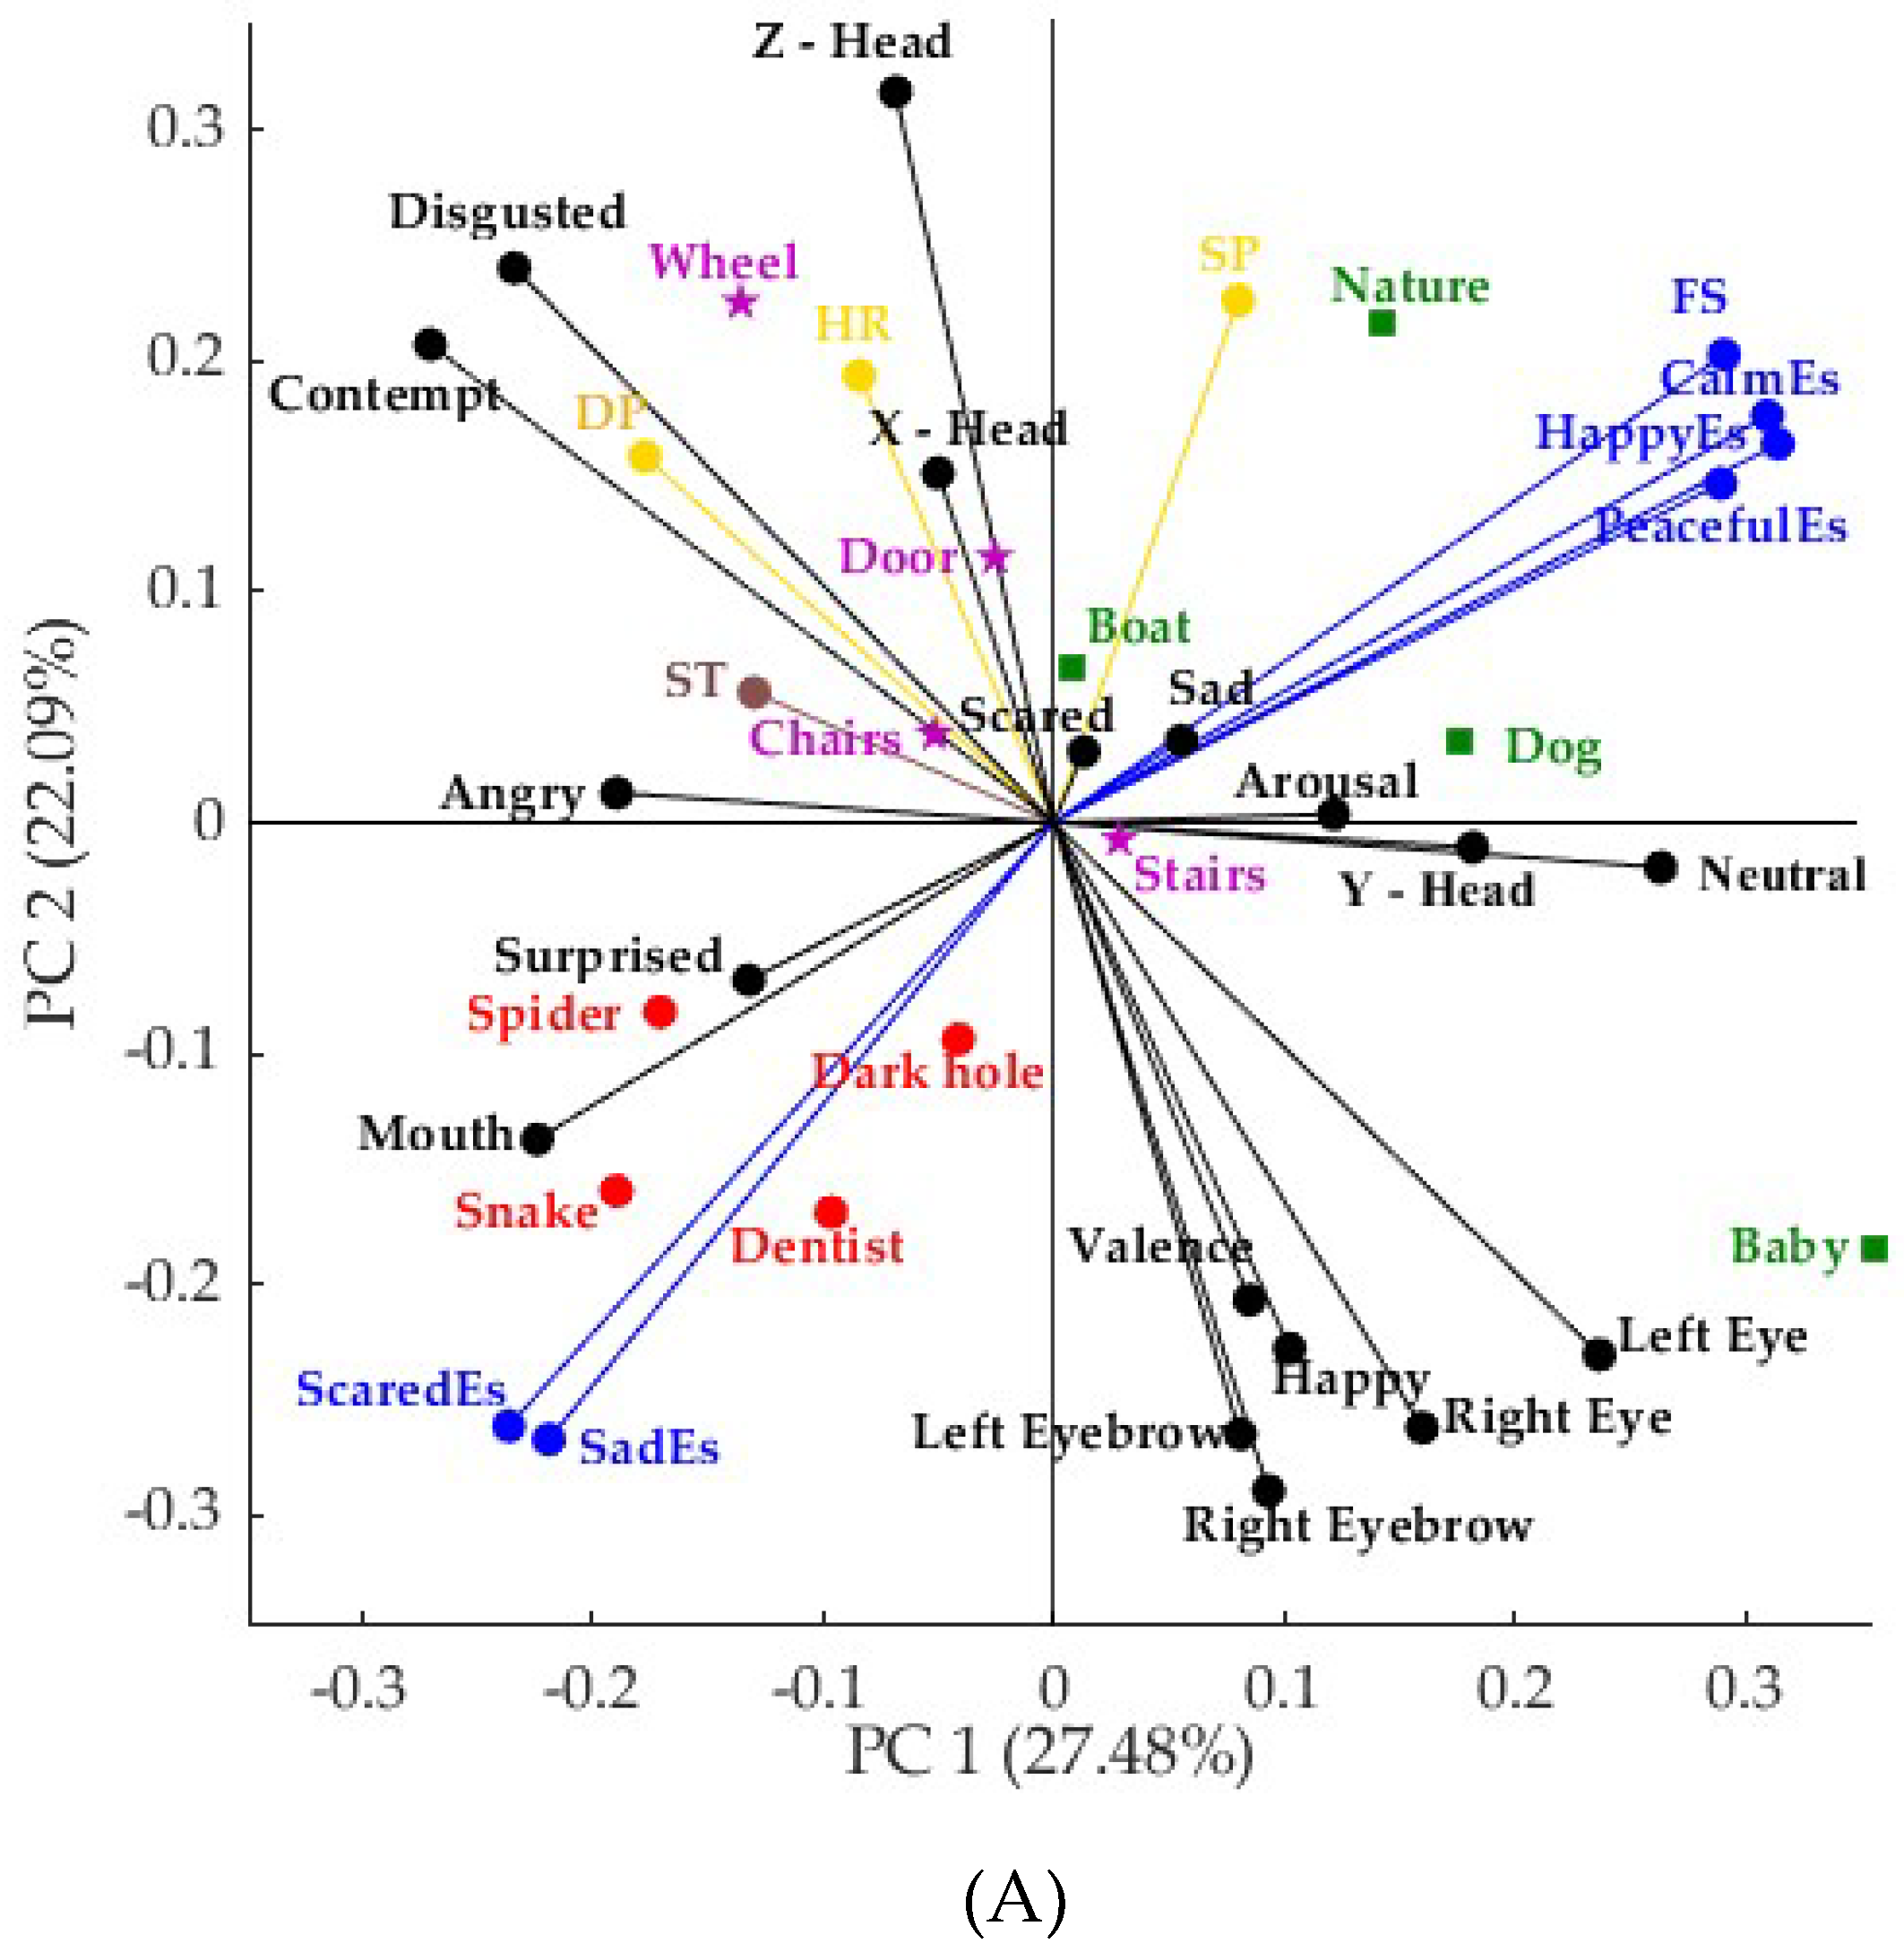
3.2. Multivariate Data Analysis and Correlations (Self-reported and Biometric Responses)

Figure 3 shows results from the Principal components analysis (PCA), cluster analysis, and correlation matrix (CM) for all participants using FaceReader™ results, HR, SP, DP, ST, and the self-reported responses. In the PCA (Figure 3a), the principal component one (PC1) explained 27.48% of data variability, while principal component two (PC2) accounted for 22.09%, hence it explained 49.57% of total data variability. The low total variability of the PCA could be due to the anomalous behavior observed by exposing the same panelist to extreme types of images (positive, negative, and neutral) [36]. The cluster analysis (Figure 3b) shows that based on the self-reported and biometric responses, there was a clear separation of three groups of images (positive, neutral, and negative), as expected. On the other hand, Figure 3c shows the CM, in which a positive and significant correlation was found between Valence and Happy facial expression (r = 0.84) and a negative correlation between Happy facial expression and ZHead (r = −0.59). Furthermore, ZHead had a positive correlation with disgusted (r = 0.66), HR (r = 0.63), and DP (r = 0.71). Both disgusted and contempt showed negative correlations with left eye (r = −0.69; r = −0.74) right eye (r = −0.60; r = −0.60), left eyebrow (r = −0.66; r = −0.62), and right eyebrow (r = −0.60; r = −0.64). Mouth had a negative correlation with Face Scale (FS; r = −0.58), with CalmEs (r = −0.61), and with PeacefulEs (r = −0.63). Right eye was negatively correlated with HR (r = −0.63). Right eyebrow was positively correlated with left eye, right eye, and left eyebrow (r = 0.68; r = 0.68; r = 0.76). Neutral was positively correlated with left eye (r = 0.63) and negatively with mouth (r = −0.72).

3.3. Regression Analysis (General Linear Model) Predicting Self-Reported Responses Using Biometrics

Multiple linear regression was built using all images (positive, negative, and neutral), which was considered as the general model. Three other specific models were built for each of the three image categories (positive, negative, and neutral). As shown in Table 3, the self-reported responses can be predicted using biometrics using multiple linear regression. None of the physiological responses were used as potential predictors in developing the general linear model for the term CalmEs. The face scale score significantly decreased when the panelists showed “surprise” as a facial emotion. Scores for HappyEs reduced significantly with valence and increased with Y-Head orientation, which is a vertical movement of the head. The score for SadEs was reduced significantly with gaze direction towards left, while the score for ScaredEs was reduced with panelists showing a “neutral” facial expression. PeacefulEs can be predicted by the “surprised” facial expression, gaze direction, and Y- head movement, where the latter increased PeacefulEs, while the other two factors significantly reduced the specific response.
When considering positive images separately, FS was increased significantly with the facial expression “disgust” and raise of left eyebrow. The score for HappyEs could be predicted by increase in valence, opening of left eye, and raise of left eyebrow. The score for SadEs increased with increases in ST and approaching towards the image. The score for ScaredEs emotion could be predicted by decrease in HR, closing of mouth, and lowering of right eyebrow. The score for PeacefulEs increased with vertical head movement, while the score for CalmEs was associated with lower ST, valence, and moving away from the image.
While evaluating neutral images, FS increased when approaching towards the image and closing of left eye. Scores for both HappyEs and PeacefulEs increased with X-Head, while the score for PeacefulEs could also be predicted with lowering right eyebrow. The score for SadEs decreased the HR, while ScaredEs increased with “scared” facial expression. Scores for CalmEs could be predicted by lowering neutral facial expression.
The emotions HappyEs, SadEs, and ScaredEs obtained from self-reported responses could be predicted using facial expressions when evaluating negative images. Score for HappyEs increased with neutral facial expression, while scores for both SadEs and ScaredEs decreased with “neutral” facial expressions. The score for SadEs increased with scared facial expression, while the score for ScaredEs increased with opening left eye.

4. Discussion

4.1. Self-reported and Biometric Responses

From the ANOVA of self-reported responses, it could be observed that “snake” was the image rated as most negative (Face Scale) and scariest (ScaredEs), with significant differences in the latter response with “dentist” and “dark hole”, which coincides with a previous study that found “snake” as a universal fear [37]. From the neutral images, the “stairs” was the lowest in rating for face scale and significantly different to “chairs” and “wheel”, which means it is less neutral than those other images within the same group. This coincides with the results obtained in the GAPED study, in which “stairs” was the lowest in valence scores (45.53) compared to “wheel” (60.20), “chairs” (50.17), and “door” (49.07) [3].
For the positive images, “boat” had the lowest scores and presented significant differences with “nature”, and the latter with “baby” for both face scale and HappyEs, which means that “nature” was the most positive image and “boat” the least one. Furthermore, “boat” presented the highest values for ScaredEs and was significantly different to the other positive images (“baby”, “nature”, and “dog”). This coincides with the results obtained in the GAPED study, in which “boat” obtained the lowest valence and highest arousal scores (81.70; 66.01) compared to “nature” (98.74; 12.20), “baby” (98.29; 11.45), and “dog” (93.02; 9.36) [3].
For CalmEs and PeacefulEs, the highest scores were given to the positive images, especially “nature”, which presented significant differences with all other images for CalmEs and with all except for “baby” for PeacefulEs. However, no significant differences were found between the neutral images and between the negative ones for these responses. This shows that even though calm is considered as neutral by some authors [28,29], and therefore, in this study they were used as an equivalent to neutral responses, participants perceived them as positive terms, as classified in the study by King, et al. [38].
Although the images rating coincides with the GAPED classification, an issue found with this study was that the face scale values presented relatively high standard deviations (SD). Similarly, in the GAPED study, for the valence and arousal ratings, especially for neutral images, the reported SD were higher than their actual mean value, for example, the arousal value for “chairs” was 13.29 with a SD of ±20.26, while for “nature” was 12.20 with a SD of ±28.65; therefore, the ratings from positive and neutral images overlapped in most cases [3]. Therefore, the over-dispersion of the data showed in the GAPED may partially explain that higher valance scores are found for some neutral images compared to other positive images. The high variability found in the responses might be due to cultural differences, hence further studies with a higher number of participants and from different cultures (Asians and Non-Asians) would aid in the reduction of the dispersion of the data and a better understanding of how different cultures react to image stimuli [39].
The images in the present study had non-significant facial emotion intensities towards all images. The higher intensity for neutral emotion may be due to the experimental setting, which was in individual booths. However, if the participants were in a social interaction setting, they would express their emotions more [40,41]. The non-significance between emotion intensities was similar to the findings of Torrico, Fuentes, Viejo, Ashman, Gunaratne, Gunaratne, and Dunshea [25] which used a cross-cultural approach and Eulerian Magnification Algorithm (EMA) for HR analysis. However, this study used a general approach to identify differences by not separating panelists based on culture, and a novel method developed by Viejo, Fuentes, Torrico, and Dunshea [23] for HR analysis. Further, the novelty of the present study is the prediction of self-reported responses using biometrics with the use of general linear models (multiple linear regression), which was not conducted in either of the above-mentioned studies.

4.2. Multivariate Data Analysis and Correlations (Self-Reported and Biometric Responses)

The PCA showed that “happy” emotion from FR had a positive correlation with valence, which was expected, as valence is a dimension that measures the level of pleasantness, with the positive valence being pleasant and negative being unpleasant [3]. Happy and valence from FaceReader™ were also positively correlated with opened right and left eye, as well as a raised right and left eye brow. These parameters were correlated with positive images, which explain the higher gaze towards positive images [42]. This was further confirmed by multiple regression analysis (Table 3), where HappyEs emotion in positive images could be predicted by opened left eye and raised left eyebrow. Eyebrows have been significant in predicting emotions. This was explained by Sadr et al. [43], who stated that eyebrows are important in conveying emotions and other non-verbal signals. They further stated that eyebrows are a stable facial feature, and they are in high contrast to other facial features.
Head orientation Z (Z-Head), which denotes head movements for approaching and retraction, presented a positive correlation with disgusted, which means that the participants approached towards the screen when they felt disgusted, while there was a negative correlation with happy, which means they retracted when the images made them feel happy. The approaching towards the screen was significantly correlated with HR and DP. According to the PCA, participants approached the screen more with images such as “wheel”, “boat”, and “door”, and retracted with positive images such as “baby” as well as with negative images such as “snake”, “dentist”, “spider”, and “dark hole”. The approaching towards images with high valence (neutral images) and away from low valence (negative images) is consistent with the findings of Seibt et al. [44], where they stated that stimuli with positive valence facilitate behavior for either approaching the stimulus (object as reference point) or for bringing the stimulus closer (self as reference point), and that stimuli with negative valence facilitate behavior for withdrawing from the stimulus or for pushing the stimulus away. Approaching the neutral images is consistent with the results of the general linear models obtained for neutral images (Table 3).
Although there are limited studies about head movements with image stimuli, there are publications that showed correlations between head movements and colors of videos with visual stimuli, and when tasting bitter samples, which caused retraction as a defense reaction to negative tastes, which are related with poisonous substances [31,33,45,46]; therefore, the color of the images might have had an influence in the approaching or retraction in this study.

4.3. Regression Analysis (General Linear Model) Predicting Self-Reported Responses Using Biometrics

Although the facial expressions and other physiological responses were not significantly different among images, some parameters were able to significantly (α = 0.05) predict self-reported emotional responses based on the general linear models (Table 3). It shows that some facial expressions of emotions significantly affected the self-reported responses. Although happy emotion in FaceReader™ is correlated with valence, the regression analysis shows that the self-reported response for HappyEs reduces with valence. This was observed in the positive emotion category as well. This could be due to different reasons, including: (i) the FaceReader™ is not sufficiently accurate to classify and quantify the emotions intensity, and (ii)the bias of self-reported responses due to the differences in the use of scales between cultures, as Asians tend to be more polite and avoid using the extremes of the scales [47,48,49,50]. There are also some limitations in the software that movement of test person is limited (angle < 40°) and very heavy facial hair may hinder the analysis [51]. Furthermore, Ekman and Rosenberg [52] stated that there is no 1:1 correspondence between muscle groups and facial action units, since the muscles can act in different ways or contract in different regions, which will show visibility in different actions. However, the significant increase in facial state, “left eye” for a positive image (“baby”) shown in Table 2, can be explained by the general linear model, where the self-reported response HappyEs could be predicted (increased) using the “left eye” (Table 3).
The response CalmEs could not be predicted by any of the biometrics in the general model. This may be because calm is situated in the center of the emotion dimensional model [28,29]. This shows that emotion terms with extreme (high or low) valence and arousal scores can be better predicted using biometrics than emotions in the center of the dimensional model, when considering all emotion categories (general model). However, CalmEs was able to be predicted using some biometrics in positive and neutral categories. The models for positive and neutral categories are consistent with the findings of Granero, Colomer Granero, Fuentes Hurtado, Naranjo Ornedo, Guixeres Provinciale, Ausín, and Alcañiz Raya [18], where they stated that HR decreases with fear, sadness, and happiness. The reduced ST for CalmEs and increased ST for SadEs in the positive category contradicts the findings of Kreibig [9], who stated that fear, sadness, and anger were associated with low ST.
Further studies with a greater number of images of each category and more participants divided by different cultures (Asians and Non-Asians) and classified per gender need to be conducted using the same FaceReader™ settings as presented in this study to assess whether there are any differences between cultures in the perception of the images of different groups (positive, neutral, and negative). A ten second interval can be used to decouple stimuli instead of 5, which would avoid memory effect. During skin temperature analysis, it is important to take into consideration the skin emissivity, which is one of the toughest parameters obtained when measuring facial temperature. A comparison of emotions obtained by FaceReader™ (physiological) with the self-reported responses can be conducted in future studies to predict if there is a variation in self-reported and physiological responses within the same emotion. This preliminary study has shown that positive, negative, and neutral responses based on face expressions, physiological responses, and emotional responses from participants were able to cluster images according to their original GAPED classification. Furthermore, the head movement (approach–avoidance motions) of panelists vary based on the exposure to images with high and low valence scores. Also, the self-reported responses may be predicted using biometrics. These results make possible the implementation of machine learning algorithms (ML) to automatically classify these images using non-invasive biometrics (FaceReader™, heart rate, blood pressure, and skin temperature) as inputs and the real GAPED classification as targets based either on a general model or on culture. Machine learning regression models may also be developed to predict the rating of emotions from the EsSense® scale using only the results from biometrics as inputs. These models may be tested for different cultures and genders if significant differences among them are found when increasing the sample size. Further studies will be conducted using the higher number of images to construct ML models that can later be implemented for the assessment of any research conducted using visual stimuli.

5. Conclusions

This study showed that there were differences in the self-reported responses (Face Scale and the simplified EsSense profile®) and facial state (left eye, right eye) when panelists evaluated the GAPED image stimuli. Moreover, facial expressions, HR, blood pressure, and emotional responses from participants were able to cluster images according to their original GAPED classification. In terms of head movements, participants approached towards the screen when they felt disgusted and retracted when the images made them feel happy. Emotions with extreme (high or low) valence and arousal scores can be predicted using biometrics. Heart Rate can significantly predict emotions in positive and neutral image categories, while ST could only predict emotions when evaluating positive images. Results presented here may be used as a premise for further studies with increased sample size (images and participants), and to develop machine learning models that have a potential application for other sensory studies involving visual stimuli to predict the emotions elicited by the different samples.

Author Contributions

Conceptualization, N.M.G. and S.F.; data curation, D.D.T. and S.F.; formal analysis, N.M.G.; funding acquisition, F.R.D.; investigation, N.M.G. and T.M.G.; methodology, N.M.G.; project administration, H.A. and F.R.D.; resources, H.A.; software, C.G.V.; supervision, D.D.T., F.R.D., and S.F.; validation, N.M.G., D.D.T., and S.F.; visualization, N.M.G.; writing—original draft, N.M.G.; writing—review and editing, C.G.V., T.M.G., D.D.T., F.R.D., and S.F.

Funding

“This research was funded by AUSTRALIAN GOVERNMENT THROUGH THE AUSTRALIAN RESEARCH COUNCIL, grant number IH120100053”.

Conflicts of Interest

The authors declare no conflict of interest.

References

  1. King, S.; Meiselman, H. Development of a method to measure consumer emotions associated with foods. Food Qual. Prefer. 2010, 21, 168–177. [Google Scholar] [CrossRef]
  2. Sarma, M.; Bhattacharyya, K. Facial expression based emotion detection—A review. ADBU J. Eng. Technol. 2016, 4, 201–205. [Google Scholar]
  3. Dan-Glauser, E.S.; Scherer, K.R. The geneva affective picture database (gaped): A new 730-picture database focusing on valence and normative significance. Behav. Res. Methods 2011, 43, 468–477. [Google Scholar] [CrossRef] [PubMed]
  4. Chaya, C.; Eaton, C.; Hewson, L.; Vázquez, R.F.; Fernández-Ruiz, V.; Smart, K.A.; Hort, J. Developing a reduced consumer-led lexicon to measure emotional response to beer. Food Qual. Prefer. 2015, 45, 100–112. [Google Scholar] [CrossRef]
  5. Kendall, A.; Zinbarg, R.; Bobova, L.; Mineka, S.; Revelle, W.; Prenoveau, J.; Craske, M. Measuring positive emotion with the mood and anxiety symptom questionnaire: Psychometric properties of the anhedonic depression scale. Assessment 2016, 23, 86–95. [Google Scholar] [CrossRef] [PubMed]
  6. Gunaratne, T.M.; Viejo, C.G.; Fuentes, S.; Torrico, D.D.; Gunaratne, N.M.; Ashman, H.; Dunshea, F.R. Development of emotion lexicons to describe chocolate using the Check-All-That-Apply (CATA) methodology across Asian and Western groups. Food Res. Int. 2019, 115, 526–534. [Google Scholar] [CrossRef] [PubMed]
  7. Rebollar, R.; Lidón, I.; Martín, J.; Puebla, M. The identification of viewing patterns of chocolate snack packages using eye-tracking techniques. Food Qual. Prefer. 2015, 39, 251–258. [Google Scholar] [CrossRef]
  8. Lim, J. Hedonic scaling: A review of methods and theory. Food Qual. Prefer. 2011, 22, 733–747. [Google Scholar] [CrossRef]
  9. Kreibig, S.D. Autonomic nervous system activity in emotion: A review. Biol. Psychol. 2010, 84, 394–421. [Google Scholar] [CrossRef]
  10. Naït-Ali, A.; Fournier, R. Signal and Image Processing for Biometrics; John Wiley & Sons: Hoboken, NJ, USA, 2012. [Google Scholar]
  11. Loijens, L.; Krips, O. Facereader Methodology Note. Available online: https://docplayer.net/26907734-Facereader-what-is-facereader-how-does-facereader-work-methodology-note.html (accessed on 12 June 2019).
  12. Mehra, S.; Charaya, S. Enhancement of face recognition technology in biometrics. Int. J. Sci. Res. Educ. 2016, 4, 5778–5783. [Google Scholar] [CrossRef]
  13. Ko, C.-H.; Yu, C.-Y. Gender differences in emotional responses to iconic design. In Proceedings of the 2016 5th IIAI International Congress on Advanced Applied Informatics (IIAI-AAI), Kumamoto, Japan, 10–16 July 2016; IEEE: Piscataway, NJ, USA, 2016; pp. 785–790. [Google Scholar]
  14. Yu, C.Y. The use of facial recognition to evaluate human emotion when recognizing shading and texture. Bull. Jpn. Soc. Sci. Design 2016, 62, 5–69. [Google Scholar]
  15. Barlow, D.H. Anxiety and Its Disorders: The Nature and Treatment of Anxiety and Panic; Guilford Press: New York, NY, USA, 2004. [Google Scholar]
  16. Cruz Albarran, I.; Benitez Rangel, J.; Osornio Rios, R.; Morales Hernandez, L. Human emotions detection based on a smart-thermal system of thermographic images. Infrared Phys. Technol. 2017, 81, 250–261. [Google Scholar] [CrossRef]
  17. Brugnera, A.; Adorni, R.; Compare, A.; Zarbo, C.; Sakatani, K. Cortical and autonomic patterns of emotion experiencing during a recall task. J. Psychophysiol. 2018, 32, 52–63. [Google Scholar] [CrossRef]
  18. Granero, A.C.; Colomer Granero, A.; Fuentes Hurtado, F.; Naranjo Ornedo, V.; Guixeres Provinciale, J.; Ausín, J.; Alcañiz Raya, M. A comparison of physiological signal analysis techniques and classifiers for automatic emotional evaluation of audiovisual contents. Front. Comput. Neurosci. 2016, 10. [Google Scholar] [CrossRef]
  19. Dimberg, U. Facial reactions to facial expressions. Psychophysiology 1982, 19, 643–647. [Google Scholar] [CrossRef] [PubMed]
  20. McCaul, K.D.; Holmes, D.S.; Solomon, S. Voluntary expressive changes and emotion. J. Personal. Soc. Psychol. 1982, 42, 145. [Google Scholar] [CrossRef]
  21. Ekman, P.; Levenson, R.W.; Friesen, W.V. Autonomic nervous system activity distinguishes among emotions. Science 1983, 221, 1208–1210. [Google Scholar] [CrossRef] [PubMed]
  22. De Wijk, R.; He, W.; Mensink, M.G.J.; Verhoeven, R.H.G.; de Graaf, C.; Matsunami, H. ANS responses and facial expressions differentiate between the taste of commercial breakfast drinks. PLoS ONE 2014, 9, e93823. [Google Scholar] [CrossRef]
  23. Viejo, C.G.; Fuentes, S.; Torrico, D.D.; Dunshea, F.R. Non-contact heart rate and blood pressure estimations from video analysis and machine learning modelling applied to food sensory responses: A case study for chocolate. Sensors 2018, 18, 1802. [Google Scholar] [CrossRef]
  24. Barksdale, D.J.; Farrug, E.R.; Harkness, K. Racial discrimination and blood pressure: Perceptions, emotions, and behaviors of black american adults. Issues Ment. Health Nurs. 2009, 30, 104–111. [Google Scholar] [CrossRef]
  25. Torrico, D.D.; Fuentes, S.; Viejo, C.G.; Ashman, H.; Gunaratne, N.M.; Gunaratne, T.M.; Dunshea, F.R. Images and chocolate stimuli affect physiological and affective responses of consumers: A cross-cultural study. Food Qual. Prefer. 2018, 65, 60–71. [Google Scholar] [CrossRef]
  26. Fuentes, S.; Gonzalez Viejo, C.; Torrico, D.; Dunshea, F. Development of a biosensory computer application to assess physiological and emotional responses from sensory panelists. Sensors 2018, 18, 2958. [Google Scholar] [CrossRef] [PubMed]
  27. Asher, S.R.; Singleton, L.C.; Tinsley, B.R.; Hymel, S. A reliable sociometric measure for preschool children. Dev. Psychol. 1979, 15, 443. [Google Scholar] [CrossRef]
  28. Jun, S.; Rho, S.; Han, B.; Hwang, E. A fuzzy inference-based music emotion recognition system. In Proceedings of the 5th International Conference on Visual Information Engineering (VIE 2008), Xi’an China, 29 July–1 August 2008. [Google Scholar]
  29. Markov, K.; Matsui, T. Music genre and emotion recognition using gaussian processes. IEEE Access 2014, 2, 688–697. [Google Scholar] [CrossRef]
  30. Viola, P.; Jones, M. Rapid object detection using a boosted cascade of simple features. CVPR (1) 2001, 1, 511–518. [Google Scholar]
  31. Viejo, C.G.; Fuentes, S.; Howell, K.; Torrico, D.D.; Dunshea, F.R. Integration of non-invasive biometrics with sensory analysis techniques to assess acceptability of beer by consumers. Physiol. Behav. 2019, 200, 139–147. [Google Scholar] [CrossRef]
  32. Jensen, J.N.; Hannemose, M. Camera-Based Heart Rate Monitoring; Department of Applied Mathematics and Computer Science, DTU Computer: Lyngby, Denmark, 2014; Volume 17. [Google Scholar]
  33. Viejo, C.G.; Fuentes, S.; Howell, K.; Torrico, D.; Dunshea, F.R. Robotics and computer vision techniques combined with non-invasive consumer biometrics to assess quality traits from beer foamability using machine learning: A potential for artificial intelligence applications. Food Control 2018, 92, 72–79. [Google Scholar] [CrossRef]
  34. Torrico, D.D.; Fuentes, S.; Viejo, C.G.; Ashman, H.; Dunshea, F.R. Cross-cultural effects of food product familiarity on sensory acceptability and non-invasive physiological responses of consumers. Food Res. Int. 2018, 115, 439–450. [Google Scholar] [CrossRef]
  35. Torrico, D.D.; Hutchings, S.; Ha, M.; Bittner, E.P.; Fuentes, S.; Warner, R.D.; Dunshea, F.R. Novel techniques to understand consumer responses towards food products: A review with a focus on meat. Meat Sci. 2018, 144, 30–42. [Google Scholar] [CrossRef]
  36. Deng, P.Y.A.W. Needle in the Haystack—User Behavior Anomaly Detection for Information Security with Ping Yan and Wei Deng. Available online: https://www.slideshare.net/databricks/needle-in-the-haystackuser-behavior-anomaly-detection-for-information-security-with-ping-yan-and-wei-deng/7 (accessed on 15 June 2017).
  37. Prokop, P.; Özel, M.; Uşak, M. Cross-cultural comparison of student attitudes toward snakes. Soc. Anim. 2009, 17, 224–240. [Google Scholar]
  38. King, S.; Meiselman, H.; Carr, B.T. Measuring emotions associated with foods in consumer testing. Food Qual. Prefer. 2010, 21, 1114–1116. [Google Scholar] [CrossRef]
  39. Leu, J.; Mesquita, B.; Ellsworth, P.C.; ZhiYong, Z.; Huijuan, Y.; Buchtel, E.; Karasawa, M.; Masuda, T. Situational differences in dialectical emotions: Boundary conditions in a cultural comparison of North Americans and east Asians. Cogn. Emot. 2010, 24, 419–435. [Google Scholar] [CrossRef]
  40. Yamamoto, K.; Suzuki, N. The effects of social interaction and personal relationships on facial expressions. J. Nonverbal Behav. 2006, 30, 167–179. [Google Scholar] [CrossRef]
  41. Hess, U.; Bourgeois, P. You smile–I smile: Emotion expression in social interaction. Biol. Psychol. 2010, 84, 514–520. [Google Scholar] [CrossRef] [PubMed]
  42. Maughan, L.; Gutnikov, S.; Stevens, R. Like more, look more. Look more, like more: The evidence from eye-tracking. J. Brand Manag. 2007, 14, 335–342. [Google Scholar] [CrossRef]
  43. Sadr, J.; Jarudi, I.; Sinha, P. The role of eyebrows in face recognition. Perception 2003, 32, 285–293. [Google Scholar] [CrossRef]
  44. Seibt, B.; Neumann, R.; Nussinson, R.; Strack, F. Movement direction or change in distance? Self- and object-related approach–avoidance motions. J. Exp. Soc. Psychol. 2008, 44, 713–720. [Google Scholar] [CrossRef]
  45. Ganchrow, J.; Steiner, J.; Daher, M. Neonatal response to intensities facial expressions in different qualities and of gustatory stimuli. Infant Behav. Dev. 1983, 6, 189–200. [Google Scholar] [CrossRef]
  46. Robert Soussignan, J.W.; Schaaf, B. Epigenetic approach to the perinatal development of affective processes in normal and at-risk newborns. Adv. Psychol. Res. 2006, 40, 187. [Google Scholar]
  47. Van de Mortel, T.F. Faking it: Social desirability response bias in self-report research. Aust. J. Adv. Nurs. 2008, 25, 40. [Google Scholar]
  48. Donaldson, S.I.; Grant-Vallone, E.J. Understanding self-report bias in organizational behavior research. J. Bus. Psychol. 2002, 17, 245–260. [Google Scholar] [CrossRef]
  49. Schwarz, N. Self-reports: How the questions shape the answers. Am. Psychol. 1999, 54, 93. [Google Scholar] [CrossRef]
  50. Yeh, L.; Kim, K.; Chompreeda, P.; Rimkeeree, H.; Yau, N.; Lundahl, D. Comparison in use of the 9-point hedonic scale between Americans, Chinese, Koreans, and Thai. Food Qual. Prefer. 1998, 9, 413–419. [Google Scholar] [CrossRef]
  51. Noldus. Facereader: Tool for Automatic Analysis of Facial Expression: Version 6.0; Noldus Information Technology Wageningen: Wageningen, The Netherlands, 2014. [Google Scholar]
  52. Ekman, P.; Rosenberg, E.L. What the Face Reveals: Basic and Applied Studies of Spontaneous Expression Using the Facial Action Coding System (FACS); Oxford University Press: Oxford, MS, USA, 1997. [Google Scholar]
Figure 1. Images from Geneva Affective PicturE Database (GAPED) and other internet sources shown to participants during the study. Images are categorized as negative ((A) dentist, (B) dark hole, (C) spider, (D) snake), neutral ((E) stairs, (F) door, (G) wheel, (H) chairs), or positive ((I) baby, (J) dog, (K) nature, (L) boat).
J 02 00015 g001
Figure 2. Simplified face scale showing different faces. Moving the marker dot changes the mouth orientation of the Figure from very sad/negative to very happy/positive, being neutral in the middle of the scale presented to panelists in the Bio-sensory app.
J 02 00015 g002
Figure 3. Results from multivariate data analysis, where (A) principal components analysis (PCA) shows parameters from biometrics and self-reported responses (x-axis: principal component one and y-axis: principal component two). (B) Cluster analysis for the images used as stimuli (x-axis is linkage distance and y-axis is descriptors). (C) Correlation matrix for all parameters used for the PCA, with only significant correlations presented (p-value < 0.05). The color bar represents the correlation coefficients on a scale from -1 to 1, where the blue side denotes the positive correlations, while yellow represents the negative correlations. Abbreviations: Zhead = head orientation in z- dimension; FS = face scale and emotions, with Es at the end represent those from the EsSense profile®; ST = Skin temperature; HR = Heart rate; SP = Systolic pressure; DP = Diastolic pressure. The emotion terms without the “Es” at the end of the word were obtained from the FaceReader™ analysis.
J 02 00015 g003aJ 02 00015 g003b
Table 1. Mean values (top numbers) and standard deviation (bottom numbers) for the self-reported responses for the effect of images nested within the classification group. Different letters (added as superscripts from a to h) denote statistically significant differences among the images nested within the group using the least squares means test with α = 0.05.
ImageGroupFace ScaleHappyEsSadEsScaredEsCalmEsPeacefulEs
Dark holeNegative3.59f
±3.44
1.29gh
±0.80
1.90a
±1.13
2.92b
±1.11
1.67d
±0.91
1.44d
±0.87
DentistNegative3.00f
±2.55
1.15h
±0.41
2.02a
±1.02
2.92b
±1.16
1.25e
±0.48
1.19d
±0.39
SnakeNegative2.71f
±3.07
1.23gh
±0.66
1.88a
±1.28
3.54a
±1.29
1.38de
±0.67
1.23d
±0.55
SpiderNegative3.67f
±3.29
1.31fgh
±0.66
1.92a
±1.25
3.25ab
±1.26
1.42de
±0.85
1.38d
±0.89
ChairsNeutral7.64d
±2.99
1.90d
±0.88
1.40a
±0.87
1.29d
±0.71
2.44c
±1.09
2.17c
±1.17
DoorNeutral7.42de
±1.67
1.54efg
±0.74
1.23a
±0.62
1.31d
±0.55
2.27c
±1.14
2.17c
±1.07
StairsNeutral6.54e
±2.54
1.63def
±0.82
1.63a
±0.79
1.67c
±0.78
2.20c
±1.13
2.04c
±1.01
WheelNeutral7.78d
±1.89
1.83de
±0.93
1.13a
±0.39
1.10d
±0.37
2.17c
±1.02
2.10c
±1.02
BabyPositive12.20bc
±2.80
3.40bc
±0.89
1.10a
±0.47
1.04d
±0.20
3.56b
±0.92
3.69a
±1.03
BoatPositive11.11c
±3.21
3.21c
±0.87
1.23a
±0.72
1.77c
±0.88
2.44c
±0.99
2.40c
±1.12
DogPositive12.39ab
±2.88
3.67ab
±0.83
1.27a
±0.61
1.19d
±0.49
3.23b
±0.95
3.29b
±0.92
NaturePositive13.32a
±1.92
3.98a
±0.91
1.15a
±0.41
1.04d
±0.29
4.00a
±0.88
4.02a
±0.79
“Es” at the end of each word means it comes from the EsSense Profile® test.
Table 2. Mean values (top measuring results) and standard deviation (bottom measuring results) for the biometric responses for the effect of images nested within the classification group. Different letters (added as a superscript; a, b) denote statistically significant differences among the images nested within the group using the least squares means test with α = 0.05.
ImageGroupNeutralNSHappyNSSadNSAngryNSSurprisedNSScaredNSDisgustedNSContemptNSValenceNSArousalNSY-HeadNSX-HeadNS
Dark holeNegative0.44
±0.17
0.15
±0.16
0.26
±0.20
0.15
±0.15
0.05
±0.07
0.07
±0.12
0.07
±0.09
0.08
±0.07
−0.21
±0.29
0.37
±0.22
12.95
±10.09
−7.86
±5.95
DentistNegative0.45
±0.16
0.16
±0.18
0.23
±0.20
0.15
±0.13
0.05
±0.05
0.07
±0.10
0.07
±0.10
0.09
±0.08
−0.18
±0.30
0.38
±0.22
13.08
±10.97
−6.62
±5.76
SnakeNegative0.42a
±0.18
0.15
±0.15
0.26
±0.22
0.19
±0.16
0.05
±0.06
0.56
±0.08
0.07
±0.10
0.10
±0.12
−0.20
±0.31
0.41
±0.25
12.25
±10.60
−7.31
±7.81
SpiderNegative0.43
±0.18
0.13
±0.14
0.27
±0.23
0.17
±0.15
0.07
±0.13
0.07
±0.12
0.07
±0.11
0.10
±0.08
−0.25
±0.29
0.41
±0.23
12.06
±10.92
−7.20
±5.61
ChairsNeutral0.42
±0.19
0.12
±0.15
0.26
±0.22
0.17
±0.15
0.06
±0.07
0.07
±0.12
0.07
±0.09
0.09
±0.08
−0.24
±0.29
0.41
±0.23
12.65
±10.88
−7.26
±6.47
DoorNeutral0.44
±0.19
0.11
±0.12
0.28
±0.23
0.17
±0.14
0.04
±0.03
0.07
±0.09
0.08
±0.09
0.09
±0.09
−0.26
±0.29
0.36
±0.23
12.34
±9.32
−6.36
±6.42
StairsNeutral0.47
±0.19
0.12
±0.13
0.27
±0.22
0.15
±0.17
0.05
±0.06
0.06
±0.11
0.06
±0.09
0.09
±0.09
−0.25
±0.29
0.39
±0.22
12.59
±9.59
−6.30
±5.93
WheelNeutral0.43
±0.19
0.13
±0.14
0.24
±0.21
0.17
±0.15
0.05
±0.07
0.08
±0.14
0.09
±0.15
0.12
±0.11
−0.25
±0.29
0.40
±0.21
11.52
±12.39
−6.28
±6.45
BabyPositive0.46
±0.18
0.16
±0.18
0.25
±0.18
0.16
±0.16
0.05
±0.08
0.07
±0.10
0.05
±0.08
0.07
±0.06
−0.19
±0.29
0.42
±0.22
12.78
±9.50
−7.32
±6.30
BoatPositive0.44
±0.19
0.14
±0.13
0.25
±0.21
0.17
±0.17
0.05
±0.08
0.07
±0.12
0.07
±0.10
0.11
±0.12
−0.22
±0.29
0.43
±0.24
13.48
±10.11
−6.17
±5.97
DogPositive0.44
±0.18
0.17
±0.18
0.24
±0.20
0.15
±0.15
0.04
0.05
0.07
±0.12
0.06
±0.08
0.08
±0.07
−0.18
±0.31
0.39
±0.23
14.10
±9.58
−7.29
±6.02
NaturePositive0.45
±0.17
0.14
±0.15
0.27
±0.22
0.15
±0.14
0.05
0.07
0.06
±0.09
0.06
±0.08
0.09
±0.09
−0.21
±0.31
0.39
±0.24
12.17
±9.54
−7.10
±5.87
ImageGroupZ-HeadNSMouthNSLERELEBNSREBNSGDNSHRNSDPNSSPNSSTNS
Dark holeNegative−4.28
±4.18
0.21
±0.34
0.15a,b
±0.27
0.17a,b
±0.29
0.01
±0.53
−0.25
±0.33
0.38
±0.38
87.90
±8.91
76.21
±6.990
118.67
±30.30
31.79
±4.78
DentistNegative−3.24
±3.96
0.25
±0.35
0.22a,b
±0.33
0.19a,b
±0.30
0.04
±0.58
−0.26
±0.35
0.39
±0.36
87.71
±7.71
75.09
±4.93
117.81
±26.15
31.75
±4.74
SnakeNegative−4.47
±4.81
0.25
±0.35
0.16a,b
±0.31
0.23a,b
±0.31
0.02
±0.53
−0.29
±0.37
0.43
±0.44
87.60
±8.88
76.43
±5.87
119.21
±27.45
32.49
±4.79
SpiderNegative−4.18
±4.23
0.21
±0.32
0.13b
±0.28
0.13b
±0.23
0.01
±0.51
−0.26
±0.37
0.41
±0.39
89.00
±8.34
76.20
±5.59
124.34
±24.03
31.98
±4.78
ChairsNeutral−3.97
±4.96
0.26
±0.39
0.13b
±0.27
0.14b
±0.27
−0.04
±0.53
−0.35
±0.41
0.39
±0.39
88.56
±11.02
76.11
±6.14
120.13
±24.42
32.85
±4.73
DoorNeutral−4.19
±4.32
0.21
±0.32
0.18a,b
±0.31
0.20a,b
±0.31
−0.04
±0.52
−0.31
±0.35
0.36
±0.37
87.85
±7.65
73.94
±6.86
119.72
±25.17
32.04
±4.76
StairsNeutral−4.52
±5.04
0.18
±0.32
0.22a,b
±0.34
0.22a,b
±0.32
0.01
0.48
−0.23
±0.39
0.31
±0.37
86.78
±9.11
74.58
±6.96
121.76
±26.89
31.90
±4.78
WheelNeutral−4.46
±6.49
0.21
±0.33
0.11b
±0.24
0.12b
±0.21
0.09
±0.49
−0.32
±0.38
0.37
±0.40
87.16
±8.04
74.51
±6.53
114.75
±24.74
32.29
±4.70
BabyPositive−3.48
±3.11
0.19
±0.34
0.34a
±0.36
0.33a
±0.36
0.05
±0.52
−0.21
±0.37
0.41
±0.39
86.27
±7.83
73.43
±6.55
117.03
±24.60
31.73
±4.70
BoatPositive−4.28
±4.88
0.22
±0.33
0.19a,b
±0.34
0.17a,b
±0.30
−0.08
±0.51
−0.34
±0.41
0.37
±0.39
87.92
±10.05
75.26
±8.17
115.26
±30.83
32.65
±4.56
DogPositive−4.22
±4.03
0.19
±0.31
0.18a,b
±0.29
0.15a,b
±0.27
−0.05
±0.44
−0.31
±0.37
0.38
±0.36
88.71
±8.61
75.84
±6.88
122.71
±27.97
31.81
±4.81
NaturePositive4.17
±4.03
0.19
±0.32
0.13b
±0.29
0.11b
±0.23
0.03
±0.47
−0.32
±0.36
0.39
±0.35
87.49
±8.75
75.42
±6.79
117.99
±28.95
31.90
±5.03
Abbreviations: Y-Head = Y head orientation; X-Head = X head orientation; Z-Head = Z head orientation; GD = Gaze direction; LE = Left eye; RE = Right eye; LEB = Left eye brow; REB = Right eyebrow; HR = Heart rate; SP = Systolic pressure; DP = Diastolic pressure; ST = Skin temperature; NS = Non-significant. The standard error values (data not shown): neutral–valence (0.01–0.04), Y-Head to X-Head (0.4–1.5), LE–GD (0.02–0.07), HR (1.0–1.6), SP (3.4–4.5), DP (0.7–1.1), ST (0.6–0.7).
Table 3. General linear models developed through multiple linear regression analysis to predict the self-reported responses using biometric responses. Only terms that significantly predict the self-reported responses at α = 0.05 were modelled. General = All images; Positive = Only positive images; Neutral = Only neutral images, Negative = Only negative images. Top values represent correlation coefficient and bottom values show the p value.
CategorySelf-Reported Response Int.HRST SurDisValNeuScaGDLELEBX-HeadY-HeadZ-HeadMouREB
GeneralFS7.85NSNS−0.11
p = 0.01
NSNSNSNSNSNSNSNSNSNSNSNS
HappyEs1.86NSNSNSNS−0.42
p = 0.03
NSNSNSNSNSNS+0.01
p = 0.01
NSNSNS
SadEs1.72NSNSNSNSNSNSNS−0.40
p = 0.01
NSNSNSNSNSNSNS
ScaredEs2.56NSNSNSNSNS−0.02
p = 0.00
NSNSNSNSNSNSNSNSNS
PeacefulEs 2.32NSNS−0.03
p = 0.01
NSNSNSNS−0.59
p = 0.01
NSNSNS+0.01
p = 0.01
NSNSNS
Positive FS11.12NSNSNS+0.09
p = 0.01
NSNSNSNSNS+2.30
p = 0.01
NSNSNSNSNS
HappyEs3.25NSNSNSNS−0.72
p = 0.01
NSNSNS+0.74
p = 0.03
+0.48
p = 0.02
NSNSNSNSNS
SadEs0.27NS+0.03
p = 0.01
NSNSNSNSNSNSNSNSNSNS+0.04
p = 0.01
NSNS
ScaredEs3.45−0.02
p = 0.01
NSNSNSNSNSNSNSNSNSNSNSNS−0.72
p = 0.01
−0.51
p = 0.01
PeacefulEs2.74NSNSNSNSNSNSNSNSNSNSNS+0.02
p = 0.01
NSNSNS
CalmEs5.09NS−0.05
p = 0.01
NSNS−0.74
p = 0.01
NSNSNSNSNSNSNS−0.07
p = 0.01
NSNS
NeutralFS7.36NSNSNSNSNSNSNSNS−1.79
p = 0.04
NS+0.11
p = 0.01
NSNSNSNS
HappyEs1.74NSNSNSNSNSNSNSNSNSNS+0.03
p = 0.01
NSNSNSNS
SadEs3.35−0.02
p = 0.04
NSNSNSNSNSNSNSNSNSNSNSNSNSNS
ScaredEs1.34NSNSNSNSNSNS+0.02
p = 0.01
NSNSNSNSNSNS NSNS
PeacefulEs1.98NSNSNSNSNSNSNSNSNSNS0.04
p = 0.01
NSNSNS−0.65
p = 0.04
CalmEs3.08NSNSNSNSNS−0.02
p = 0.04
NSNSNSNSNSNSNSNSNS
NegativeHappyEs0.86NSNSNSNSNS+0.01
p = 0.02
NSNSNSNSNSNSNSNSNS
SadEs2.91NSNSNSNSNS−0.03
p = 0.01
+0.04
p = 0.03
NSNSNSNSNSNSNSNS
ScaredEs4.23NSNSNSNSNS−0.04
p = 0.01
NSNS1.63
p = 0.04
NSNSNSNSNSNS
“Es” at the end of each word means it comes from the EsSense Profile® test. Abbreviations: Int = Intercept; HR = Heart Rate; ST = Skin temperature; Sur = Surprised; Dis = Disgusted; Val = Valence; Neu = Neutral; Sca = Scared; GD = Gaze Direction; LE = Left eye; LEB = Left eye brow; X-Head = X head orientation; Y-Head = Y head orientation; Z-Head = Z head orientation; Mou = Mouth; REB = Right eyebrow; FS = Face Scale; NS = Not significant. Facial expressions that did not significantly predict self-reported responses in the model are not shown in the table.

