Abstract
Rainfall prediction is a fundamental process in providing inputs for climate impact studies and hydrological process assessments. Rainfall events are, however, a complicated phenomenon and continues to be a challenge in forecasting. This paper introduces novel hybrid models for monthly rainfall prediction in which we combined two pre-processing methods (Seasonal Decomposition and Discrete Wavelet Transform) and two feed-forward neural networks (Artificial Neural Network and Seasonal Artificial Neural Network). In detail, observed monthly rainfall time series at the Ca Mau hydrological station in Vietnam were decomposed by using the two pre-processing data methods applied to five sub-signals at four levels by wavelet analysis, and three sub-sets by seasonal decomposition. After that, the processed data were used to feed the feed-forward Neural Network (ANN) and Seasonal Artificial Neural Network (SANN) rainfall prediction models. For model evaluations, the anticipated models were compared with the traditional Genetic Algorithm and Simulated Annealing algorithm (GA-SA) supported by Autoregressive Moving Average (ARMA) and Autoregressive Integrated Moving Average (ARIMA). Results showed both the wavelet transform and seasonal decomposition methods combined with the SANN model could satisfactorily simulate non-stationary and non-linear time series-related problems such as rainfall prediction, but wavelet transform along with SANN provided the most accurately predicted monthly rainfall.
1. Introduction
Understanding future behaviors of precipitation is important to make plans and adaptation strategies, but the climate system is very complex and normally required sophisticated mathematical models to simulate [1,2]. Additionally, modeling the variabilities of rainfall events becomes more challenging when local-scale projections are required. There are numerous methods for rainfall prediction which can be categorized into three groups, including statistical, dynamic and satellite-based methods [3,4]. Statistical methods are, however, still a standard in rainfall forecasting because of their inexpensive computational demands and time-consuming nature. Moreover, when a comprehensive understanding of underlying processes is required, the statistical modeling paradigm is favored.
There are a number of statistical methods and their applications in environmental studies, particularly in nonlinear hydrological processes [5]. The most traditional statistical method applied in hydrology is Autoregressive Integrated Moving Average (ARIMA) [6,7,8,9]. ARIMA was employed in rainfall-runoff forecasting [10,11] and in the prediction of short-term future rainfall [12,13]. For real-time food forecasting, Toth et al. [14] already made a comparison between short-time rainfall prediction models. Several variants of the Autoregressive Moving Average (ARMA) and nearest-neighbor methods were employed for tropical cyclone rainfall forecasting. Nevertheless, there is a limitation in using the ARMA and ARIMA models in which the accuracy of these models depends significantly on user experience.
To overcome this disadvantage, the Genetic Algorithm and Simulated Annealing (GA-SA) algorithm was proposed to improve the performance of this model by automatically finding optimal parameters for time series prediction [15]. In the case of genetic algorithms (GAs), the searching technique is originated from the theory of natural evolution mechanisms. GAs are very useful algorithms for searching and have accomplished much more advantages than the traditional ARIMA method. The advantages of GAs include their ease of use, flexibility and capacity to be broadly applied and to easily find a near optimal solution for various problems [16]. As a result, GAs become widely adopted in solving issues in the meteorological and hydrological fields [17,18,19,20]. Cortez et al. [21] then proposed meta-genetic algorithms (Meta-GAs) to look for parameters for the ARMA model with a two-level algorithm. Son et al. [15] extended Meta-GAs by using both SA and GA to further improve the performance of predictions. Yu-Chen et al. [16] used a hybrid GA and SA combined with fuzzy programming for reservoir operation optimization. Besides the mentioned methods, another method called Artificial Neural Network (ANN) was also applied widely in rainfall-runoff predictions [22,23,24,25], streamflow forecasting [26,27], and rainfall simulation [28].
ANN has been applied in time series-related problems. Although, it was found that a single ANN model was not able to successfully cope with seasonal features [29,30,31], other investigations stated that promising results could be obtained by using an appropriate ANN model [14,32,33]. Coskun Hamzacebi [34], for example, suggested an ANN structure for seasonal time series forecasting with a higher accuracy and lower prediction error than other methods. Furthermore, Edwin et al. [35] and Benkachcha et al. [36] proposed a combined method, including seasonal time series forecasting based on ANN. This study also concluded that ANN could yield promising predictions.
Rainfall is well known as a natural phenomenon that can be considered as a quasi-periodic signal with frequently cyclical fluctuations, including diverse noises at different levels [37,38]. As a result, although the application of ANN in weather forecasting has been scrutinized deeply in the literature [39,40,41,42,43,44], due to its seasonal nature and nonlinear characteristics, hybrid methods should be applied to overcome the difficulties in rainfall forecasting. Wong et al. [45] proposed to use ANN and Fuzzy logic for rainfall prediction when ANN and Autoregressive integrated moving average (ARIMA) were adopted in Somvanshi et al. [28]. Others like Xinia et al. [46] adopted empirical mode decomposition (EMD) and the Radial Basic Function network (RBFN) for rainfall prediction. We found that there were not any studies that applied a seasonal decomposition combined with a seasonal feed-forward neural network to improve rainfall prediction. There also have not been any prior studies which employed a wavelet transform combined with seasonal feed-forward neural network for time series prediction with seasonal characteristics.
Therefore, the main objective of this study is to propose new hybrid models in the field of hydrology, especially for rainfall prediction. This can be achieved by combining two data-pre-processing techniques with the Artificial Neural Network (ANN) and Seasonal Artificial Neural Network (SANN) models. The effectiveness and accuracy of these proposed hybrid models would be evaluated by comparisons with a single ANN. The proposed models would be then also compared with the GA-SA algorithm in the traditional ARIMA model. The paper is organized as follows: The details of the methodology used in this paper are shown in Section 2. Data analysis and pre-processing methods are described in Section 3, and Section 4 provides the application of models; finally, Section 5 shows the experiment results and discussion when Section 6 summarizes the content of the whole paper.
2. Methodology
2.1. Artificial Neural Network (ANN)
ANN is a common terminology, covering various variants of network architectures in which the most common is the multilayer feed-forward neural network (MFNN or FNN in short). An ANN model comprises of numerous artificial neurons, also known as processing elements or nodes. Each network has several layers: An input, output, and one or more hidden layers; each layer has several neurons.
The whole network is constructed from some layers of neurons in a way that each neuron in a certain layer is linked to neurons in other layers (immediately before and after) through weighted connections. Neurons can be described as mathematical expressions that can filter network signals. From linked neurons in previous layers, summed weighted inputs and bias units are passed onto a single neuron. The purpose of bias units is to adjust the inputs to practical and useful ranges, so that the neural networks could converse more easily. The combined summation result is then passed through a transfer function to generate neuron outputs. This output is then carried through weighted connections to neurons in the next layer, where then this procedure is repeated until the output layer. The weight vectors linking different network nodes are calculated by an error back-propagation method. During a model training process, these parameter values are updated so that the ANN output resembles the measured output of a known dataset [47,48]. A trained response is obtained by adjusting the weights of the connections in the network as to minimize an error criterion. Validating then can reduce the likelihood of overfitting. Upon the network being trained so that it simulates the most accurate response to input data, testing is then conducted to evaluate how the ANN model performs as a predictive tool [49]. Shahin et al. [50] illustrated the structure and process for node j of an ANN model as in Figure 1.
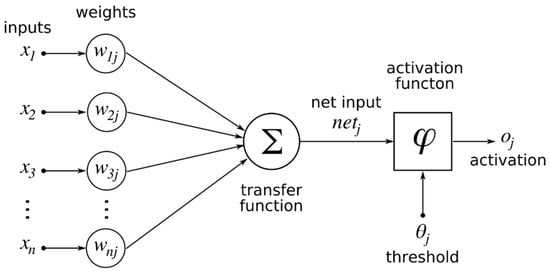
Figure 1.
Conceptual model of a multilayer feed-forward artificial network with one hidden layer.
2.2. Seasonal Artificial Neural Network (SANN)
ANN can remove seasonal effects from time series, while still making successful forecasts [34]. To include the seasonal effects, the s parameter can be used to represent, for example, a monthly frequency (in monthly time series, s would then be equal to 12). The ANN prediction performance in seasonal time series forecasting can also be increased by detailing the number of input neurons with the parameter s. For this type of network structure, the ith seasonal period observation is the value of input neurons, and (i + 1)th is the value of the seasonal period observation output neurons. One of the ANN models best captured the seasonal effects is the Seasonal Artificial Neural Network (SANN) using the Levenberg–Marquardt (LM) learning algorithm.
In this paper, a one-layer feed-forward network with the seasonal architecture was chosen, which consisted of an input layer with m = (k × s) nodes, where s is a constant equal to 12 for monthly time series and k is a coefficient depending on selected pre-processing methods. Two different pre-processing methods were applied, including Decomposition of raw data and Discrete Wavelet Transform (DWT). In the decomposition method, the raw data is decomposed into three subsets (k = 3) and in the DWT method, the original data is divided into five subsets (k = 5) (for the raw data only k = 1). The hidden layer consisted of n = 3, 5, 8, 10 and 15 neurons, and the output layer had only one node. The transfer function in the hidden layer for all cases was the Tan-sigmoid function and linear functions used for output layers. The SANN architectures can be described by the following equation:
where Yt+l (l = 1, 2,…, m) represents the predictions for the future s periods; Yt−i (i = 1, 2, …, m) are the observations of the previous s periods; IWij (i = 1, 2,…, m; j = 1, 2,…, n) are the weights of connections from an input layer’s neuron to a hidden layer’s neuron; LWjl (j = 1, 2, …, n; l = 1, 2, …,m) are the weights of connections from a hidden layer’s neuron to an output layer’s neuron; bl (j = 1, 2,…, n) and bj (j = 1, 2, …, n) are the weights of bias connections and f is the activation function.
2.3. ARIMA and GA-SA Models
The main application of the Autoregressive Integrated Moving Average (ARIMA) model is to forecast time series that can be stationarized using transformations like differencing and logging. ARIMA which was first introduced by Box and Jenkins [51] as a well-tuned form of random-walk and random-trend models. To remove any indications of autocorrelation from forecasting errors, this fine-tuning included the addition of lags of the differenced series and/or lags of the forecast errors to the prediction equation.
where φi (i = 1, 2, …, p) and θj (j = 0, 1, 2, …, q) are model parameters; p and q are integers and referred as orders of the model; yt and εt are the actual value and random error at the time period t, respectively; random errors, εt, are presumed to be identically distributed with a mean of zero and a constant variance of σ2 and independent of each other’s values.
Based on the process of genetic changes in living organisms (GA) and thermodynamic principles (SA), GA-SA was developed. Through systematic and paralleled ways, GA algorithms allow for a global search when SA methods generate local solutions that could theoretically converge to the global optimum solution with unit probability [52]. GA-SA can improve ARMA in terms of model selection [15]. In a GA-SA model, selecting model parameters can be performed by SA at high levels, and the selection of parameters for models was carried out by GA at low levels as described in Figure 2. The pseudo code for the structure of the GA-SA model is presented in Table 1.

Figure 2.
Structure of a Genetic Algorithm and Simulated Annealing (GA-SA) algorithm.

Table 1.
Simulated annealing (left) and genetic frame-work (right) used in this GA-SA algorithm [15].
3. Data Analysis
3.1. Data Selection
All models developed in this study used data from the Ca Mau hydrological gauging station at Ca Mau province, Vietnam (Location: 9°10′24′′ N latitudes and 104°42′–105°09′16′′ E longitudes), which was provided by Southern Hydro-Meteorological Center. This station was chosen because it could provide long-term and reliable data series and showed clear seasonal effects. Data from this station was also used in Dang et al. [53] to model hydrological processes in the Mekong Delta. For this specific station, rainfall (Rt) time series on a monthly scale were collected over 39 years (1971–2010).
As aforementioned, the whole data series was divided into three subsets for training, validating and testing and normalized in a range of [0, 1] before training. This was done by allocating data from 1 January 1979 to 31 December 2004 (85% of entire data) for training and validating, and data from 1 January 2005 to 31 December 2010 (15% of entire data) for testing. Statistical results for the training, validating and testing processes are listed in Table 2, including mean, maximum, minimum, standard deviation (Sd), skewness coefficient (Cs), and autocorrelations from 1-day lag to 3-day lag (R1, R2, and R3). It is important to note that ANN, and other data-driven methods, best performs when there is no extrapolation outside the data range that is used in training the models. Therefore, the extreme values of the whole dataset should present in the training dataset. In Table 2, the extreme values of R were within the training set range. When high skewness coefficients may reflect the substantially low performance of the models [54], the skewness coefficients in our models were low. The table also shows comparable statistical characteristics between the datasets, most obviously between the autocorrelation coefficients of the validating and testing sets.

Table 2.
Statistical analysis for training, validation, testing, and whole dataset.
3.2. Data Pre-Processing
3.2.1. Seasonal Decomposition (SD)
Seasonal decomposition is a statistical analysis to separate the features of data into different components, each representing one of the underlying categories of patterns. This structural model enables each of the components to be isolated and analyzed separately. There are three decomposition models normally used in time series analysis: Additive, Log-additive, and multiplicative models [55]. By comparing the three models, we chose the multiplicative decomposition model. There were two reasons: (i) The multiplicative form’s seasonal factor is relative to the original series value, and (ii) most positive-value seasonal time series which have the magnitude of seasonal oscillations increase to the size of the original series [56,57]. More details of this method can be found in Shuai et al. [57]. Figure 3 depicts the general assembly of decomposition, a process by which the original data is decomposed into the trend cycle (TR), seasonal component (S) and irregular fluctuations (IR) [36].
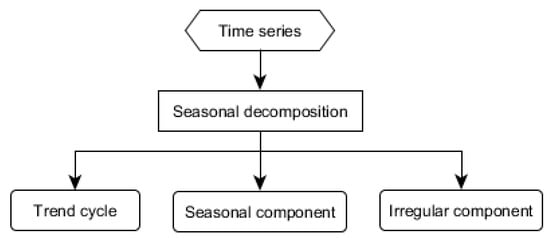
Figure 3.
Decomposition of time series data into three components.
In this study, a multiplicative model was used to decompose the monthly rainfall time series (yt) into a multiplication of the three components as follows:
The trend cycle (TR) is estimated by a 13-term Henderson moving averages filter. This filter can eliminate almost all irregular variations and smooth time series data. The weights of the filter introduced in the middle of a time series are symmetric, while those at the end are asymmetric [58]. The seasonal component (S) is calculated using a 5-term M (3, 3) seasonal moving averages. This method is also used for smoothing time series by weighted averaging. We used a 3 × 3 composite moving average on the seasonal-irregular (S × IR) component for each month separately. The weights for these moving averages are (1, 2, 3, 2, 1)/9. This averaging “moves” over time, in the sense that each data point is chronologically added to the averaging range, while the eldest data point in the data range that is averaged is removed. Eventually, the irregular component (IR) is calculated as:
3.2.2. Wavelet Transform (WT)
WT is an effective technique in capturing different characteristics of a target time series as well as in detecting special events in time series that are localized and nonstationary. This method is a useful tool for signal processing that can be implemented in time series analysis [59]. WT is similar to the Fourier transform, in that the time series is represented as a linear combination of base functions, while it can handle the disadvantage of the Fourier transform [60,61]. Translation and dilations of the mother wavelet function are the base functions for WT. In Figure 4 some important mother wavelets are illustrated.

Figure 4.
Three mother wavelet functions.
The current study deals only with the key ideas of Discrete Wavelet Transform (DWT). A mathematical synopsis of WT and a presentation of applications is shown by Labat et al. [62]. DWT decomposes the signal into a mutually orthogonal set of wavelets defined by the equation:
where is produced from a mother wavelet which is dilated by j and translated by k. The mother wavelet has to satisfy the condition
The discrete wavelet function of a signal can be calculated as follows:
where is the approximate coefficient of signals. The mother wavelet is formulated from the scaling function as:
where . Different sets of coefficients can be found corresponding to wavelet bases with various characteristics. In DWT, coefficient plays a critical role [63].
When applying WT, selecting the mother wavelet is important. Daubechies and Meyer wavelets have been proven effective in hydrological time series modeling [37,61,64]. For the rainfall time series in this study, following the successful approach of Rajaee et al. [61] and Liu et al. [65], we applied the Meyer and Daubechies mother wavelets of order 4 and 2.
4. Model Application
4.1. Combination of Models
In this study, the two different pre-processing methods were combined with the ANN or SANN models, generating four possible combinations, to predict rainfall up to one month in advance. The structure of the combinations of the models is illustrated in Figure 5. Applying the discrete wavelet transform and seasonal decomposition, as pre-processing methods, can be very advantageous to make the neural network training more efficient.
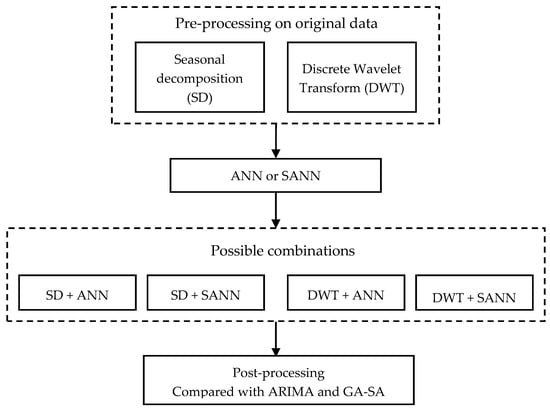
Figure 5.
The structure of the possible combinations of proposed methods.
DWT can capture rainfall time series characteristics and detect localized phenomena of nonstationary time series. For accomplishing this, the decomposition of measured rainfall time series to multi-frequent time series Rd1(t), Rd2(t), …, Rdi(t), Ra(t), where Rd1(t), Rd2(t), …, Rdi(t), and Ra(t), which are the details and approximation of rainfall time series, respectively, must first be completed. The variable di is the ith level of the decomposed time series and signifies the approximate time series. In this paper, the observed R time series were decomposed using three different mother wavelets in four levels. These three wavelet mother functions are depicted in Figure 4. The R signal decomposed to level 4 yields 5 sub-signals (the approximation at level 4 and detail at levels 1, 2, 3 and 4) by the Daubechies-2, 4 (db2 and db4) and Meyer wavelets. Figure 6 shows these sub-signals for the Meyer mother wavelet. It is important to note that the focus of the current study is to evaluate the effectiveness and accuracy of the proposed hybrid models, and not assessing the effects of different decomposition levels and sensitivity of the mother wavelet types in pre-processing by DWT.
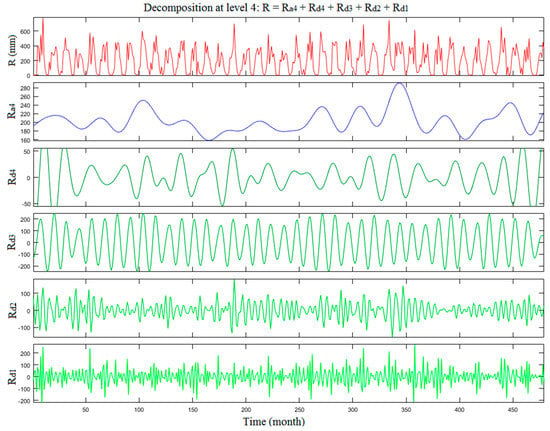
Figure 6.
Original, detail sub-signals, and approximation of Meyer (level 4).
The seasonal decomposition method is rooted in the notion that improvements of a forecast can be attained if the attributes of a data pattern can be separately identified. This model divides the original data into trend cycles TR(t), seasonality S(t), and irregular component IR(t). By considering each of these components separately as distinct inputs, the ANN model can be trained more efficiently. Figure 7 shows the three sub-sets of seasonal decomposition.

Figure 7.
Trend cycle, seasonality and irregular component of seasonal decomposition.
Finally, the pre-processed data were imposed to the ANN or SANN models and four possible combinations were created. Since there was no special rule for ANN and SANN model development, a trial and error method must be used to find the best network’s configuration. However, using the Kolmogorov’s theorem, Marques [66] and Hornik [67] stated that if there were enough neurons in a hidden layer, only one hidden layer should be sufficient to ensure that the network had the properties of a universal approximator for several problems [49]. Moreover, studies of [68,69,70] further proved that ANN with only one hidden layer can be used for different hydraulic and hydrologic modelling. It is shown that ANN is complex enough to accurately simulate nonlinear features of hydrological processes, such that by increasing the number of hidden layers the performance of the network does not improve significantly [49,61]. It is also validated that the Levenberg–Marquardt method is by far the most powerful learning algorithm that can be used for neural network training [37,71].
Another important concern is what type of activation function is selected for nodes. The most readily chosen functions include the Sigmoid and linear activation functions for hidden and output nodes, respectively. This allows for an ANN model to be more effective [61]. As a result, we fixed the number of hidden layers, activation functions, and learning algorithms to then investigate the optimum network architectures by only changing the number of hidden neurons from 3, 5, 8, 10 and 15. The optimal architectures selection is based on minimizing the difference between the predicted values of the neural network and the expected outputs. Model training is stopped when either an acceptable error level is achieved, or the number of iterations surpasses a fixed threshold. Fifty trials were tested when modifying the hidden neurons, a process that serves as the datum for assessing the performance of mean values, and the early stopping technique was applied to avoid overfitting. After applying the trial and error procedure, optimal model parameters of ANN and SANN for rainfall prediction was found for each combination.
4.2. Model Evaluation
Only the correlation coefficient (R) is inadequate for evaluating prediction models (e.g., Legates and McCabe [72]). Legates and McCabe [72] suggested model performance evaluations must include at least one goodness-of-fit or relative error measure (e.g., correlation coefficient: R) and one absolute error measure (e.g., mean absolute error: MAE, or root mean square error: RMSE). This study evaluated the performances of the ANN models via R, RMSE, and MAE. The correlation coefficient (R) quantifies the degree of similarity among the predicted and actual values. This index also measures how well independent variables that have been considered account for the variance of measured dependent variables. A greater predictive capability of a model is correlated to higher values of R, where values close to one indicate that the predicted values are nearly identical to the actual values. The square error of the prediction related to actual values, along with the square root of the summation value, is computed via RMSE. This parameter is then to be considered the average distance a data point is from the fitted line measured in the vertical direction. To supplement the RMSE, the mean absolute error, MAE, is a quantity that can measure how close predictions are to the measured outputs. The MAE calculates the average difference of error between the predicted and actual values without distinguishing the direction of the error. High confidence in predicted values of a model are understood when the values of RMSE and MAE are low.
5. Results and Discussion
The two different pre-processing mentioned above were used for predicting monthly rainfall time series at the Ca Mau station, Vietnam. Seasonal decomposition (SD) and discrete wavelet transform (DWT) were used in conjunction with ANN and SANN to predict monthly rainfall time series. As a result, the four different hybrid models were introduced, and the prediction results were compared with the ANN, SANN, ARIMA, and GA-SA models. Table 3 and Table 4 present the statistical performance indices of the 10 models for the testing and whole datasets, respectively. As can be seen from both the tables, the Meyer wavelet transform combined with SANN yielded a better result than other nine models for the testing phase. The obtained results indicated that DWT is better than SD. According to Table 3, the combination of Mayer wavelet and SANN trained with LM with 5 neurons provided the best efficiency with the highest value of R = 0.997 and the lowest RMSE of 12.105 mm and MAE of 9.321 mm. For the combinations between the SANN model and the two pre-processing methods, networks trained with 3 to 5 neurons showed good results and fast convergence because the input data contains the seasonality and periodic characteristics. While using wavelet transformation with the Daubechies wavelet of order 4 and 2, ANN required a higher number of neurons than SANN. With 10 neurons and applying the db2 and db4 wavelet transforms, the statistical performance for the model numbers 5 and 8, including R, RMSE, and MAE, varied in the ranges of 0.929 to 0.961, 62.108 to 46.109 mm, and 48.078 to 36.949 mm, respectively. These results demonstrated that without applying pre-processing methods, both ANN and SANN yielded the lowest performance with R, RMSE, and MAE equal to 0.806, 98.311 mm, 74.054 mm and 0.829, 92.886 mm, 74.225 mm, respectively. This proved the role of data pre-processing in improving model performances.

Table 3.
Statistical performance of different combined models (testing dataset).

Table 4.
The statistical performance of different combined models (whole dataset).
The accuracy of most of the models was reduced when the numbers of neurons in the networks increased to 10 or more (Table 3 and Table 4). The reason behind this might be due to overfitting during the training of the network. A comparison between seasonal decomposition and wavelet transform shows that the combination of DWT (Meyer mother wavelet) with both the ANN and SANN models statistically performed better when R, RMSE, and MAE equaled to 0.980, 33.531 mm, 26.354 mm and 0.998, 9.425 mm, 6.685 mm for the whole dataset, respectively. Seasonal decomposition also proved its capacity to cope with the time series data with non-stationarity and seasonal features. However, this method was less accurate compared to the wavelet transform method. The combination of seasonal decomposition and SANN provided relatively good results, but less accurate than wavelet transform (db2, db4) combined with SANN. In general, both the pre-processing methods combined with SANN produced acceptable predictions for monthly rainfall time series.
For the best four proposed hybrid models, the temporal variations of the observed and predicted rainfall are illustrated in Figure 8 and Figure 9. It is important to notice how the Meyer wavelet transform in combination with the ANN and SANN models when trained with LM produced better results for predicting rainfall than the other nine models. The regression line of these two models’ predicted values were closer to the 45° straight lines when compared with the others. It was also clear that most of the hybrid models using ANN underestimated measured values, except for the case of using the DWT pre-processor. The most accurate result was the combination of Meyer mother wavelet and SANN, where predicted peaks fitted relatively well and were consistent with observed rainfall peaks.
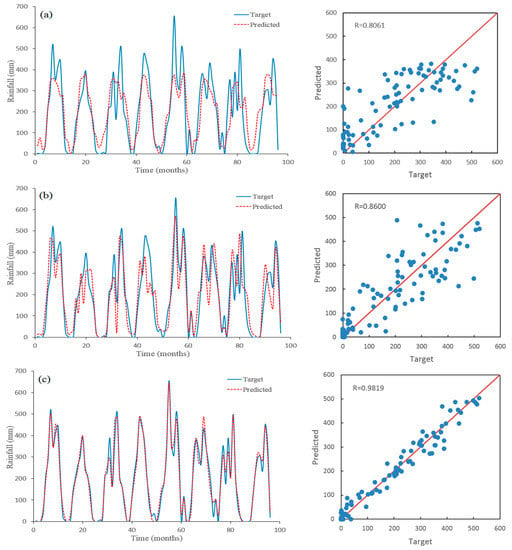
Figure 8.
Predicted rainfall using Feed-forward Neural Network (ANN) for the testing period; (a) no pre-processing, (b) pre-processed by seasonal decomposition, (c) pre-processed by discrete wavelet transform (Meyer).
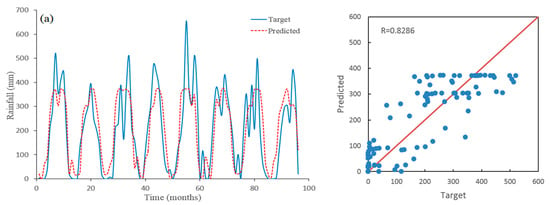
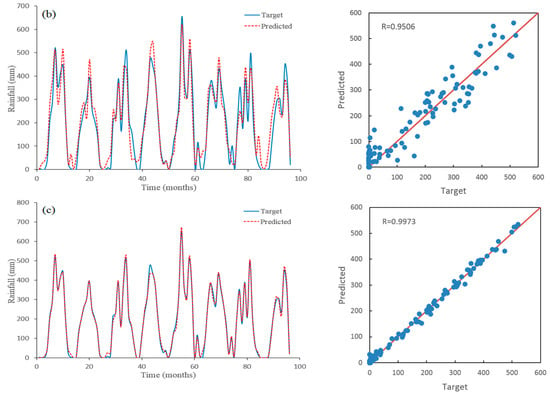
Figure 9.
Predicted rainfall using Seasonal Artificial Neural Network (SANN) for the testing period; (a) no pre-processing, (b) pre-processed by seasonal decomposition, (c) pre-processed by discrete wavelet transform (Meyer).
In this study, we also compared the proposed methods with traditional models, namely ARIMA and GA-SA. Table 5 presents comparisons of the statistical performance between our proposed hybrid methods and the ARIMA and GA-SA models. The results show that the ARIMA model produced the lowest performance and poor prediction in which R, RMSE, and MAE (Figure 10) equaled to 0.763, 108.07 mm, 83.234 mm. This is because this model is simple and has a linear structure that does not have the ability in capturing the seasonal characteristics of time series data and non-stationarity feature of rainfall. For the GA-SA model, although we can apply GA algorithms for global searching and SA methods for optimizing the simulation of a local solution, this model still has some limitations. The training process of the GA-SA model is considerably time-consuming, and it has a complicated structure. Compared to model number 1 and 6, the GA-SA performance is in line with them. The most important disadvantage of GA-SA is that there is no gradient descent in searching and training data application so that the training process is based on the trial and error method and user experiences. We created the Taylor diagram (Figure 11) to illustrate the performances of all the eight models with describing the correlation and standard deviation simultaneously. Figure 11 shows that the combination of Meyer wavelet and SANN (number 6) located nearest the reference curve with the correlation R = 0.997, and after that, the combination of Meyer wavelet and ANN (number 5) also resulted in a close relationship between predicted and reference values (R = 0.982).

Table 5.
Comparison of proposed methods and ARIMA and Genetic Algorithm and Simulated Annealing algorithm (GA-SA) methods for the testing period.
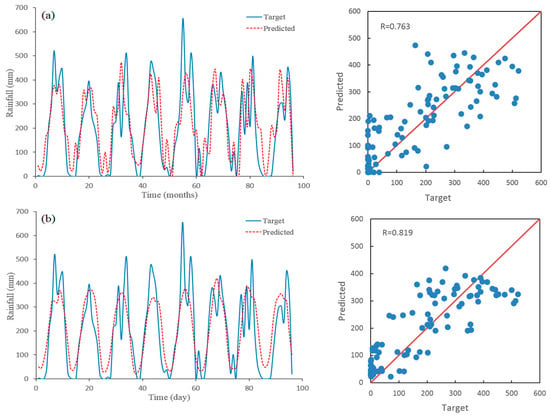
Figure 10.
Predicted rainfall using (a) Autoregressive Integrated Moving Average (ARIMA), and (b) GA-SA models for the testing period.
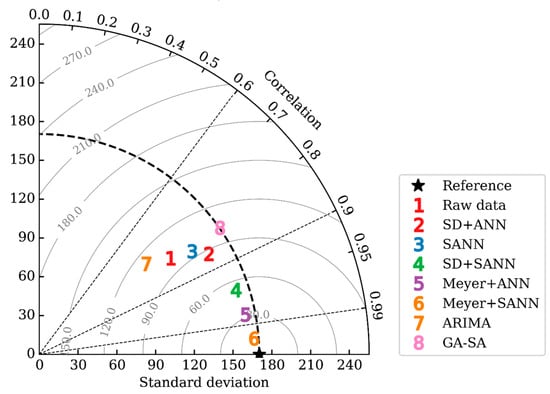
Figure 11.
Taylor diagram for comparing the statistical performance of eight models.
6. Conclusions
This study attempted to investigate the applicability of several hybrid models in predicting monthly rainfall at the Ca Mau meteorological station in Vietnam. These hybrid models were developed by combining the two pre-processing data methods, including seasonal decomposition and wavelet transform, with the ANN and SANN models. By comparing predicted results, we found that the combination of the Meyer wavelet and SANN model provided the best prediction of rainfall compared to the other models. We also compared the proposed hybrid models with traditional models such as the ARIMA and GA-SA models. It was proved that our proposed models produced a better prediction than the conventional models. Statistical analysis showed that the Meyer wavelet transforms in conjunction with SANN could improve the performance of seasonal time series predictions. It was also found that the seasonal decomposition method combined with the SANN model can capture monthly rainfall patterns. This combination had the best statistical performance in terms of the correlation coefficient, R, the mean absolute error, MAE, and the root mean square error, RMSE which equaled to 0.997, 9.321 mm, and 12.105 mm, respectively. Finally, it can be surmised that the proposed models of this study, which showed a better performance than the traditional models such as ARIMA and GA-SA, can be used to improve the conventional ANN simulations for the prediction of monthly rainfall data.
Author Contributions
D.T.A. designed the study, processed and analyzed the data, developed the models, interpreted the results and wrote the paper. S.P.V. provided data, assisted in the data analyses and drafting the manuscript. The study has been carried out together by D.T.A., S.P.V. and T.D.D., who contributed to the model development stage with theoretical considerations and practical guidance, assisted in the interpretations and integration of the results and helped in preparation of this paper with proof reading and corrections.
Funding
This research was funded by the Vietnamese–German University for Innovation Science and Technology Fund program, grant number IST-VGU-IF20036.
Acknowledgments
This paper was produced with a financial support of the CUOMO Foundation. The contents of this paper are solely the liability of the authors and under no circumstances may be considered a reflection of the views of the Cuomo Foundation and/or the IPCC. Wholehearted thanks are given to the Department of Agriculture and Rural Development of Ca Mau city, the Southern Regional Hydro-meteorological Center and the National meteorological center for providing all necessary data.
Conflicts of Interest
The authors declare no conflict of interest.
References
- French, M.N.; Krajewski, W.F.; Cuykendall, R.R. Rainfall forecasting in space and time using neural network. J. Hydrol. 1992, 137, 1–31. [Google Scholar] [CrossRef]
- Trömel, S.; Schönwiese, C.D. A generalized method of time series decomposition into significant components including probability assessments of extreme events and application to observational German precipitation data. Meteorol. Z. 2005, 14, 417–427. [Google Scholar] [CrossRef]
- Davolio, S.; Miglietta, M.M.; Diomede, T.; Marsigli, C.; Morgillo, A.; Moscatello, A. A meteo-hydrological prediction system based on a multi-model approach for precipitation forecasting. Nat. Hazards Earth Syst. Sci. 2008, 8, 143–159. [Google Scholar] [CrossRef]
- Diomede, T.; Davolio, S.; Marsigli, C.; Miglietta, M.M.; Moscatello, A.; Papetti, P.; Paccagnella, T.; Buzzi, A.; Malguzzi, P. Discharge prediction based on multi-model precipitation forecasts. Meteorol. Atmos. Phys. 2008, 101, 245–265. [Google Scholar] [CrossRef]
- García-Mozo, H.; Yaezel, L.; Oteros, J.; Galán, C. Statistical approach to the analysis of olive long-term pollen season trends in southern Spain. Sci. Total Environ. 2014, 473, 103–109. [Google Scholar] [CrossRef] [PubMed]
- Mahsin, M. Modeling rainfall in Dhaka division of Bangladesh using time series analysis. J. Math. Model. Appl. 2011, 1, 67–73. [Google Scholar]
- Al-Ansari, N.A.; Shamali, B.; Shatnawi, A. Statistical analysis at three major meteorological stations in Jordan, Al Manara. J. Sci. Stud. Res. 2006, 12, 93–120. [Google Scholar]
- Al-Hajji, A.H. Study of Some Techniques for Processing Rainfall Time Series in the North Part of Iraq. Unpublished Master’s Thesis, Mosul University, Mosul, Iraq, 2004. [Google Scholar]
- Weesakul, U.; Lowanichchai, S. Rainfall Forecast for Agricultural Water Allocation Planning in Thailand. Thammasat Int. J. Sci. Tech. 2005, 10, 18–27. [Google Scholar]
- Chiew, G.H.S.; Stewardson, M.J.; Mcmahon, T.A. Comparison of six rainfall-runoff modeling approaches. J. Hydrol. 1993, 147, 1–36. [Google Scholar] [CrossRef]
- Langu, E.M. Detection of changes in rainfall and runoff patterns. J. Hydrol. 1983, 147, 153–167. [Google Scholar] [CrossRef]
- Brath, A.; Montanari, A.; Toth, E. Neural networks and non-parametric methods for improving real time flood forecasting through conceptual hydrological models. Hydrol. Earth Syst. Sci. 2002, 6, 627–640. [Google Scholar] [CrossRef]
- Tseng, F.M.; Yub, H.C.; Tzeng, G.H. Combining neural network model with seasonal time series ARIMA model. Technol. Forecast. Soc. Chang. 2002, 69, 71–87. [Google Scholar] [CrossRef]
- Toth, E.; Montanari, A.; Brath, A. Comparison of short-term rainfall prediction model for real-time flood forecasting. J. Hydrol. 2000, 239, 132–147. [Google Scholar] [CrossRef]
- Son, M.; Tuan, N.L.A.; Khoa, N.T.C.T.; Loc, L.Q.; Vinh, L.N. A new approach to time series forecasting using Simulated Annealing Algorithms. In Proceedings of the International Workshop on Advanced Computing and Applications, Las Vegas, NV, USA, 8–10 November 2010; pp. 190–199. [Google Scholar]
- Chiu, Y.C.; Chang, L.C.; Chang, F.J. Using a hybrid genetic algorithm–simulated annealing algorithm for fuzzy programming of reservoir operation. Hydrol. Process. Int. J. 2007, 21, 3162–3172. [Google Scholar] [CrossRef]
- Oliveira, R.; Loucks, D.P. Operating rules for multi-reservoir systems. Water Resour. Res. 1997, 33, 839–852. [Google Scholar] [CrossRef]
- Pardo-Igúzquiza, E. Optimal selection of number and location of rainfall gauges for areal rainfall estimation using geostatistics and simulated annealing. J. Hydrol. 1998, 210, 206–220. [Google Scholar] [CrossRef]
- Wardlaw, R.; Sharif, M. Evaluation of genetic algorithms for optimal reservoir system operation. J. Water Resour. Plan. Manag. 1999, 125, 25–33. [Google Scholar] [CrossRef]
- Chang, F.J.; Chen, L.; Chang, L.C. Optimizing the reservoir operation rule curves by genetic algorithms. Hydrol. Process. 2005, 19, 2277–2289. [Google Scholar] [CrossRef]
- Cortez, P.; Rocha, M.; Neves, J. A Meta-Genetic Algorithms for Time Series Forecasting. In Proceedings of the Workshop on Artificial Intelligence Techniques for Financial Time Series Analysis (AIFTSA-01). In Proceedings of the 10th Portuguese Conference on Artificial Intelligence, Porto, Portugal, 17–20 December 2001. [Google Scholar]
- Maier, H.R.; Dandy, G.C. Application of neural networks to forecasting of surface water quality variables: Issues, applications and challenges. Environ. Model. Softw. 2000, 15, 348. [Google Scholar] [CrossRef]
- Maier, H.R. Application of natural computing methods to water resources and environmental modelling. Math. Comput. Model. 2006, 44, 413–414. [Google Scholar] [CrossRef]
- Hsu, K.; Gupta, H.V.; Sorooshian, S. Artificial neural network modeling of the rainfall-runoff process. Water Resour. Res. 1995, 31, 2517–2530. [Google Scholar] [CrossRef]
- Shamseldin, A.Y. Application of a neural network technique to rainfall-runoff modeling. J. Hydrol. 1997, 199, 272–294. [Google Scholar] [CrossRef]
- Zealand, C.M.; Burn, D.H.; Simonovic, S.P. Short term streamflow forecasting using artificial neural networks. J. Hydrol. 1999, 214, 32–48. [Google Scholar] [CrossRef]
- Abrahart, R.J.; See, L. Comparing neural network and autoregressive moving average techniques for the provision of continuous river flow forecast in two contrasting catchments. Hydrol. Proc. 2000, 14, 2157–2172. [Google Scholar] [CrossRef]
- Somvanshi, V.K.; Pandey, O.P.; Agrawal, P.K.; Kalanker, N.V.; Prakash, M.R.; Ramesh, C. Modelling and Prediction of Rainfall Using Artificial Neural Network and ARIMA Techniques. J. Ind. Geophys. Union 2006, 10, 141–151. [Google Scholar]
- Nelson, M.; Hill, T.; Remus, T.; O’Connor, M. Time series forecasting using neural networks. Should the data be deseasonalized first? J. Forecast. 1999, 18, 359–367. [Google Scholar] [CrossRef]
- Hill, T.; O’Connor, M.; Remus, W. Neural network models for time series forecasts. Manag. Sci. 1996, 42, 1082–1092. [Google Scholar] [CrossRef]
- Sivakumar, B.; Jayawardena, A.W.; Fernando, T.M.K.G. River flow forecasting: Use of phase-space reconstruction and artificial neural networks approaches. J. Hydrol. 2002, 265, 225–245. [Google Scholar] [CrossRef]
- Sharda, R.; Patil, R.B. Connectionist approach to time series prediction: An empirical test. J. Intell. Manuf. 1992, 3, 317–323. [Google Scholar] [CrossRef]
- Wu, C.L.; Chau, K.W.; Fan, C. Prediction of rainfall time series using modular artificial neural networks coupled with data-preprocessing techniques. J. Hydrol. 2010, 389, 146–167. [Google Scholar] [CrossRef]
- Hamzaçebi, C. Improving artificial neural networks performance in seasonal time series forecasting. Inf. Sci. 2008, 178, 4550–4559. [Google Scholar] [CrossRef]
- Ahaneku, I.E.; Otache, Y.M. Stochastic characteristics and modelling of monthly rainfall time series of Ilorin, Nigeria. Open J. Modern Hydrol. 2014, 4, 67. [Google Scholar]
- Benkachcha, S.; Benhra, J.; El Hassani, H. Seasonal time series forecasting model based on Artificial Neural Network. Int. J. Comput. Appl. 2015, 116, 9–14. [Google Scholar]
- Wu, C.L.; Chau, K.W.; Li, Y.S. Methods to improve neural network performance in daily flows prediction. J. Hydrol. 2009, 372, 80–93. [Google Scholar] [CrossRef]
- Sang, Y.F. A review on the applications of wavelet transform in hydrology time series analysis. Atmos. Res. 2013, 122, 8–15. [Google Scholar] [CrossRef]
- McCann, D.W. A neural network short-term forecast of significant thunderstorms. Weather Forecast. 1992, 7, 525–534. [Google Scholar] [CrossRef]
- Kalogirou, S.; Neocleous, C.; Michaelides, S.; Schizas, C. A time series reconstruction of precipitation records using artificial neural networks. Proc. EUFIT 1997, 97, 2409–2413. [Google Scholar]
- Lee, S.; Cho, S.; Wong, P.M. Rainfall prediction using artificial neural networks. J. Geogr. Inf. Decis. Anal. 1998, 2, 233–242. [Google Scholar]
- Guhathakurta, P. Long-range monsoon rainfall prediction of 2005 for the districts and sub-division Kerala with artificial neural network. Curr. Sci. 2006, 90, 773–779. [Google Scholar]
- Paras, S.M.; Kumar, A.; Chandra, M. A feature based on weather prediction using ANN. World Acad. Sci. Eng. Technol. 2007, 34. [Google Scholar]
- Baboo, S.S.; Shereef, I.K. An efficient weather forecasting system using artificial neural network. Int. J. Environ. Sci. Dev. 2010, 1, 321. [Google Scholar] [CrossRef]
- Wong, K.W.; Wong, P.M.; Gedeon, T.D.; Fung, C.C. Rainfall prediction model using soft computing technique. Soft Comput. 2003, 7, 434–438. [Google Scholar] [CrossRef]
- Liu, X.; Zhang, A.; Shi, C.; Wang, H. Filtering and multi-scale RBF prediction model of rainfall based on EMD method. In Proceedings of the 2009 1st International Conference on Information Science and Engineering (ICISE), Nanjing, China, 26–28 December 2009; pp. 3785–3788. [Google Scholar]
- Haykin, S. Neural Networks. A Comprehensive Foundation, 2nd ed.; Prentice Hall: Englewood Cliffs, NJ, USA, 1999; p. 696. [Google Scholar]
- Bhattacharya, B.; Deibel, I.K.; Karstens, S.A.M.; Solomatine, D.P. Neural networks in sedimentation modelling for the approach channel of the port area of Rotterdam. In Proceedings in Marine Science; Elsevier: Amsterdam, The Netherlands, 2007; Volume 8, pp. 477–492. [Google Scholar]
- Bui, M.D.; Keivan, K.; Penz, P.; Rutschmann, P. Contraction scour estimation using data-driven methods. J. Appl. Water Eng. Res. 2015, 3, 143–156. [Google Scholar] [CrossRef]
- Shahin, M.A.; Maier, H.R.; Jaksa, M.B. Closure to “Predicting settlement of shallow foundations using neural networks” by Mohamed A. Shahin, Holger R. Maier, and Mark B. Jaksa. J. Geotech. Geoenviron. Eng. 2003, 129, 1175–1177. [Google Scholar] [CrossRef]
- Box, G.E.P.; Jenkins, G.M. Time Series Analysis: Forecasting, and Control; Holden Day: San Francisco, CA, USA, 1976. [Google Scholar]
- Kirpatrick, S.; Gelatt, C.D.; Vecchi, M.P. Optimazation by simulated annealing. Science 1983, 220, 671–680. [Google Scholar] [CrossRef] [PubMed]
- Dang, T.D.; Cochrane, T.A.; Arias, M.E.; Van, P.D.T. Future hydrological alterations in the Mekong Delta under the impact of water resources development, land subsidence and sea level rise. J. Hydrol. Reg. Stud. 2018, 15, 119–133. [Google Scholar] [CrossRef]
- Altun, H.; Bilgil, A.; Fidan, B.C. Treatment of multi-dimensional data to enhance neural network estimators in regression problems. Expert Syst. Appl. 2007, 32, 599–605. [Google Scholar] [CrossRef]
- Basak, A.; Mengshoel, O.J.; Kulkarni, C.; Schmidt, K.; Shastry, P.; Rapeta, R. Optimizing the decomposition of time series using evolutionary algorithms: Soil moisture analytics. In Proceedings of the Genetic and Evolutionary Computation Conference, Berlin, Germany, 15–19 July 2017; pp. 1073–1080. [Google Scholar]
- Findley, D.F.; Monsell, B.C.; Bell, W.R.; Otto, M.C.; Chen, B.C. New capabilities and methods of the X-12-ARIMA seasonal adjustment program. J. Bus. Econ. Stat. 1998, 16, 127–176. [Google Scholar]
- Shuai, Y.; Masek, J.G.; Gao, F.; Schaaf, C.B. An algorithm for the retrieval of 30-m snow-free albedo from Landsat surface reflectance and MODIS BRDF. Remote Sens. Environ. 2011, 115, 2204–2216. [Google Scholar] [CrossRef]
- Laniel, N. Design Criteria for the 13-Term Henderson End-Weights; Working Paper; Methodology Branch, Statistics Canada: Ottawa, ON, Canada, 1985. [Google Scholar]
- Sang, Y.F. A practical guide to discrete wavelet decomposition of hydrologic time series. Water Resour. Manag. 2012, 26, 3345–3365. [Google Scholar] [CrossRef]
- Goodwin, M.M. The STFT, sinusoidal models, and speech modification. In Handbook of Speech Processing; Benesty, J., Sondhi, M.M., Huang, Y., Eds.; Springer: Berlin, Germany, 2008; pp. 229–258. [Google Scholar]
- Rajaee, T. Wavelet and ANN combination model for prediction of daily suspended sediment load in rivers. Sci. Total Environ. 2011, 409, 2917–2928. [Google Scholar] [CrossRef] [PubMed]
- Labat, D.; Ababou, R.; Mangin, A. Rainfall–runoff relations for karstic springs. Part II: continuous wavelet and discrete orthogonal multiresolution analyses. J. Hydrol. 2000, 238, 149–178. [Google Scholar] [CrossRef]
- Gupta, K.K.; Gupta, R. Despeckle and geographical feature extraction in SAR images by wavelet transform. ISPRS J. Photogramm. Remote Sens. 2007, 62, 473–484. [Google Scholar] [CrossRef]
- Nourani, V.; Komasi, M.; Mano, A. A Multivariate ANN–Wavelet Approach for Rainfall-Runoff Modeling. J. Water Resour. Manag. 2009, 23, 2877–2894. [Google Scholar] [CrossRef]
- Liu, Y.; Sergey, F. Seismic data analysis using local time-frequency decomposition. J. Geophys. Prospect. 2013, 61, 516–525. [Google Scholar] [CrossRef]
- Marquez, M.; White, A.; Gill, R. A hybrid neural network, feature-based manufacturability analysis of mould reinforced plastic parts. Proc. Inst. Mech. Eng. Part B J. Manuf. Eng. 2001, 215, 1065–1079. [Google Scholar] [CrossRef]
- Hornik, K.; Stinchocombe, M.; White, H. Multilayer feedforward networks are universal approximators. Neural Netw. 1989, 2, 359–366. [Google Scholar] [CrossRef]
- Zhang, G.; Patuwo, B.E.; Hu, M.Y. Forecasting with artificial neural networks: The state of the art. Int. J. Forecast. 1998, 14, 35–62. [Google Scholar] [CrossRef]
- Dawson, C.W.; Wilby, R.L. Hydrological modeling using artificial neural networks. Prog. Phys. Geographys. 2001, 25, 80–108. [Google Scholar] [CrossRef]
- De Vos, N.J.; Rientjes, T.H.M. Constraints of artificial neural networks for rainfall-runoff modeling: Trade-offs in hydrological state representation and model evaluation. Hydrol. Earth Syst. Sci. 2005, 9, 111–126. [Google Scholar] [CrossRef]
- Schmitz, J.E.; Zemp, R.J.; Mendes, M.J. Artificial neural networks for the solution of the phase stability problem. Fluid Phase Equilibria 2006, 245, 83–87. [Google Scholar] [CrossRef]
- Legates, D.R.; McCabe, G.J., Jr. Evaluating the use of “goodness-of-fit” measures in hydrologic and hydroclimatic model validation. Water Resour. Res. 1999, 35, 233–241. [Google Scholar] [CrossRef]
© 2018 by the authors. Licensee MDPI, Basel, Switzerland. This article is an open access article distributed under the terms and conditions of the Creative Commons Attribution (CC BY) license (http://creativecommons.org/licenses/by/4.0/).