Article

Agrivoltaics Systems for Clean Production: Environmental Impact of Configurations Variation Through Life Cycle Assessment and Comparison with Agriculture System and PV Power Plant


1
Laboratoire Energies Renouvelable et Efficacité Energétique, Institut International d’Ingénierie de l’Eau et de l’Environnement (2iE), Rue de la Science, Ouagadougou 01 BP 594, Burkina Faso
2
Laboratoire des Sciences Biologiques, Agronomique, Alimentaire et Modélisation des Systèmes Complexes (LABAAM), Gaston Berger University, Saint-Louis BP 234, Senegal
3
Laboratoire d’Energétique et de Mécanique Appliquée (LEMA), Ecole Polytechnique d’Abomey-Calavi, Cotonou 01 BP 2009, Benin
*
Author to whom correspondence should be addressed.
Clean Technol. 2026, 8(3), 93; https://doi.org/10.3390/cleantechnol8030093
Submission received: 1 March 2026 / Revised: 6 May 2026 / Accepted: 25 May 2026 / Published: 15 June 2026

Highlights

What are the main findings?
  • The environmental impacts strongly depend on agrivoltaic system configuration and PV panel dimensions, and among the assessed scenarios, agrivoltaics configuration case 3, which has panel spacing of 2 m, panel row spacing of 2 m and panel elevation of 2.3 m, achieved the highest environmental-land performance balance.
  • Photovoltaic power plants exhibited the highest impacts across most environmental categories compared with agrivoltaics alternatives.
What are the implications of the main findings?
  • Agrivoltaics systems improve land-use efficiency by simultaneously supporting agricultural production and photovoltaic energy generation.
  • The optimal agrivoltaic configuration reached a Land Equivalent Ratio of 148.7%, demonstrating superior multifunctional land use efficiency when using high-density agrivoltaics systems.

Abstract

Agrivoltaics is a promising technique, especially in view of the rapid population growth associated with the expansion of cultivated areas to satisfy the food demands of the population, and the increase in solar power plants, which require considerable space to supply the population with energy. Thus, the transition from agricultural to agrivoltaics systems and the transition from PV power plants to agrivoltaics systems can enable more efficient use of land for energy and agricultural production. However, the configuration of agrivoltaics systems, namely panel elevation, spacing between panels and between rows of panels, and panel size, defines the amount of material used. As a result, configuration can have a major impact on the environment. The aim of this study is to highlight the environmental impact from converting 1 ha of land used entirely for agricultural production to 1 ha of an agrivoltaic system, and from converting 1 ha of land used entirely for solar photovoltaic energy production to 1 ha of an agrivoltaic system through a life cycle assessment. Three different configurations of agrivoltaics systems are considered to assess the environmental potential of agrivoltaics configurations. This analysis is performed with SimaPro 9.4 software, using the ReCiPe Midpoint (H) method and the Eco-invent database. The study determined impacts on global warming, stratospheric ozone depletion, ionizing radiation, ozone formation, mineral resource scarcity, fossil resource scarcity, water consumption, and land use through the determination of the Land Equivalent Ratio (LER). The results show that impacts are highest for PV power plants, followed by the agrivoltaic system with the largest PV panels for all indicators, except for stratospheric ozone depletion, where impacts are highest for agrivoltaics and agricultural use systems. The results of the land evaluation showed that the agrivoltaic system Case 3 gave the best performance, with a Land Equivalent Ratio of 148.7%.

1. Introduction

Globally, the population is growing at a significant rate, leading to an increase in food insecurity [1]. Population growth needs to be matched by an expansion in cultivated areas. According to forecasts, food production needs to be increased by 60% [2] or even doubled to meet the population’s needs in the face of population growth and changing diets [3]. Moreover, the impact on poorer nations facing food shortages is far more critical, as more land and energy resources are needed to meet future demands. The use of irrigation has become widespread at different scales around the world. Irrigation makes it possible to diversify crops and increase yields [4], which in turn helps meet people’s demand for food products. However, irrigation is the sector that consumes the most water. Around 72% of freshwater extraction worldwide and 90% in developing countries is destined for irrigated agriculture [5,6]. Also, groundwater remains the main source of freshwater for many agricultural areas when surface water resources are limited [7]; it is a reliable source of water in arid and semi-arid regions [8], while the use of groundwater requires large amounts of energy [9,10]. The energy requirements for groundwater extraction are higher than those for surface water [11]. The main energy sources used for irrigation are fuel (genset) and electricity from the grid, which are not always accessible or are not sustainable [12]. These energy sources are expensive, particularly in Africa, especially among low-income smallholder farmers [13], and are associated with a negative impact on the environment [14,15]. Indeed, they contribute to greenhouse gas emissions that accelerate climate change. Nevertheless, mitigation of environmental damage is possible thanks to renewable resources such as solar, wind, etc. Indeed, solar and wind pumping for irrigation is an environmentally friendly and cost-effective alternative for irrigated agriculture [16]. These renewable energy sources can replace diesel, particularly in regions where water is scarce and access to the electricity grid is limited. Traditionally, wind power was the most commonly used energy for pumping, but solar power was taken into consideration in the early 1980s [16], being one of the largest sources of energy available in the world [4]. Moreover, 20% of global energy consumption comes from renewables, and investment in that sector is concentrated around 30% in wind power and 60% in solar power [17]. In addition, photovoltaic panels are among the world’s leading renewable energy technologies, with costs steadily falling over the years. According to forecasts, 25% of the electricity needed in 2050 would come from solar photovoltaics, with a 4.9 Gt reduction in CO2 corresponding to a 21% cut in emissions in the energy sector [18]. However, one of the constraints on the development of photovoltaic systems is increased competition for land due to high population growth and rising food demand [19]. One solution to this problem is therefore the adoption of agrivoltaics systems. These are dual-use systems that involve raising photovoltaic panels to use the space beneath the panels for agricultural purposes [20,21,22,23,24]. Nevertheless, as with any technology, it is interesting to carry out a life cycle assessment study of agrivoltaics systems to determine their environmental impacts, as these systems enable agricultural and energy production, and are made up of a set of components that can have an impact on the environment during the system’s life cycle. To this end, life cycle assessment studies of agrivoltaics systems have been carried out in the literature. Some of these studies have focused on the impact of agrivoltaics systems that combine energy production with animal husbandry [25,26,27]. Thus, Pascaris et al. [25] assessed the environmental impacts of an agrivoltaic system that combines energy production with rabbit production. Handler and Pearce [26] studied the environmental performance of sheep-based agrivoltaics systems. Zhang et al. [27] studied the environmental impacts of energy production combined with pasture production. However, LCA studies of agrivoltaics systems combining energy production and agricultural production [28,29] are few and did not consider the impact of the complete system comprising the PV system and irrigation system components. Ott et al. [28] compared the environmental impact of PV systems with conventional PV systems and coal-fired power plants. However, this study focused only on the impact category of global warming potential up to the end of the system’s life and on land use and water consumption. Wagner et al. [29] assessed the environmental impacts of switching from single-use agriculture to agrivoltaics systems of one existing configuration of an agrivoltaic system in Germany, taking into account the photovoltaic system and agricultural production. Krexner et al. [30] conducted a comparative study of the environmental performance of a vertical bifacial and a stilted agrivoltaic system with single-use agricultural systems and a single-use energy production system through a life cycle assessment study in Austria. In their study, they considered PV field components, the energy used, and the agricultural production.
However, none of these studies evaluated the impact of varying the configuration of agrivoltaics systems, such as variation in panel height, variation in spacing between panels and between rows of panels, variation of the number of panels per table, and variation in panel type on climate change, natural resources, and soil. Indeed, variation in configuration can have a severe impact on the amount of equipment used, on water resources used in agriculture, and on soil use efficiency. In addition, these studies took into account the impacts due to the PV systems and the crops, without considering the components of the irrigation system. However, the use of agrivoltaics systems combining energy production and agricultural production leads to an expansion of irrigated areas while irrigation can have an impact on the environment due to the equipment used and the energy consumed to pump water. Furthermore, the agrivoltaics systems reduce evaporation and increase soil moisture which can reduce irrigation crop water requirements. As a result, they can have an impact on water use for irrigation. Thus, taking both these factors into consideration, it would be interesting to assess the environmental impact of the complete agrivoltaics systems, including of the components of the PV field, irrigation system, and agricultural practices. To this end, this study aims to assess the environmental impact of various agrivoltaics system configurations and to highlight the environmental impact from converting 1 ha of land used entirely for agricultural production to 1 ha of an agrivoltaic system, and from converting 1 ha of land used entirely for solar photovoltaic energy production to 1 ha of an agrivoltaic system. The study therefore consists of comparing three configurations of agrivoltaics systems and in comparing agrivoltaics systems with monoculture systems and solar photovoltaic power plants, based on the occupation of 1 ha of land for each system, through a life cycle analysis. It also provides information on the impact of variations in agrivoltaics configurations on the environment.

2. Materials and Methods

In this section, the following points were made: (i) definition of goals and scope of application, (ii) determination of the different stages of the life cycle considered, and (iii) evaluation of the equipment used and definition of the tasks performed during the entire cycle.

2.1. Definition of Goals and Scope of Application

The aim of this LCA is to evaluate and demonstrate the environmental impacts resulting from different configurations of agrivoltaics systems. Specifically, it examines variations in the mounting structure height, the spacing between and within panel rows, the number of panels per table, and the type of photovoltaic panels used. Additionally, this LCA seeks to highlight the environmental implications of transitioning from single-use photovoltaic (PV) power plants to dual-use agrivoltaics systems, as well as from conventional agricultural land use to agrivoltaics systems. To achieve this, the study compares the environmental impacts associated with converting 1 hectare of land used solely for agriculture or solely for PV energy production into 1 hectare of an agrivoltaics system that combines both agricultural and energy production. Indeed, agrivoltaics systems are very promising systems, especially in developing countries, as they have the potential to contribute to satisfying the population demand for food and energy. However, equipment used varies considerably in agrivoltaics systems depending on the system configuration, namely the height of panel elevation, the spacing between panel tables and between rows of panel tables, the size of panels and panel tables, and the type of panels used. To this end, the environmental impact may vary significantly depending on the configuration. Thus, this study is intended for political decision-makers, environmental impact practitioners, populations and associations, industries, and all organizations interested in implementing agrivoltaics systems to help them make decisions on optimizing the configuration and choosing the best configurations to reduce the environmental impact of these systems. As a result, this study provides information on the environmental impact of varying agrivoltaics system configurations and highlights the environmental impact of substituting PV power plants or agricultural land with dual-use agrivoltaics systems.
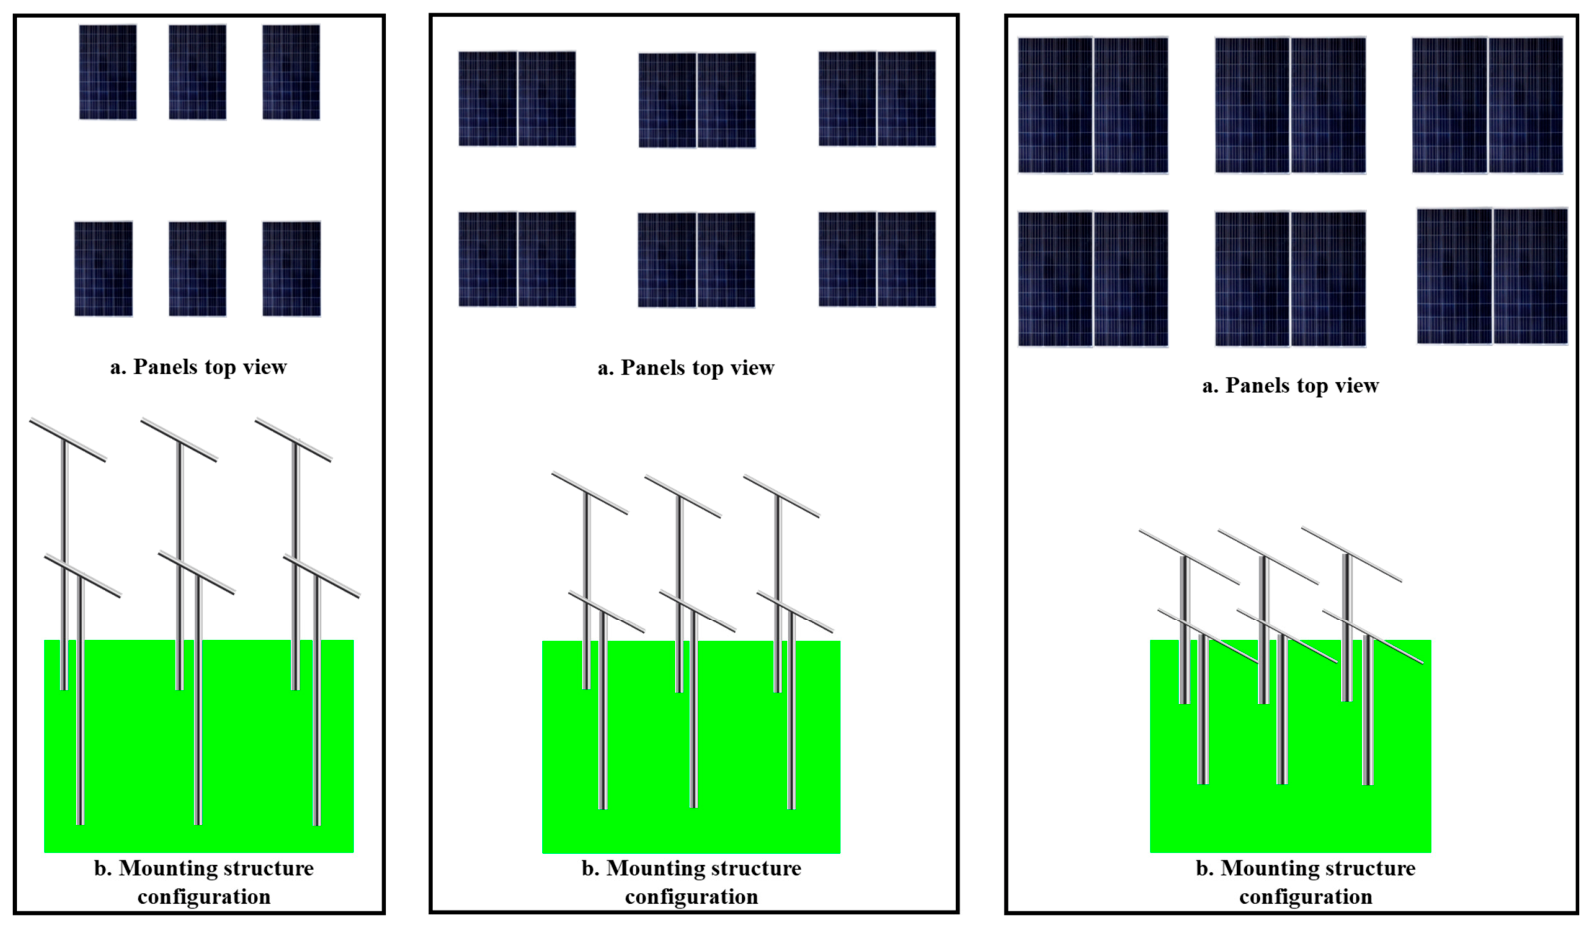
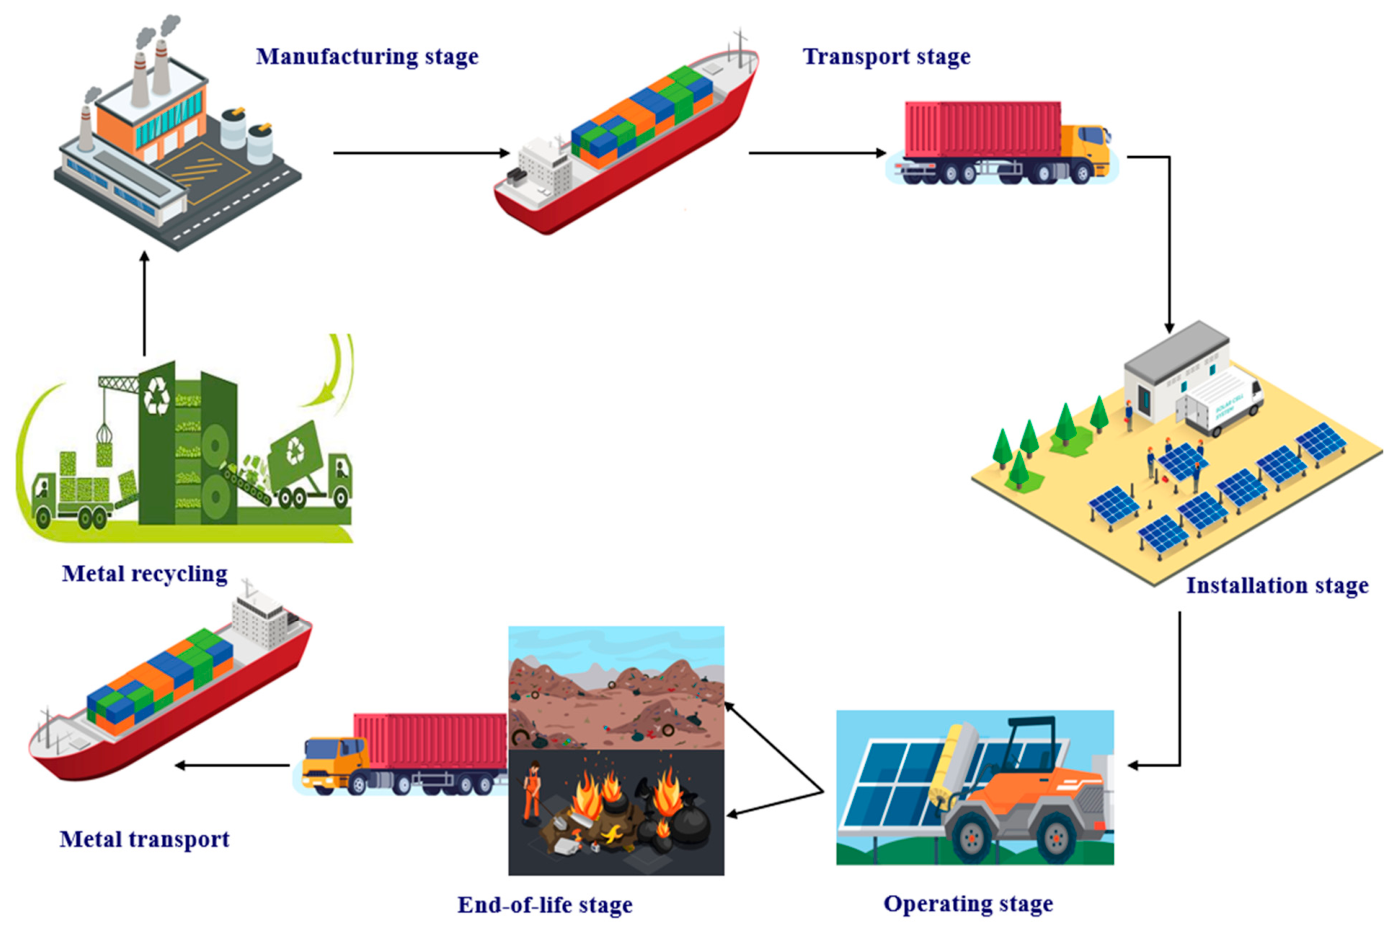
The functional unit is the occupation of 1 ha of land for each system studied [28,29]. The LCA is carried out considering a lifetime of 25 years, as this is the lifetime used in most life cycle assessment studies of PV systems, given that panels have a minimum lifetime of 25 years [31,32,33,34]. It is carried out by considering the manufacturing stage of the equipment used, the transport stage, the system installation stage, the operation stage, and the end-of-life stage (Section 3). In addition, irrigation water requirements and crop yields are different for the different configurations of agrivoltaics systems and are considered in the operating stage in which agricultural production is included. Three agrivoltaics system configurations are compared with traditional agriculture and the solar PV power plant. In fact, the quantity of equipment used varies significantly depending on the configuration used for the agrivoltaics systems. As a result, configuration can have a considerable impact on the environment. For this reason, three types of configurations have been considered for the same surface area. These configurations were not chosen at random; they are from a study carried out to determine the best configuration for optimizing energy and agricultural production in agrivoltaics systems [35]. These are as follows:
  • Case 1, in which 100 W panels are used. The surface area of each panel is 0.68 m2, with 1 panel per table. Panel spacing is 1.3 m, panel row spacing is 4.4 m, and panel elevation is 4 m;
  • Case 2, in which 100 W panels are used. The surface area of a panel is 0.68 m2, with 2 panels per table. Panel spacing is 1.9 m, panel row spacing is 3.2 m, and panel elevation is 3.4 m;
  • Case 3, in which 260 W panels are used. The surface area of a panel is 1.62 m2, with 2 panels per table. Panel spacing is 2 m, panel row spacing is 2 m, and panel elevation is 2.3 m.
The configurations studied are shown in Figure 1.
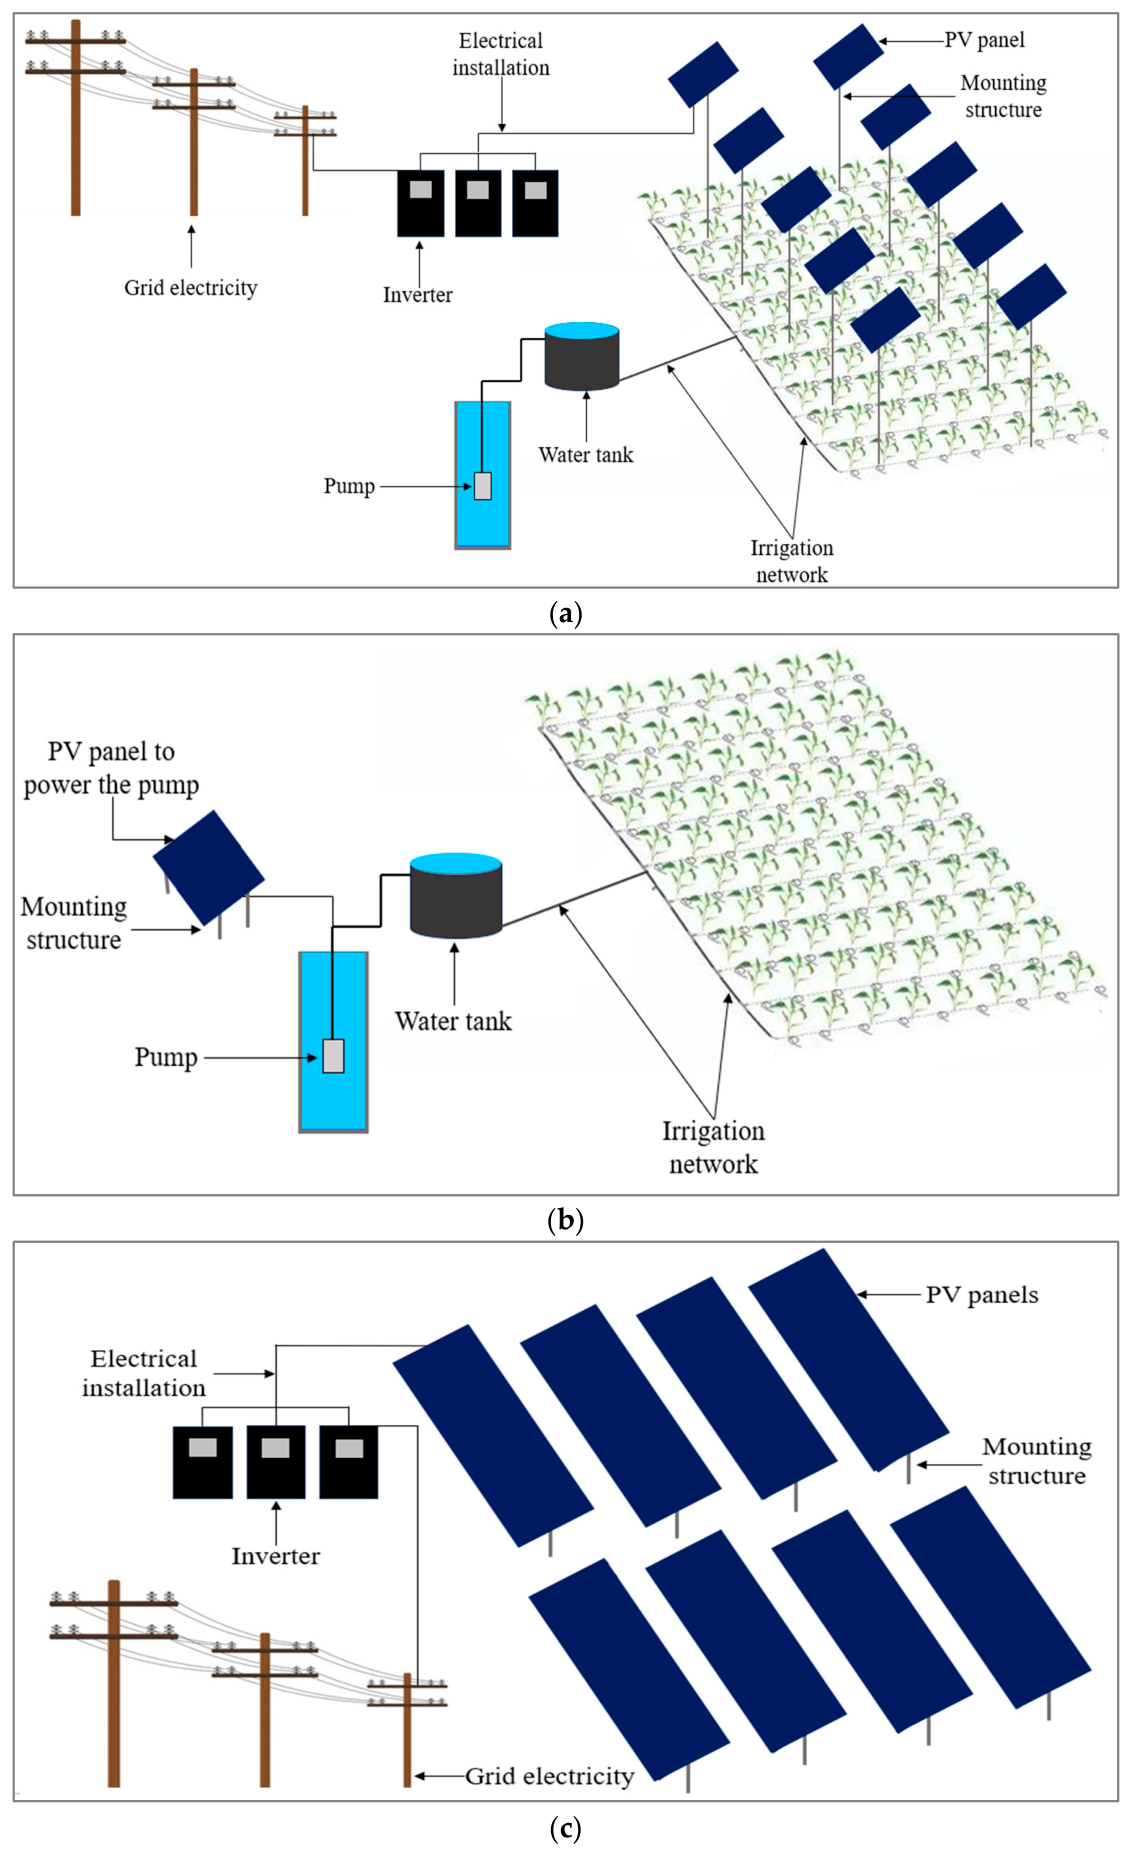
For the purposes of this study, the equipment considered is composed of the facilities used in the photovoltaic fields and in the irrigation of crop plots. The equipment considered varies according to the system. In the case of agrivoltaics systems, the equipment considered is the photovoltaic solar panels, the mounting structure, the inverters, the electrical cables, the irrigation pump, the water tank, the irrigation network (Figure 2a). For traditional monoculture, the equipment used is the PV panels, the mounting structure, the electrical cables, the irrigation pump, the water tank, and the irrigation network, with the understanding that in traditional agriculture, a solar pump is used to irrigate crops (Figure 2b). Thus, some PV panels are installed on the plot only to supply the pump with energy. For solar PV power plants, the equipment considered is as follows: solar panels, mounting structure, inverters, and electrical cables (Figure 2c). In this study, the Ziga photovoltaic power plant is used as a case study to represent PV power plants. In this study, the power grid is not explicitly modeled, as the primary objective is to compare a conventional photovoltaic power plant with agrivoltaics systems in terms of environmental impact per unit area. In both cases, it is assumed that the energy generated is fed directly into the existing power grid.
Indeed, agrivoltaics systems are attracting growing interest in the context of the energy transition and the optimization of land use. They appear particularly promising in rural areas, where access to energy remains limited for a significant portion of the population. In this context, photovoltaic power plants are increasingly being deployed to meet the energy needs of remote areas.
However, land constraints associated with the installation of such infrastructure, combined with the need for more efficient land management, are driving the rise of agrivoltaics systems, which allow for the shared use of agricultural and energy-generating areas. Despite this enthusiasm, their environmental impact remains insufficiently documented compared to that of conventional agricultural systems and traditional photovoltaic power plants.
Thus, a comparative analysis of the environmental impacts of agrivoltaics systems, agricultural production systems, and conventional photovoltaic power plants is essential to assess their relevance, limitations, and conditions for applicability. Such an approach will enable an examination of the need for a transition to these systems, in both rural and urban settings, and support evidence-based decision-making, particularly in developing regions.
The Ziga PV power plant is a grid-connected system. Thus, in this study, for comparison purposes, it is assumed that the PV field of the power plant was changed over to an agrivoltaic system, and the components of the field were considered without the electricity grid. Thus, the PV plant is a grid-connected system, and the field components were considered without taking the power grid into account.
The equipment used is listed in Table 1.
Thus, traditional agriculture is a system whose sole objective is agricultural production. Although the traditional agricultural scenario focuses primarily on agricultural production rather than energy generation, photovoltaic (PV) panels are included to provide the electricity needed for irrigation pumping. In many rural or off-grid areas, farmers use solar pumps as a more cost-effective and sustainable alternative to diesel or electricity. The inclusion of PV panels in this scenario therefore reflects their role as an energy source supporting irrigation operations, rather than as a component of an integrated agrivoltaic system.

2.2. Stages of the Life Cycle Analysis

This section describes the stages considered in the life cycle analysis. It gives an idea of the components considered in the following four stages: manufacturing, transportation, installation, operating, and end-of-life treatment.

2.2.1. Manufacturing Stage

This stage enables us to determine the environmental impact associated with the manufacture of the various items of equipment. For each piece of equipment, the environmental impact is determined from the extraction of all raw materials to the complete manufacture of the equipment. Since gas emissions and resource use depend on the country where the equipment is manufactured or produced, the energy mix used is considered during manufacture. Thus, manufacturing-related impacts are determined by identifying the manufacturing plant and the country of origin. In this case study, the solar panels used in the agrivoltaics installations are of the Felicitysolar brand (Felicitysolar manufacturer, Guangzhou, China). The inverters are made by SMA (SMA Solar Technology AG, Niestetal, Germany). For the mounting structure, an iron corner (25 × 25 × 3 × 6000), IPN100 (RC Steel, Ruicheng Steel manufacturer, Tangshan, China), and slab cable tray, manufactured in France, are used. The irrigation pumps (LARENS manufacturer, Zhejiang, China), water tanks, and irrigation pipes (LESSO manufacturer, Guangdong, China) used in this study are made in China.

2.2.2. Transportation Stage

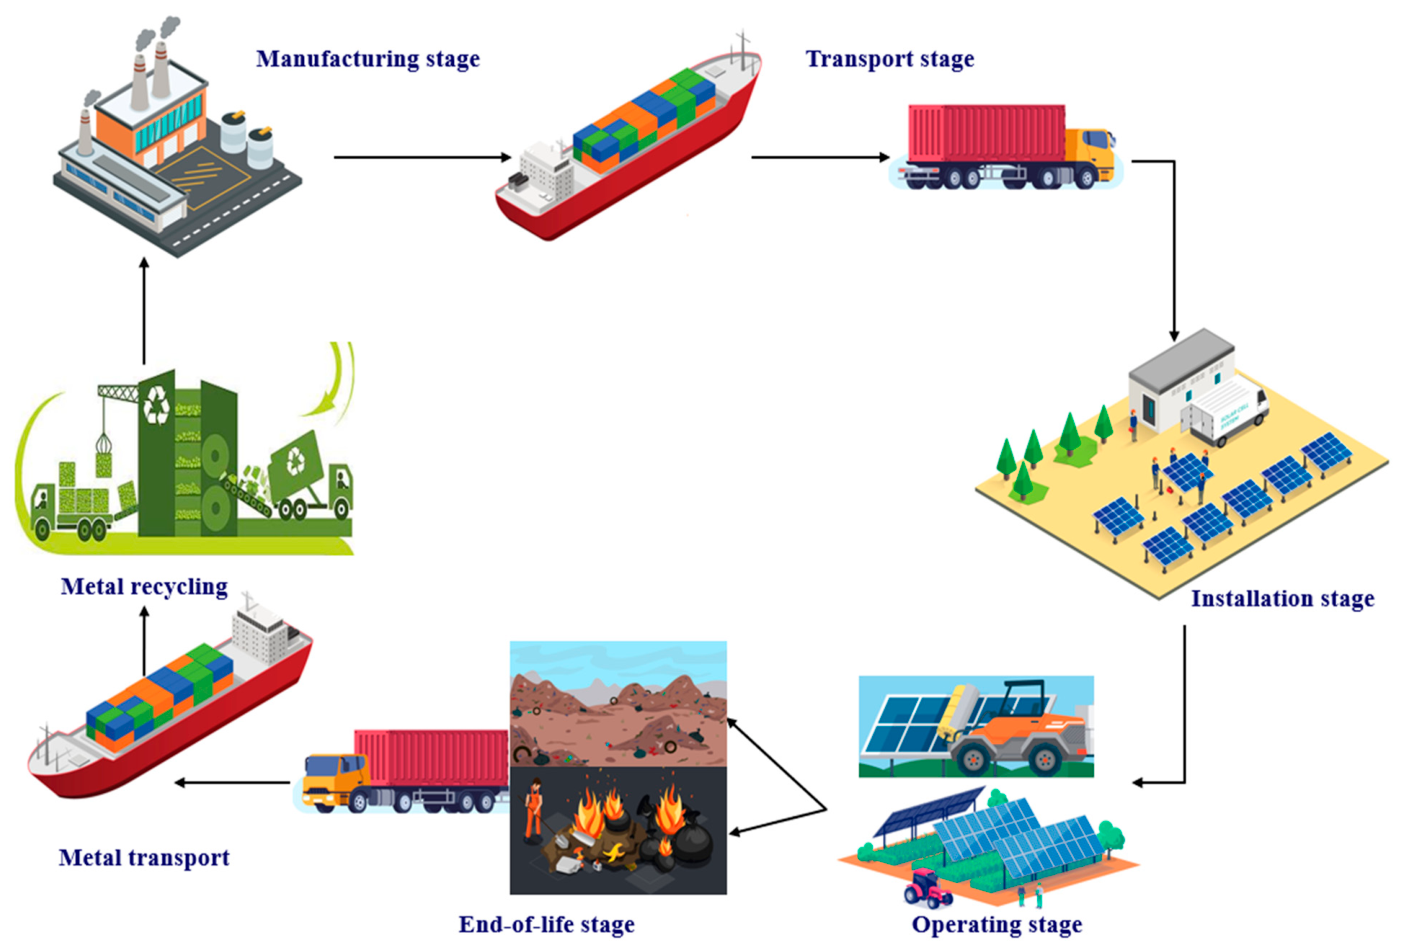
Equipment is shipped by sea and road. Equipment is delivered by ship from the manufacturing countries to Benin, more specifically to the port of Cotonou. From Benin, the equipment is transported to the operating sites in Burkina Faso by road. After use, some of the equipment is sent back to the manufacturing countries for recycling.

2.2.3. Installation Stage

The components considered during the system installation stage are the quantity of water used for the consumption of workers on site and the quantity of fuel used by vehicles for transport.

2.2.4. Operating Stage

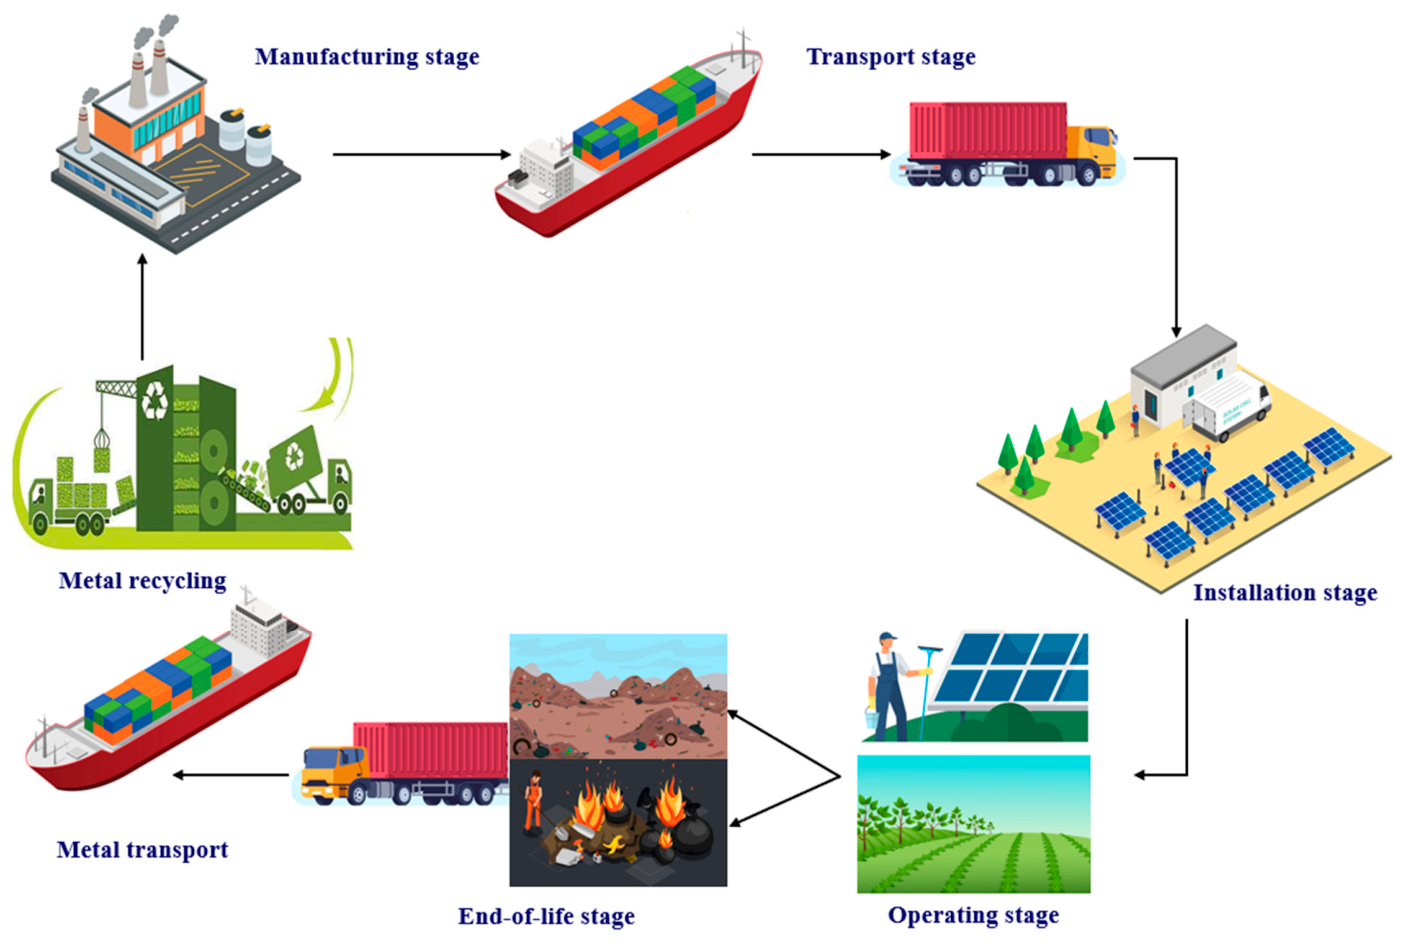
The stages of operation vary according to the type of system. In agrivoltaics systems, the operation includes agricultural production, from planting to harvesting, cleaning of the photovoltaic field panels, and the electricity used to power certain equipment, namely air conditioning in the inverter rooms. In the case of traditional agriculture, only agricultural production from sowing to harvesting is considered. For the Ziga PV plant, the tasks considered are the cleaning of the PV panels and the electricity used for air conditioning in the inverter rooms.

2.2.5. End-of-Life Stage

The processing conducted during the end-of-life stage varies according to the equipment. Currently in Burkina Faso, system waste is organized as follows: (i) PVC and PE components are incinerated; (ii) solar photovoltaic panels are dismantled to remove the aluminum, which is recycled, and the remaining panel components are sent to a landfill; (iii) inverters are also sent to a landfill; and (iv) metal components are sent to the manufacturing countries for recycling.

2.2.6. Boundary of the Study

This study is conducted over a 25-year period, enabling us to determine the impacts from manufacturing to end-of-life of the equipment, with the understanding that panels can have a minimum lifespan of 25 years. In addition, corn is the reference crop selected for this study due to the importance of cereal crops in Burkina Faso’s agricultural context, corn having been the most widely grown cereal in terms of area, production, and consumption. Also, in this study, it is grown once a year.
Figure 3, Figure 4 and Figure 5 show the boundaries of the system for agrivoltaics systems, traditional agricultural systems, and PV power plants, respectively.

2.3. Life Cycle Inventory

The quantity of material used varies according to the system considered (agrivoltaic system, traditional agriculture, and PV power plant) and the equipment’s lifespan. Table 2 shows the amount of initial equipment, which is the amount used for each system during the installation phase. The equipment and the quantities required were determined following a sizing process, which was carried out after the specific configurations for agrivoltaics systems and conventional agriculture had been defined. The three configurations used were derived from a modeling study aimed at determining the optimal configuration for agrivoltaics systems [35]. Subsequently, the equipment used for each system was determined. Therefore, sizing was performed in accordance with the selected configurations using PVsyst 7.0 software. Furthermore, the specifications for the photovoltaic plant’s equipment were provided by the PV power plant’s operators. The technical specifications served as the basis for estimating the required components. A Supplementary Material has been added. Equipment with a lifespan of less than 25 years is renewed at the end of its life. This includes the pump and irrigation equipment which are renewed twice. As a result, two pumps were added, and with regard to the irrigation system, a quantity of polyethylene estimated at 10,332 kg for each agrivoltaic case was added over the 25-year period. In this study, a comparison is made between the different configurations of agrivoltaics systems, on the one hand, and between agrivoltaics systems and two other systems (monoculture systems and photovoltaic power plants), on the other, based on the use of 1 ha of land for each system.

2.4. Environmental Impact Assessment

This life cycle assessment study was performed using the ReCiPe Midpoint (H) method, SimaPro 9.4 software, and the Eco-Invent database to determine the environmental impacts of the various systems studied. The indicators studied are as follows: (i) global warming (kg CO2 eq), (ii) stratospheric ozone depletion (kg CFC11 eq), (iii) ionizing radiation (kBq Co-60eq), (iv) ozone formation on human health (kg NOx eq), (v) ozone formation on terrestrial ecosystems (kg NOx eq), (vi) mineral resource scarcity (kg Cu eq), (vii) fossil resource scarcity (24 kg oil eq), and (viii) water consumption (m3). In addition, to determine land-use efficiency in agrivoltaics systems, the land equivalence ratio (LER) was calculated [37,38] using Formula (1).
L E R = Y i e l d x ( d u a l ) Y i e l d x ( m o n o ) + Y i e l d y ( d u a l ) Y i e l d y ( m o n o ) ,
where x is the crop and y is the electricity.
These indicators are selected to determine the impact of agrivoltaics systems on climate change and on the use of natural resources. In fact, for this study, these indicators were selected because they cover both the global drivers of climate change and the pressures on natural resources. These indicators were selected based on their ability to provide a complementary overview of the major environmental impacts associated with the systems under study.
On the one hand, indicators related to global warming, stratospheric ozone depletion, and ionizing radiation provide insight into disruptions to atmospheric balances at various scales. Global warming is a central indicator due to its structuring role in global environmental dynamics, while ozone layer depletion and ionizing radiation reflect specific yet critical effects linked to the degradation of atmospheric quality and the exposure of living organisms.
Furthermore, indicators related to the effects of ozone formation on human health and terrestrial ecosystems were selected because these indicators are essential for linking air pollutant emissions to direct consequences for human populations and ecosystem functioning, thereby reinforcing the health and ecological dimensions of the analysis.
Moreover, the inclusion of indicators for mineral resource scarcity, fossil fuel scarcity, and water consumption addresses the need to assess the sustainability of natural resource use. These indicators help quantify the pressures on non-renewable resources and water resources, which are critical issues in the context of population growth and the energy transition.
Therefore, this set of indicators was selected to simultaneously cover impacts related to climate change and those associated with the exploitation of natural resources. This integrated approach aims to provide an analytical basis for guiding strategies toward the sustainable management of the systems under study.

3. Results and Discussion

This section presents the environmental impacts caused by the various systems studied. It comprises nine (9) parts corresponding to the indicators, namely impacts on global warming, stratospheric ozone depletion, ionizing radiation, ozone formation on human health, ozone layer formation on terrestrial ecosystems, mineral resource scarcity, fossil resource scarcity, water consumption, and LER to evaluate the impact on land use presented in the previous section.

3.1. Global Warming

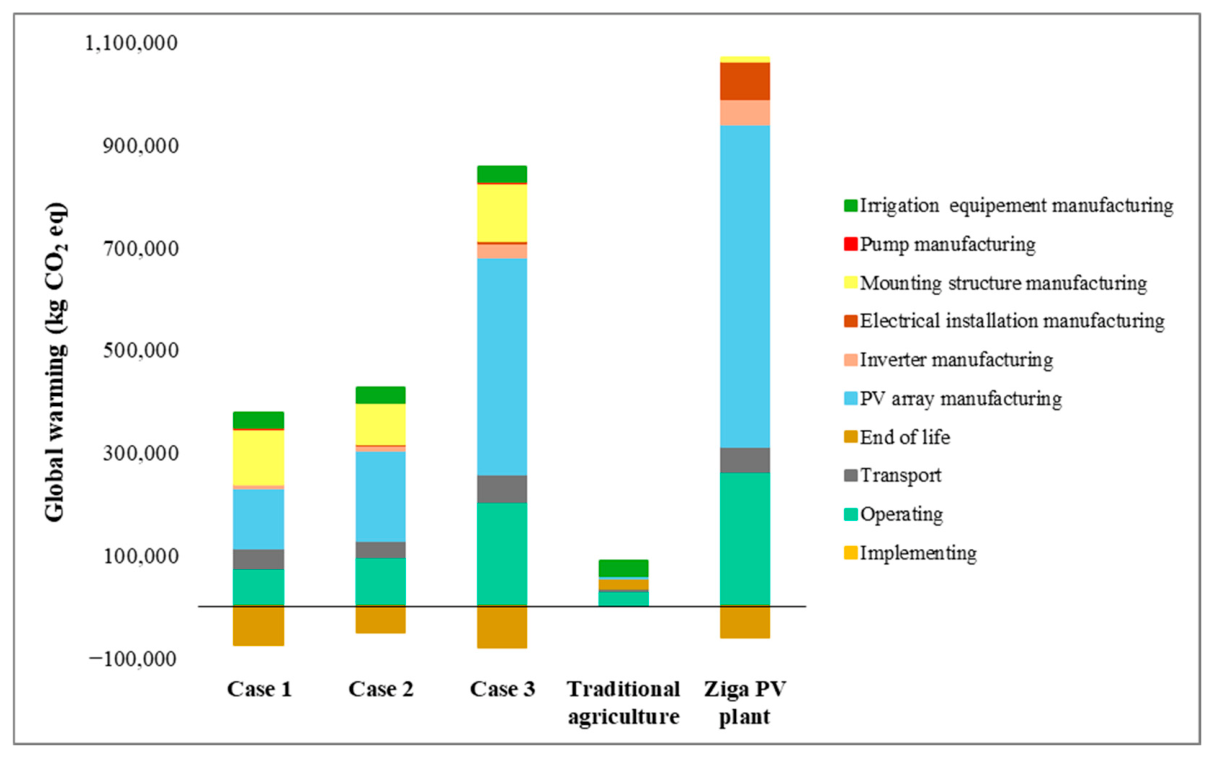
Figure 6 shows the impact of agrivoltaics systems compared with traditional agriculture and with the Ziga PV plant on the global warming indicator over the entire life cycle.
In the results shown in Figure 6, when comparing the three agrivoltaics configurations, it is found that Case 3 had the largest impact on climate change, followed by Case 2. In addition, when comparing the three agrivoltaics configurations with traditional agriculture and the Ziga power plant, it emerges that the impacts are highest for the Ziga PV power plant, followed by the agrivoltaics systems and traditional agriculture which registered the lowest impacts. Also, the largest emissions are caused by the manufacturing stage, followed by the operating stage in all systems. The end-of-life stage, on the other hand, has produced an environmental gain that is higher in Case 3 and Case 1. Component manufacturing accounted for 87.33%, 79.43%, 77.04%, 39.63%, and 74.98% of CO2 emissions for Case 1, Case 2, Case 3, conventional farming, and the PV plant, respectively. Thus, manufacturing was responsible for emissions of 264,175.15 kg CO2 eq for Case 1, 299,265.99 kg CO2 eq for Case 2, 599,115.88 kg CO2 eq for Case 3, 35,639.84 kg CO2 eq for traditional agriculture, and 758,281.33 kg CO2 eq for the Ziga PV power plant. In addition, the results show that the manufacture of PV panels has the highest impact for all the cases studied, except for traditional agriculture, where the irrigation system is the source of the highest CO2 emissions. This is more pronounced for the Ziga PV plant and Case 3 of the agrivoltaic system. Indeed, panel manufacture is the source of emissions estimated at 117,082.48 kg CO2 eq for Case 1, 175,258.59 kg CO2 eq for Case 2, 422,795.25 kg CO2 eq for Case 3, 4,671.42 kg CO2 eq for traditional agriculture, and 629,227.03 kg CO2 eq for the Ziga PV plant. Mounting structures are the second-largest contributors to CO2 emissions. However, for the PV power plant, the electrical installation caused more emissions than the mounting structure. In fact, a large quantity of aluminum is used for the mounting structure in agrivoltaics systems. The elevated agrivoltaics systems used in this case study are systems in which the panels are raised to grow crops underneath. The minimum height of elevation in this study is obtained in Case 3 and this height is 2.3 m. Also, the mounting structure needs to be very robust to protect the system during high winds to avoid system collapse. Thus, emissions are estimated at 107,176.65 kg CO2 eq, 80,304.48 kg CO2 eq, 113,602.41 kg CO2 eq, 295.28 kg CO2 eq, and 7,949.71 kg CO2 eq for Case1, Case2, Case 3, conventional farming, and the photovoltaic power plant, respectively, during the manufacture of the mounting structure.
Regarding the operating stage, this concerns the use of water for cleaning the panels, the production of corn (from the installation stage to maturity), and the electricity used during the system’s operation; the emissions are estimated at 74,615.51 kg CO2 eq (24.7%) for Case 1, 95,838.44 kg CO2 eq (25.4%) for Case 2, 202,911.05 kg CO2 eq (26.1%) for Case 3, 31,102.81 kg CO2 eq (34.6%) for traditional agriculture, and 259,613.52 kg CO2 eq (25.6) for the Ziga power plant. However, the end-of-life stage resulted in a gain in CO2 emissions, avoiding an emission of 74,862.85 kg CO2 eq for Case 1, 51,067.56 kg CO2 eq for Case 2, 79,329.62 kg CO2 eq for Case 3, and 58,913.62 kg CO2 eq for the Ziga PV power plant. The gain during the end-of-life stage can be explained by the use of large quantities of aluminum in agrivoltaics systems, which require a very high level of support, especially for Cases 2 and 1.
In fact, the number of panels used in agrivoltaics systems is lower than those in PV power plants. Agrivoltaics installations are systems in which the spacing between panel tables and between rows of panel tables is important to maximize the availability of solar radiation under the PV panels for maximum crop yield. Therefore, a large empty space is left to maximize solar radiation under the panels [21]. As a result, the number of PV panels can be reduced compared to that of PV power plants, which is the reason for the low impact involved in panel manufacturing processes.
The manufacturing stage is followed by the operation stage, for which emissions are highest for the Ziga power plant, followed by Case 3, Case 2, Case 1, and traditional agriculture, which gave the lowest emissions. Emissions during the operating stage are due to the electricity used for air-conditioning in the inverter rooms and agricultural production activities. The highest emissions are generated by the energy used for air-conditioning, while emissions from agricultural activities are very low. The small emissions for Cases 1, 2, and 3 compared to that of the Ziga PV plant can be explained by the fact that the number of inverters used is smaller for the agrivoltaics systems, and more specifically for Case 1, meaning that a large room is not required to store the inverters. Traditional agriculture does not require an air-conditioning room, as the energy produced is used exclusively to power the irrigation pump. The numbers of inverters are twenty-two for the Ziga PV power plant (Sunny Tripower SMA Solar technology AG manufacturer, Niestetal, Germany), twelve for Case 3 (Sunny Tripower 25000TL_JP-30, SMA Solar technology AG manufacturer, Niestetal, Germany), six for Case 2 (Sunny Tripower 20000TL-30, SMA Solar technology AG manufacturer, Niestetal, Germany) and four for Case 1 (Sunny Tripower 20000TL-30, SMA Solar technology AG manufacturer, Niestetal, Germany).
In addition, agrivoltaics installations are systems in which the solar panels are elevated to a much more significant height than those installed in PV power plants, which increases the amount of material used for the mounting structure. In addition, a more rigid mounting structure is needed to protect the system from the impact of high winds. For these reasons, an important quantity of metal is used in agrivoltaics systems. This is responsible for the larger impact during the manufacturing stage of the mounting structure for the agrivoltaics systems compared to the Ziga power plant and traditional agriculture. For the same reason, the environmental gain obtained is higher for agrivoltaics systems, especially for Cases 1 and 3, with the understanding that metal recycling has a positive environmental impact [33,39,40]. In fact, according to Badza et al. [33], recycling aluminum and steel supports could reduce impacts by 25% in solar PV systems when the entire structure is recycled. The primary production of aluminum has a high energy demand of about 200 MJ/kg of electricity and constitutes about 8% of the energy consumption during the production of photovoltaic panels whereas aluminum can be recycled with a much smaller energy consumption of 8 MJ/kg [39,40]. In addition to the positive impact of aluminum recycling, recycling photovoltaic panels reduces raw material consumption and energy use, thus increasing the environmental gain during the recycling stage [33,41].
Also, the manufacturing of solar panels, as well as aluminum and steel, requires some energy, which can increase CO2 emissions. Monocrystalline cells require up to 1000 kWh/kg-Si and polycrystalline cells up to 700 kWh/kg-Si [42]. The production process of one ton of primary aluminum can use up to 170 GJ of energy [43,44] and the actual specific energy consumption of the steelmaking process is 26.06 GJ/t [45]. Furthermore, in the case of traditional agriculture, the highest emissions are obtained during the manufacture of irrigation equipment, and these emissions are 27,994.70 kg CO2 eq. As a result, the larger the number of panels used (Ziga PV plant) and the larger the quantity of metal used (case of agrivoltaics systems), the higher the impact on the environmental plant.

3.2. Stratospheric Ozone Depletion

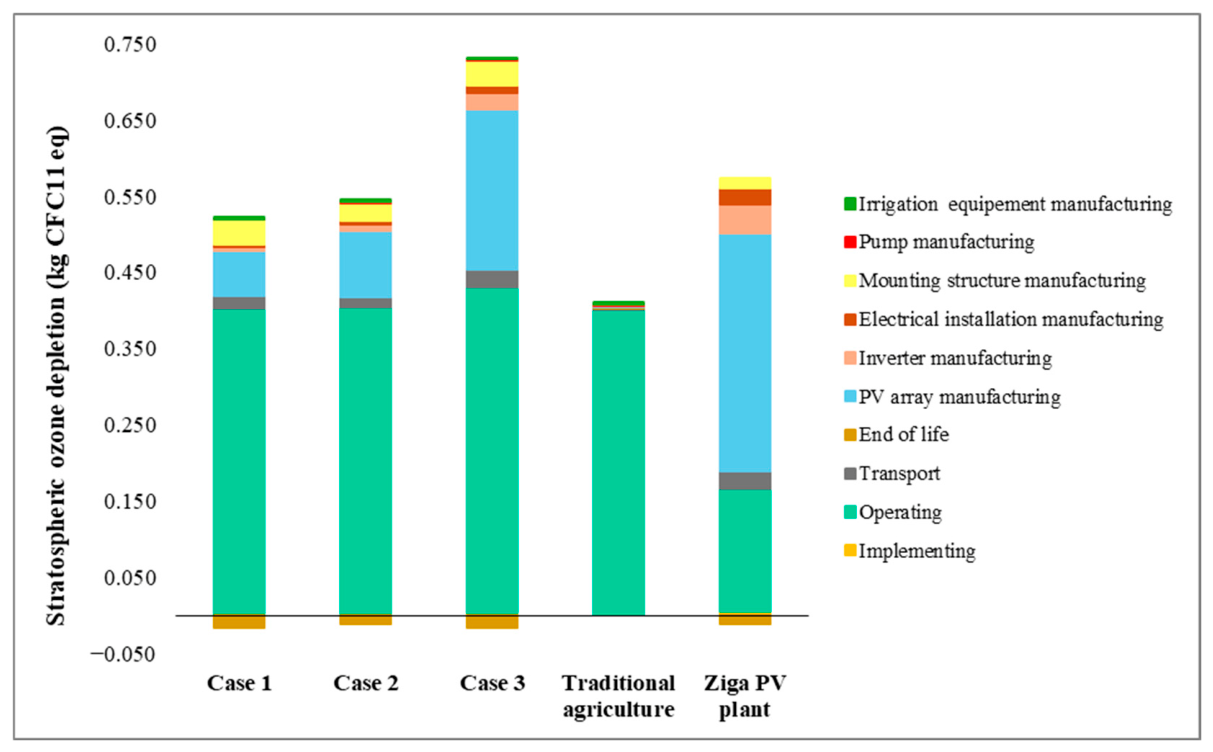
Figure 7 shows the impact of different configurations of agrivoltaics systems, traditional agriculture, and the Ziga power plant on stratospheric ozone depletion during the material manufacturing stages, installation, operation of the various systems, and transport and end-of-life of the components.
The results in Figure 7 show that, except for the PV plant, the highest impacts are caused by the system operation stage. For the PV power plant, the equipment manufacturing stage is responsible for the highest CFC11 emissions. For Cases 1, 2, and 3 and for conventional agriculture, the operating stage is followed by the equipment manufacturing stage, then the transport stage and the installation stage. Thus, an emission of 0.495 kg CFC11 eq (82.36%) is observed for Case 1, 0.492 kg CFC11 eq (78.86%) for Case 2, 0.505 kg CFC11 eq (63.62%) for Case 3, 0.501 kg CFC11 eq (98.10%) for traditional agriculture, and 0.161 kg CFC11 eq (28.71%) for the Ziga PV plant during the operating stage. In fact, most of the major emissions during the operating stage are generated by corn production. Indeed, considering the operation stage only, it is noted that corn production accounts for 92.9%, 89.5%, 73.9%, and 100% of the CFC11 emissions for Case 1, Case 2, Case 3, and conventional farming, respectively. These large emissions from agriculture in Cases 1, 2, and 3 and from traditional agriculture are generated by the use of pesticides [46,47]. In addition, in current practice in Burkina Faso, plastic equipment (including PE pipes used in irrigation systems) are incinerated, which has a harmful impact on the environment, resulting in high CFC-11 emissions [48].
Regarding the manufacturing stage, results show an emissions of 0.103 kg CFC11 eq for Case 1, 0.127 kg CFC11 eq for Case 2, 0.278 kg CFC11 eq for Case 3, 0.006 kg CFC11 eq for conventional agriculture, and 0.385 kg CFC11 eq for the Ziga PV plant, i.e., 20.35%, 23.83%, 38.83%, 1.57%, and 68.36%, respectively, for Case 1, Case 2, Case 3, traditional agriculture, and the Ziga PV plant. Looking specifically at equipment during its manufacturing stages, it is observed that the panel manufacturing stage has the highest impact compared to other components. CFC11 emissions caused by panel manufacturing are equal to 0.058 kg for Case 1, 0.087 kg for Case 2, 0.210 kg for Case 3, 0.002 kg for traditional agriculture, and 0.3124 kg for the PV power plant. Indeed, due to the higher energy production and larger number of panels at the Ziga power plant compared to the agrivoltaics systems, emissions caused by the manufacture of solar PV panels were lower for Cases 1, 2, and 3. Thus, the highest emissions are recorded for the Ziga power plant due to the higher number of panels used (2200 panels of 250 W) compared to Case 3 (1452 panels of 260 W), Case 2 (1440 panels of 100 W), and Case 1 (969 panels of 100 W) for which the spacing between tables and between rows of tables is important to maximize solar radiation under the PV panels and optimize crop yields.
Nevertheless, it should be noted that this indicator gave the lowest values among those studied, which corroborates the results of Selvaraj et al. [47]. Thus, CFC11 emissions are below 1 kg for the operating, manufacturing, transport, installation, and end-of-life stages for all the cases studied. Also, the end-of-life stage resulted in an environmental gain in all cases except traditional agriculture. This gain is evaluated at 0.015 kg CFC11 eq, 0.011 kg CFC11 eq, 0.016 kg CFC11 eq, and 0.010 kg CFC11 eq for Case 1, Case 2, Case 3, and the Ziga PV plant, respectively.

3.3. Ionizing Radiation

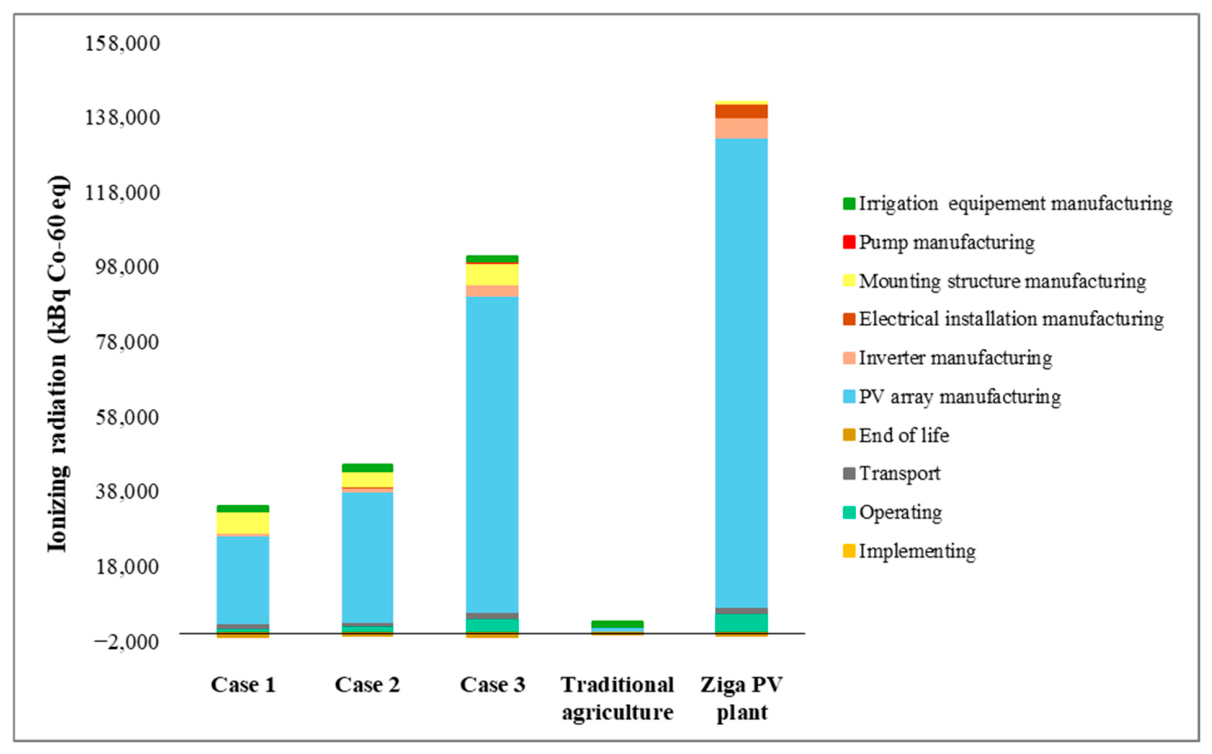
Figure 8 compares agrivoltaics systems, traditional agriculture, and the Ziga PV power plant based on their impact on ionizing radiation during the manufacture of the equipment used in the different cases, during installation, operation, transport of the equipment, and end-of-life.
As with global warming, the results in Figure 8 show that the PV power plant has the highest impact on the environment, followed by the agrivoltaics systems, whose highest impact is obtained in Case 3, followed by Case 2 and Case 1. The lowest impacts are obtained in the case of traditional agriculture, whose impacts are negligible compared with the Ziga PV power plant and the agrivoltaics systems. Furthermore, the manufacturing stage is the main source of Co-60 emissions. These emissions are estimated at 31,333.07 kBq Co-60eq (94.49% of emissions) for Case 1, 41,956.97 kBq Co-60eq (94.8% of emissions) for Case 2, 94,957.57 kBq Co-60eq (95% of emissions) for Case 3, 2,533.26 kBq Co-60eq (78.8% of emissions) for conventional farming, and 134,883.13 kBq Co-60eq (95.4% of emissions) for the Ziga photovoltaic power plant. As a result, the use of agrivoltaics systems reduces Co-60 emissions by 103,550 (76.8%) for Case 1, 92,926 (68.9%) for Case 2, and 39,925 (29.6%) for Case 3.
The manufacturing process of PV panels is followed by that of inverters and electrical cables in the case of the Ziga power plant. However, for agrivoltaics systems, the manufacturing process of the PV panels is followed by that of the mounting structure. Indeed, in agrivoltaics systems, the mounting structure has a larger scale, and the inverters used are less important because the energy produced is lower compared to the Ziga power plant due to the empty space left to maximize solar radiation for crops under the PV field. For traditional agriculture, on the other hand, the highest emissions are caused by the irrigation equipment, followed by the PV panels used to power the irrigation pump. The emissions generated by the manufacture of the panels are estimated at 23,376.48 kBq Co-60eq for Case 1, 34,991.83 kBq Co-60eq for Case 2, 84,414.57 kBq Co-60eq for Case 3, 932.69 kBq Co-60eq for traditional agriculture, and 125,630.40 kBq Co-60eq for the Ziga photovoltaic power plant. The higher emissions from the Ziga power plant are explained by the larger number of solar PV panels compared with agrivoltaics systems, in which the number of panels is reduced to optimize agricultural production.
Concerning inverters, the largest quantities are emitted by the Ziga power plant with a maximum emission of 5232.04 kBq Co-60eq, followed by Case 3 with an emission of 2,925.19 kBq Co-60eq, Case 2 with an emission of 1,165.32 kBq Co-60eq, and Case 1 with an emission of 784.80 kBq Co-60eq. The mounting structure resulted in an emission of 5,506.66 kBq Co-60eq for Case 1, 4,125.99 kBq Co-60eq for Case 2, 5,836.81 kBq Co-60eq for Case 3, 15.17 kBq Co-60eq for traditional agriculture, and 330.89 kBq Co-60eq for the Ziga photovoltaic plant. The electrical installation resulted in emissions of 80.65 kBq Co-60eq for Case 1, 89.37 kBq Co-60eq for Case 2, 196.52 kBq Co-60eq for Case 3, 0.94 kBq Co-60eq for conventional farming, and 3,689.80 kBq Co-60eq for the Ziga photovoltaic plant. Irrigation equipment generated emissions of 1,456.93 kBq Co-60eq.

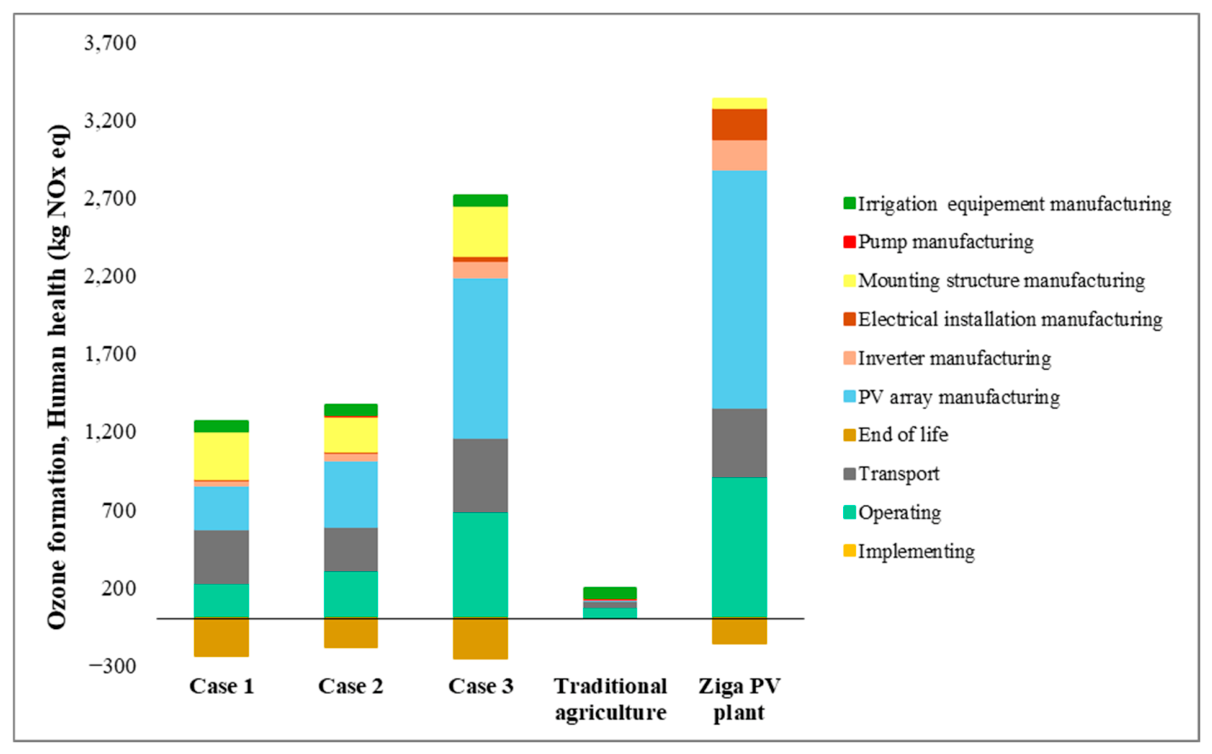
3.4. Ozone Formation, Human Health

Figure 9 shows the impact of agrivoltaics systems, traditional agriculture and the Ziga power plant on the indicator of ozone formation on human health during the stages of manufacture of the equipment used, installation of the system, operation, and transport and end-of-life of the equipment.
The results in Figure 9 show that the Ziga PV plant and Case 3 of the agrivoltaics systems have a higher impact on ozone and human health. The quantities of NOx emitted are very close for Cases 1 and 2, which account for around half of the gas emissions caused by Case 3 and by the Ziga PV plant. Traditional agriculture has a lower impact on human health. As with the other impacts, the material manufacturing stage has the highest impact on ozone layer formation and human health. This stage is followed by the operating stage for Case 2, Case 3, and the Ziga PV plant. On the other hand, the manufacturing stage is followed by the transport stage for Case 1. The installation stage generated the lowest impacts, and the end-of-life stage was advantageous and generated an environmental gain, except for traditional agriculture; and this gain proved to be higher for Case 1 and Case 3. These results show emissions of 693.51 kg NOx eq for Case 1, 774.82 kg NOx eq for Case 2, 1,553.05 kg NOx eq for Case 3, 78.44 kg NOx eq for conventional farming, and 1,978.54 kg NOx eq for the Ziga photovoltaic power plant during the manufacturing stage. The panel manufacturing stage resulted in the highest gas emissions, apart from Case 1 and traditional agriculture, where the manufacture of irrigation equipment generated the highest emissions. The emissions generated by the manufacture of solar panels are estimated at 284.96 kg NOx eq for Case 1, 426.55 kg NOx eq for Case 2, 1,029.01 kg NOx eq for Case 3, 11.37 kg NOx eq for traditional agriculture, and 1,531.46 kg NOx eq for the Ziga power plant. Emissions caused by the manufacture of the mounting structure are estimated at 300.80 kg NOx eq for Case 1, 225.38 kg NOx eq for Case 2, 318.84 kg NOx eq for Case 3, 0.83 kg NOx eq for traditional agriculture, and 57.36 kg NOx eq for the Ziga power plant. Regarding the electrical installation, its impact is very low in agrivoltaics systems compared to the Ziga power plant. Emissions from the electrical cable manufacturing process are 13.43 kg NOx eq for Case 1, 14.88 kg NOx eq for Case 2, 33.90 kg NOx eq for Case 3, 0.16 kg NOx eq for conventional farming, and 201.56 kg NOx eq for the Ziga power plant. NOx emissions from the inverters are estimated at 28.23 kg for Case 1, 41.91 kg for Case 2, 105.21 kg for Case 3, and 188.18 kg for the Ziga power plant.
In addition, the operation stage resulted in emissions of 226.88 kg NOx eq for Case 1, 301.7 kg NOx eq for Case 2, 677.67 kg NOx eq for Case 3, 73.24 kg NOx eq for conventional farming, and 901.93 kg NOx eq for the Ziga power plant. For the transport stage, NOx eq emissions were 344.12 kg for Case 1, 288.96 kg for Case 2, 478.99 kg for Case 3, 38.79 for conventional farming, and 444.26 kg for the Ziga PV plant. The end-of-life stage was more environmentally friendly, saving 241.75 kg NOx eq for Case 1, 180.27 kg NOx eq for Case 2, 254.94 kg NOx eq for Case 3, and 161.38 kg NOx eq for the Ziga plant. On the other hand, an emission of 2.02 kg NOx eq is recorded for traditional agriculture in the end-of-life stage.
The higher NOx emissions in the PV power plant and the lower emissions in the agrivoltaics cases, especially in Case 1, can be explained by the higher energy generated in the PV power plant. As shown above, Ziga’s power plant produces larger quantities of energy, which means that the electricity used during manufacturing is greater in response to the number of panels used. In addition, the manufacturing stage is followed by the operation phase, which comprises two components: the electricity used and the agricultural production. During this operation phase, NOx emissions are mainly due to the electricity used. Indeed, electricity generation is an important factor in NOx emissions [49,50]. Furthermore, Wang et al. [51] studied the emissions of different power generation technologies in power plants larger than 6 MW for the year 2014 in China. The results of the study showed emissions of 7.35 × 10⁶ t NOx for hard coal power, 1.22 × 10⁶ t NOx for natural gas power, 2.85 × 10⁴ t NOx for hydroelectric power, 9.39 × 10⁴ t NOx for wind power, 5.92 × 10³ t NOx for photovoltaic power, and 2.78 × 10⁴ t NOx for biomass power.

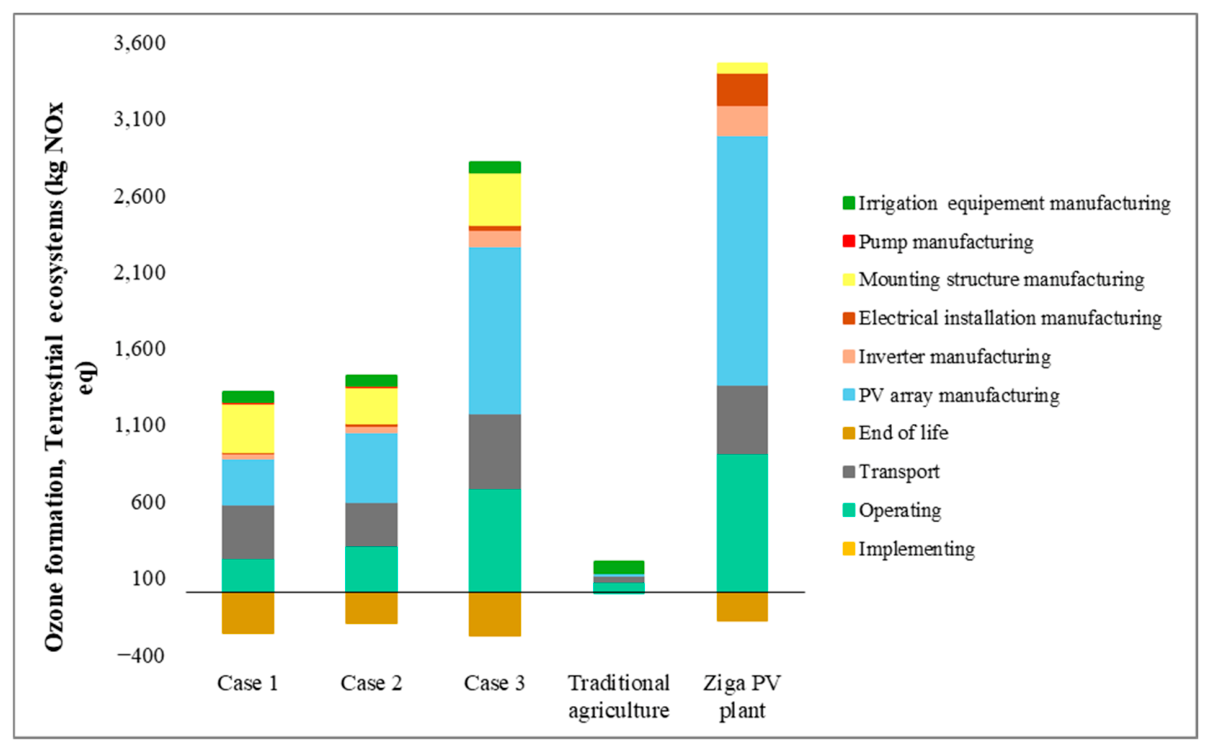
3.5. Ozone Formation, Terrestrial Ecosystems

Figure 10 shows the impact of the life stages of agrivoltaics systems, traditional agriculture, and the Ziga PV power plant on terrestrial ecosystems.
The results in Figure 10 show the same trends as those observed for the impact on human health in relation to ozone formation. Impacts are highest for PV power plants, followed by Case 3, and the highest emissions are generated by the manufacturing stage. Emissions from the equipment manufacturing stage are estimated at 735.89 kg NOx eq, 822.45 kg NOx eq, 1,647.44 kg NOx eq, 84.64 kg NOx eq, and 2,096.96 kg NOx eq, respectively, for Case 1, Case 2, Case 3, conventional farming, and the Ziga power plant. In addition, the emissions generated by the manufacture of solar panels are estimated at 302.94 kg NOx eq for case 1, 453.47 kg NOx eq for Case 2, 1,093.96 kg NOx eq for Case 3, 12.09 kg NOx eq for traditional agriculture, and 1,628.09 kg NOx eq for the Ziga power plant. Manufacture of the mounting structure generated emissions of 318.14 kg NOx eq for case 1, 238.37 kg NOx eq for Case 2, 337.21 kg NOx eq for Case 3, 0.88 kg NOx eq for conventional farming, and 58.96 kg NOx eq for the Ziga PV power plant. The manufacture of electrical cables resulted in emissions of 13.78 kg NOx eq for Case 1, 15.27 kg NOx eq for Case 2, 34.75 kg NOx eq for Case 3, 0.16 kg NOx eq for traditional agriculture, and 213.17 kg NOx eq for the Ziga power plant, while the manufacture of inverters caused emissions of 29.51 kg for Case 1, 43.82 kg for Case 2, 109.99 kg for Case 3, and 196.73 kg for the Ziga power plant.
These emissions are 228.17 kg NOx eq, 303.16 kg NOx eq, 679.61 kg NOx eq, 74.34 kg NOx eq, and 903.54 kg NOx eq, respectively, for Case 1, Case 2, Case 3, traditional agriculture, and the Ziga power plant during the operation stage, and 348, 91 kg NOx eq, 292.98 kg NOx eq, 485.64 kg NOx eq, 39.31 kg NOx eq, and 450.46 kg NOx eq, respectively, for Case 1, Case 2, Case 3, traditional agriculture, and the Ziga power plant during the transport stage. The end-of-life stage, on the other hand, resulted in a gain of 264.16 kg NOx eq, 197.07 kg NOx eq, 278.66 kg NOx eq, and 176.39 kg NOx eq, respectively, for Case 1, Case 2, Case 3, and the Ziga PV power plant.

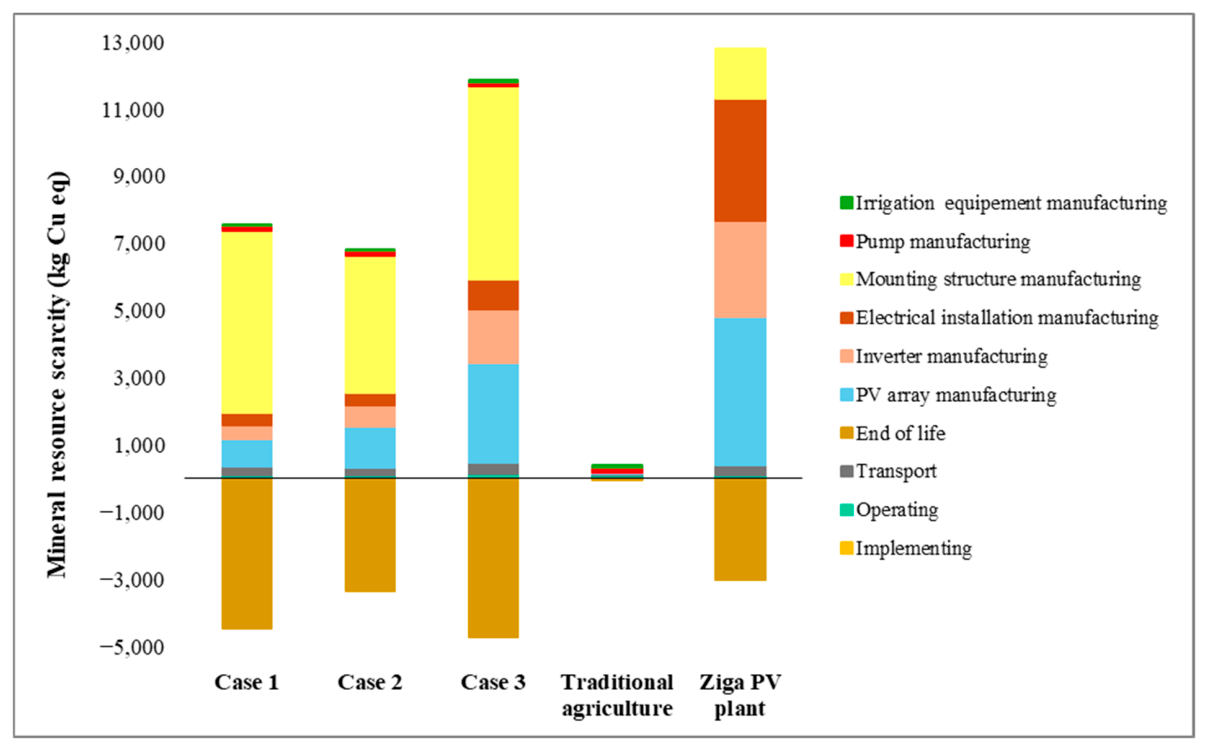
3.6. Mineral Resource Scarcity

Figure 11 shows the impact of the systems studied on the mineral resource scarcity indicator over the entire life cycle.
As for the other impacts, the equipment manufacturing stage has the highest impact, followed by the transport stage, which is very low compared to the manufacturing stage. The end-of-life stage generated significant environmental gain. The manufacturing stage resulted in the use of a higher quantity of copper, estimated at 7,234.77 kg Cu eq, 6,525.64 kg Cu eq, 11,414.19 kg Cu eq, 252.31 kg Cu eq, and 12,393.91 kg Cu eq, respectively, for Case 1, Case 2, Case 3, traditional agriculture, and the Ziga power plant. The results show that, in contrast to the other impacts, the manufacture of the mounting structure generated the highest impacts for Case 1, Case 2, and Case 3. However, for the Ziga PV plant, the highest impacts are caused by the manufacture of the solar panels. Nevertheless, the impact caused by the electrical installation and inverters is very high compared with the other impacts for the Ziga plant. The impact caused by panel manufacturing is estimated at 825.68 kg Cu eq for Case 1, 1,235.94 kg Cu eq for Case 2, 2,981.60 kg Cu eq for Case 3, 32.94 kg Cu eq for traditional agriculture, and 4,437.38 kg Cu eq for the Ziga PV plant. The higher impact of manufacturing PV panels for the Ziga power plant can be explained by the energy produced and the higher number of panels, which in turn increases the amount of metal used during PV panel manufacturing processes compared to agrivoltaics cases. According to Badza et al. [33], metals are used as metalizing agents in the photovoltaic cell, a process that involves depositing metal contacts on at least one side of the cell to collect current and link cells. Lead and silver are applied for the metallization of the front cells, while copper and aluminum are used for the back. As a result, the impact is more significant in Ziga PV power plant, due to the higher number of panels used.
Manufacturing of the mounting structure resulted in the use of 5,436.16 kg Cu eq for Case 1, 4,073.16 kg Cu eq for Case 2, 5,762.08 kg Cu eq for Case 3, 14.98 kg Cu eq for traditional farming, and 1,481.38 kg Cu eq for the Ziga PV plant. This higher impact in the agrivoltaics systems is explained by the large quantity of metal used in the mounting structures of the agrivoltaics systems, which are 55,455 kg for Case 1, 41,551 for Case 2, and 58,780 kg for Case 3, compared to the Ziga power plant, for which the quantity of metal used is 24,644 kg. In addition, the amount of copper during the manufacture of the mounting structure can be explained by the fact that copper is used in the manufacture of steel to increase this steel’s yield strength and corrosion resistance [52].
The manufacture of inverters is responsible for the use of copper, estimated at 424.89 kg Cu eq for Case 1, 630.89 kg Cu eq for Case 2, 1,583.68 kg Cu eq for Case 3, and 2,832.59 kg Cu eq for the Ziga PV plant which is due to the fact that inverters are composed of materials including copper [29], which is used in the manufacture of inverter components including semiconductors, transformers, and housing structures [53]. Regarding the manufacture of electrical cables, the impact is higher for the Ziga power plant. Copper use is estimated at 347.71 kg Cu eq for Case 1, 385.30 kg Cu eq for Case 2, 886.50 kg Cu eq for Case 3, 4.06 kg Cu eq for traditional agriculture, and 3,642.56 kg Cu eq for the Ziga PV plant.
The manufacturing stage is followed by the transport stage, which results in copper use estimated at 235.14 kg Cu eq, 197.30 kg Cu eq, 326.63 kg Cu eq, 25.81 kg Cu eq, and 304.89 kg Cu eq, respectively, for Case 1, for Case 2, for Case 3, for traditional agriculture, and for the Ziga power plant. Emissions during the transport stage are very low and are due to the combustion of the fuel used. Indeed, according to Reddy et al. [54], fuel combustion can be accompanied by the emission of potentially toxic trace pollutants, including organic and inorganic chemical compounds, in addition to the main pollutants including Cu with a minimum emission factor of 7.58 × 10⁻⁵ g/GJ. The end-of-life stage resulted in higher environmental gains for Case 3 and Case 1. These gains are estimated at 4,486.02 kg Cu eq for Case 1, 3,365.32 kg Cu eq for Case 2, 4,752.62 kg Cu eq for Case 3, 16.97 kg Cu eq for traditional agriculture, and 3012.34 kg Cu eq for the Ziga PV power plant.

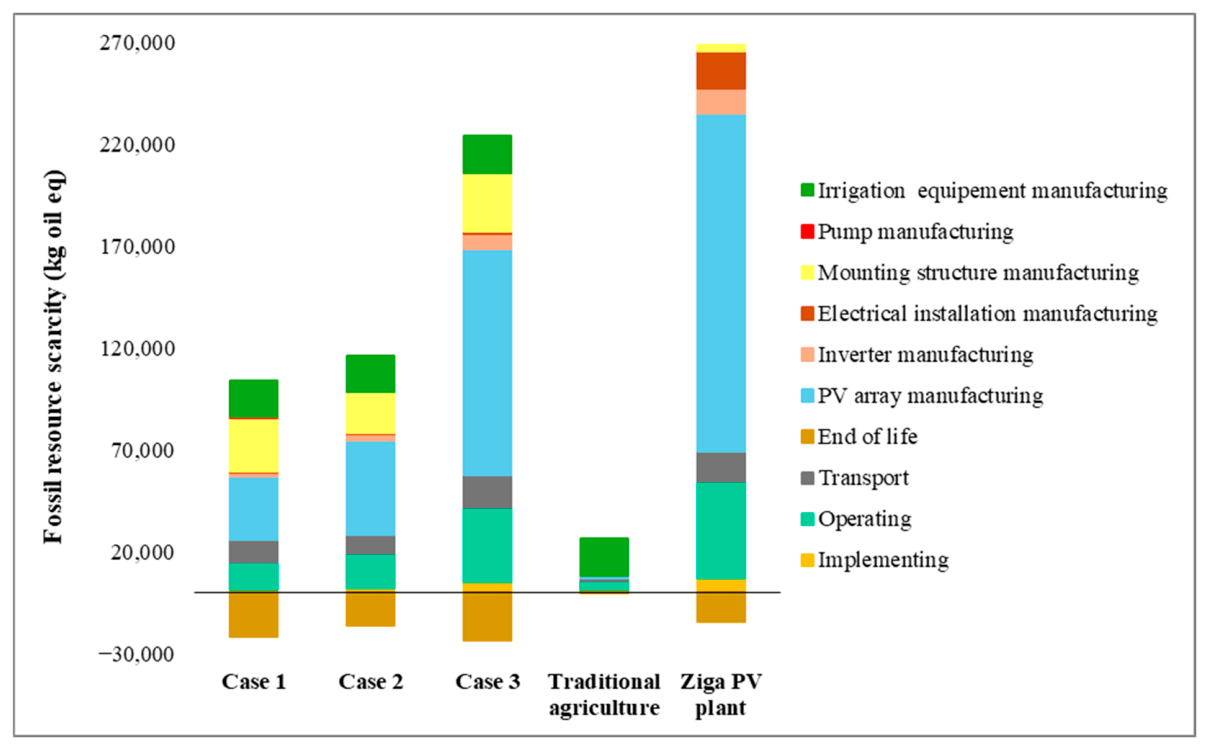
3.7. Fossil Resource Scarcity

Figure 12 shows the impact of agrivoltaics systems, traditional agriculture, and the Ziga PV power plant on the fossil resource scarcity indicator during the equipment manufacturing stage, the system installation stage, the system operation stage, the equipment transport stage, and the equipment end-of-life stage.
The results in Figure 12 show that the equipment manufacturing stage had the highest impact, followed by the operation and transport stages. The end-of-life stage generated an environmental gain for all the agrivoltaics cases, and for traditional agriculture and for the Ziga power plant. However, the impacts of traditional agriculture are very low and negligible compared to those of the agrivoltaics cases and the Ziga power plant. Thus, the manufacturing stage resulted in the use of fossil resources estimated at 78,222.26 kg oil eq for Case 1, 87,827.61 kg oil eq for Case 2, 166,335.73 kg oil eq for Case 3, 19,515.44 kg oil eq for traditional agriculture, and 199,385.62 kg oil eq for the Ziga PV power plant. The operating stage generated fossil fuel consumption of 14,552.34 kg oil eq for Case 1, 18,402.94 kg oil eq for Case 2, 37,896.92 kg oil eq for Case 3, 6662.56 kg oil eq for conventional farming, and 47,570.10 kg oil eq for the Ziga PV plant. Regarding the transport stage, it resulted in the use of fossil resources of 11,286.54 kg oil eq for Case 1, 9 475.32 kg oil eq for Case 2, 15,700.65 kg oil eq for Case 3, 1,262.37 kg oil eq for traditional agriculture, and 14,589.67 kg oil eq for the Ziga PV plant. The end-of-life stage resulted in a gain of 22,062.89 kg oil eq for Case 1, 16,521.27 kg oil eq for Case 2, 23,300.31 kg oil eq for Case 3, 44.57 kg oil eq for traditional agriculture, and 14,697.11 kg oil eq for the Ziga PV plant.
Moreover, PV panel manufacturing has the highest impact for all cases except traditional agriculture, where the irrigation system is responsible for the highest use of fossil resources. In this respect, the manufacture of the panels is responsible for the use of fossil resources estimated at 30,840.49 kg oil eq for Case 1, 46 164.55 kg oil eq for Case 2, 111,367.74 kg oil eq for Case 3, 1,230.49 kg oil eq for traditional agriculture, and 165,743.57 kg oil eq for the Ziga PV plant. The panels are followed by the mounting structure in the agrivoltaics cases. However, for the PV plant, the electrical installation caused higher emissions than the mounting structure. Thus, emissions are estimated at 26,709.48 kg oil eq for Case 1, 20,012.67 kg oil eq for Case 2, 28,310.85 kg oil eq for Case 3, 73.59 kg oil eq for traditional agriculture, and 3,156.82 kg oil eq for the Ziga PV power plant during the manufacture of the mounting structure. For the electrical installation, emissions are 579.59 kg oil eq for Case 1, 642.18 kg oil eq for Case 2, 1,414.71 kg oil eq for Case 3, 6.90 kg oil eq for traditional farming, and 17,897.01 kg oil eq for the Ziga PV plant. This higher impact in the Ziga power plant, followed by Case 3, during the manufacturing phase, is due to the higher energy production and therefore the larger number of PV panels compared to the other cases. Thus, the more panels there are, the more energy is used in manufacturing. In fact, the panel impact on the scarcity of fossil resources is mainly due to energy consumption, with coal and coke used as silica reducers during the transformation of silica into silicone [33]. According to Troszak [55], elemental silicon (Si) is extracted from quartz (SiO2) using carbon (C) and heated from an electric arc in the carbothermal reduction process known as fusion. Indeed, the first step in the production of photovoltaic solar panels is to melt metallurgical grade silicon (mg-Si) from quartz “ore” by gathering and burning millions of tons of coke, coal, and petroleum coke, as well as charcoal and wood chips from hardwood trees. Also, more fossil fuels are used to generate the electricity used in the production of polysilicon, ingot, wafers, cells, and modules [55,56]. As regards the operation and transport stage, the impacts are due to the energy used. Furthermore, according to Conejo et al. [57], worldwide steel production is dominated by blast furnace technology which uses coke and injected coal as energy sources. The production of one ton of coke requires 1.2 to 1.6 tons of coal. As a result, this process generates around 70% of the total amount of CO2 in the integrated process.

3.8. Water Consumption

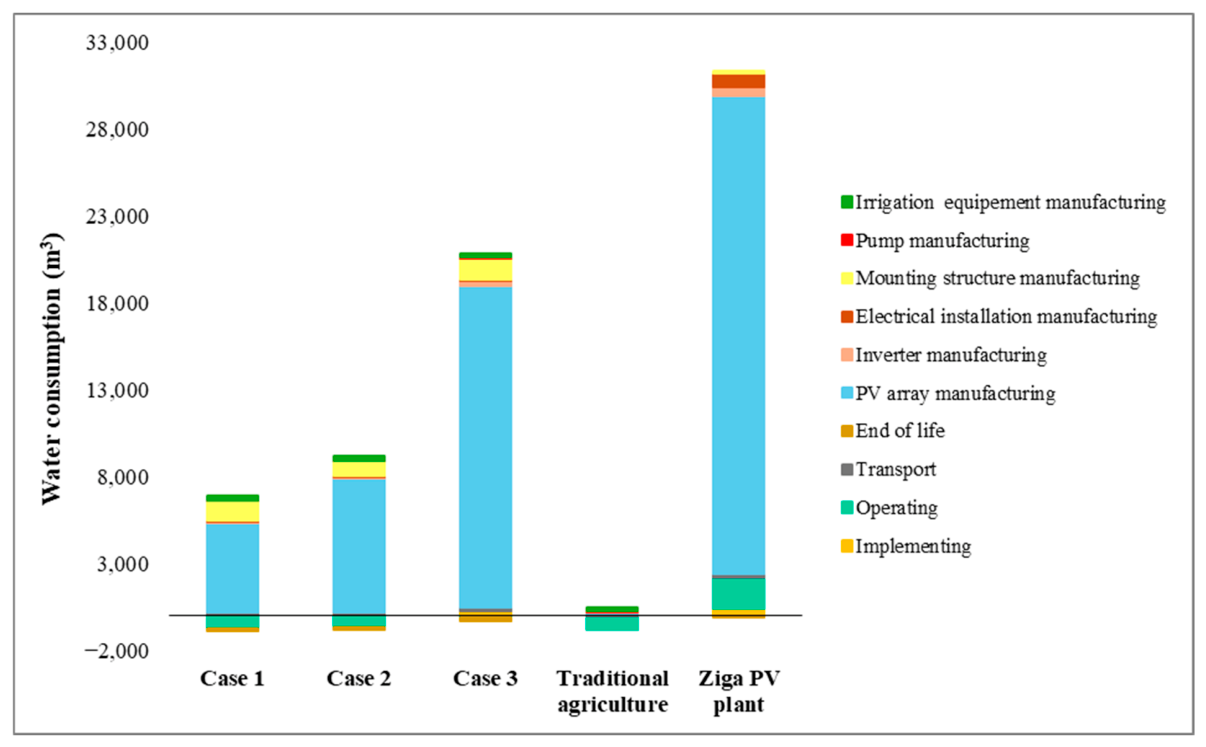
Figure 13 shows the impact of agrivoltaics systems, traditional agriculture, and the Ziga PV power plant on the consumption of water resources during the stages of equipment manufacture, system installation, system operation, material transport, and the end-of-life stage.
The results in Figure 13 show that the equipment manufacturing stage resulted in the highest consumption of water resources in the Ziga PV plant and in the agrivoltaics cases. This is followed by the operating stage in the Ziga PV plant and the transport stages in agrivoltaics cases. However, the impacts of the transport stages are very low, or even negligible, compared to the manufacturing stage. Water used in the manufacturing stage is estimated at 6,683.79 m3 for Case 1, 8,980.02 m3 for Case 2, 20,399.45 m3 for Case 3, 492.01 m3 for traditional agriculture, and 28,935.23 m3 for the Ziga PV plant. The manufacture of solar panels is responsible for the largest quantities of water used. In this respect, panel manufacture is responsible for the use of water resources estimated at 5,121.48 m3 for Case 1, 7,666.25 m3 for Case 2, 18,494.11 m3 for Case 3, 204.34 m3 for traditional agriculture, and 27,523.95 m3 for the Ziga PV plant. Photovoltaic solar panels are made from semiconductors. Manufacturing them requires the use of large quantities of water. Therefore, due to the larger number of PV panels used in the Ziga PV plant, water consumption is higher compared to Cases 1, 2, and 3. Moreover, in 2021, the average water use per unit area of semiconductors produced was 8.22 L/cm2, equivalent to the consumption of 2.58 m3 of water for an eight-inch wafer, according to semiconductor production companies [58]. The panels are followed by the mounting structure in the agrivoltaics systems. Consumption is estimated at 1,159.98 m3 for Case 1, 869.14 m3 for Case 2, 1 229.52 m3 for Case 3, 3.19 m3 for traditional agriculture, and 111.56 m3 for the Ziga PV power plant when manufacturing the mounting structure. Agrivoltaics systems are systems in which large amounts of metal are used for the mounting structure. The average water consumption of an integrated plant steel production is 28.6 m3/t of steel produced [57,59].
The transport stage resulted in the use of 149.56 m3 of water resources for Case 1, 125.54 m3 for Case 2, 207.94 m3 for Case 3, 16.61 m3 for traditional agriculture, and 193.56 m3 for the Ziga PV power plant. In contrast to the Ziga PV plant, the operating stage generated a gain in the amount of water used for agrivoltaics systems and traditional agriculture. The gain is estimated at 967.41 m3 for Case 1, 921.09 m3 for Case 2, 450.59 m3 for Case 3, and 995.85 m3 for traditional agriculture.
These results show that water savings are highest for traditional agriculture, followed by Case 1 and Case 2. This is due to the significant use of water for cleaning the panels, which is included in the operation stage. Indeed, agrivoltaics systems are known for their ability to reduce crop evapotranspiration, and consequently Case 3 should generate the highest water gains, which is the case demonstrated in Figure 13. However, since Case 3 requires more water for panel cleaning, water savings are reduced when considering all components of the operation stage.
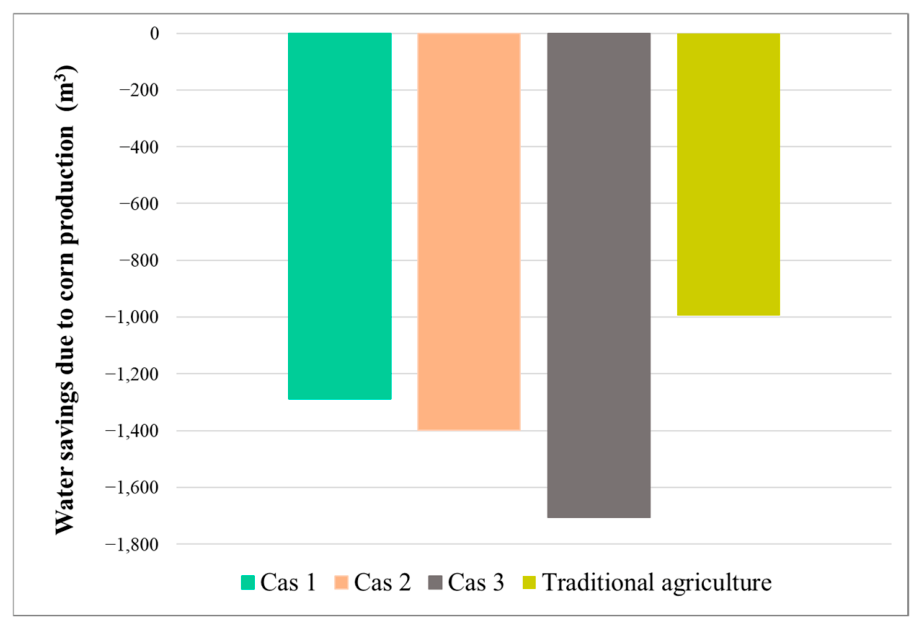
Figure 14 shows the impact of water consumption during corn production in the agrivoltaics systems (Case 1, Case 2, Case 3) and in the monoculture system (traditional agriculture).
The results in Figure 14 show a water gain during agricultural production in both agrivoltaics and monoculture systems. However, this gain is higher in the agrivoltaics systems, more specifically in Case 3. In Case 3, larger panels and a greater number of PV panels are used on the plot, increasing shading and reducing crop evapotranspiration, resulting in a significant gain in water. To this end, a water saving of 1,031.38 m3 was recorded for Case 1, 1,119.69 m3 for Case 2, 1,365.74 m3 for Case 3, and 796.68 m3 for traditional agriculture. The environmental gain and the use of low quantities of water during the operation stage are due to the fact that the panels installed above the crops create a cooler microclimate due to the shade created by the panels, which reduces evapotranspiration [60,61,62,63] and helps conserve soil moisture [64,65].

3.9. Land-Use Efficiency

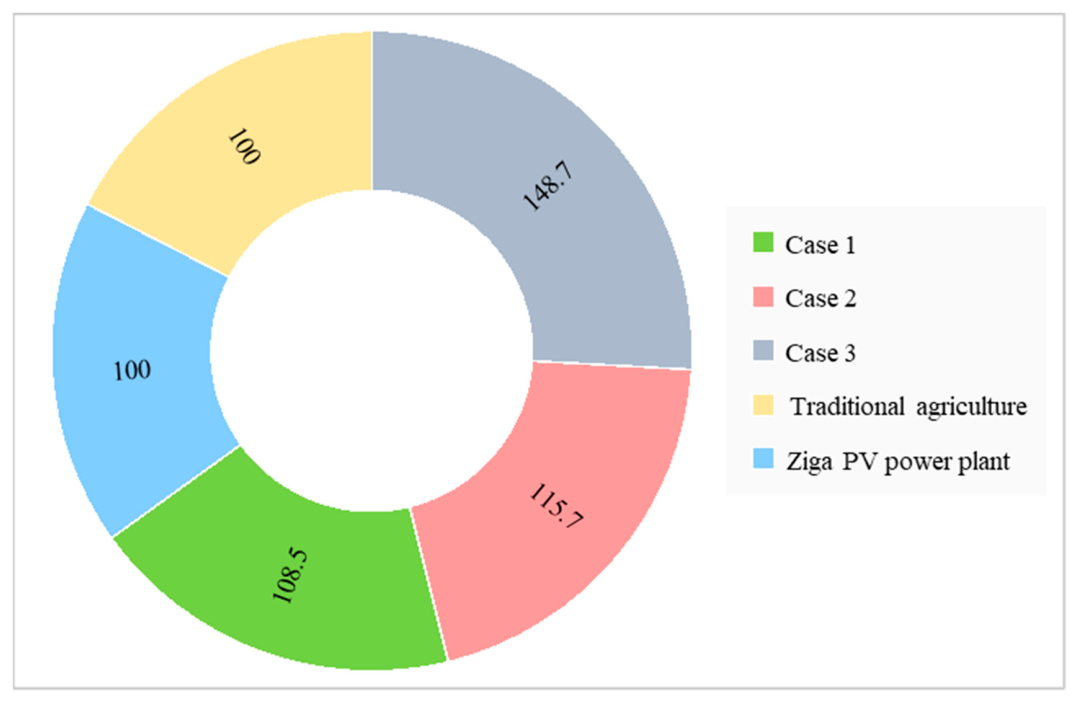
The land equivalent ratio was also assessed to show the efficiency of agrivoltaics systems compared with traditional agriculture and PV power plants (Figure 15).
The results in Figure 15 show that the LER is higher for agrivoltaics systems than for traditional agriculture and Ziga power plants. Specifically, the LER is higher for Case 3, followed by Case 2 and Case 1. Thus, land-use efficiency is 100% for traditional agriculture (with a yield of 3.7 tons per hectare) and for the Ziga photovoltaic power plant (with a peak power of 550 kW), as the land in these cases is only used for agricultural production purposes for traditional agriculture or for energy production purposes for the Ziga power plant. This efficiency is much higher for Case 3, which increased land-use efficiency by 48.7% compared with traditional agriculture and the Ziga PV power plant. The LER is 108.5% for Case 1, 115.7% for Case 2, and 148.7% for Case 3.
In fact, Case 1 has the highest agricultural yield (3.36 t/ha), but it is associated with the lowest photovoltaic capacity (96.9 kW). However, Case 3 is characterized by the highest installed capacity (378.6 kW), nearly four times that of Case 1, but has the lowest agricultural yield (2.96 t/ha). Case 2 occupies an intermediate position, both from an agronomic perspective (3.25 t/ha) and an energy perspective (144 kW). This is due to the increased coverage of the modules, which reduced incident radiation at the plant canopy level, leading to a gradual decrease in agricultural yields from Case 1 to Case 3.
Nevertheless, Case 3 has the highest LER (148.7%), indicating a substantial improvement in land-use efficiency (+48.7%) compared to the reference systems (conventional agriculture and the Ziga photovoltaic power plant). Cases 1 and 2 show LERs of 108.5% and 115.7%, respectively, reflecting more limited gains. These results show a sharp decline in energy production in Cases 1 and 2.
Furthermore, a comparative analysis of installed capacities confirms the key role of the energy component in overall efficiency. The photovoltaic capacity in Case 1 represents only 25.6% of that in Case 3 and 17.6% of that in the reference photovoltaic plant, which limits its overall efficiency gain despite its high agronomic performance. In contrast, Case 3 achieves 68.9% of the photovoltaic plant’s capacity while maintaining significant agricultural yield, equivalent to 88% of that in Case 1 and 80% of open-field conditions. Case 3 therefore appears to be the most effective configuration in terms of sustainable intensification. However, the choice of the optimal scenario remains dependent on local priorities, particularly regarding food security, energy recovery, and socio-economic constraints.

4. Conclusion and Limitations

The agrivoltaics system has emerged as a very promising method of reducing conflicts over access to land for agricultural and energy production. Furthermore, it is a highly beneficial system that enables agricultural and energy production to be carried out on a single area, thus helping to meet the population’s demand for electricity and food, especially as populations increase. Nevertheless, it would be interesting to have an idea of the impact of the implementation of agrivoltaics systems, like any system that can have an impact on the environment. Indeed, climate change and its consequences on the planet are becoming increasingly worrying. As a result, the implementation of any system requires an in-depth study to determine its environmental impact. Agrivoltaics systems have enjoyed enormous success from 2011 to the present day. They are increasingly being adopted in many locations around the world. However, there are no studies that evaluate the impact of varying the configuration of agrivoltaics systems, such as variation in panel height, variation in spacing between panels and between rows of panels, variation in the number of panels per table, and variation in panel type, on climate change, natural resources, and soil. Indeed, variations in configuration can have a severe impact on the amount of equipment used, on water resources used in agriculture, and on soil use efficiency. Moreover, the studies that have been carried out in this field only consider the environmental impacts generated by the components of the photovoltaic system and the impacts arising from the crop grown. However, to our knowledge, no study has considered the preventative environmental impacts of irrigation system components in agrivoltaics systems. Thus, considering all the components of the agrivoltaic system would be interesting in order to make a good comparison between these systems and traditional agricultural production systems and photovoltaic systems in photovoltaic power plants. Thus, in this article, a comparison is made between three configurations of agrivoltaics systems with traditional monoculture and the Ziga PV Power Plant. The comparison is made based on 1 ha of land occupation for each system. The facilities covered are the photovoltaic panels, the PV field mounting structure, the electrical cables, the inverters, the irrigation pipes and sprinklers, the irrigation pump, and the water tank. The stages considered are the following: (i) the equipment manufacturing stage, (ii) the installation stage, (iii) the transportation stage, (iv) the operating stage, which includes agricultural production, and (v) the end-of-life stage. The ReCiPe Midpoint (H) method was used to carry out life cycle analysis, which is modeled in SimaPro software. Environmental impacts on global warming, stratospheric ozone depletion, ionizing radiation, ozone formation, mineral resource scarcity, fossil resource scarcity and water consumption were delineated and compared for the systems studied. The Land Equivalent Ratio was evaluated to determine land-use efficiency.
The results show that the Ziga PV power plant has the highest environmental impacts among the systems studied. Regarding agrivoltaics configurations, the impacts increase progressively from Case 1 to Case 3, with the latter showing the highest values. Overall, the equipment manufacturing phase is the main source of environmental impact for all systems, except for the stratospheric ozone depletion category, for which impacts are dominated by the operational phase, particularly agricultural production.
A comparison with conventional photovoltaics shows that agrivoltaics systems generally have lower impacts. However, in Case 3, the impacts approach those of the photovoltaic power plant, indicating that increasing the installed capacity of the photovoltaic array in agrivoltaics systems can lead to impact levels comparable to those of a PV power plant dedicated solely to energy production. Compared to conventional agriculture, agrivoltaics systems have a greater environmental impact, primarily due to the addition of the solar array and the associated energy production. Nevertheless, this increase in environmental impact must be viewed in the context of the benefits associated with the combined production of energy and agricultural crops. For example, for the climate change impact category, total emissions amount to 1,011,229 kg CO2 eq for the photovoltaic plant, compared to 777,693 kg CO2 eq for Case 3, 376,751 kg CO2 eq for Case 2, and 302,473 kg CO2 eq for Case 1. In comparison, traditional agriculture has significantly lower emissions, estimated at 89,933 kg CO2 eq.
In terms of land-use efficiency, agrivoltaics systems outperform separate systems. LER gains reach 8.5% for Case 1, 15.7% for Case 2, and 48.7% for Case 3, reflecting a more efficient use of available land. This improvement stems from the combination of agricultural and energy production on the same plot, thereby helping to reduce land-use conflicts between agricultural and energy needs.
Thus, although agrivoltaics systems may lead to increased environmental impacts, particularly with the intensification of energy production, they offer an attractive compromise in terms of optimizing land use. Agrivoltaics systems are highly beneficial, providing energy and food products on a single surface, allowing better soil management while also contributing to water resource conservation.
However, this performance remains highly dependent on the sizing of the photovoltaic installations and local conditions, requiring a tailored approach to maximize benefits while limiting impacts.
Despite the advantages of the proposed approach, this life cycle assessment study has some limitations that must be taken into account when interpreting the results. These limitations stem primarily from the use of key assumptions, which may influence the environmental performance of the systems under study. Indeed, the location where equipment is manufactured is a major source of variability. Differences in industrial process efficiency, environmental regulations, and energy intensity across countries can lead to substantial variations in the impacts associated with the production phase. For example, the energy mix used throughout the life cycle strongly influences the results of the life cycle assessment. Emissions profiles associated with electricity generation vary considerably depending on national or regional contexts. In our case, manufacturing countries such as China, Germany, and France were considered, rather than the specific region, due to a lack of precise data specific to the region. The energy mix also varies by country, meaning this study can be adapted for another specific region if data are available to obtain accurate data specific to the region under study. Assumptions regarding transport routes and logistics modes also introduce uncertainty. Travel distances, international supply chains, and the choice of transport modes (maritime, road, or multimodal) directly affect transport’s contribution to overall impacts. Furthermore, the choice of crops in agrivoltaics systems is a key factor, as are agricultural practices. Agricultural yields, input requirements (water, fertilizers, pesticides), and physiological responses to shading conditions vary by crop. Thus, a comparative analysis including multiple crop types would strengthen the results obtained. Finally, end-of-life practices for agricultural and photovoltaic systems in Burkina Faso remain poorly documented, which constitutes an additional source of uncertainty. Furthermore, end-of-life and recycling scenarios are based on assumptions specific to practices in Burkina Faso. In this study, it is assumed that recycling will take place in the country of manufacture. However, this may also change. Waste collection rates, treatment technologies, and recycling performance vary significantly depending on geographic context and the level of development of the waste management sector. Consequently, in the case of Burkina Faso, where waste management infrastructure remains limited, these assumptions may lead to an underestimation or overestimation of the environmental benefits associated with recycling. Considering these factors, future research should aim to broaden the scope of the analysis by incorporating a variety of crops as well as multiple end-of-life scenarios. Such an approach would better capture the variability of the systems under study and enhance the robustness and scope of the results.

Supplementary Materials

The following supporting information can be downloaded at: https://www.mdpi.com/article/10.3390/cleantechnol8030093/s1. References [66,67,68,69,70] are cited in Supplementary Materials.

Author Contributions

Conceptualization, A.S., Y.M.S., L.D., and A.K.T.; methodology, A.S., Y.M.S., L.D., A.K.T., B.K., and P.R.C.S.; writing–original draft preparation, A.S.; writing–review and editing, A.S., Y.M.S., L.D., A.K.T., and B.K. All authors have read and agreed to the published version of the manuscript.

Funding

This article is funded by funds given to Aminata SARR through the L’Oréal-UNESCO For Women In Science—Sub Saharan Africa 2025 program.

Data Availability Statement

The original contributions presented in this study are included in the article/supplementary material. Further inquiries can be directed to the corresponding author.

Acknowledgments

Aminata Sarr would like to thank the Regional Scholarship and Innovation Fund/Partnership for Skills in Applied Sciences, Engineering and Technology (Rsif/PASET) for supporting her studies and the L’Oréal-UNESCO For Women In Science—Sub Saharan Africa 2025 program for the financial support.

Conflicts of Interest

The authors declare that they have no competing interests.

References

  1. Wazed, S.M.; Hughes, B.R.; O’Connor, D.; Calautit, J.K. A review of sustainable solar irrigation systems for Sub-Saharan Africa. Renew. Sustain. Energy Rev. 2018, 81, 1206–1225. [Google Scholar] [CrossRef] [Scilit]
  2. GIZ. Qu’est-ce Que L’agriculture Durable? GIZ: Bonn, Germany, 2016. [Google Scholar]
  3. Wise, T.A. Global Development and Environment Institute Document de Travail No. 13-04: Pourra-t-on Nourrir la Planète en 2050? Un Etat des Lieux des Modèles de Prévisions Actuels; Tufts University: Medford, MA, USA, 2013. [Google Scholar]
  4. Shinde, V.B.; Wandre, S.S. Solar photovoltaic water pumping system for irrigation: A review. Afr. J. Agric. Res. 2015, 10, 2267–2273. [Google Scholar] [CrossRef] [Scilit]
  5. Wisser, D.; Frolking, S.; Douglas, E.M.; Fekete, B.M.; Vörösmarty, C.J.; Schumann, A.H. Global irrigation water demand: Variability and uncertainties arising from agricultural and climate data sets. Geophys. Res. Lett. 2008, 35. [Google Scholar] [CrossRef] [Scilit]
  6. Bretreger, D.; Yeo, I.-Y.; Quijano, J.; Awad, J.; Hancock, G.; Willgoose, G. Monitoring irrigation water use over paddock scales using climate data and landsat observations. Agric. Water Manag. 2019, 221, 175–191. [Google Scholar] [CrossRef] [Scilit]
  7. Bierkens, M.F.P.; Wada, Y. Non-renewable groundwater use and groundwater depletion: A review. Environ. Res. Lett. 2019, 14, 063002. [Google Scholar] [CrossRef] [Scilit]
  8. Priyan, K. Issues and Challenges of Groundwater and Surface Water Management in Semi-Arid Regions. In Groundwater Resources Development and Planning in the Semi-Arid Region; Pande, C.B., Moharir, K.N., Eds.; Springer International Publishing: Cham, Switzerland, 2021; pp. 1–17. [Google Scholar]
  9. McMahon, J.E.; Price, S.K. Water and Energy Interactions. Annu. Rev. Environ. Resour. 2011, 36, 163–191. [Google Scholar] [CrossRef] [Scilit]
  10. Wang, J.; Rothausen, S.G.S.A.; Conway, D.; Zhang, L.; Xiong, W.; Holman, I.P.; Li, Y. China’s water–energy nexus: Greenhouse-gas emissions from groundwater use for agriculture. Environ. Res. Lett. 2012, 7, 014035. [Google Scholar] [CrossRef] [Scilit]
  11. Chen, X.; Thorp, K.R.; Ouyang, Z.; Hou, Y.; Zhou, B.; Li, Y. Energy consumption due to groundwater pumping for irrigation in the North China Plain. Sci. Total Environ. 2019, 669, 1033–1042. [Google Scholar] [CrossRef] [Scilit] [PubMed]
  12. Chandel, S.S.; Naik, M.N.; Chandel, R. Review of solar photovoltaic water pumping system technology for irrigation and community drinking water supplies. Renew. Sustain. Energy Rev. 2015, 49, 1084–1099. [Google Scholar] [CrossRef] [Scilit]
  13. Bos, K.; Chaplin, D.; Mamun, A. Benefits and challenges of expanding grid electricity in Africa: A review of rigorous evidence on household impacts in developing countries. Energy Sustain. Dev. 2018, 44, 64–77. [Google Scholar] [CrossRef] [Scilit]
  14. Martins, F.; Felgueiras, C.; Smitkova, M.; Caetano, N. Analysis of Fossil Fuel Energy Consumption and Environmental Impacts in European Countries. Energies 2019, 12, 964. [Google Scholar] [CrossRef] [Scilit]
  15. Ortega-Arriaga, P.; Babacan, O.; Nelson, J.; Gambhir, A. Grid versus off-grid electricity access options: A review on the economic and environmental impacts. Renew. Sustain. Energy Rev. 2021, 143, 110864. [Google Scholar] [CrossRef] [Scilit]
  16. Bolaños, S.J.; Orozco, W.O.; Bhandari, R. Techno-Economic Feasibility Study of Solar and Wind Based Irrigation Systems in Northern Colombia. In Proceedings of the 4th World Sustainability Forum, Online, 1–30 November 2014. [Google Scholar]
  17. Nederstigt, J.; Bom, G.J. Renewable Energy for Smallholder Irrigation: A Desk Study on the Current State and Future Potential of Using Renewable Energy Sources for Irrigation by Smallholder Farmers; FAO: Rome, Italy, 2014. [Google Scholar]
  18. IRENA. Le Commerce et L’avenir de L’énergie Solaire: Pour des Marchés du Solaire Photovoltaïque Fondés sur L’ouverture et la Qualité; IRENA: Abu Dhabi, United Arab Emirates, 2021. [Google Scholar]
  19. Mamun, M.A.A.; Dargusch, P.; Wadley, D.; Zulkarnain, N.A.; Aziz, A.A. A review of research on agrivoltaic systems. Renew. Sustain. Energy Rev. 2022, 161, 112351. [Google Scholar] [CrossRef] [Scilit]
  20. Goetzberger, A.; Zastrow, A. On the Coexistence of Solar-Energy Conversion and Plant Cultivation. Int. J. Sol. Energy 1982, 1, 55–69. [Google Scholar] [CrossRef] [Scilit]
  21. Dupraz, C.; Marrou, H.; Talbot, G.; Dufour, L.; Nogier, A.; Ferard, Y. Combining solar photovoltaic panels and food crops for optimising land use: Towards new agrivoltaic schemes. Renew. Energy 2011, 36, 2725–2732. [Google Scholar] [CrossRef] [Scilit]
  22. Macknick, J.; Hartmann, H.; Barron-Gafford, G.; Beatty, B.; Burton, R.; Choi, C.S.; Davis, M.; Davis, R.; Figueroa, J.; Garrett, A.; et al. The 5 Cs of Agrivoltaic Success Factors in the United States: Lessons from the InSPIRE Research Study; National Renewable Energy Laboratory: Golden, CO, USA, 2022; NREL/TP-6A20-83566. [Google Scholar]
  23. Weselek, A.; Ehmann, A.; Zikeli, S.; Lewandowski, I.; Schindele, S.; Högy, P. Agrophotovoltaic systems: Applications, challenges, and opportunities. A review. Agron. Sustain. Dev. 2019, 39, 35. [Google Scholar] [CrossRef] [Scilit]
  24. Oleskewicz, K. The Effect of Gap Spacing Between Solar Panel Clusters on Crop Biomass Yields, Nutrients, and the Microenvironment in a Dual-Use Agrivoltaic System. Master’s Thesis, University of Massachusetts Amherst, Amherst, MA, USA, 2020. [Google Scholar]
  25. Pascaris, A.S.; Handler, R.; Schelly, C.; Pearce, J.M. Life cycle assessment of pasture-based agrivoltaic systems: Emissions and energy use of integrated rabbit production. Clean. Responsible Consum. 2021, 3, 100030. [Google Scholar] [CrossRef] [Scilit]
  26. Handler, R.; Pearce, J.M. Greener sheep: Life cycle analysis of integrated sheep agrivoltaic systems. Clean. Energy Syst. 2022, 3, 100036. [Google Scholar] [CrossRef] [Scilit]
  27. Zhang, J.; Wang, T.; Chang, Y.; Liu, B. A sustainable development pattern integrating data centers and pasture-based agrivoltaic systems for ecologically fragile areas. Resour. Conserv. Recycl. 2023, 188, 106684. [Google Scholar] [CrossRef] [Scilit]
  28. Ott, E.M.; Kabus, C.A.; Baxter, B.D.; Hannon, B.; Celik, I. Environmental Analysis of Agrivoltaic Systems. Compr. Renew. Energy (Second Ed.) 2022, 9, 127–139. [Google Scholar]
  29. Wagner, M.; Lask, J.; Kiesel, A.; Lewandowski, I.; Weselek, A.; Högy, P.; Trommsdorff, M.; Schnaiker, M.-A.; Bauerle, A. Agrivoltaics: The Environmental Impacts of Combining Food Crop Cultivation and Solar Energy Generation. Agronomy 2023, 13, 299. [Google Scholar] [CrossRef] [Scilit]
  30. Krexner, T.; Bauer, A.; Gronauer, A.; Mikovits, C.; Schmidt, J.; Kral, I. Environmental life cycle assessment of a stilted and vertical bifacial crop-based agrivoltaic multi land-use system and comparison with a mono land-use of agricultural land. Renew. Sustain. Energy Rev. 2024, 196, 114321. [Google Scholar] [CrossRef] [Scilit]
  31. Azzopardi, B.; Mutale, J. Life cycle analysis for future photovoltaic systems using hybrid solar cells. Renew. Sustain. Energy Rev. 2010, 14, 1130–1134. [Google Scholar] [CrossRef] [Scilit]
  32. Liu, X.; Hoekman, S.K.; Robbins, C.; Ross, P. Lifecycle climate impacts and economic performance of commercial-scale solar PV systems: A study of PV systems at Nevada’s Desert Research Institute (DRI). Sol. Energy 2015, 119, 561–572. [Google Scholar] [CrossRef] [Scilit]
  33. Badza, K.; Soro, Y.M.; Sawadogo, M. Life cycle assessment of a 33.7 MW solar photovoltaic power plant in the context of a developing country. Sustain. Environ. Res. 2023, 33, 38. [Google Scholar] [CrossRef] [Scilit]
  34. Shah, H.H.; Bareschino, P.; Mancusi, E.; Pepe, F. Environmental Life Cycle Analysis and Energy Payback Period Evaluation of Solar PV Systems: The Case of Pakistan. Energies 2023, 16, 6400. [Google Scholar] [CrossRef] [Scilit]
  35. Sarr, A.; Mérida-García, A.; Diop, L.; Mateos, L.; Lamaddalena, N.; Rodríguez-Díaz, J.A. Decision Support Tool for the Optimal Sizing of Solar Irrigation Systems. Processes 2023, 11, 942. [Google Scholar] [CrossRef] [Scilit]
  36. Sarr, A.; Soro, Y.M.; Diop, L.; Tossa, A.K.; Samayouga, P.R.C. Agrivoltaics for Sustainable Energy and Food Production in West Africa: Profitability Assessment of Configurations Variation (Case of Burkina Faso). Sustainability 2025, 17, 10468. [Google Scholar] [CrossRef] [Scilit]
  37. Elamri, Y.; Cheviron, B.; Lopez, J.-M.; Dejean, C.; Belaud, G. Water budget and crop modelling for agrivoltaic systems: Application to irrigated lettuces. Agric. Water Manag. 2018, 208, 440–453. [Google Scholar] [CrossRef] [Scilit]
  38. Trommsdorff, M.; Kang, J.; Reise, C.; Schindele, S.; Bopp, G.; Ehmann, A.; Weselek, A.; Högy, P.; Obergfell, T. Combining food and energy production: Design of an agrivoltaic system applied in arable and vegetable farming in Germany. Renew. Sustain. Energy Rev. 2021, 140, 110694. [Google Scholar] [CrossRef] [Scilit]
  39. Balomenos, E.; Panias, D.; Paspaliaris, I. Energy and Exergy Analysis of the Primary Aluminum Production Processes: A Review on Current and Future Sustainability. Miner. Process. Extr. Metall. Rev. 2011, 32, 69–89. [Google Scholar] [CrossRef] [Scilit]
  40. Strachala, D.; Hylský, J.; Fafilek, G.; Jandová, K. Methods for recycling photovoltaic modules and their impact on environment and raw material extraction. Acta Montan. Slovaca 2017, 22, 257–269. [Google Scholar]
  41. Artaş, S.B.; Kocaman, E.; Bilgiç, H.H.; Tutumlu, H.; Yağlı, H.; Yumrutaş, R. Why PV panels must be recycled at the end of their economic life span? A case study on recycling together with the global situation. Process Saf. Environ. Prot. 2023, 174, 63–78. [Google Scholar] [CrossRef] [Scilit]
  42. Dubey, S.; Jadhav, N.Y.; Zakirova, B. Socio-Economic and Environmental Impacts of Silicon Based Photovoltaic (PV) Technologies. Energy Procedia 2013, 33, 322–334. [Google Scholar] [CrossRef] [Scilit]
  43. Allwood, J.M.; Cullen, J.M. Sustainable Materials: With Both Eyes Open; UIT Cambridge: Cambridge, UK, 2012. [Google Scholar]
  44. Salonitis, K.; Jolly, M.; Pagone, E.; Papanikolaou, M. Life-Cycle and Energy Assessment of Automotive Component Manufacturing: The Dilemma Between Aluminum and Cast Iron. Energies 2019, 12, 2557. [Google Scholar] [CrossRef] [Scilit]
  45. Sun, W.; Cai, J.; Du, T.; Zhang, D. Specific Energy Consumption Analysis Model and Its Application in Typical Steel Manufacturing Process. J. Iron Steel Res. Int. 2010, 17, 33–37. [Google Scholar] [CrossRef] [Scilit]
  46. Andersen, S.O.; Halberstadt, M.L.; Borgford-Parnell, N. Stratospheric ozone, global warming, and the principle of unintended consequences—An ongoing science and policy success story. J. Air Waste Manag. Assoc. 2013, 63, 607–647. [Google Scholar] [CrossRef] [Scilit] [PubMed]
  47. Selvaraj, A.; Gautam, J.; Verma, S.; Verma, G.; Jain, S. Life cycle sustainability assessment of crops in India. Curr. Res. Environ. Sustain. 2021, 3, 100074. [Google Scholar] [CrossRef] [Scilit]
  48. Simpson, I.J.; Barletta, B.; Meinardi, S.; Aburizaiza, O.S.; DeCarlo, P.F.; Farrukh, M.A.; Khwaja, H.; Kim, J.; Kim, Y.; Panday, A.; et al. CFC-11 measurements in China, Nepal, Pakistan, Saudi Arabia and South Korea (1998–2018): Urban, landfill fire and garbage burning sources. Environ. Chem. 2022, 18, 370–392. [Google Scholar] [CrossRef] [Scilit]
  49. Srivastava, R.K.; Hall, R.E.; Khan, S.; Culligan, K.; Lani, B.W. Nitrogen oxides emission control options for coal-fired electric utility boilers. J. Air Waste Manag. Assoc. 2005, 55, 1367–1388. [Google Scholar] [CrossRef] [Scilit]
  50. Wang, J.; Qiu, Y.; He, S.; Liu, N.; Xiao, C.; Liu, L. Investigating the driving forces of NOx generation from energy consumption in China. J. Clean. Prod. 2018, 184, 836–846. [Google Scholar] [CrossRef] [Scilit]
  51. Wang, M.; Yao, M.; Wang, S.; Qian, H.; Zhang, P.; Wang, Y.; Sun, Y.; Wei, W. Study of the emissions and spatial distributions of various power-generation technologies in China. J. Environ. Manag. 2021, 278, 111401. [Google Scholar] [CrossRef] [Scilit]
  52. Far, A.R.H.; Anijdan, S.H.M.; Abbasi, S.M. The effect of increasing Cu and Ni on a significant enhancement of mechanical properties of high strength low alloy, low carbon steels of HSLA-100 type. Mater. Sci. Eng. A 2019, 746, 384–393. [Google Scholar] [CrossRef] [Scilit]
  53. US Department of Energy. Solar Photovoltaics: Supply Chain Deep Dive Assessment; US Department of Energy: Washington, DC, USA, 2022.
  54. Reddy, M.S.; Basha, S.; Joshi, H.V.; Jha, B. Evaluation of the emission characteristics of trace metals from coal and fuel oil fired power plants and their fate during combustion. J. Hazard. Mater. 2005, 123, 242–249. [Google Scholar] [CrossRef] [Scilit] [PubMed]
  55. Troszak, T. Why Do We Burn Coal and Trees to Make Solar Panels? 2019. Available online: https://www.researchgate.net/publication/335083312_Why_do_we_burn_coal_and_trees_to_make_solar_panels (accessed on 20 August 2024).
  56. Carbajales-Dale, M.; Barnhart, C.J.; Benson, S.M. Can we afford storage? A dynamic net energy analysis of renewable electricity generation supported by energy storage. Energy Environ. Sci. 2014, 7, 1538–1544. [Google Scholar] [CrossRef] [Scilit]
  57. Conejo, A.N.; Birat, J.-P.; Dutta, A. A review of the current environmental challenges of the steel industry and its value chain. J. Environ. Manag. 2020, 259, 109782. [Google Scholar] [CrossRef] [Scilit]
  58. Wang, Q.; Huang, N.; Chen, Z.; Chen, X.; Cai, H.; Wu, Y. Environmental data and facts in the semiconductor manufacturing industry: An unexpected high water and energy consumption situation. Water Cycle 2023, 4, 47–54. [Google Scholar] [CrossRef] [Scilit]
  59. World Steel Association. Water Management in the Steel Industry; Worldsteel Position Paper; World Steel Association: Brussels, Belgium, 2015. [Google Scholar]
  60. Dinesh, H.; Pearce, J.M. The potential of agrivoltaic systems. Renew. Sustain. Energy Rev. 2016, 54, 299–308. [Google Scholar] [CrossRef] [Scilit]
  61. Liu, Y.; Zhang, R.; Huang, Z.; Cheng, Z.; López-Vicente, M.; Ma, X.; Wu, G. Solar photovoltaic panels significantly promote vegetation recovery by modifying the soil surface microhabitats in an arid sandy ecosystem. Land Degrad. Dev. 2019, 30, 2177–2186. [Google Scholar] [CrossRef] [Scilit]
  62. Barron-Gafford, G.A.; Pavao-Zuckerman, M.A.; Minor, R.L.; Sutter, L.F.; Barnett-Moreno, I.; Blackett, D.T.; Thompson, M.; Dimond, K.; Gerlak, A.K.; Nabhan, G.P.; et al. Agrivoltaics provide mutual benefits across the food–energy–water nexus in drylands. Nat. Sustain. 2019, 2, 848–855. [Google Scholar] [CrossRef] [Scilit]
  63. Sarr, A.; Soro, Y.M.; Tossa, A.K.; Diop, L. Agrivoltaic, a Synergistic Co-Location of Agricultural and Energy Production in Perpetual Mutation: A Comprehensive Review. Processes 2023, 11, 948. [Google Scholar] [CrossRef] [Scilit]
  64. Adeh, E.H.; Selker, J.S.; Higgins, C.W. Remarkable agrivoltaic influence on soil moisture, micrometeorology and water-use efficiency. PLoS ONE 2018, 13, e0203256. [Google Scholar]
  65. Yue, S.; Guo, M.; Zou, P.; Wu, W.; Zhou, X. Effects of photovoltaic panels on soil temperature and moisture in desert areas. Environ. Sci. Pollut. Res. 2021, 28, 17506–17518. [Google Scholar] [CrossRef] [Scilit]
  66. Blinová, L.; Godovčin, P. Importance of Recycling the Waste-Cables Containing Copper and PVC. Res. Pap. Fac. Mater. Sci. Technol. Slovak Univ. Technol. 2021, 29, 1–21. [Google Scholar] [CrossRef] [Scilit]
  67. Wędrychowicz, M.; Kurowiak, J.; Skrzekut, T.; Noga, P. Recycling of Electrical Cables—Current Challenges and Future Prospects. Materials 2023, 16, 6632. [Google Scholar] [CrossRef] [Scilit] [PubMed]
  68. Mulazzani, A.; Eleftheriadis, P.; Leva, S. Recycling c-Si PV Modules: A Review, a Proposed Energy Model and a Manufacturing Comparison. Energies 2022, 15, 8419. [Google Scholar] [CrossRef] [Scilit]
  69. Tschümperlin, L.; Stolz, P.; Frischknecht, R. Life Cycle Assessment of Low Power Solar Inverters (2.5 to 20 kW); Swiss Federal Office of Energy (SFOE): Zurich/Uster, Switzerland, 2016.
  70. Psomopoulos, C.S.; Ioannidis, G.C.; Apostolakos, S.; Madias, A. Submersible Sewage Pumps’ Recycling Possibilities during the Refurbishing or Upgrade of Wastewater Management Facilities. In Proceedings of the 2nd International CEMEPE & SECOTOX Conference, Mykonos, Greece, 21–26 June 2009. [Google Scholar]
Figure 1. Configurations of the agrivoltaics systems studied [36].
Cleantechnol 08 00093 g001
Figure 2. Agrivoltaics systems (a); traditional agriculture (b); and solar PV power plants (c) [36].
Cleantechnol 08 00093 g002
Figure 3. System boundaries for agrivoltaics systems.
Cleantechnol 08 00093 g003
Figure 4. System boundaries for traditional farming systems.
Cleantechnol 08 00093 g004
Figure 5. System boundaries for the Ziga PV power plant.
Cleantechnol 08 00093 g005
Figure 6. Impact of the agrivoltaics systems, the traditional agricultural system, and the Ziga PV power plant on global warming.
Cleantechnol 08 00093 g006
Figure 7. Impact of agrivoltaics systems, traditional agricultural, and Ziga PV power plant on stratospheric ozone depletion.
Cleantechnol 08 00093 g007
Figure 8. Impact of the agrivoltaics systems, the traditional agricultural system, and the Ziga PV power plant on ionizing radiation.
Cleantechnol 08 00093 g008
Figure 9. Impact of agrivoltaics systems, traditional agricultural, and the Ziga PV power plant on ozone formation and human health.
Cleantechnol 08 00093 g009
Figure 10. Impact of agrivoltaics systems, traditional agricultural, and the Ziga PV power plant on ozone formation and terrestrial ecosystems.
Cleantechnol 08 00093 g010
Figure 11. Impact of agrivoltaics systems, traditional agricultural, and the Ziga PV power plant on mineral resource scarcity.
Cleantechnol 08 00093 g011
Figure 12. Impact of agrivoltaics systems, traditional agricultural, and the Ziga PV power plant on fossil resource scarcity.
Cleantechnol 08 00093 g012
Figure 13. Impact of agrivoltaics systems, traditional agricultural, and the Ziga PV power plant on water resource use.
Cleantechnol 08 00093 g013
Figure 14. Water savings from corn production in agrivoltaics and traditional agricultural systems.
Cleantechnol 08 00093 g014
Figure 15. Land Equivalent Ratio efficiency in the agrivoltaics systems, the traditional agricultural system, and the Ziga PV plant.
Cleantechnol 08 00093 g015
Table 1. Equipment used in agrivoltaics systems, traditional agriculture, and solar power plants.
EquipmentCase 1Case 2Case 3Traditional AgriculturePV Power Plant
Photovoltaic solar panelsxxxxx
Mounting structurexxxxx
Inverterxxx-x
Electrical cablexxxxx
Irrigation pumpxxxx-
Irrigation systemxxxx-
Water tankxxxx-
(x) is the equipment included and (-) is the equipment not included.
Table 2. Equipment and quantities used for each system during installation stage.
EquipmentCase 1Case 2Case 3Traditional AgriculturePV Power Plant
PV panelsPoly-Si
100 W; 0.68 m2
Quantity: 969 units
Origin: China
Poly-Si
100 W; 0.68 m2
Quantity: 1440 units
Origin: China
Poly-Si
260 W; 1.61 m2
Quantity: 1452 units
Origin: China
Poly-Si
260 W; 1.61 m2
Quantity: 16 units
Origin: China
Poly-Si
250 W; 1.60 m2
Quantity: 2200 units
Origin: China
InverterSunny Tripower 20000TL-30
Quantity: 4 units
Origin: Germany
Sunny Tripower 20000TL-30
Quantity: 6 units
Origin: Germany
Sunny Tripower 25000TL_JP-30 Quantity: 12 units
Origin: Germany
-Sunny Tripower SMA Solar technology AG Quantity: 22 units
Origin: Germany
Mounting structureSteel
Quantity: 55,455 kg
Origin: China
Steel
Quantity: 41,551 kg
Origin: China
Steel
Quantity: 58,780 kg
Origin: China
Steel
Quantity: 153 kg
Origin: China
Steel
Quantity: 24,644 kg
Origin: China
Electrical cableQuantity: 550 kg
Origin: France
Quantity: 608 kg
Origin: France
Quantity: 1260 kg
Origin: France
Quantity: 6.4 kg
Origin: China
Quantity: 1282 kg
Origin: China
Polytank5 m3 PEHD5 m3 PEHD5 m3 PEHD5 m3 PEHD-
Irrigation systemPolyethylene
Quantity: 5166 kg
Polyethylene
Quantity: 5166 kg
Polyethylene
Quantity: 5166 kg
Polyethylene
Quantity: 5166 kg
-
Irrigation pump9 m3/h;140 m; 2200 W
Quantity: 1
9 m3/h;140 m; 2200 W
Quantity: 1
9 m3/h;140 m; 2200 W
Quantity: 1
9 m3/h;140 m; 2200 W
Quantity: 1
-
Disclaimer/Publisher’s Note: The statements, opinions and data contained in all publications are solely those of the individual author(s) and contributor(s) and not of MDPI and/or the editor(s). MDPI and/or the editor(s) disclaim responsibility for any injury to people or property resulting from any ideas, methods, instructions or products referred to in the content.