Article

Representative Hydrogen Sampling at Hydrogen Refuelling Stations: Interplay of Sampling Strategy and Station Parameters

1
The Hydrogen and Fuel Cell Center (ZBT GmbH), Carl-Benz-Strasse 201, 47057 Duisburg, Germany
2
National Physical Laboratory (NPL), Hampton Road, Teddington TW11 0LW, Middlesex, UK
3
ENGIE, Research Center ENGIE LAB CRIGEN, 4 Rue Joséphine Baker, 93240 Stains, France
4
ENGIE, Research Center ENGIE LAB CRIGEN, 5 Quai Louis Aulagne, 69190 St-Fons, France
5
Paris-Saclay Research Center, Air Liquide, BP 126, 78353 Jouy en Josas, France
6
Air Liquide CEMIAG, BP 126, 78353 Jouy en Josas, France
7
Institute of Energy Technology, Faculty of Engineering, University of Duisburg-Essen (UDE), Lotharstr. 1, 47058 Duisburg, Germany
*
Authors to whom correspondence should be addressed.
Clean Technol. 2026, 8(3), 91; https://doi.org/10.3390/cleantechnol8030091
Submission received: 25 March 2026 / Revised: 27 April 2026 / Accepted: 25 May 2026 / Published: 10 June 2026

Abstract

Taking spot samples at hydrogen refuelling stations (HRSs) and performing offline analysis in laboratories is currently the only way to achieve hydrogen fuel compliance at HRS (meet the ISO 14687:2025 standard or EN 17124:2022 in Europe). Currently, different sampling strategies are defined in ISO 19880-9:2024 (Annex A–C) and implemented in different parts of the world (EU, Japan, USA). The differences in conducting the sampling potentially influence the hydrogen samples; therefore, there is a need to compare the different sampling strategies. Comparative sampling studies are required to evaluate the equivalence of sampling methodologies and support the standardisation of hydrogen fuel sampling. This study provides a systematic comparison of five European sampling systems with different sampling strategies under real and defined HRS operation conditions. The results show that the issue of representative sampling is more complex than initially assumed and that there is an interdependence of sampling device and HRS configuration, respectively.

1. Introduction

As hydrogen infrastructure continues to expand rapidly, regulatory frameworks are being developed and refined in parallel. This includes specific requirements governing hydrogen fuel quality.
Hydrogen fuel dispensed by the hydrogen refuelling stations (HRSs) to fuel cell electrical vehicles (FCEVs) must be compliant with national or international requirements. These are stated in different standards as for example the international standard ISO14687:2025 [1], the European standard EN17124:2022 [2] or SAE standard J2719 [3]. Within current regulatory frameworks, spot sampling is the most widely used approach for assessing hydrogen fuel quality at refuelling stations. Despite rapid progress in the development of online analytical techniques, compliance verification at HRS is still predominantly based on spot sampling, as it enables the determination of all regulated compounds. This method relies on collecting hydrogen samples at the dispenser nozzle, which are subsequently transferred into sampling vessels and analysed off-site in laboratories. The use of controlled laboratory conditions and calibrated instrumentation provides high measurement reliability and traceability. An additional advantage of this approach is that the collected samples can be stored over time, allowing for repeat measurements and inter-laboratory comparison studies.
The spot sampling method requires taking a sample at the HRS nozzle in challenging conditions including temperature (from ambient temperature down to −40 °C), pressure (up to 87.5 MPa) and mass flow variations (up to 120 g/s). It requires specialised sampling equipment (often referred to as a sampling device), and qualified personnel to operate. Currently, different strategies and types of equipment are employed across various regions worldwide. For example, the “gas serial” sampling strategy (i.e., ASTM D7606-17 [4]) is used in North America and “gas parallel” sampling (i.e., Hy-SaM, H2 Qualitizer [5]) is often used in Europe. Despite these sampling systems having already been used for hundreds of hydrogen fuel sampling campaigns in the USA [6,7], the EU [8], and Japan [7], they have never been systematically compared on a large scale. A new ISO standard ISO 19880-9 [5] was recently published with the ambition to provide guidance on hydrogen fuel sampling. However, comparison of sampling system performance was lacking for progress harmonisation. Without such comparison, strategy bias may exist and would completely bias the results between the different location (e.g., bias due to strategy sampling between North America and Europe). Only a limited number of bilateral comparisons have been conducted in Europe, for example within the HyCORA project [9]. Comparisons of parallel sampling strategies have been performed in European projects, including a bilateral assessment between the HySaM and H2 Qualitizer sampling systems [8,9,10,11]. These studies reported no significant discrepancies between the two parallel sampling approaches. A further comparison between parallel and serial sampling strategies was carried out using the H2 Qualitizer and an Air Liquide sampling system at a single HRS [12]. To date, comparative studies of sampling systems have primarily focused on the sampling devices themselves (e.g., system design, type of cylinders used), while the influence of broader HRS operational parameters has largely been neglected. In addition, previous comparisons were conducted at refuelling stations exhibiting relatively low levels of contaminants, often with only traceable or quantifiable concentrations. As a result, reported equivalence was frequently based on the absence of detectable differences rather than on comparisons of measured concentration levels. Moreover, relevant HRS operating conditions were not consistently documented in these studies. More recently, Enakonda et al. reported differences between LD and HD sampling at the same HRS, particularly for water, indicating that variations in refuelling conditions (e.g., pre-cooling strategies) may significantly influence sampling results [13]. It is crucial to realise that during the refuelling/sampling process, only few parameters are constant, and most parameters can change significantly even during back-to-back refuelling (e.g., storage bank, temperature of hydrogen, flow). A more detailed examination of the influence of HRS has generally not been taken into account, or only to a limited extent. With the objective of standardising hydrogen fuel sampling to support ISO 19880-9 effort, understanding the influence of HRS parameters on sampling is essential especially as the sampling strategy requires HRS operation in completely different settings (e.g., normal filling protocol versus maintenance mode).
The first deviation of the sampling from the refuelling lies in the communication between the hydrogen source (HRS) and the sink (e.g., FCEV, sink). Sampling has always been non-communication protocol while normal refuelling requires communication protocol. As a result, refuelling in non-communication mode is always more conservative and therefore slower. To determine the state of charge (SOC), the initial pressure and the volume of the vehicle tank, a pressure pulse is carried out from the HRS. With this information together with ambient temperature measurement the starting pressure, the pressure ramp rate and the precooling temperature are determined (either table-based like SAE J2601 that is used in this study or formula-based, e.g., MC—Formula) [14]. The HRS usually has various pressure storage levels available (banks) as hydrogen sources and, depending on the starting pressure of the sink, fuel is drawn from the storage banks that make the most sense from an energy efficiency point of view. From the above, it quickly becomes clear that HRS operating conditions could dominate observed differences between sampling systems. In this study, five sampling systems based on two different sampling strategies (“gas parallel” and “gas serial”) were compared with a focus on HRS parameters. At this point, two points needed to be clarified: How much the sampling system requirements on the HRS operation affect the hydrogen fuel delivered, and if a variation is observed, how to set similar HRS operation to allow reliable and unbiased comparison of the different sampling systems.
The objective is to study the variation of hydrogen fuel quality in function of the sampling device methodology (including HRS operation requirements as set temperature, pressure). Beyond the accuracy of the analytical method, taking a representative sample is of high importance as important decisions (e.g., public access for refuelling) are based on the outcomes of the hydrogen quality assessment. Reliable and representative sampling is key to hydrogen fuel quality monitoring and to the successful deployment of hydrogen fuel for vehicles.
To achieve this, the study focusses on testing several representative sampling systems at a R&D HRS with quantifiable amount fractions of various contaminants. First the HRS parameters were set by the sampling system state-of-the-art method (the filling station automatically adapts to the conditions and selects a suitable protocol or if necessary, a defined condition for sampling devices is used), and secondly a harmonised HRS set of parameters was defined to enhance the equivalence of the hydrogen fuel sampled by the different sampling strategies. Finally, the discussion focusses on the impact of HRS parameters on fuel quality and the need for further standardisation and validation to ensure worldwide equivalence.

2. Materials and Methods

2.1. Sampling Systems

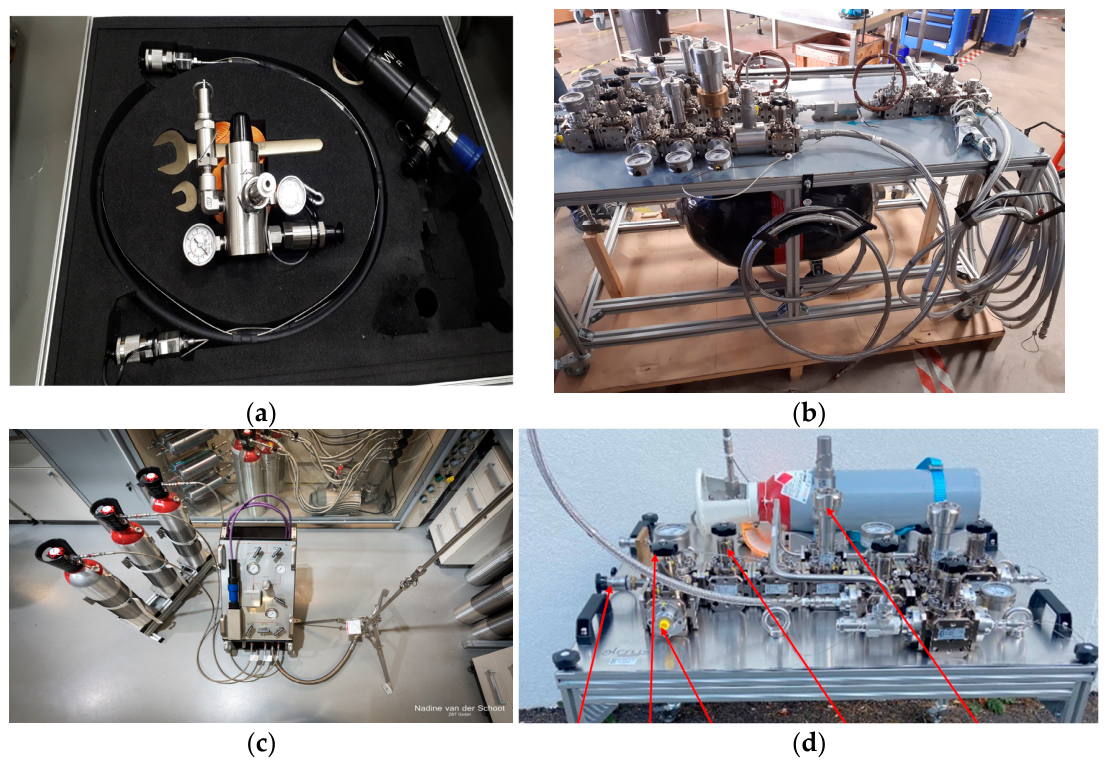
Sampling was conducted with five different sampling devices representing parallel sampling strategy (3 systems) and serial sampling strategy (2 systems). The five systems, the Hy-SaM (provided by Hydrogen and fuel cell center (ZBT, Duisburg, Germany), the Linde Qualitizer (Linde, Stadl-Paura, Austria. Provided by National physical laboratory, NPL, London, UK), systems by Air Liquide, by Engie (Stains, France) and an external sampling device, are presented in the section below (Figure 1).
Air Liquide (AL): Serial sampling device with 5 L aluminium cylinder with double-ended stainless-steel valves (Air Liquide, Jouy en Josas, France). Accurate cleaning of the sampling cylinder for representative sampling is realised by a validated Air Liquide cleaning procedure. The sampling cylinder contains a slight overpressure of high-purity hydrogen (Alphagaz 2 quality, N60) at the start of sampling. For sampling the HRS was set to manual mode to provide constant pressure (18 MPa) and pre-cooling temperature (T20) [15]. After connection to the HRS the sampling system was repeatedly purged (10 times) using hydrogen from the HRS through pressurisation and venting. The procedure was repeated with purging through the sample cylinder (10 times). Finally, the sample cylinder was filled to 15 MPa. The sampling device includes a pressure-reduced valve port for the integration of an inline water analyzer. Water content measurements were used to confirm that the moisture level within the sampling system met the specified customer requirements prior to sample cylinder filling.
Engie (EnG): The Engie sampling device is a multi-purpose system designed for operation at 70 MPa and 35 MPa, and also enables online fuel quality monitoring. The system includes a 55 L composite tank serving as a sink, simulating the presence of a fuel cell electric vehicle (FCEV).
A dedicated sampling line allows parallel sampling into two 1 L double-ended cylinders during refuelling of the tank. In addition, a separate fast-loop line is integrated for online analysis using an optical feedback cavity-enhanced absorption spectrometer (OFCEAS) (AP2E, Aix-en-Provence, France), enabling monitoring of oxygen and water, and providing access to methane, hydrogen sulphide (H2S), and carbon dioxide concentrations.
The sampling device was connected to the HRS through the 70 MPa receptacle. The HRS was set to provide hydrogen at constant 20 MPa pressure with a T20 pre-cooling. The sampling device was flushed repeatedly (10 times) using nitrogen (5.0, 99.999%) and UHP hydrogen (6.0, 99.9999%)) before sampling. Two 1 L sample cylinders (stainless steel and Sulfinert® coating) were purged with nitrogen and prefilled with 0.1 MPa UHP hydrogen before installation on the sampling device. The sampling device was purged with nitrogen after use to be transported (the device is PED certified).
Hy-SaM: The Hy-SaM sampling device, designed by ZBT and the Zentrum für Sonnenenergie- und Wasserstoff-Forschung (ZSW, Ulm, Germany), is a parallel sampling system. The device has been previously described by Arrhenius et al. [10]. It enables simultaneous sampling into up to three sample cylinders with volumes of 2.25–10 L. The sampling time can be adjusted by controlling the flow into the cylinders via a needle valve.
The system is fully passivated (Silconert2000, SilcoTek, Bellefonte, PA, USA) to minimise adsorption of impurities on internal surfaces. Prior to sampling, the system is purged on the high-pressure side via an aborted refuelling sequence. With the sample cylinders pre-filled to 1 MPa with ultra-high-purity (UHP) hydrogen (purified hydrogen 5.0, Air Liquide, using an Entegris palladium hydrogen purifier), an additional purging of the low-pressure side of the Hy-SaM system is achieved.
For the present campaign, two 10 L aluminium Spectra-Seal lined cylinders (BOC, Crewe, UK) equipped with stainless steel valves were used. A 244 L, 70 MPa Type IV tank (Hexagon, Ontario, CA, USA) served as the sink (vehicle tank).
Qualitizer: The H2 Qualitizer system, developed by Linde (Stadl-Paura, Austria), is a parallel sampling system previously described by Arrhenius et al. [10]. A small-bore high-pressure hose connects the tee junction to a 103.4 MPa pressure reduction valve equipped with a safety relief valve and a pressure gauge (Tescom, Elk River, MN, USA). The flow is throttled to fill the sample cylinder to approximately 10 MPa over the time required to refuel a light-duty vehicle. The sampling cylinders used were 10 L aluminium cylinders, either unpassivated (Luxfer, Nottingham, UK) or DBGold-passivated (Effectech, Uttoxeter, UK), equipped with stainless steel valves. Prior to use, the cylinders were evacuated to a pressure below 0.01 Pa. Sampling with the Linde Qualitizer was performed following a standard refuelling protocol. A 244 L, 70 MPa Type IV tank (Hexagon, Ontario, CA, USA) was used as the sink instead of a fuel cell electric vehicle (FCEV). Prior to sampling, the system was purged via the bleed valve on the Tescom unit by aborting the refuelling process and subsequently depressurizing the Qualitizer system.
Sampling device of external partner (SDEP): A sampling device from a commercial laboratory realising hydrogen fuel quality was invited to join the intercomparison study in the second study. The system is a “gas serial” sampler designed based on D7606-17 [4]. No further description was provided due to confidentiality.

2.2. Hydrogen Refuelling Station (HRS)

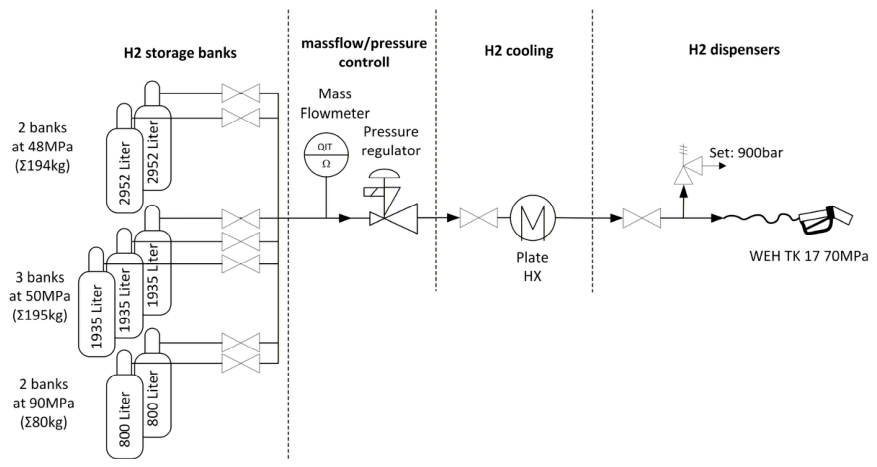
Sampling experiments were performed at ZBTs test HRS on the hydrogen test field in Duisburg, Germany. A simplified schematic of the test HRS is given in Figure 2. ZBTs test station consists of seven storage banks with a total hydrogen capacity of approximately 500 kg (stored at 48, 50 and 100 MPa). Pre-cooling can be controlled from −40 ≤ T40 ≤ −33, T30: −33 ≤ T30 ≤ −26 up to TA: ambient temperature (without cooling), with a solid (THEISEN GmbH & Co. KG, Ochtrup, Deutschland) and plate heat exchanger (Kobe Steel Ltd., Takasago, Japan) available. Mass flows up to 120 g/s are possible. Refuelling can be done at 70 MPa (LD) and 35 MPa (HD). Possible refuelling protocols are: SAE J2601, MC-Formular, PHRYDE & “free” configurable [14,15,16,17]. All the H2 fuel sampling were realised consecutively without any external events in between.
After each refuelling, the refuelled hydrogen is not released into the atmosphere but recycled back into the storage banks. Therefore, the ZBT HRS may have noticeable amount fraction of several compounds which is interesting for a sampling intercomparison. During the consecutive samplings, the HRS parameters were monitored. For each sampling, the SAE J2601 protocol was used, or the operators set the HRS parameters.
Two experimental studies were realised as described below.

2.3. Experimental Strategy

2.3.1. Set-Up 1—State-of-the-Art Sampling

Set-up 1 experiments represent the current sampling methodology used by the different participants. It corresponds to the state of the art of hydrogen fuel sampling. Four sampling devices were compared: EnG, H2 Qualitizer, Hy-SaM and AL (see Table 1) as described in Section 2.1. Samples were taken at the 70 MPa dispenser. The summary of the sampling system and HRS parameters are presented in Table 1.
The parallel sampling devices (NPL, ZBT, Engie) followed a refuelling protocol according to SAE J2601. As a hydrogen sink, a portable 70 MPa 244 L Hexagon type 4 tank was used by Hy-SaM and H2 Qualitizer, and Engie used a 55 L tank of its own sampling device. As the gas parallel sampling relies on SAE J2601 protocol, hydrogen storage bank switching from all given pressure banks (48, 50 and 90 MPa) takes place automatically according to the refuelling protocol. As the initial tank pressure was 10 MPa, the precooling a T20, and fixed assumed ambient temperature 20 °C, it allowed all fillings to have the same average pressure ramp rate (APRR) of 6.6 MPa/min. All dispenser and tank data were logged.
The serial sampling device (Air Liquide) was sampling at constant pressure (20 MPa) and temperature was set to T20. The storage bank (source) was manually selected.
The samples were analysed according to ISO 14687:2019 by NPL.

2.3.2. Set-Up 2—Harmonised HRS Parameter to Enhance Fuel Equivalence

Set-up 2 experiments represent a harmonised sampling setup for HRS with the objective to improve the comparison between sampling systems through providing equivalent hydrogen fuel from the HRS (see Table 2). It presents results with HRS set parameters like used storage bank or refuelling temperature. Four different sampling devices were compared: Hy-SaM and H2 Qualitizer, Air Liquide and external partner as described in Section 2.1. In this experiment, all sampling systems were taking hydrogen fuel from the same storage bank (high-pressure, 90 MPa). Samples were taken at the 70 MPa Dispenser.
The order of sampling was H2 Qualitizer/HySaM cascaded (SAE Table D21: H70-T20 2–4 kg, initial tank pressure 2 MPa, fixed assumed ambient of 20 °C, simultaneous sampling), Air Liquide, external partner, H2 Qualitizer. The parallel sampling devices (NPL, ZBT) followed a refuelling protocol according to SAE J2601, and the serial sampling devices (Air Liquide, SDEP) have been operated at constant pressure (20 MPa). As a hydrogen sink a 70 MPa 77 L Hexagon type 4 tank was used.
Hydrogen was taken exclusively from the two high-pressure banks (90 MPa) and all pre-cooling temperatures were set at T20 so all sample systems sampled the same hydrogen source and used the same pre-cooling temperature.

2.4. Analytical Methods

The analyses were performed by NPL’s Hydrogen Laboratory using NPL internal methods for all contaminants included in ISO 14687:2019 except the particulate. NPL internal methods are ISO 17025 accredited for N2, O2, Ar, CO, CO2, CH4, total sulfur, and H2O. Analyses were calibrated using NPL PRMs in hydrogen matrix gas. NPL gravimetric gas standards (NPL, Teddington, UK) and/or dynamic standards were used to generate calibration curves covering both the EN 17124:2022 and ISO 14687:2022 amount fraction thresholds and the measured values from the samples. The dynamic standards were prepared by dilution of NPL PRM (Teddington, UK) with high-purity hydrogen (BIP+ quality, Air Products, Chertsey, UK) using calibrated mass flow controller systems (Bronkhorst, Veenendaal, The Netherlands). All of the data were examined so that no results were discarded without a valid technical reason. The calibration curve, results of analysis, and associated uncertainties were determined using NPL software XLGENline version 2 [18]. An expanded uncertainty using a k value of 2 was used for all results. In some cases, a more conservative uncertainty was derived from analytical expert knowledge.

3. Results

3.1. Set-Up 1—State of the Art Sampling

The state-of-the-art sampling presents the results expected if each sampling system was used at a commercial HRS under the sampling conditions requested by the sampling system and method associated.
All the samples were measured for all ISO 14687:2019 contaminants except particulates. Measured hydrogen contaminant concentrations are summarised in Table 3. Seven contaminants were found in measurable concentrations, namely N2, Ar, He, O2, H2O, CO2 and non-methane hydrocarbons (NMHC). Other analytes of the contaminants listed in ISO 14687:2019 were below detection limit (CO, CH4, HCOH, HCOOH, NH3, total halogenated, total sulphur). It was found that except for helium the amount fractions of all found contaminants are significantly different between the four sampling devices. The highest scattering between the four sampling devices were found to be nitrogen (between 240 and 408 µmol/mol), oxygen (between <0.3 and 2.03 µmol/mol), water (between 1.82 and 20.2 µmol/mol) and carbon dioxide (between 0.92 and 2.87 µmol/mol). Depending on the sampling system used, the results can be above or below ISO 14687:2019 for nitrogen, water or carbon dioxide, which is a potentially significant issue in terms of hydrogen fuel representativity.
The variation in the sampling device results may be evaluated through several aspects: repeatability of sampling systems, impact of HRS parameters (storage bank, flow and cooling of the hydrogen) in Section 4.

3.2. Set-Up 2—Harmonised HRS Parameter to Enhance Fuel Equivalence

For comparing the sample representativeness in set-up 2, four different sampling devices (AL, Hy-SaM, H2 Qualitizer, SDEP) were used and the samples were analysed according to ISO 14687:2022 by NPL (see Table 4). The sampling of the four devices followed a SAE-J2601 fuelling (except Air Liquide and SDEP, p = const. = 20 MPa with no pressure ramp). As reference one sampling device (EnG) took the first and the last sample of the sampling-row.
Contaminant concentrations in the hydrogen samples taken within set-up 2 are summarised in Table 4. Seven contaminants were found in measurable concentrations, namely N2, Ar, He, O2, H2O, CO2 and non-methane hydrocarbons. Other analytes of the contaminants listed in ISO 14687:2022 were below detection limit (CO, CH4, HCOH, HCOOH, NH3, halogenated compounds, total sulphur).
One sulphur concentration found in one Qualitizer sample (2.2 nmol/mol) was related to the sampling cylinder using DB Gold passivation. The cylinder is suspected to be responsible for the small sulphur appearance in the sampled gas (under investigation with cylinder manufacturer).
It was found that the amount fractions for nitrogen, helium, carbon dioxide and non-methane hydrocarbons are similar between the sampling methods and are coherent with the concentrations measured in the buffer tank before and after the sampling series of the four sampling devices. This demonstrates good equivalence between the different sampling methodologies.
However, there were differences in the measurement data for the analytes argon, oxygen and water. Table 4 shows that sampling with different sampling systems yields varying oxygen concentrations. In three of the samples, the measured values are below the detection limit of 0.2 µmol/mol, whereas two samples exceed this threshold (0.28 µmol/mol with AL and 0.645 µmol/mol with H2 Qualitizer). Furthermore, the oxygen concentration measured in the storage tank before and after the sampling event also shows a notable change. Prior to sampling, the concentration was 0.51 µmol/mol, while after the event it dropped to <0.20 µmol/mol. This suggests a redistribution of oxygen within the storage system. However, based on the available data, it cannot be conclusively determined whether this fluctuation is caused by internal system dynamics or by improper sampling. Additional experiments are required to clarify the cause of the observed variation.
Argon exhibits varying measurement values depending on the sampling system used. In contrast to oxygen and water, however, no change in the argon concentration of the storage tank was observed. Given the current data, a conclusive assessment of the phenomenon is not possible and requires further investigation.
The third analyte that shows inconsistent values across the sampling systems is water. The notably high water concentrations measured by the Qualitizer system (65.6 and 33.7 µmol/mol) was attributed to improper maintenance of the sampling system (insufficient purging after pressure testing using water). These results are therefore not considered further in the explanation of the observed phenomena. The remaining three sampling systems (AL, HySaM, and SDEP) reported values of 5.69 µmol/mol (AL), 5.53 µmol/mol (HySaM), and 8.92 µmol/mol (SDEP). While AL and HySaM yielded consistent results within the measurement uncertainty, the SDEP system reported a water concentration approximately 3.4 µmol/mol higher. An analysis of the storage tank data reveals an increase in water concentration from 24.1 to 33.7 µmol/mol over the course of the sampling event. Taking into account the order of sampling (HySaM then AL then SDEP), the elevated water concentration observed in later samples may be explained by an increase in water content within the system itself (water amount fraction in buffer tank increases). Another explanation may be insufficient purging of the SDEP sampling system leading to residual water and an overestimation of water amount fraction in the sampled cylinder. Thus, the variation in measured water concentrations may have two possible origins: driven by temporal changes in the system’s internal water distribution or insufficient purging of sampling system [12].

4. Discussion

The discussion will focus on the important topics to ensure equivalence between sampling system (reproducibility) and parameters that can affect the sample taken (pressure, storage bank, temperature, flow).

4.1. Parameters with Potential of Influencing the Hydrogen Fuel Quality

This section will focus on the results obtained in Experiment set-up 1 in contrast to the good agreement between sampling systems obtained in Experiment set-up 2. As different parameters from the HRS varied, storage bank, temperature, pressure and flow are investigated.

4.1.1. Storage Bank

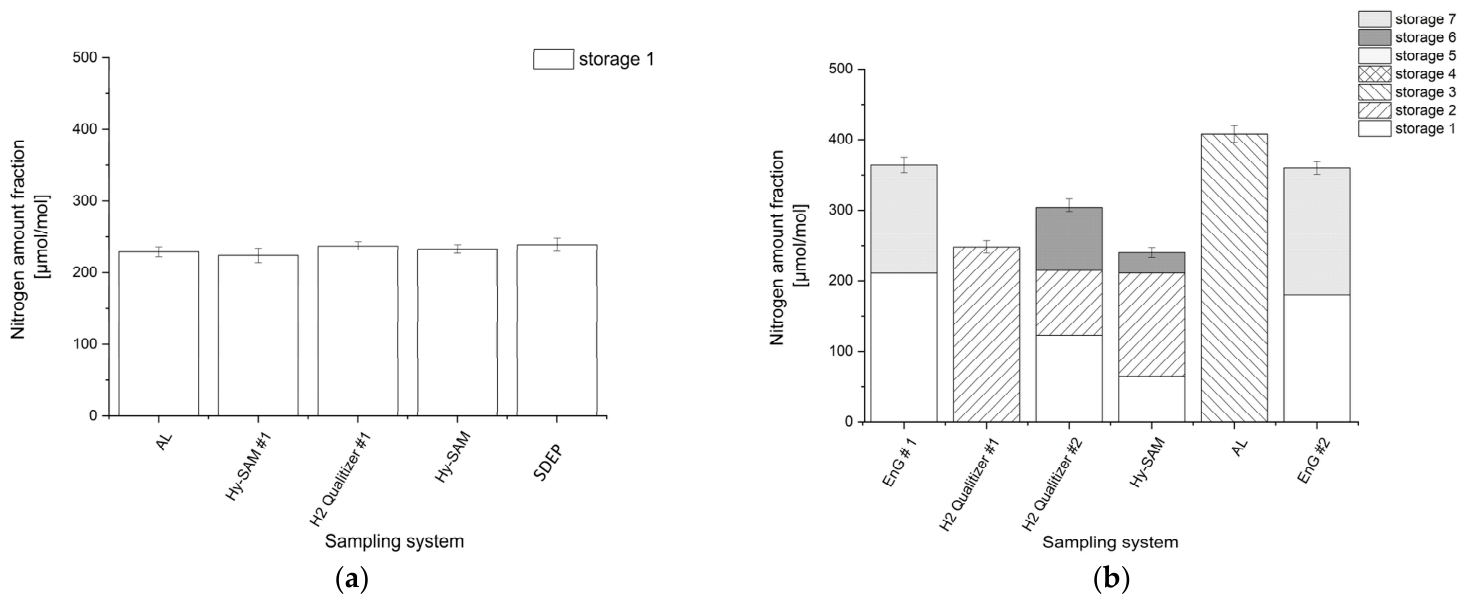
When reviewing the results of set-up 1, it is obvious that significant differences were observed between sampling systems. Deeper investigation in HRS parameters show that the hydrogen taken during a sampling comes from different storage banks in different ratios (see Supplementary Materials Table S1). If the hydrogen fuel compositions were truly homogeneous, sampling from different storage banks would be expected to yield consistent results. The deviations observed in this study therefore imply that significant compositional differences exist between the various storage banks within the HRS (see Figure 3).
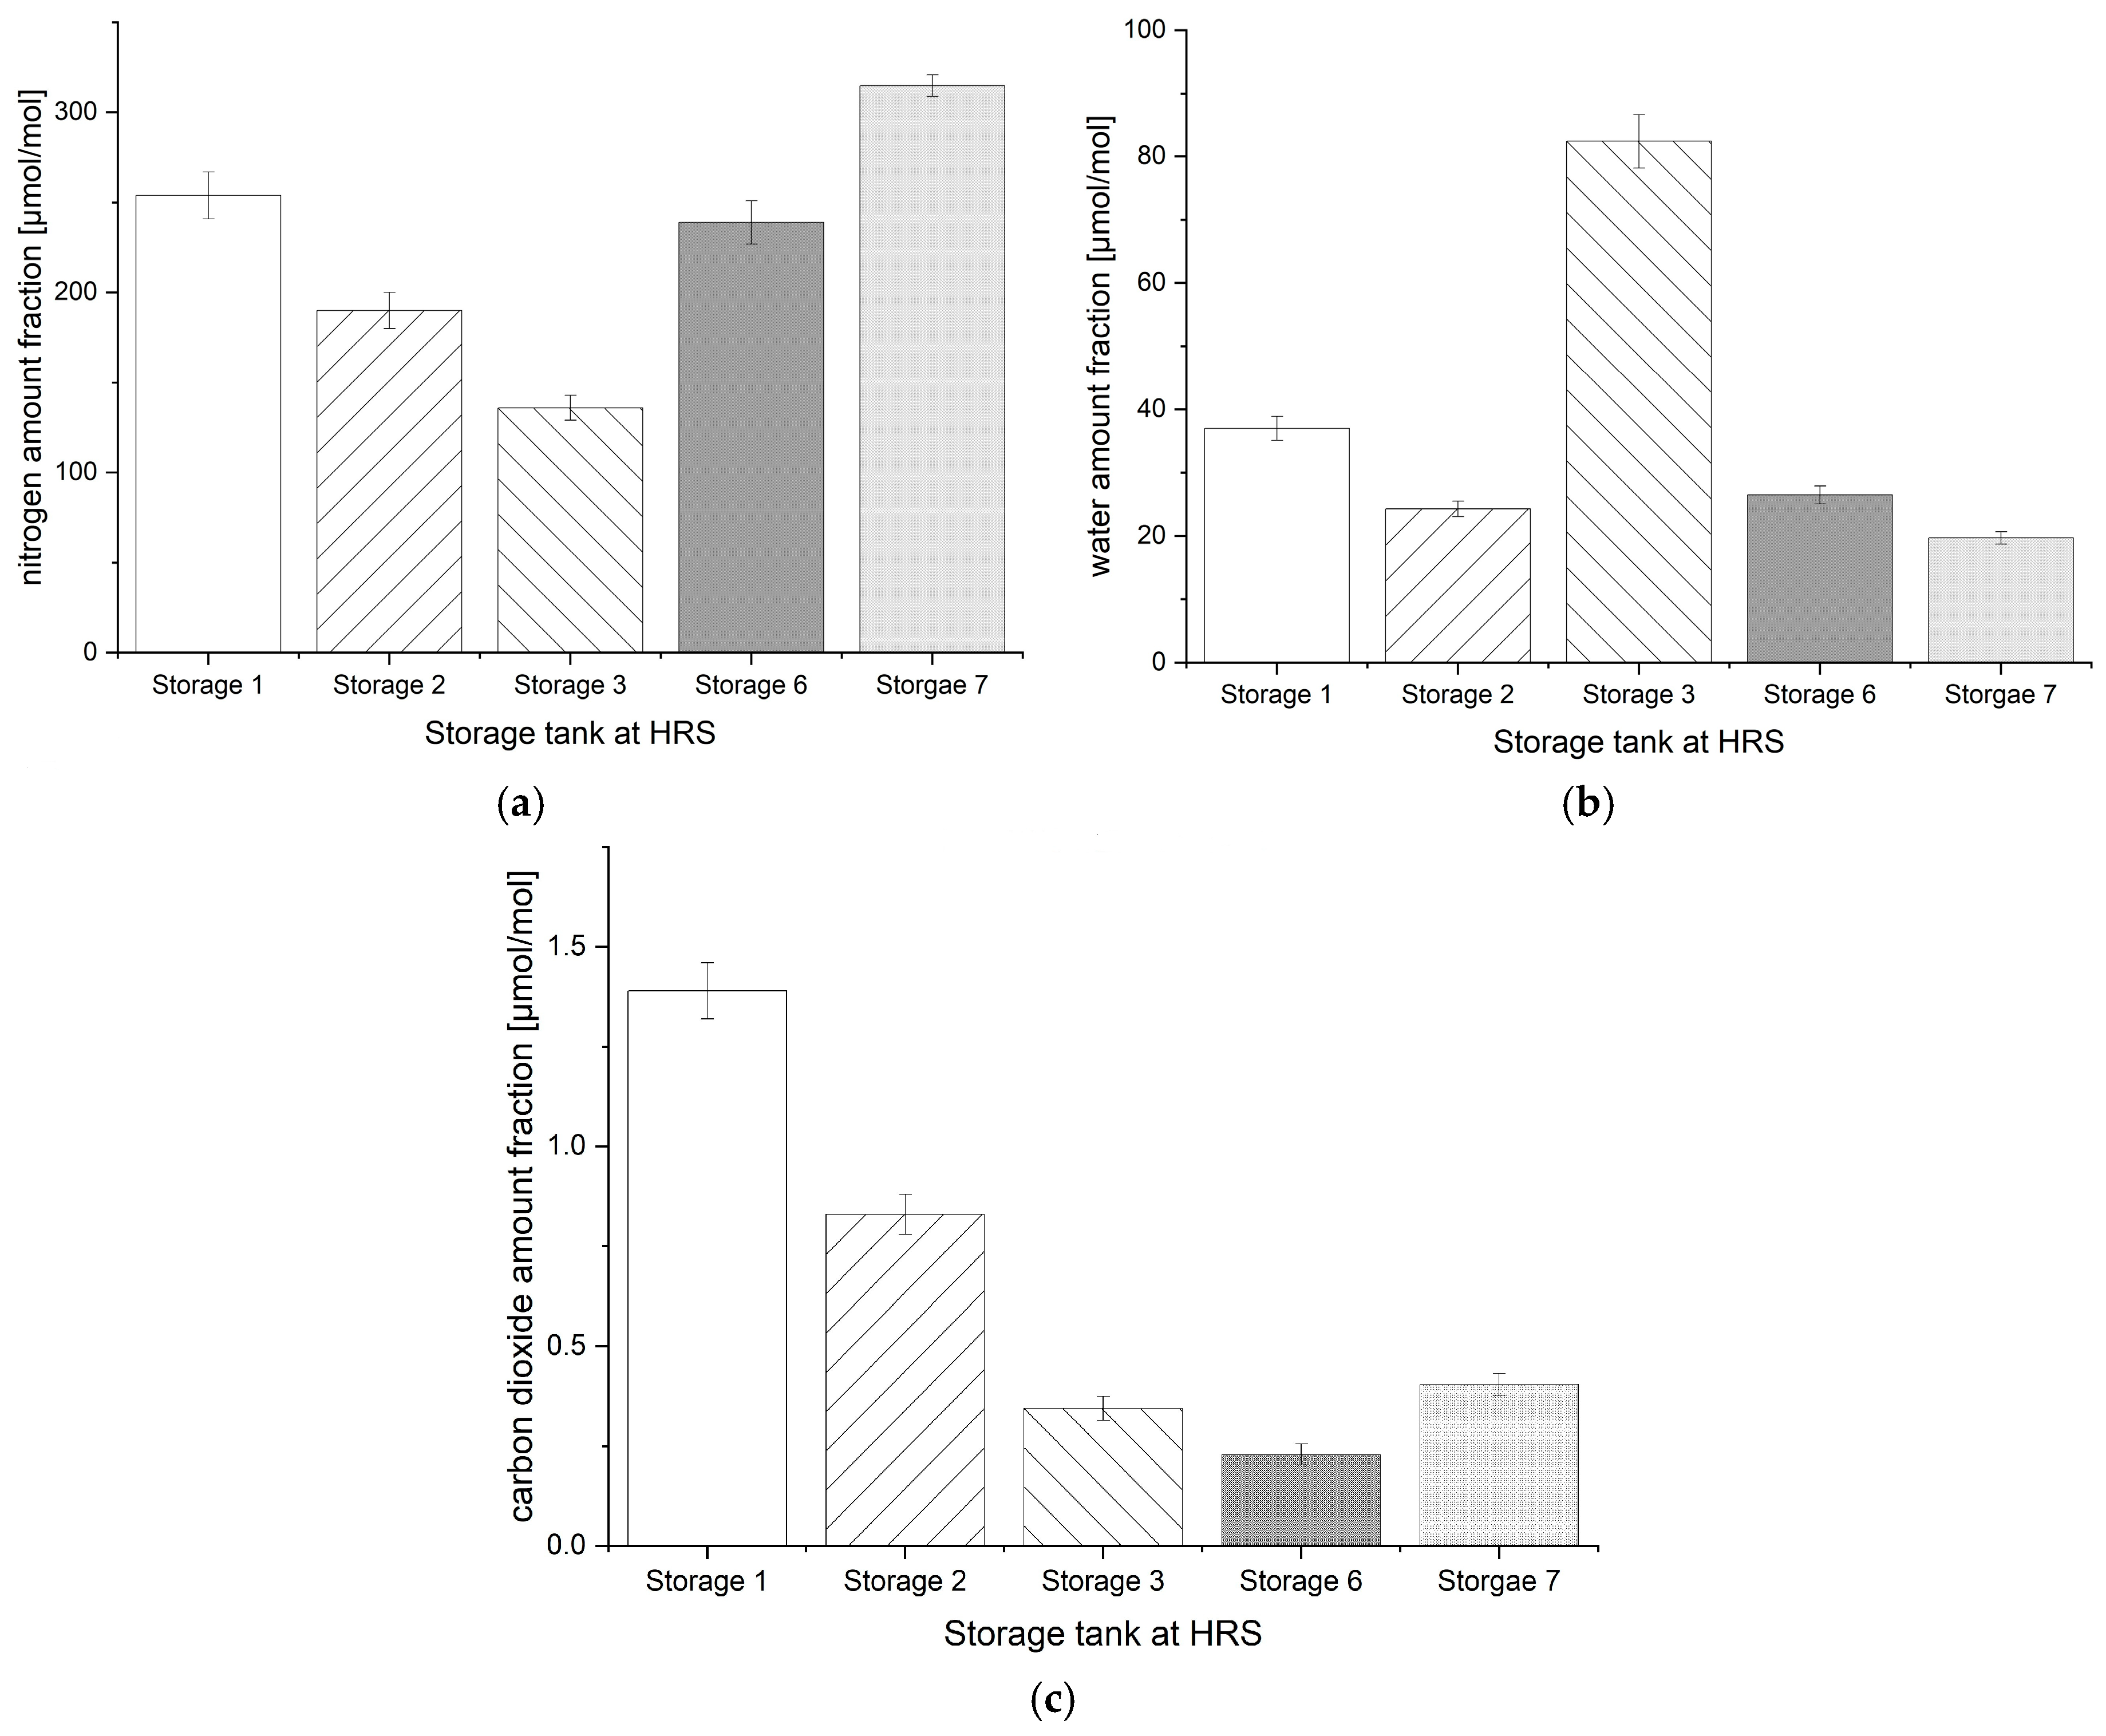
Further analyses of the hydrogen fuel composition were realised as shown in Figure 4 and a clearly inhomogeneous distribution can be seen for nitrogen, water and carbon dioxide. Oxygen showed concentrations below the limit of quantification for all storage banks. Because the storage analyses were not performed at the same time as the set-up 1 exercise, it can only highlight that the dispensed hydrogen fuel composition significantly varies depending on the storage bank.
This result explains the issue observed between the two H2 Qualitizer samplings in set-up 1, which were different due to the filling protocol selecting the most appropriate storage bank. The results evidence that even consecutive sampling does not guarantee the same hydrogen fuel sample origin (e.g., from the same storage banks) especially if the hydrogen fuel quality is not homogenous within the HRS storage.
These findings are congruent with the immanent nature of refuelling protocols. The decision of HRS controls which pressure bank is used for refuelling is, e.g., dependent on vehicle condition (e.g., tank size, pressure) and pressure conditions in HRS storage banks themselves. Therefore, different samples are taken (since the final hydrogen blend in the sampling cylinders as a sum of hydrogen from different parts of the pressure banks is different). To sample a representative sample by means an identical sample it must be guaranteed the sampling conditions stays the same (the storage bank used is set by an HRS operator). Set-up 2 showed the actual successful realisation of such reproducible samplings regarding fixing the storage bank (see Figure 3).

4.1.2. Mass Flow

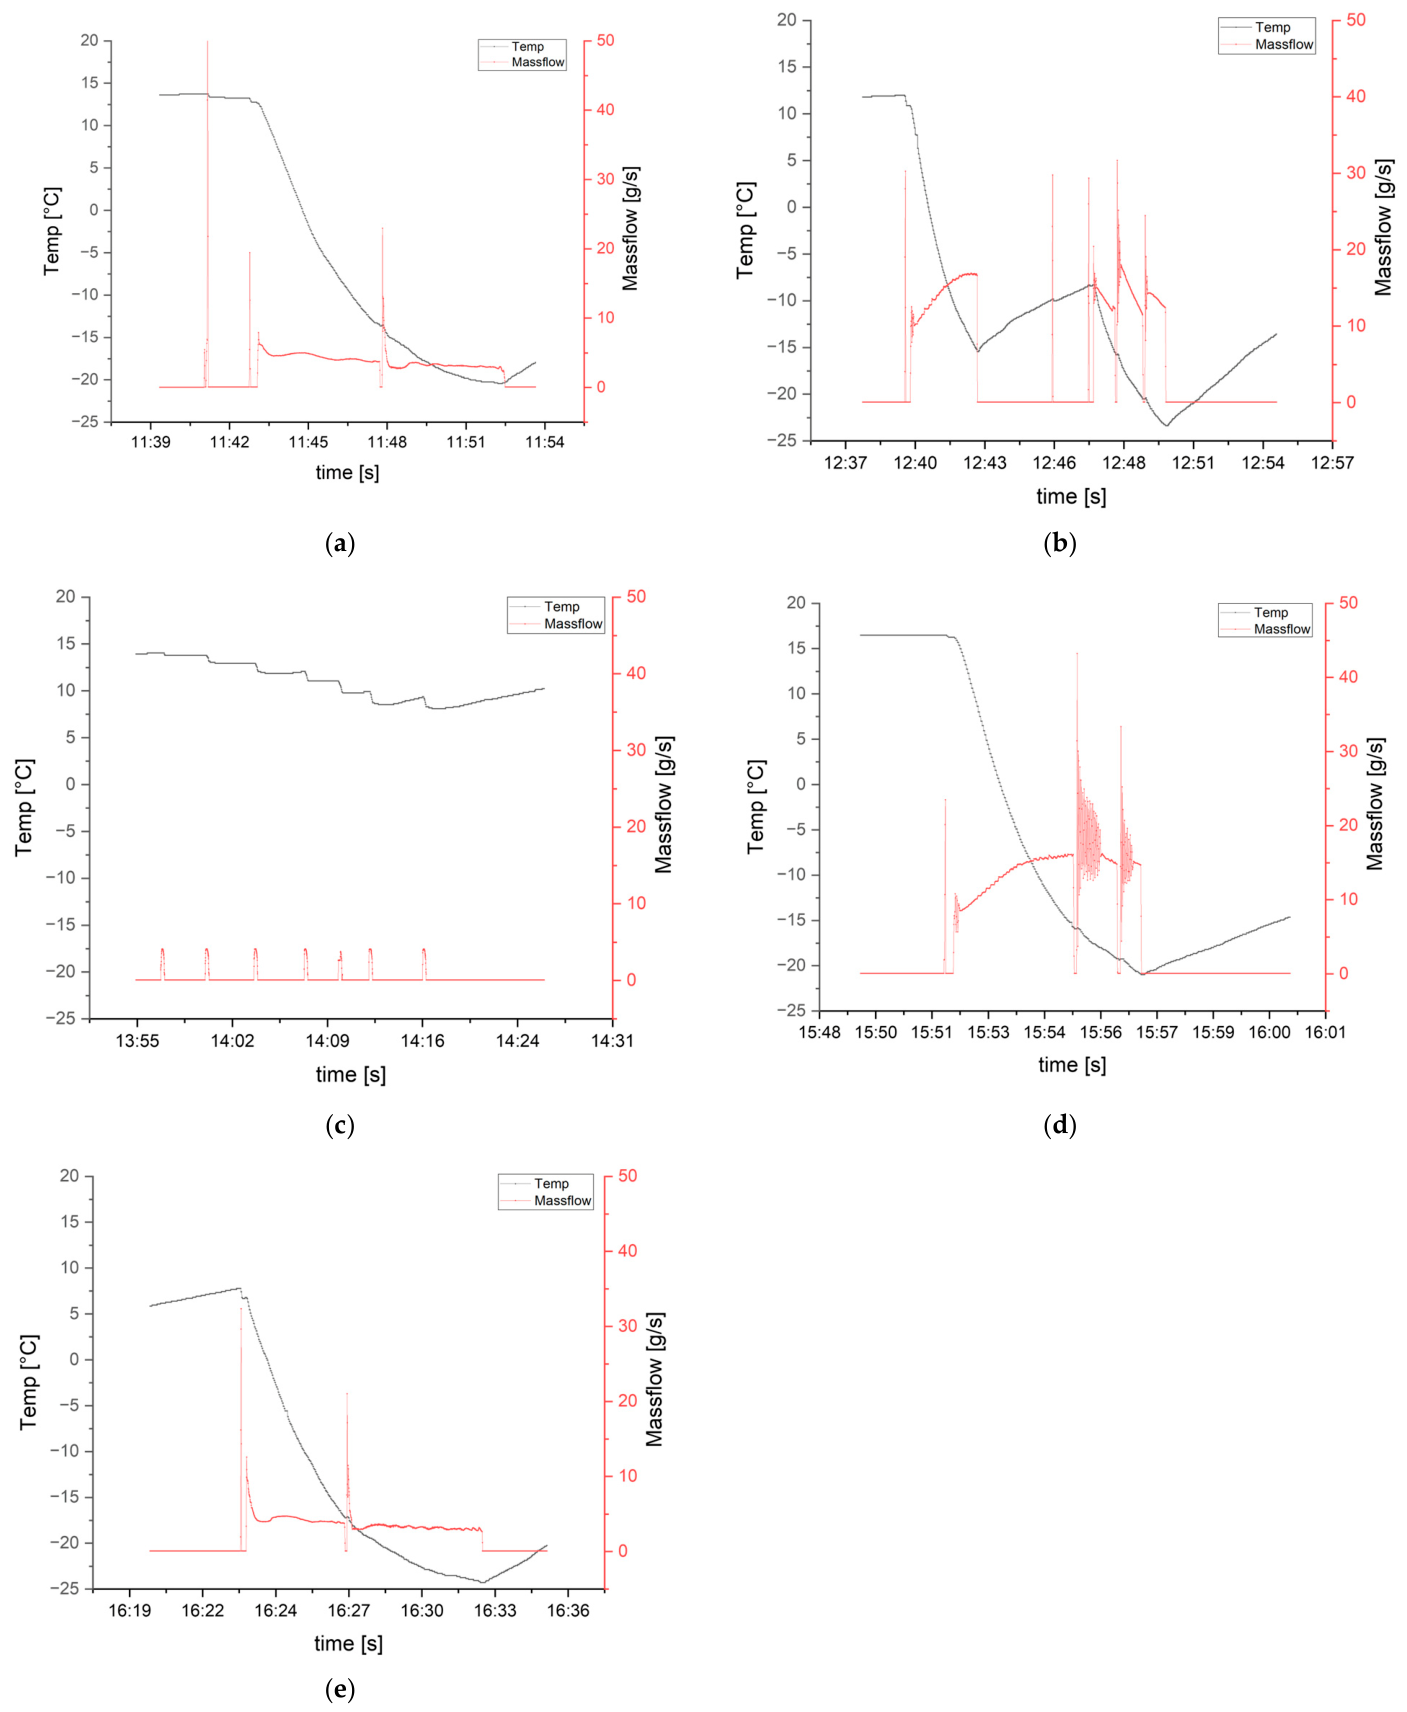
In set-up 1, the mass flows diverged significantly between sampling systems with the parallel sampling H2 Qualitizer and Hy-SaM using FCEV (or 244 L tank in this study) being around 14–16 g/s while the parallel system EnG using a small tank (55 L tank) being around 3.9–4.0 g/s (see Figure 5). So even if sampling with H2 Qualitizer, Hy-SaM and EnG are SAE conform, the filling flows are significantly different. The SAE protocol regulates the pressure ramp during the sampling/refuelling process. Besides the pressure in the sink, differences in sink volume and pressure losses within the sampling systems can influence the resulting mass flow rates. In particular, smaller sink volumes may lead to a more rapid pressure increase during filling, which can reduce the pressure differential and, consequently, the mass flow rate. More generally, mass flow rates in hydrogen refuelling systems are governed by pressure differences and system-specific flow resistances, as described in previous thermodynamic and process models [19].
Since Engie used a sink of 55 L and the other partners a 244 L tank, the flow rate during sampling was lower than H2 Qualitizer and HySam. Since H2 Qualitizer and HySam used the same tank and are with respect to their pressure losses comparable, the mass flows are equivalent. Air Liquide did not sample SAE conform so mass flows were set by the given usage of the sampling device. However, no evidence showed an impact of the flow on the composition. The mass flow was not considered as a key parameter to enhance reproducibility; further experiments may be required in repeatability conditions with only one sampling system to confirm mass flow’s impact on sampling.

4.1.3. Temperature of the Hydrogen Delivered

To achieve fast refuelling for light duty vehicles, the hydrogen needs to be cooled down up to −40 °C. Refuelling stations and protocol vary in terms of temperature setting based on the speed of refuelling expected. In similar manner, the sampling system may see variation on hydrogen fuel temperature (e.g., SAE protocol use, direct sampling in manual mode). The temperature of the hydrogen gas sampled may be another source of variation especially for compounds sensitive to temperature as water.
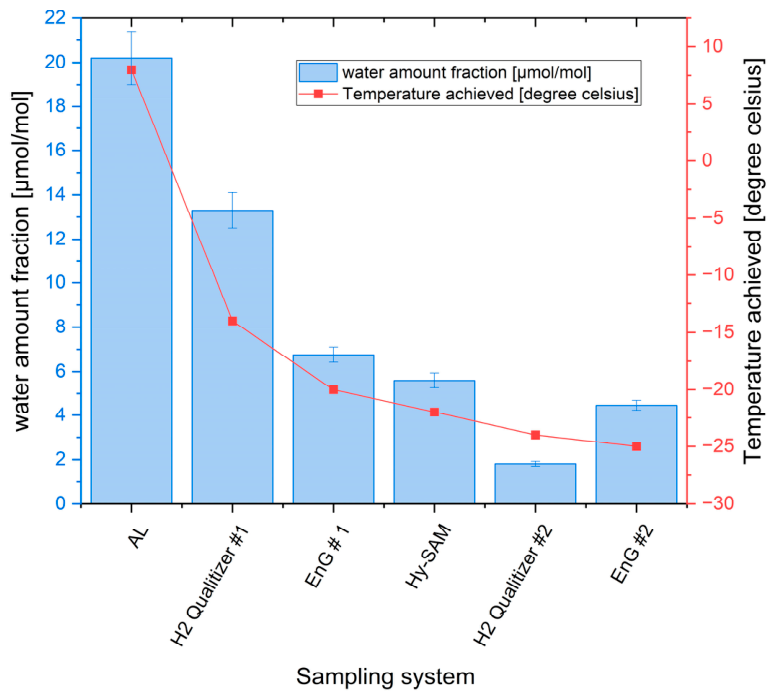
In set-up 1, all samples were taken at −20 °C; however, the water amount fraction results vary significantly between the different sampling systems. Therefore, the monitoring of hydrogen fuel temperature achieved during each refuelling was used as an element to compare. As shown in Figure 6, the sampling systems achieving the lowest gas temperature showed significantly lower water amount fractions. Therefore, a correlation is observed between the hydrogen fuel temperature and the water amount fraction and potentially the hydrogen fuel composition.
Regarding the temperature profiles, some differences may be observed between the sampling system. The parallel sampling temperature profiles were similar (HySam, H2 Qualitizer, Engie) with temperature decreasing as the sampling progress to temperature close to −20 °C (T20). Temperatures were measured directly before the dispenser. The temperature difference can be explained by given mass flows and flow intervals. H2 Qualitizer and HySaM show the highest mass flows and their sampling procedure is not interrupted by flush-procedures, whereas AL have flush-procedures implemented in their sampling (e.g., sampling of Air Liquide is divided in 8 sub-samplings, see Figure 5 with 7 lines). In between, the sampling device is flushed and no sample is taken. The short periods of sampling are not long enough to reach the cooling temperature of −20 °C (T20). In consequence, the hydrogen warms up between the cooling unit and the dispenser. A pronounced effect is expected for water due to its thermodynamic properties and its strong dependence on temperature, pressure, and the pressure–dew point relationship governing its phase behaviour. This may affect the water content, depending on local temperature and pressure conditions.
In set-up 2, the period between samplings was longer to ensure the hydrogen fuel was at the requested temperature before the sampling, better reproducibility is observed between direct sampling (AL) and parallel sampling (HySAM). The water amount fraction from the samples taken by AL and HySam are equivalent. Ensuring the HRS has reached the requested temperature is critical for such comparative study. Additionally, it may be important to record if a FCEV was refuelling before sampling, especially for the gas serial sampler. The effect of precooling temperature on additional analytes was not examined in detail in this work and could provide a useful basis for future investigations.
To conclude this subsection, the importance of accurately accounting for water is briefly discussed: The condensation of water from the gas phase may lead to the accumulation of water within the system, which can significantly affect plant operation. The obstruction of flow cross-sections in pipelines or the freezing of components may reduce system performance. In addition, ice particles, entrained by high flow velocities, may impair the functionality of components or potentially cause damage.
In high-pressure storage vessels, water accumulation may also occur as a result of seasonally low temperatures, which may promote corrosion of the storage system. Consequently, the water content represents a safety-relevant parameter with a potential impact on overall system reliability.

4.1.4. Impact of Sampling Protocol

The current results highlight that sampling protocol may conduct to different results if the HRS parameters are not reported or set to specific levels. Several important aspects can be raised in terms of sampling representativity: consecutive sampling may present different samples due to the SAE J2601 protocol deciding on storage bank use, homogeneity of the hydrogen fuel in commercial HRSs being unknown (extrapolation from this study may require additional work first), comparison of direct sampling and parallel sampling requiring fixed parameters at the HRS, and hydrogen fuel temperature influencing the composition (i.e., water amount fraction).
Standardisation of hydrogen fuel sampling requires setting HRS parameters to avoid bias results due to sampling system or HRS operations.

4.2. Sampling System Equivalence

4.2.1. Equivalence of Sampling Systems

To evaluate the equivalence between sampling systems, set-up 1 cannot be used as the previous section highlighted all the difference induced by the HRS parameters. Set-up 2 allows us to compare the different sampling systems. For the four systems compared (AL, Hy-SaM, H2-Qualitizer and SDEP), most compounds were similar except argon, oxygen, and water. The comparison excludes the results of water for the H2-Qualitizer and the sulphur measurement for H2-Qualitizer in cascade due to maintenance issues and cylinder contamination respectively.
The results demonstrate an overall good agreement for most compounds in ISO 14687 except argon. For argon, the H2-Qualitizer and SDEP system agrees while AL and HySAM disagree with them. However, the two analyses of the hydrogen fuel in the storage agrees with H2 Qualitizer and SDEP results. That only argon is affected, in contrast to other gaseous contaminants, makes it more challenging to identify its origin. As the threshold for argon is 300 µmol/mol and the results diverge by less of 1 µmol/mol the issues may be considered minor for hydrogen fuel quality and equivalence of sampling system. For oxygen, the H2 Qualitizer shows a value significantly different from the other system which agree quite well with each other’s. Two hypotheses for the difference are that either the H2 Qualitizer was the only system which agrees with the hydrogen quality from the storage tank before the experiment, or the H2 Qualitizer may be insufficiently purged. With 8.92 µmol/mol water amount fraction the external sampling device (SDEP) was approximately 3.3 µmol/mol higher than the AL and Hy-SaM sampling devices (5.69 µmol/mol and 5.53 µmol/mol). It should be noted that the water concentration before the sampling event is lower (24.1 µmol/mol) than after the sampling event (33.7 µmol/mol) which may be a reason to explain the difference observed between the AL/Hy-SaM and SDEP system. The other explanation may be insufficient purging of SDEP system.

4.2.2. Repeatability of Sampling System

In the set-up 1, where two sampling systems were sampled twice, the intrinsec sampling system variation showed an unexpected pattern: both EnG samples (#1 and #2) show identical values. One exception is water, which shows 6.76 ± 0.34 µmol/mol (#1) and 4.45 ± 0.23 µmol/mol (#2). For the repetitive sampling realised with the H2 Qualitizer, the results (#1 and #2) showed significant variation for nitrogen, oxygen, water, carbon dioxide and non-methane hydrocarbons due to the use of different storage banks. Therefore, the repetitive sampling cannot be used to assess the repeatability of the sampling systems. However, it provides an important information that repetitive sampling can only be realised through managing accurately the HRS parameters. The selection of the storage bank and flow was managed by the protocol, and the starting temperature was identical (T20).

4.2.3. Representative and Reproducible Sampling

Another important aspect concerns the fundamental question of what constitutes a representative sample, particularly given the potential discrepancies between hydrogen fuel quality in the HRS storage banks and at the dispenser nozzle. Variations in storage bank usage and the specifics of the filling protocol can lead to differing gas compositions during individual FCEV refuelling events at the same HRS. In practice, sampling only captures the composition of the gas at the moment it is taken and cannot provide information about the full range of possible compositions that might occur during other refuelling operations at the station.
An example of variations between the results obtained from nozzle and storage banks is provided in set-up 2. While most compounds agree between nozzle sampling and storage bank, few compounds significantly vary as nitrogen, water and carbon dioxide. Water amount fractions found in the high-pressure buffer tank before and after sampling are noteworthy and crucial for understanding the behaviour of water in a HRS. It was found that the water amount fraction is significantly higher than the found water amount fractions in the samples (24.1 µmol/mol and 33.7 µmol/mol in buffer tank and 5.69 µmol/mol, 5.53 µmol/mol and 8.92 µmol/mol in samples). A possible explanation may be that the heat exchanger removes a fraction of the water at low temperatures, thereby leading to a partial ‘purification’ of the hydrogen stream. However, this hypothesis would require dedicated experimental and/or modelling studies to verify the underlying mechanism.
Furthermore, variation between HRS supply chain elements require better understanding to support better representativity of the analysis. This may have implications for the interpretation of measured water concentrations at different sampling locations within the system.

5. Conclusions

This study presents the first systematic comparison of five different hydrogen sampling systems under two distinct experimental setups. The results demonstrate that the representativeness of hydrogen fuel samples is determined not only by the sampling strategy (gas parallel or gas serial) but also by the operating conditions of the hydrogen refuelling station (HRS).
Under harmonised HRS conditions—such as fixed storage bank selection and coherent hydrogen temperature—all sampling systems produced consistent and largely equivalent results. In contrast, differences between the systems could be observed when SAE-guided fuelling protocols were applied. These discrepancies appear to be influenced by heterogeneous contaminant distributions within the storage banks, variations in hydrogen composition caused by protocol-driven bank switching, and temperature-dependent effects, particularly for water. For all contaminants except water, heterogeneity in the storage system appears to be a dominant influence under the tested conditions. Importantly, even two consecutive samples taken with the same device may yield divergent results if the HRS draws on different storage banks.
These findings raise the question of what constitutes a representative hydrogen sample at a hydrogen refuelling station (HRS). At commercial stations, samples for conformity testing are taken at the nozzle, as the purity of hydrogen must be ensured at the point of transfer. If the distribution of contaminants at such stations exhibits a heterogeneous pattern similar to that observed in the present study, the sample collected at the nozzle may not accurately reflect the hydrogen composition within the storage vessels, as gas composition can vary between storage banks. Consequently, hydrogen quality assessments may be influenced by chance, such as the relative contributions of individual storage banks during sampling. Addressing this issue will require further systematic investigation, particularly since the present study was conducted at a test refuelling station, and the extent to which these findings are transferable to commercial stations remains to be clarified. Key aspects that warrant dedicated study include the variability of hydrogen composition between storage banks and its potential observability at commercial HRS, the influence of temperature on fuel composition (especially regarding water and other compounds such as carbon dioxide), and the development of representative sampling strategies to support the harmonisation of hydrogen quality assessment.
Overall, the study highlights that ensuring representative and reproducible hydrogen sampling requires not only careful device operation but also precise documentation and, where possible, control of HRS parameters. The insights gained provide useful input for ongoing standardisation efforts, such as ISO 19880-9, particularly with regard to the definition of representative sampling conditions. In particular, the observed variability suggests that sampling at the nozzle may not always reflect the composition within storage systems, especially under dynamic operating conditions. This indicates that future standardisation efforts may need to more explicitly consider the influence of storage configuration, operational parameters (e.g., bank switching), and thermal effects on sample representativeness. Furthermore, the results point to the potential need for more clearly defined sampling protocols, including considerations of sampling duration, system stabilisation, and, where appropriate, repeated measurements to account for temporal variability. The insights gained provide useful input for ongoing standardization efforts will be further developed in the European project MetHyTrucks, thereby contributing to the establishment of robust and internationally harmonised hydrogen fuel quality monitoring.

Supplementary Materials

The following supporting information can be downloaded at https://www.mdpi.com/article/10.3390/cleantechnol8030091/s1, Table S1: Used storage banks for sampling comparison in set-up 1; Table S2: Measurement of nitrogen, carbon dioxide, water and oxygen from the five storage banks used. Samplings were performed with the HySam sampling device.

Author Contributions

M.D.: Writing—original draft, Writing—review & editing, Visualisation, Supervision, Methodology, Investigation, Conceptualization. T.B.: Writing—original draft, Visualisation, Methodology, Investigation, Conceptualization. A.M.: Investigation. S.K.: Investigation. E.B.: Investigation, Writing—review & editing. M.R.: Investigation. M.C.: Writing—review & editing. C.B.: Investigation. N.C.: Investigation A.K.: Writing—review & editing. P.M.: Investigation. Z.C.: Investigation. C.S.: Writing—review & editing, Funding. H.H.: Writing—review & editing, Supervision. All authors have read and agreed to the published version of the manuscript.

Funding

The joint Research Project “Metrology for hydrogen vehicles 2” (Grant agreement No: 19ENG04) is supported by the European Metrology Programme for Innovation and Research. The EMPIR initiative is co-funded by the European’s Horizon 2020 research and innovation programme and the EMPIR Participation States.

Institutional Review Board Statement

Not applicable.

Informed Consent Statement

Not applicable.

Data Availability Statement

The raw data supporting the conclusions of this article will be made available by the authors on request.

Acknowledgments

During the preparation of this manuscript, the authors used ChatGPT (GPT-5-Modell) for the purpose of linguistic revision, including grammar correction and improvement of readability in selected sections. The AI tool was not used to generate scientific ideas, data, or interpretations. All final content was reviewed and approved by the authors.

Conflicts of Interest

Matz Dietrich, Alexander Kvasnicka, Christian Spitta and Harry Hoster work for The Hydrogen and Fuel Cell Center (ZBT GmbH). Etienne Basset and Mathilde Rizand work for ENGIE LAB CRIGEN. Martine Carré, Claire Blondeel and Nathalie Chramosta work for Air Liquide. Other authors declare no conflicts of interest.

References

  1. ISO 14687; Hydrogen Fuel Quality Product Specification. International Organization for Standardization: Geneva, Switzerland, 2025.
  2. EN 17124:2022; Hydrogen Fuel. Product Specification and Quality Assurance. Proton Exchange Membrane (PEM) Fuel Cell Applications for Road Vehicles. European Committee on Standardisation: Bruxelles, Belgium, 2018.
  3. SAE J2719:202003; Hydrogen Fuel Quality for Fuel Cell Vehicles. SAE International: Warrendale, PA, USA, 2020.
  4. ASTM D7606-17; Standard Practice for Sampling of High Pressure Hydrogen and Related Fuel Cell Feed Gases. ASTM In-Ternational: West Conshohocken, PA, USA, 2017. Available online: www.astm.org (accessed on 24 March 2026).
  5. ISO 19880-9; Gaseous Hydrogen—Fuelling Stations—Part 9: Sampling for Fuel Quality Analysis. International Organization for Standardization: Geneva, Switzerland, 2024.
  6. H2 Quality—Retail Stations. Available online: https://www.nlr.gov/hydrogen/infrastructure-cdps-retail (accessed on 24 March 2026).
  7. Aarhaug, T.A.; Bacquart, T.; Daniels, C.; Adkins, A.; Wong, Y.; Chen, Z.; Madise, H.; Khaki, S.; Morris, A.S.O.; Clough, P.T.; et al. Hydrogen Fuel Sampling Intercomparisons: Challenges in Real-Life Experiments. Int. J. Hydrogen Energy 2025, 153, 150243. [Google Scholar] [CrossRef] [Scilit]
  8. Aarhaug, T.A.; Kjos, O.S.; Ferber, A.; Hsu, J.P.; Bacquart, T. Mapping of Hydrogen Fuel Quality in Europe. Front. Energy Res. 2020, 8, 585334. [Google Scholar] [CrossRef] [Scilit]
  9. Aarhaug, T.A. Deliverable 3.1 Hydrogen Sampling Unit Tested and Certified. HyCoRA—Hydrogen Contaminant Risk Assessment Grant Agreement No: 621223. Available online: http://hycora.eu/deliverables/D%203.1%20Hydrogen%20sampling%20unit%20tested%20and%20certified.pdf (accessed on 24 March 2026).
  10. Arrhenius, K.; Aarhaug, T.; Bacquart, T.; Morris, A.; Bartlett, S.; Wagner, L.; Blondeel, C.; Gozlan, B.; Lescornez, Y.; Chramosta, N.; et al. Strategies for the Sampling of Hydrogen at Refuelling Stations for Purity Assessment. Int. J. Hydrogen Energy 2021, 46, 34839–34853. [Google Scholar] [CrossRef] [Scilit]
  11. Aarhaug, T.A.; Kjos, O.; Bacquart, T.; Valter, V.; Optenhostert, T. Assessment of Hydrogen Quality Dispensed for Hydrogen Refuelling Stations in Europe. Int. J. Hydrogen Energy 2021, 46, 29501–29511. [Google Scholar] [CrossRef] [Scilit]
  12. Bacquart, T.; Moore, N.; Hart, N.; Morris, A.; Aarhaug, T.A.; Kjos, O.; Aupretre, F.; Colas, T.; Haloua, F.; Gozlan, B.; et al. Hydrogen Quality Sampling at the Hydrogen Refuelling Station—Lessons Learnt on Sampling at the Production and at the Nozzle. Int. J. Hydrogen Energy 2020, 45, 5565–5576. [Google Scholar] [CrossRef] [Scilit]
  13. Enakonda, L.R.; Bacquart, T.; Khaki, S.; Zhang, F.; Kerr, H.; Longhurst, B.; Morris, A.S.O. New Heavy-Duty Sampling System for Hydrogen Refuelling Stations—Comparison of Impact of Light-Duty Versus Heavy-Duty Sampling Techniques on Hydrogen Fuel Quality. Hydrogen 2025, 6, 35. [Google Scholar] [CrossRef] [Scilit]
  14. Mathison, S.; Harty, R.; Cohen, J.; Gupta, N.; Soto, H. Application of MC Method-Based H2 Fueling. In Proceedings of the SAE 2012 World Congress & Exhibition, Detroit, MI, USA, 24 April 2012. [Google Scholar] [CrossRef] [Scilit]
  15. SAE J2601; Fueling Protocols for Light Duty Gaseous Hydrogen Surface Vehicles. SAE International: Warrendale, PA, USA, 2010.
  16. Hart, N.; Sinding, C.D.; Mathison, S.; Quong, S.; Mattelaer, V.; Ruiz, A.; Grab, A.; Kvasnicka, A.; Spitta, C.; Ammouri, F.; et al. Deliverable D6.7—PRHYDE Results as Input for Standardisation. Grant Agreement ID: 874997. Available online: https://lbst.de/wp-content/uploads/2023/04/PRHYDE_Deliverable-D6-7_Results_as_Input_for_Standardisation_V1-2_final_Apr_2023.pdf (accessed on 24 May 2026).
  17. Taichi, K.; Onorato, S. MC Formula Protocol for H35HF Fueling: Cooperative Research and Development Final Report, CRADA Number CRD-20-17412; National Renewable Energy Laboratory: Golden, CO, USA, 2025; NREL/TP-5700-95350. Available online: https://www.hydrogen.energy.gov/docs/hydrogenprogramlibraries/pdfs/review24/scs030_kuroki_2024_p.pdf?sfvrsn=e8f01348_3 (accessed on 24 May 2026).
  18. Smith, I.M.; Onakunle, F.O. SSfM-3 1.6.1—XLGENLINE; Software for Generalised Least-Squares Fitting, Developed by the (NPL), Teddington, UK, NPL Document Reference: CMSC/M/06/657; National Physical Laboratory: Teddington, UK, 2007. [Google Scholar]
  19. Hu, H.; Di, J.; Lang, Z.; Meng, Z.; Shi, X.; Du, D.; He, Q. Thermodynamic Modeling and Analysis of Hydrogen Storage Systems in Hydrogen Refueling Stations. Int. J. Hydrogen Energy 2024, 57, 1101–1110. [Google Scholar] [CrossRef] [Scilit]
Figure 1. Sampling devices used during the comparison: NPL (a), Engie (b), ZBT (c), Air Liquide (d).
Cleantechnol 08 00091 g001
Figure 2. Simplified scheme of ZBTs HRS used during the intercomparison.
Cleantechnol 08 00091 g002
Figure 3. Comparison of nitrogen amount fraction from sampling system in Experiment 1 (b) and Experiment 2 (a) in function of the storage bank sampled.
Cleantechnol 08 00091 g003
Figure 4. Result of analyses of hydrogen fuel composition from storage banks of ZBT HRS. (a) Results for nitrogen; (b) Results for water; (c) Results for carbon dioxide. Expanded uncertainty (k = 2).
Cleantechnol 08 00091 g004
Figure 5. Temperature and mass flow variation during the sampling intercomparison realised at ZBT refuelling station ((a) Eng#1, (b) NPL, (c) Air Liquide, (d) ZBT, (e) Eng#2). The grey curve presents the temperature variation, and the red curve presents the flow rate variation. The boxes represent the duration of the different samplings realised.
Cleantechnol 08 00091 g005
Figure 6. Evolution of water amount fraction in function of the hydrogen fuel temperature achieved during the sampling exercise. The results are in function of the sampling system.
Cleantechnol 08 00091 g006
Table 1. Summary of parameters used for set-up 1—state-of-the-art sampling comparison. The type of sampling is presented (serial or parallel), the sampling devices, SAE-conformity and temperature of the hydrogen fuel. n.a.—not applicable.
ParticipantType of SamplingOrder of SamplingSAE J2601 Fuelling Protocol UsedCooling TemperaturePressureSAE-Table According to SAE J2601 2016
EnGparallel1 and 6YesT20RampTable D21—
H70-T20 2–4 kg, non-comm
H2 Qualitizerparallel2 and 3YesT20RampTable D33—
H70-T20 7–10 kg non-comm
ALserial5noT2020 MPan.a.
Hy-SaMparallel4YesT20RampTable D33—
H70-T20 7–10 kg, non-comm
Table 2. Sampling devices used in set-up 2, type of sampling method, and if SAE-conformity is given.
ParticipantType of SamplingOrder of SamplingSAE J2601 Fuelling Protocol UsedCooling TemperaturePressureSAE Table According to SAE J2601 2016Additional Comment
HySAMParallel1YesT20RampTable D21—
H70-T20 2–4 kg, non-comm
in series with Qualitizer
H2 QualitizerParallel1YesT20RampTable D21—
H70-T20 2–4 kg, non-comm
in series with HySam
ALserial2noT2020 MPaNo SAE
SDEPserial3noT2020 MPaNo SAE
H2 Qualitizerparallel4YesT20RampTable D21—
H70-T20 2–4 kg, non-comm
Table 3. Measured contaminant concentrations from samples taken by the four sampling devices (EnG, ZBT, NPL, AL) in set-up 1. As reference one sampling device (EnG) took the first and the last sample of the sampling-row. NMHC 1 are reported on methane basis, total sulphur compounds 2 are reported on sulphur basis.
ComponentISO 14687:2022
Grade D [µmol/mol]
Measured Amount Fraction/[µmol/mol]
EnG
(#1)
H2 Qualitizer
(#1)
H2 Qualitizer
(#2)
Hy-SAMALEnG
(#2)
Nitrogen300364 ± 11248 ± 9307 ± 9240 ± 7408 ± 12360 ± 9
Argon3000.84 ± 0.050.68 ± 0.050.76 ± 0.050.64 ± 0.050.58 ± 0.050.79 ± 0.05
Helium3005.5 ± 0.95.6 ± 1.15.6 ± 1.15.2 ± 1.34.7 ± 1.35.6 ± 1.1
Oxygen50.69 ± 0.092.03 ± 0.070.39 ± 0.080.31 ± 0.08<0.30.62 ± 0.08
Water56.76 ± 0.3413.3 ± 0.81.82 ± 0.115.60 ± 0.3320.2 ± 1.24.45 ± 0.23
Carbon dioxide22.87 ± 0.281.42 ± 0.141.97 ± 0.191.32 ± 0.130.92 ± 0.092.45 ± 0.24
NMHC 120.071 ± 0.0050.407 ± 0.0170.058 ± 0.0070.056 ± 0.0070.065 ± 0.0080.070 ± 0.008
Methane100<0.005<0.005<0.005<0.005<0.005<0.005
Carbon monoxide0.2<0.015<0.015<0.015<0.015<0.015<0.015
Formic acid0.2<0.020<0.020<0.020<0.020<0.020<0.020
Ammonia0.1<0.015<0.015<0.015<0.015<0.015<0.015
Formaldehyde0.2<0.010<0.010<0.010<0.010<0.010<0.010
Total halogenated compounds0.05<0.018<0.018<0.020<0.018<0.019<0.018
Total sulphur compounds 20.004<0.0008<0.0008<0.0008<0.0008<0.0008<0.0008
Table 4. Measured contaminant concentration in set-up 2 from samples taken by the four sampling devices (AL, ZBT, NPL, External Partner) and of the buffer tank (HRS pressure bank) where the sample was taken from (buffer tank before sampling: BE, buffer tank after sampling: AE). The buffer tank sampling was performed with the HySam sampling device.
ComponentISO 14687:2019 Grade D [µmol/mol]Measured Amount Fraction/[µmol/mol]
ALHySAM ***
(in Cascade with H2 Qualitizer)
H2 Qualitizer ***
(in Cascade with HySaM)
H2 QualitizerSDEPStorage Tank
(BE)
Storage Tank
(AE)
Nitrogen300229 ± 7224 ± 10237 ± 6233 ± 6236 ± 9217 ± 5206 ± 6
Argon3000.30 ± 0.05<0.100.90 ± 0.050.92 ± 0.050.86 ± 0.050.83 ± 0.050.84 ± 0.05
Helium30012.69 ± 0.4812.94 ± 0.4912.44 ± 0.4711.70 ± 0.4513.18 ± 0.5012.94 ± 0.4913.43 ± 0.49
Oxygen50.28 ± 0.05<0.20<0.200.645 ± 0.10<0.200.51 ± 0.05<0.20
Water55.69 ± 0.295.53 ± 0.2865.6 ± 3.3 *33.7 ± 1.7 *8.92 ± 0.4524.1 ± 1.233.7 ± 1.7
Carbon dioxide20.246 ± 0.0240.240 ± 0.0230.244 ± 0.0240.242 ± 0.0230.247 ± 0.0240.167 ± 0.0160.166 ± 0.016
NMHC20.038 ± 0.0090.036 ± 0.0090.038 ± 0.0090.038 ± 0.0090.037 ± 0.0090.038 ± 0.0090.038 ± 0.009
Methane100<0.010<0.010<0.010<0.010<0.010<0.010<0.010
Carbon monoxide0.2<0.020<0.020<0.020<0.020<0.020<0.020<0.020
Formic acid0.2<0.020<0.020<0.020<0.020<0.020<0.020<0.020
Ammonia0.1<0.020<0.020<0.020<0.020<0.020<0.010<0.010
Formaldehyde0.2<0.010<0.010<0.010<0.010<0.010<0.010<0.010
Total halogenated compounds0.05<0.027<0.023<0.028<0.024<0.028--
Total sulphur compounds0.004<0.0007<0.00070.0022 ± 0.0007 **<0.0007<0.0007<0.0007<0.0007
* Sampling device just serviced, no cleaning after water pressure testing before return to NPL, system was filled with water -> contaminants from the sampling system. ** DBGold cylinder used, sulphur released related to cylinder itself. *** Samples were taken in cascade.
Disclaimer/Publisher’s Note: The statements, opinions and data contained in all publications are solely those of the individual author(s) and contributor(s) and not of MDPI and/or the editor(s). MDPI and/or the editor(s) disclaim responsibility for any injury to people or property resulting from any ideas, methods, instructions or products referred to in the content.