Article

An Innovative Industrial Complex for Sustainable Hydrocarbon Production with Near-Zero Emissions

1
Department of Chemical and Biomolecular Engineering, Lamar University, Beaumont, TX 77710, USA
2
Department of Computer Science, Lamar University, Beaumont, TX 77710, USA
*
Author to whom correspondence should be addressed.
Clean Technol. 2025, 7(4), 93; https://doi.org/10.3390/cleantechnol7040093
Submission received: 10 September 2025 / Revised: 15 October 2025 / Accepted: 20 October 2025 / Published: 23 October 2025

Abstract

The Allam power cycle is a groundbreaking elevated-pressure power generation unit that utilizes oxygen and fossil fuels to generate low-cost electricity while capturing carbon dioxide (CO2) inherently. In this project, we utilize the CO2 generated from the Allam cycle as feedstock for a newly envisioned industrial complex dedicated to producing renewable hydrocarbons. The industrial complex (FAAR) comprises four subsystems: (i) a Fischer–Tropsch synthesis plant (FTSP), (ii) an alkaline water electrolysis plant (AWEP), (iii) an Allam power cycle plant (APCP), and (iv) a reverse water-gas shift plant (RWGSP). Through effective material, heat, and power integration, the FAAR complex, utilizing 57.1% renewable energy for its electricity needs, can poly-generate sustainable hydrocarbons (C1–C30), pure hydrogen, and oxygen with near-zero emissions from natural gas and water. Economic analysis indicates strong financial performance of the development, with an internal rate of return (IRR) of 18%, a discounted payback period of 8.7 years, and a profitability index of 2.39. The complex has been validated through rigorous modeling and simulation using Aspen Plus version 14, including sensitivity analysis.

1. Introduction

Global energy consumption is quickly increasing because of population expansion and industrialization, particularly in emerging nations. The fast development puts enormous strain on natural resources and climatic systems. Fossil fuels, which supply most of the world’s energy, are the primary source of greenhouse gas emissions, notably CO2. These emissions lead to global warming and its severe consequences, such as rising sea levels, more frequent extreme weather events, and faster biodiversity loss. With the global population projected to reach 10 billion by 2050, the urgent need to transition to clean energy systems such as solar, wind, and bioenergy has never been more critical to reduce CO2 emissions and mitigate climate change impacts. This transition demands the adoption of innovative technologies that can efficiently and effectively capture and store CO2 as well as repurpose it into valuable resources, so that people can ensure sustainable development in the future.
Figure 1 summarizes global renewable electricity generations in the last two decades, showing a significant upward trend from 2005 through 2024 [1]. Among those, hydropower remains the leading source but has kept a slow increment pace from 2911.71 terawatt-hours (TWh) in 2005 to a projected 4418.96 TWh in 2024. On the other hand, more promising renewable energy sources, including wind and solar, as well as bioenergy and other renewable sources, follow fast growth patterns, climbing, respectively, from 104.38, 3.94, and 261.45 TWh in 2005 to an anticipated 2497.25, 2130.64, and 800.92 TWh in 2024. The trend in the graph underscores the global momentum towards renewable energy generation and the substantial shift towards more sustainable energy practices. Thus, the natural expectation for chemical industry practice becomes how to utilize renewable energy sources to assist critical chemical manufacturing processes, which must employ fossil fuels as feedstock or energy supplies. Such assistance must satisfy several important criteria, such as being economically attractive, technologically effective, and environmentally less polluting or emitting.
Based on the above motivations, we believe that it will be extremely hard for a single chemical plant producing ordinary hydrocarbons to accomplish all the listed expectations. Thus, an industrial complex (or industrial ecosystem) must be employed. The industrial complex should include a hydrocarbon manufacturing subsystem, carbon capture and utilization subsystem, and hydrogen generation subsystem, as well as power generation and renewable energy supply subsystems. Therefore, this paper is motivated to explore such an industrial complex, which can economically generate multiple hydrocarbon products, emission-free. It employs the APCP subsystem to generate energy and pipe-grade CO2 for further usage. The pipe-grade CO2 is then fed to the RWGSP subsystem, where it combines the H2 produced from the AWEP subsystem to form syngas. The syngas is converted to hydrocarbons by the FTSP subsystem. Note that the power supplied by the APCP subsystem can partially sustain the stack units in the AWEP subsystems, while renewable energy sources, such as utility-scale solar photovoltaic (PV), can provide the energy needed for the remaining stack units and balance of plant (BOP) in the RWGSP and AWEP subsystems.
The Allam cycle is a significant improvement in clean power production that uses oxy-fuel combustion and supercritical carbon dioxide as the working fluid. Researchers have studied its thermodynamic architecture to improve both environmental and economic effects in fossil fuel-based power generation. Allam et al. (2014) [2] proposed the oxy-fuel, supercritical CO2 Allam cycle, which has the potential to generate low-cost, emission-free power from fossil fuels. Allam et al. (2017) [3] then described its successful demonstration as a high-efficiency technique with total carbon capture. Fernandes et al. (2019) [4] investigated an Allam cycle plant equipped with an air separation unit, demonstrating its minimal environmental effect and high sustainability potential. Fernandes et al. (2019) [5] studied the system’s stability and flexibility using dynamic simulations. Recent studies expanded the cycle’s applicability. Guo et al. (2024) [6] improved thermal efficiency by studying energy transfer using a multi-stream heat exchanger. Bocandé et al. (2025) [7] improved the thermodynamic performance of a hydrogen-fueled Allam cycle after transitioning away from hydrocarbons. These studies demonstrate the Allam cycle’s evolution from concept to advanced applications, emphasizing its significant potential for industrial decarbonization.
For system integration with Allam cycle, Wang et al. developed the first poly generation based on Allam power cycle to simultaneously produce power and ammonia [8]. Liu et al. in 2023 proposed a new eco-friendly natural gas monetization complex by integrating Allam cycle with ammonia and urea productions [9]. Based on such developments, Liu et al. in 2024 further included liquefied natural gas (LNG) production into the industrial complex for poly generation with enhanced material and heat and power integration, as well as a reduction greenhouse gas emissions [10].
Many studies have contributed to the alkaline water electrolysis to produce hydrogen and oxygen. For instance, Kato et al. in 2005 delved into strategies for maximizing the utilization of oxygen byproducts during the electrolysis process for hydrogen production [11]. The study explored methods to enhance the overall efficiency and sustainability of hydrogen production systems. In 2016, Voldsund et al. discussed hydrogen production with CO2 capture, focusing on the generation of hydrogen from renewable sources [12]. Rothschild et al. introduced a new technique for producing hydrogen through alkaline water electrolysis containing nickel(II) hydroxide (Ni(OH)2) [13]. This patent aimed to enhance the efficiency, cost-effectiveness, and scalability of hydrogen production processes, addressing key challenges in the transition toward clean and sustainable energy sources. In 2020, Sanchez et al. developed an Aspen Plus model for an alkaline electrolysis system for hydrogen production, contributing to the understanding of hydrogen production processes [14]. Recently, Kumar and Lim gave a comprehensive overview of water electrolysis technologies for green hydrogen production [15]. Campbell-Stanway et al. in 2024 investigated the role of byproduct oxygen from green hydrogen electrolysis, highlighting its potential to enhance process efficiency and economics [16]. Yu and Liu (2023) review recent progress in hybrid seawater electrolysis, highlighting innovations in catalyst design and system architecture that enable selective oxygen evolution while suppressing chlorine formation [17]. These advances pave the way for scalable, sustainable hydrogen production using abundant seawater resources.
The reverse water–gas shift (RWGS) reaction and Fischer–Tropsch synthesis (FTS) are pivotal processes in the conversion of CO2 into valuable hydrocarbons and fuels. Ernst et al. (1992) studied the dynamics of the RWGS reaction on copper (110), (Cu(110)), yielding information about the reaction mechanism and rate-determining stages [18]. Their work laid the foundation for understanding copper (Cu)-based catalysts in RWGS. Jadhav et al. in 2015 extended this by studying Platinum supported on alumina (Pt/Al2O3) catalysts, highlighting the role of noble metals in enhancing reaction rates and selectivity [19]. Daza and Kuhn in 2016 provided a comprehensive comparison of various catalysts, emphasizing the importance of catalyst composition and structure in optimizing CO2 conversion [20]. Kirsch et al. in 2020 developed a mathematical model for RWGS integrated with FTS and hydrocracking, demonstrating the feasibility of power-to-fuel systems [21]. In 2021, González-Castaño et al. offered a process systems engineering perspective, emphasizing the need for efficient heat integration and reactor design to improve RWGS performance [22]. Later, Zhang et al. in 2022 introduced molybdenum–phosphorus (Mo–P) multicomponent catalysts, achieving high selectivity and stability, which are crucial for industrial applications [23].
The FTS process converts syngas into hydrocarbons, playing a central role in gas-to-liquid (GTL) technologies and CO2 utilization. Wang et al. (2003) developed kinetic models for FTS over iron–copper–potassium (Fe–Cu–K), providing insights into product distribution and reaction mechanisms [24]. Marion et al. (2006) characterized products from cobalt-catalyzed FTS, offering valuable data for improving product selectivity [25]. Visconti et al. (2007) developed kinetic models for FTS over Co/Al2O3 catalysts, providing insights into product distribution and reaction mechanisms [26]. Swanson et al. (2010) present a significant contribution to the field of biofuel production, with a focus on the thermochemical process of biomass gasification [27]. Their analysis provides an in-depth evaluation of the technical feasibility and economic sustainability of biofuel production pathways derived from biomass gasification. Todic et al. (2016) explored the effect of process conditions on product selectivity over industrial Fe-based catalysts, highlighting the importance of temperature and pressure optimization [28]. Rafiee et al. (2017) integrated post-combustion carbon capture with FTS, showcasing the potential for CO2 utilization in GTL processes [29]. Theampetch et al. (2021) developed a detailed microkinetic model for FTS over cobalt catalysts, offering insights into optimizing catalyst design and process conditions [30]. Davies and Möller (2021) proposed a kinetic model for low-temperature FTS, highlighting its advantages in improving selectivity for liquid hydrocarbons [31]. Gao et al. (2021) explored the integration of RWGS and cobalt-based FTS for green liquid fuel and synthetic natural gas production, demonstrating the feasibility of carbon-neutral fuel production [32]. Ahmed (2021) modeled FTS in Aspen Plus, providing a framework for optimizing liquid fuel production from renewable energy and CO2 [33]. Repasky and Zeller (2021) proposed a novel process for CO2 conversion, highlighting the potential of integrated catalytic systems [34]. Zang et al. (2021) evaluated the effectiveness and costs of producing liquid fuels from CO2 and hydrogen, identifying important cost drivers and areas for improvement [35]. Zang et al. (2022) present a detailed modeling study of synthetic fuel (synfuel) production, evaluating pathways using various feedstocks and renewable hydrogen [36]. The report emphasizes process efficiency, techno-economic feasibility, and life cycle environmental impacts, with modeling supported by the GREET framework. Azhari et al. (2022) reviewed zeolite-based catalysts for direct CO2-to-C2+ hydrocarbon conversion, emphasizing their potential for industrial applications [37]. Singh et al. (2022) critically analyzed technologies for producing carbon-neutral e-fuels, stressing the need for cost reduction and policy support [38]. Modi and Xu (2024) developed a model for integrating green hydrogen with CO2 utilization, demonstrating its potential for sustainable hydrocarbon production [39].
Based on the above literature survey, studies for the integration of individual subsystems such as APCP, RWGSP, FTSP, and AWEP for green manufacturing are still lacking. Thus, a unique conceptual architecture of an industrial complex known as FAAR for value hydrocarbon production has been developed in this paper. It is a poly generation system that uses natural gas and renewable energy to achieve near-zero emissions levels. Through effective material, heat, and power integrations, the FAAR complex can utilize natural gas, water, and renewable energy sources to generate sustainable hydrocarbons including C1–C30 paraffins, pure hydrogen, and oxygen with zero emissions. This complex has been virtually validated via thorough modeling and simulation. Its economic performance with sensitivity analysis has also been conducted to demonstrate its efficacy.

2. Overview of the Developed FAAR Industrial Complex

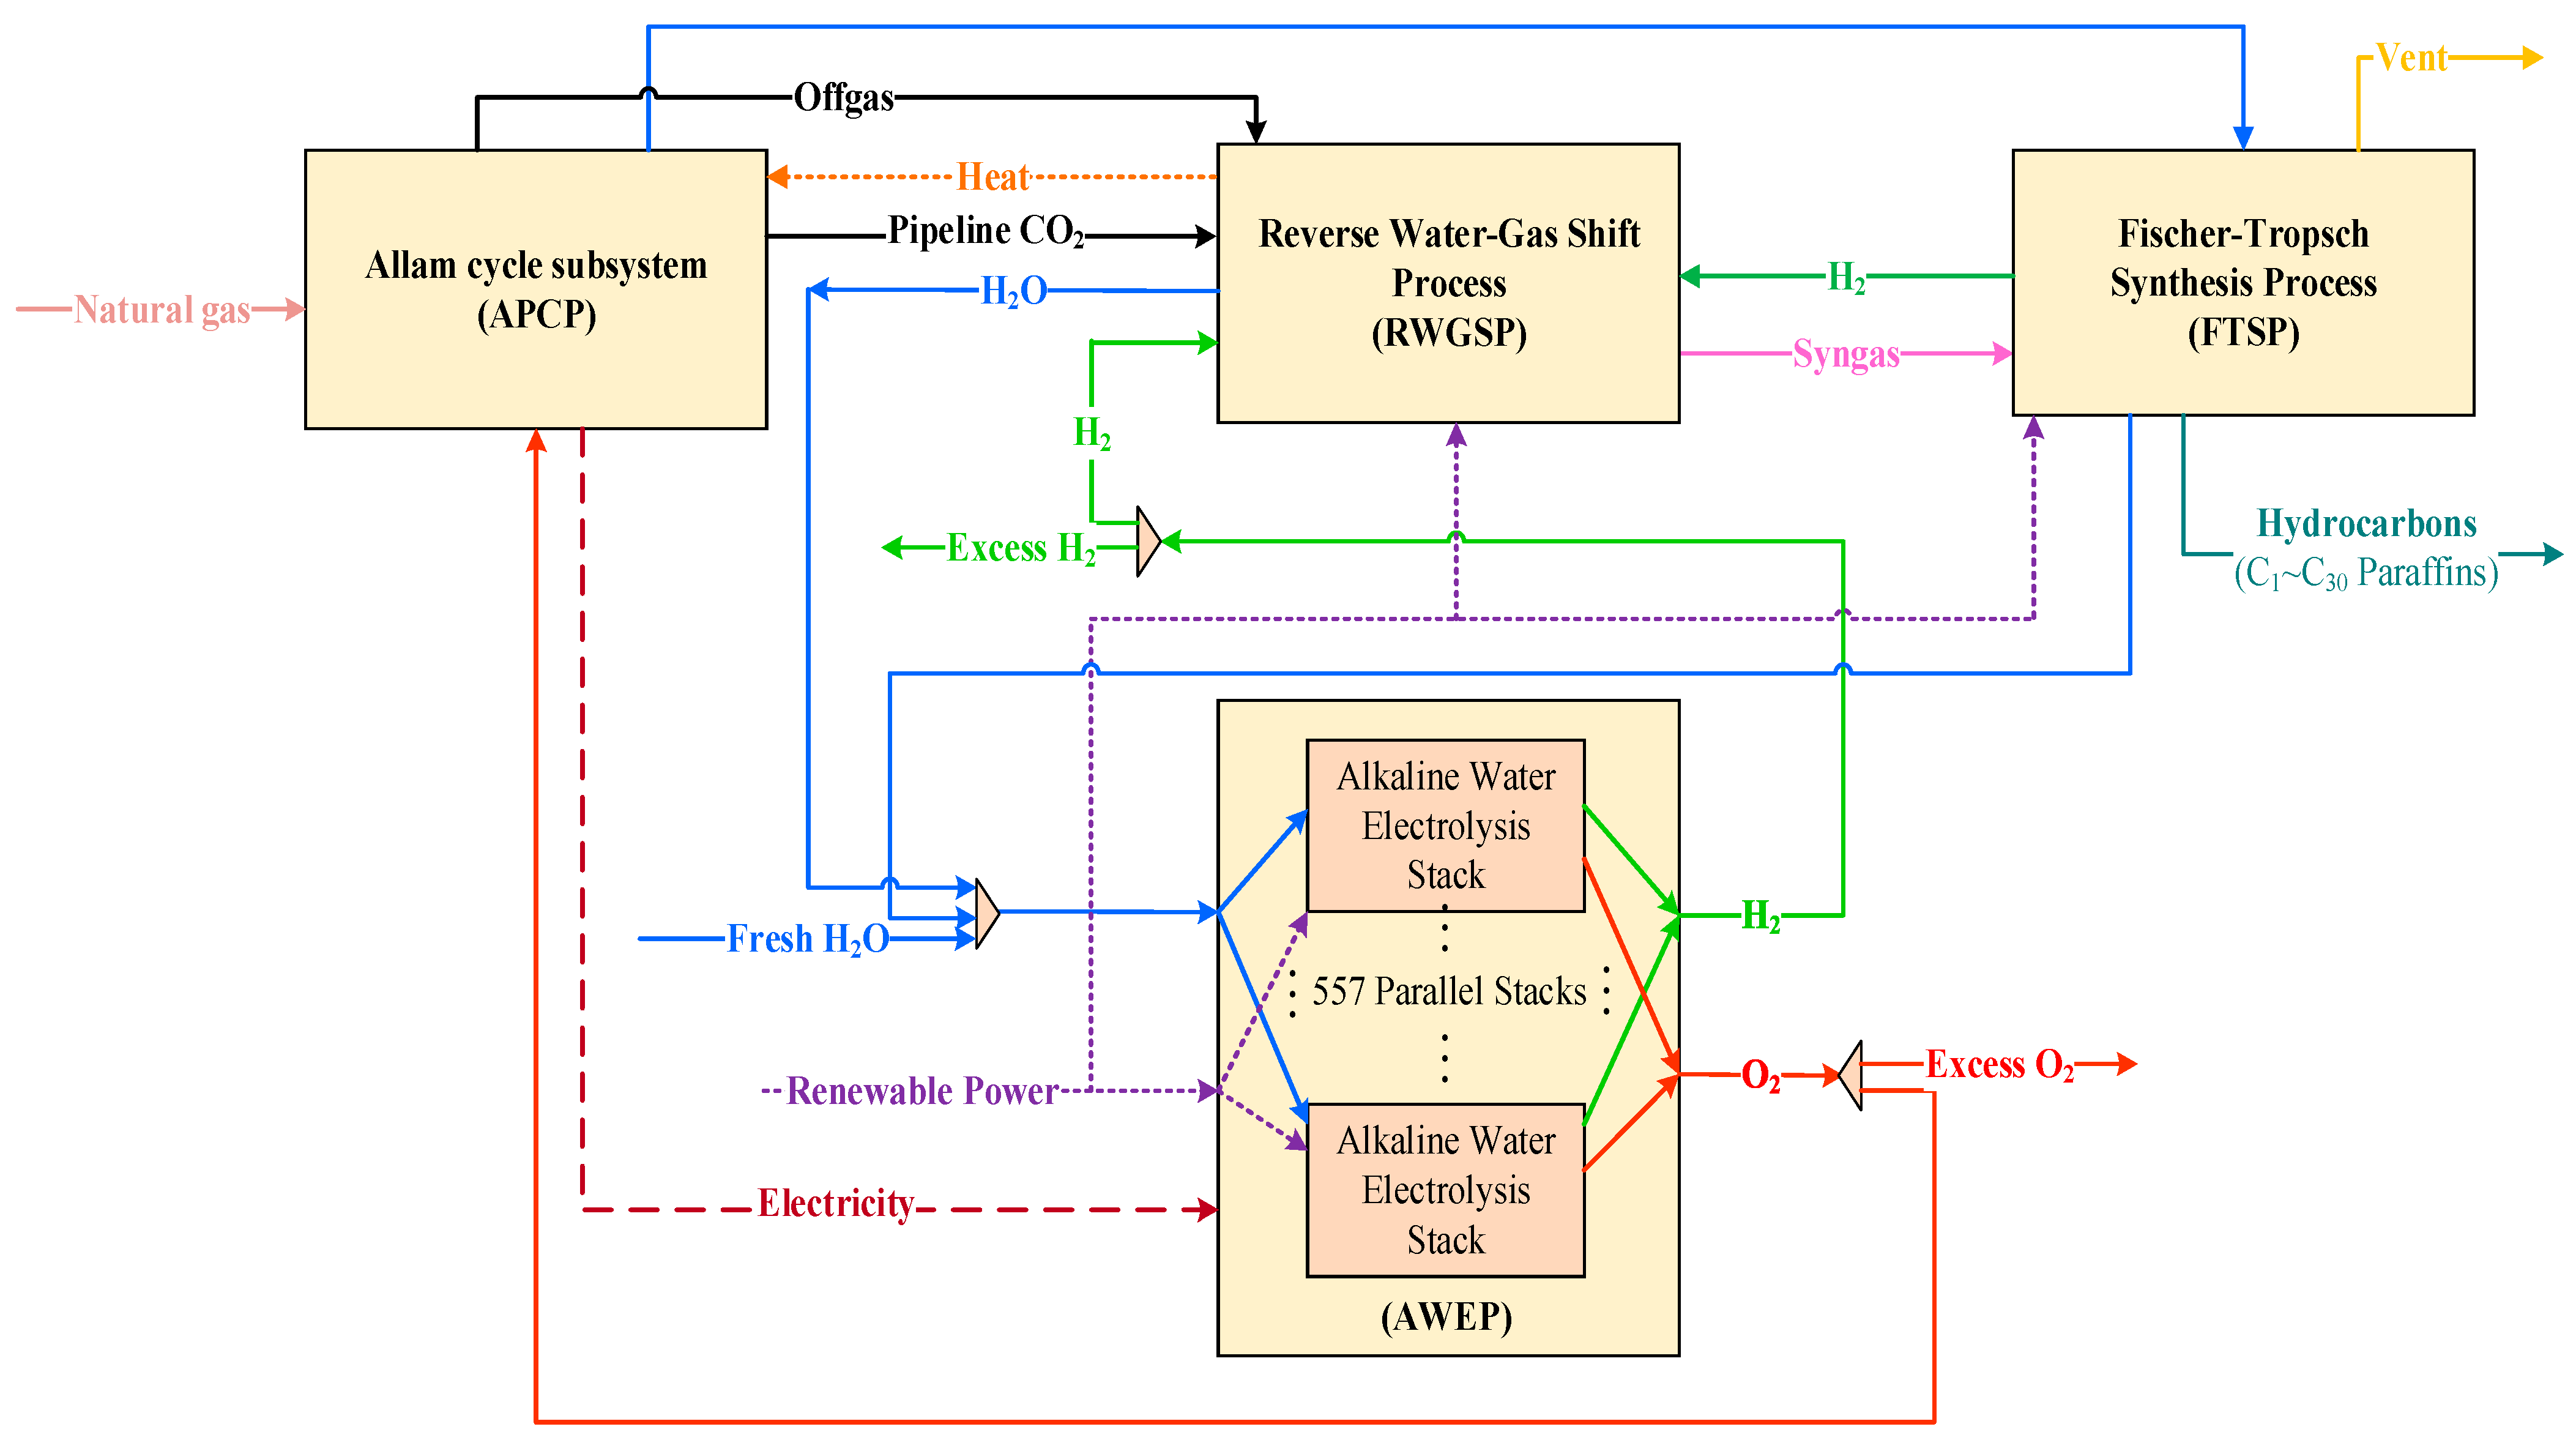
Figure 2 illustrates the block flow diagram of the developed FAAR complex. First, the natural gas feedstock is input to the APCP subsystem with a flowrate of 36,000 kg/h as the fuel gas. Meanwhile, the APCP subsystem consumes 136,880 kg/h of high-purity oxygen supplied by the AWEP subsystem to drive the oxy-combustion process, yielding a total gross power output of 490.89 MW. The generated power is internally integrated to satisfy the operational energy demands of both the APCP and AWEP subsystems. The principal effluent streams discharged from the APCP subsystem comprise (i) a high-purity CO2 stream (97.83 wt% at 100.00 bar), which is forwarded to the RWGSP subsystem for syngas synthesis and (ii) a condensate water stream, which is subsequently routed to the FTSP subsystem for downstream processing and utilization.
In the RWGSP subsystem, the CO2 stream from the APCP subsystem and the off gas containing CO2 along with the H2 stream from the AWES subsystem, together with the excess H2 stream from the FTSP subsystem, are combined in a mole ratio of 3:1 to generate syngas. The generated syngas and byproduct of steam is cooled and condensed. Then, the separated water from the RWGSP subsystem is sent to the AWEP subsystem to reduce the freshwater makeup demand. In the AWEP subsystem, a total of 557 stack units are linked in parallel to conduct electrochemical reactions, where water is decomposed into hydrogen and oxygen. The H2 stream is directed to the RWGSP subsystem to generate syngas; meanwhile, the O2 stream is directed to the APCP subsystem to support natural gas combustion. The surplus O2 stream will be discharged out of the FAAR complex as a byproduct. Therefore, the water feed of the AWEP subsystem comes from three portions: (i) freshwater makeup, (ii) water from APCP and FTSP subsystems, and (iii) the water condensate from the RWGSP subsystem.
In the FTSP subsystem, the excess H2 in syngas is recycled to the RWGSP subsystem to minimize the H2 demand from the AWEP subsystem. The syngas (H2 and CO) with a molar ratio of 2:1 is used to conduct Fischer–Tropsch synthesis to produce hydrocarbons ranging from C1 to C30. After that, water is separated and mixed with the water stream from the APCP subsystem, which is directed to AWEP subsystem for water electrolysis.
In terms of power generation and consumption, Table 1 summarizes the overall power balance across the FAAR complex. The total power consumption of the FAAR complex is 1142.55 MW. The net 490.89 MW is generated by the APCP subsystem, among which 122.43 MW is internally used, and the remaining 368.46 MW is utilized to support 211 water-electrolysis stack units in the AWEP subsystem. Given that the total number of stacks is 557 in the AWEP subsystem, additional power is needed to operate the remaining 346 stack units, as well as support BOP in the RWGSP and AWEP subsystems. Thus, the total demand for renewable energy will be 652.25 MWh for the entire FAAR complex. Note that under the partial support from renewable energy (57.1% of the total power consumption), the entire FAAR complex has accomplished poly generation (C1–C30 hydrocarbons, hydrogen, and oxygen) with near-zero emissions.

3. Modeling of the FAAR Complex

3.1. Modeling of the APCP Subsystem

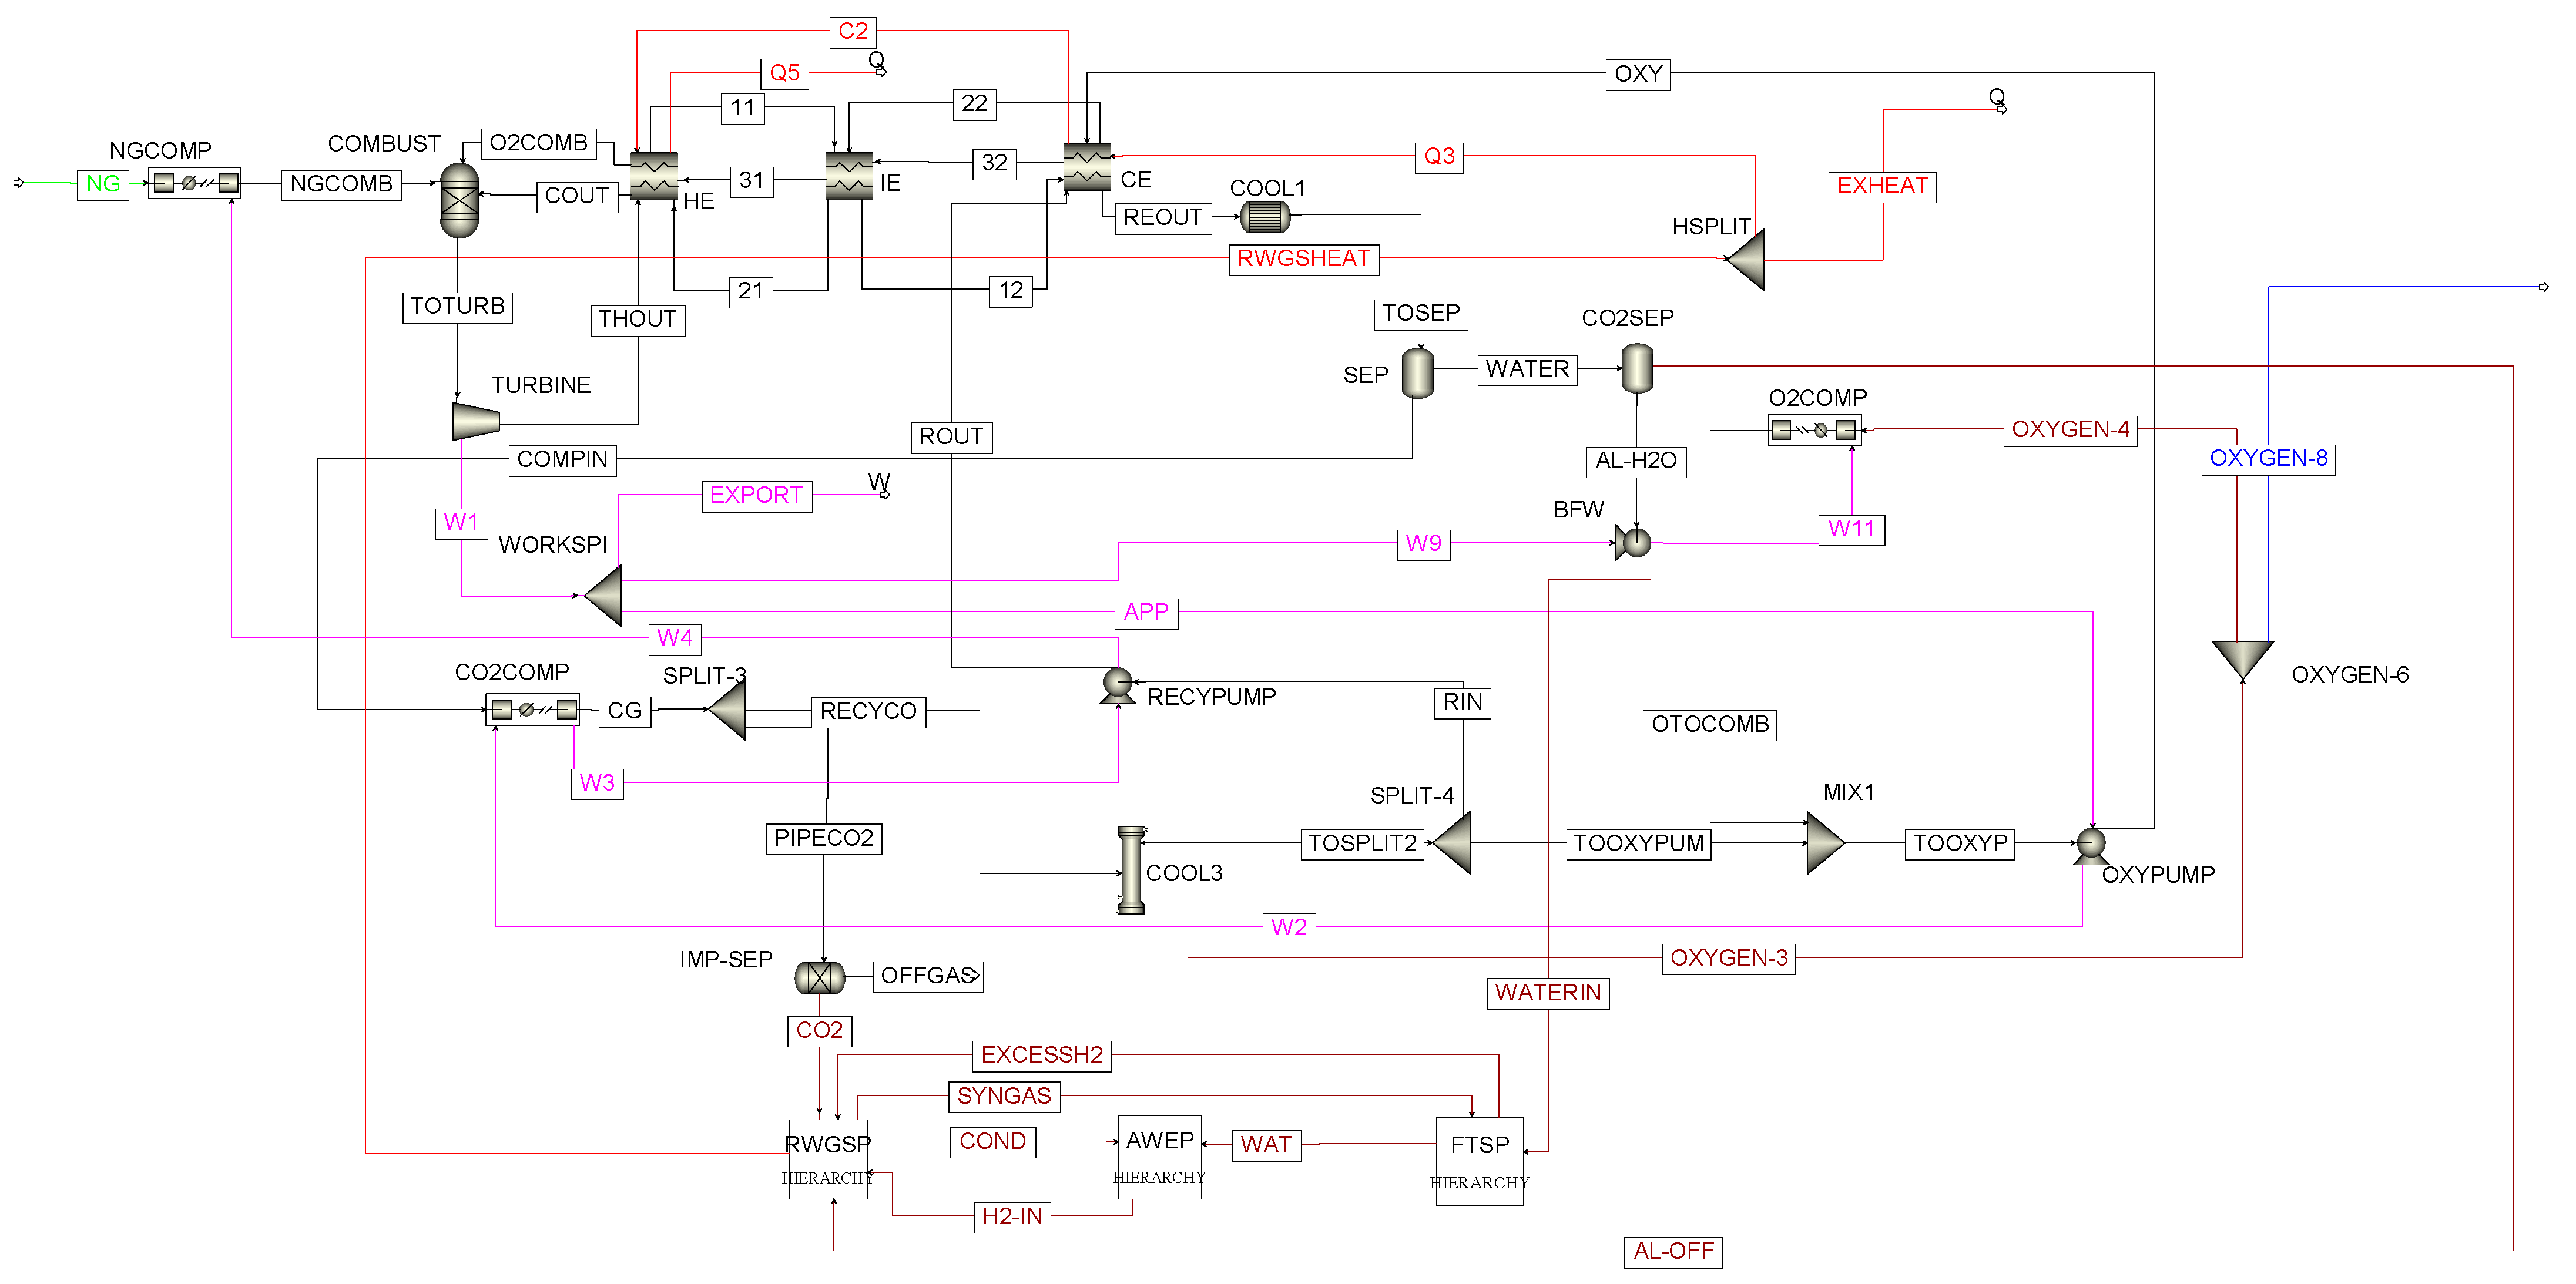
Figure 3 presents the process flow diagram for the modeled APCP subsystem. The oxygen stream (OXYGEN-3) coming from the AWEP subsystem is split into two streams. Most of the oxygen (OXYGEN-4) is compressed and combined with a recycled CO2 stream (TOOXYPUM) to form a mixture, while the remaining oxygen (OXYGEN-8, shown as the blue line) is designated as a byproduct. This mixture passes through a preheating sequence comprising CE, IE, and HE. At the combustor inlet, there is the natural gas feed (NG) and two recycled streams: (i) a CO2 stream (COUT coming from ROUT), which undergoes preheating through heat exchangers of CE, IE, and HE; (ii) a CO2 and oxygen mixture (O2COMB coming from OXY) also preheated via heat exchangers of CE, IE, and HE. Within the combustor, the oxy-combustion process takes place at 1250 °C and 300 bar, producing a high-temperature, high-pressure gas stream (TOTURB) composed primarily of supercritical CO2 and water. This gas stream expands through the turbine (TURBINE) to generate power. The thermal energy contained in the turbine exhaust (THOUT) is subsequently recovered through a series of heat exchangers (HE, IE, and CE) prior to entering the water separator (SEP). Following phase separation, the CO2-rich stream (COMPN) withdrawn from the top of the separator is compressed, divided, and recirculated back for reuse. Approximately 97.00 wt% of the CO2 is recycled into the combustor, while the remaining 3.00 wt% is the pipeline-ready CO2 (PIPECO2) exported to the RWGSP subsystem. The separated water from SEP contains some CO2, which undergoes a secondary separation process in the CO2SEP unit. After the CO2SEP processing, the extracted CO2 is sent to the RWGSP subsystem as a feedstock, while the water is routed to the FTSP subsystem.
A significant advantage of employing Allam cycle is that supercritical CO2 created by burning natural gas serves as the turbine’s working fluid, resulting in no NOx emissions at all. Furthermore, the substantial recovery of CO2 in the APCP subsystem minimizes the oxygen requirements and controls the high reaction temperatures, which enables cost-effective electricity generation while capturing pipeline-ready CO2 inherently. The overall reactions in the APCP subsystem are summarized by Equations (1)–(4). Table 2 summarizes the main simulation findings for the APCP subsystem. In addition, the turbine runs as a multiple-stage cooling turbine with an isentropic model, producing a total gross power output of 490.89 MW. The APCP subsystem uses 122.42 MW of total power generation internally (stream highlighted in pink), while the remaining 368.45 MW (EXPORT stream highlighted in pink in Figure 3) is used to power the AWEP subsystem. The turbine’s isentropic performance is 93.00%, while its mechanical performance is set at 90.00%. The overall process configuration of the APCP subsystem is based on the previous study [8] with modifications.
CH4 + 2O2 → 2H2O + CO2
2C2H6 + 7O2 → 6H2O + 4CO2
C3H8 + 5O2 → 4H2O + 3CO2
C4H10 + 6.5O2 → 5H2O + 4CO2

3.2. Modeling of the AWEP Subsystem

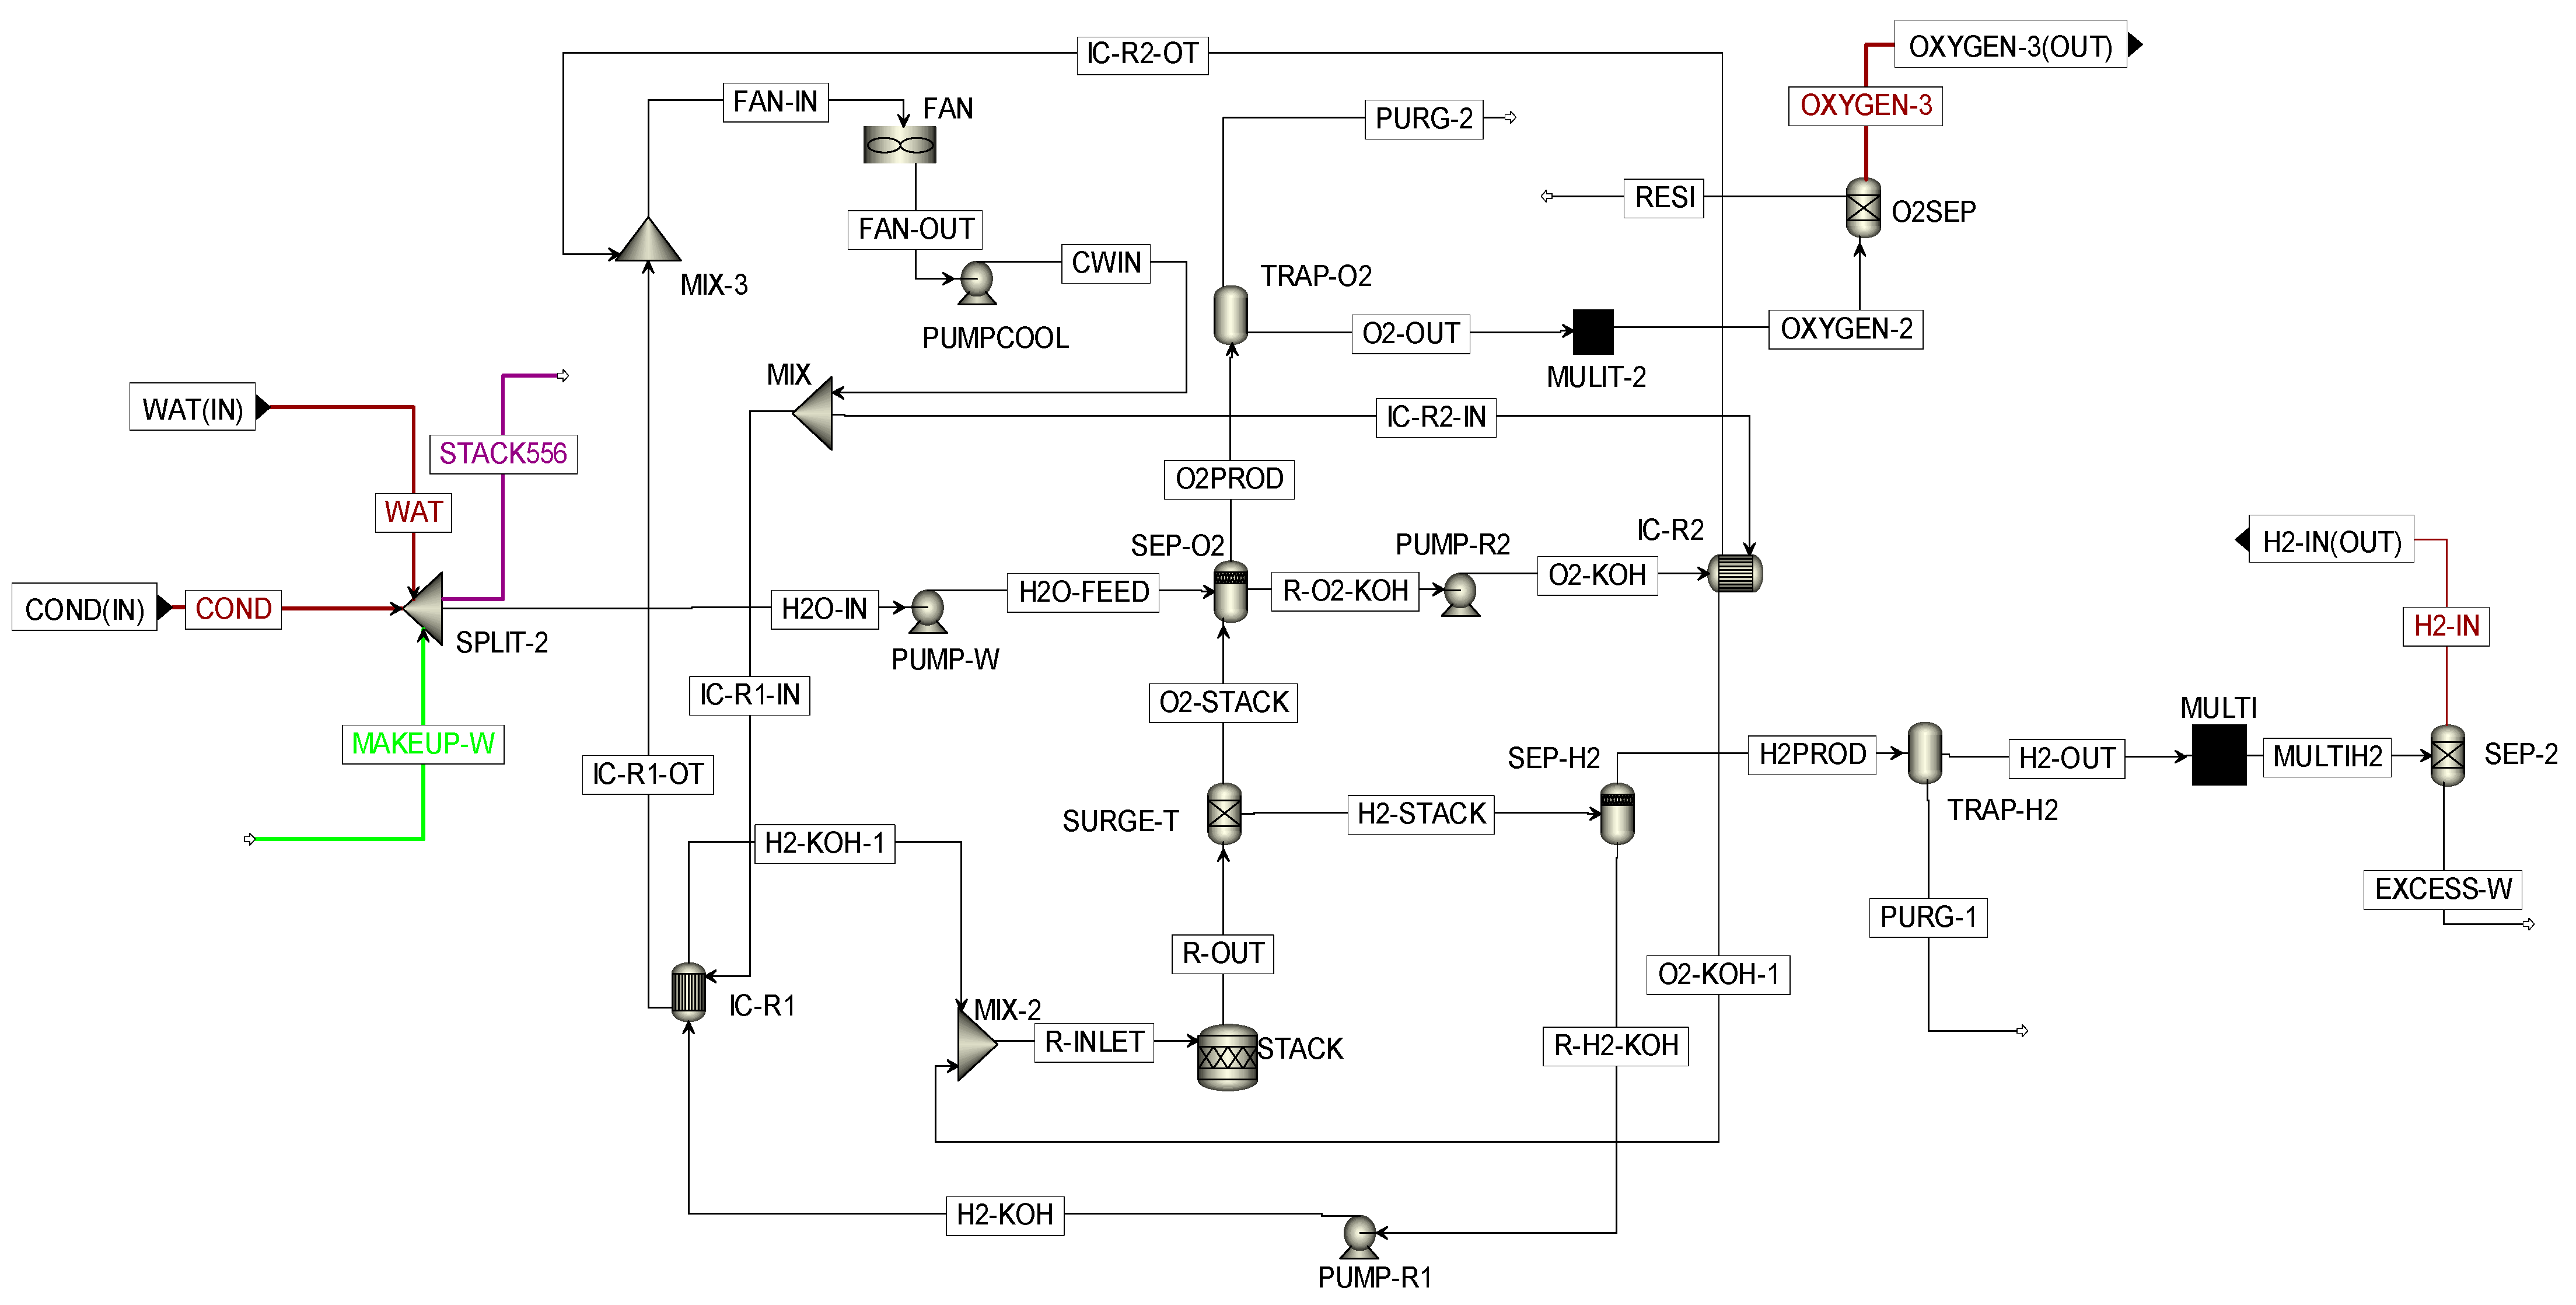
Figure 4 illustrates the process flowsheet of an overall AWEP subsystem simulated in Aspen Plus, comprising a total of 557 parallel stack units (an Aspen Plus multiplier block is utilized). In this study, the AWEP subsystem was adapted from a previous work [39], which was originally based on an experimentally validated model [14]. The hydrogen and oxygen generated by the cell stack, coupled with a 35% concentration of potassium hydroxide (KOH), are routed to two liquid–gas separation equipment to separate the electrolyte and gases. The electrolyte is then recycled to the stack using two recirculation pumps: PUMP-R1 for the cathode and PUMP-R2 for the anode. Each KOH recycling stream goes through its own heat exchanger (IC-R1 and IC-R2, respectively) to chill the electrolyte before returning to the stack (R-INLET). Cooling water (CWIN) is circulated through the heat exchangers by the cooling system’s air-cooler fan (FAN) and cooling pump (PUMPCOOL) in order to eliminate waste heat and preserve a desirable stack temperature. Finally, the incoming makeup freshwater (green line in Figure 4), along with condensed water (COND(IN)) from the RWGSP subsystem and the water inflow (WAT(IN)) from the APCP and FTSP subsystems, are merged, split, and represented by two streams: (i) the H2O-IN stream designated for a single stack unit and (ii) the STACK556 stream supplying water to the remaining 556 parallel stack units. The fresh water (H2O-IN) is pumped by (PUMP-W) to the oxygen separator (SEP-O2) to supply water for the electrolysis process. The overall reaction of electrolysis is shown in Equation (5).
H2O → H2 + ½ O2
Once separated into their own vessels, the H2 and O2 streams flow through water traps, ensuring that condensed water is removed. The H2-OUT stream carries 0.003 tonne/h of H2 and 0.007 tonne/h of water. The H2-OUT stream undergoes further multiplication (MULTI) of 557, resulting in a total output of 17.25 tonne/h of H2 and 4.1 tonne/h of water. Post water separation, the H2 stream is directed to the RWGSP subsystem. In parallel, the O2-OUT stream contains 0.25 tonne/h of O2 and 0.003 tonne/h of water, which is subjected to further multiplication by 557 (MULTI-2) to yield 136.95 tonne/h of O2 with 2 tonne/h of water. Following separation of water, O2 (OXYGEN-3) is directed to the APCP subsystem. The thermodynamic model applied for this subsystem is NRTL (Non-Random Two-Liquid). It should be noted that the electricity consumption for a single operational stack is 1.744 MW, leading to a total power requirement of 971.04 MW for the total 557 stack units. Among such a total power demand, 368.46 MW from the APCP subsystem is allocated to 211 parallel stack units, while the renewable energy source supplies the remaining 346 stack units by 602.58 MWh as well as balances BOP in the RWGSP and AWEP subsystems. Major simulation results of the AWEP subsystem are shown in Table 3.

3.3. Modeling of the RWGSP Subsystem

As illustrated in Figure 5, the incoming CO2 feed (CO2(IN)) from the APCP subsystem is at 23 °C and 100 bar. This CO2 undergoes further pre-heating (CO2HEAT) to reach 110 °C before being depressurized to 33 bar via a Joule–Thomson valve (CO2-CV). The hydrogen gas (H2-IN) coming from the AWEP subsystem mixes with the excess hydrogen stream incoming (FT-H2) from the FTSP subsystem and then undergoes a separation (H2SPLIT), where a large portion of the H2 stream is allocated for the RWGSP subsystem, and the remaining hydrogen constitutes the excess stream (EXCESSH2) highlighted in blue as a byproduct. Subsequently, the hydrogen is compressed (H2COMP-1) to 33 bar in a 3-stage compressor with a work duty of 36,680 kW. Next, the CO2 stream (CO2-IN), the recycling stream (REC-CO2), and the compressed off gas stream (OFFGAS) are mixed with the compressed hydrogen stream (HP-H2), then preheated in an exchanger (PREHEAT) to a temperature of 950 °C, with a heat duty requirement of 91,192 kW. The heated gas maintains 3:1 H2/CO2 ratio [39] and enters the RWGSP reactor (RWGS) to facilitate the endothermic reaction that produces syngas, alongside CO2 and steam as by-products. The mixture is cooled by COOLER-2 to 25 °C, with a condenser duty of −118,706 kW prior to separation. The separator (SEP-1) effectively separates the syngas from the condensate and CO2.
Note that the condensate (COND) is directed to the AWEP subsystem to decrease the demand for make-up fresh water. The syngas (denoted as SYNGAS) is forwarded to the FTSP subsystem for the synthesis of hydrocarbons. The primary reaction occurring within the RWGSP subsystem is provided in Equation (6). The overall conversion of CO2 is 80%. Major simulation results of the RWGSP subsystem are summarized in Table 4.
CO2 + H2 ⇄ CO + H2O

3.4. Modeling of the FTSP Subsystem

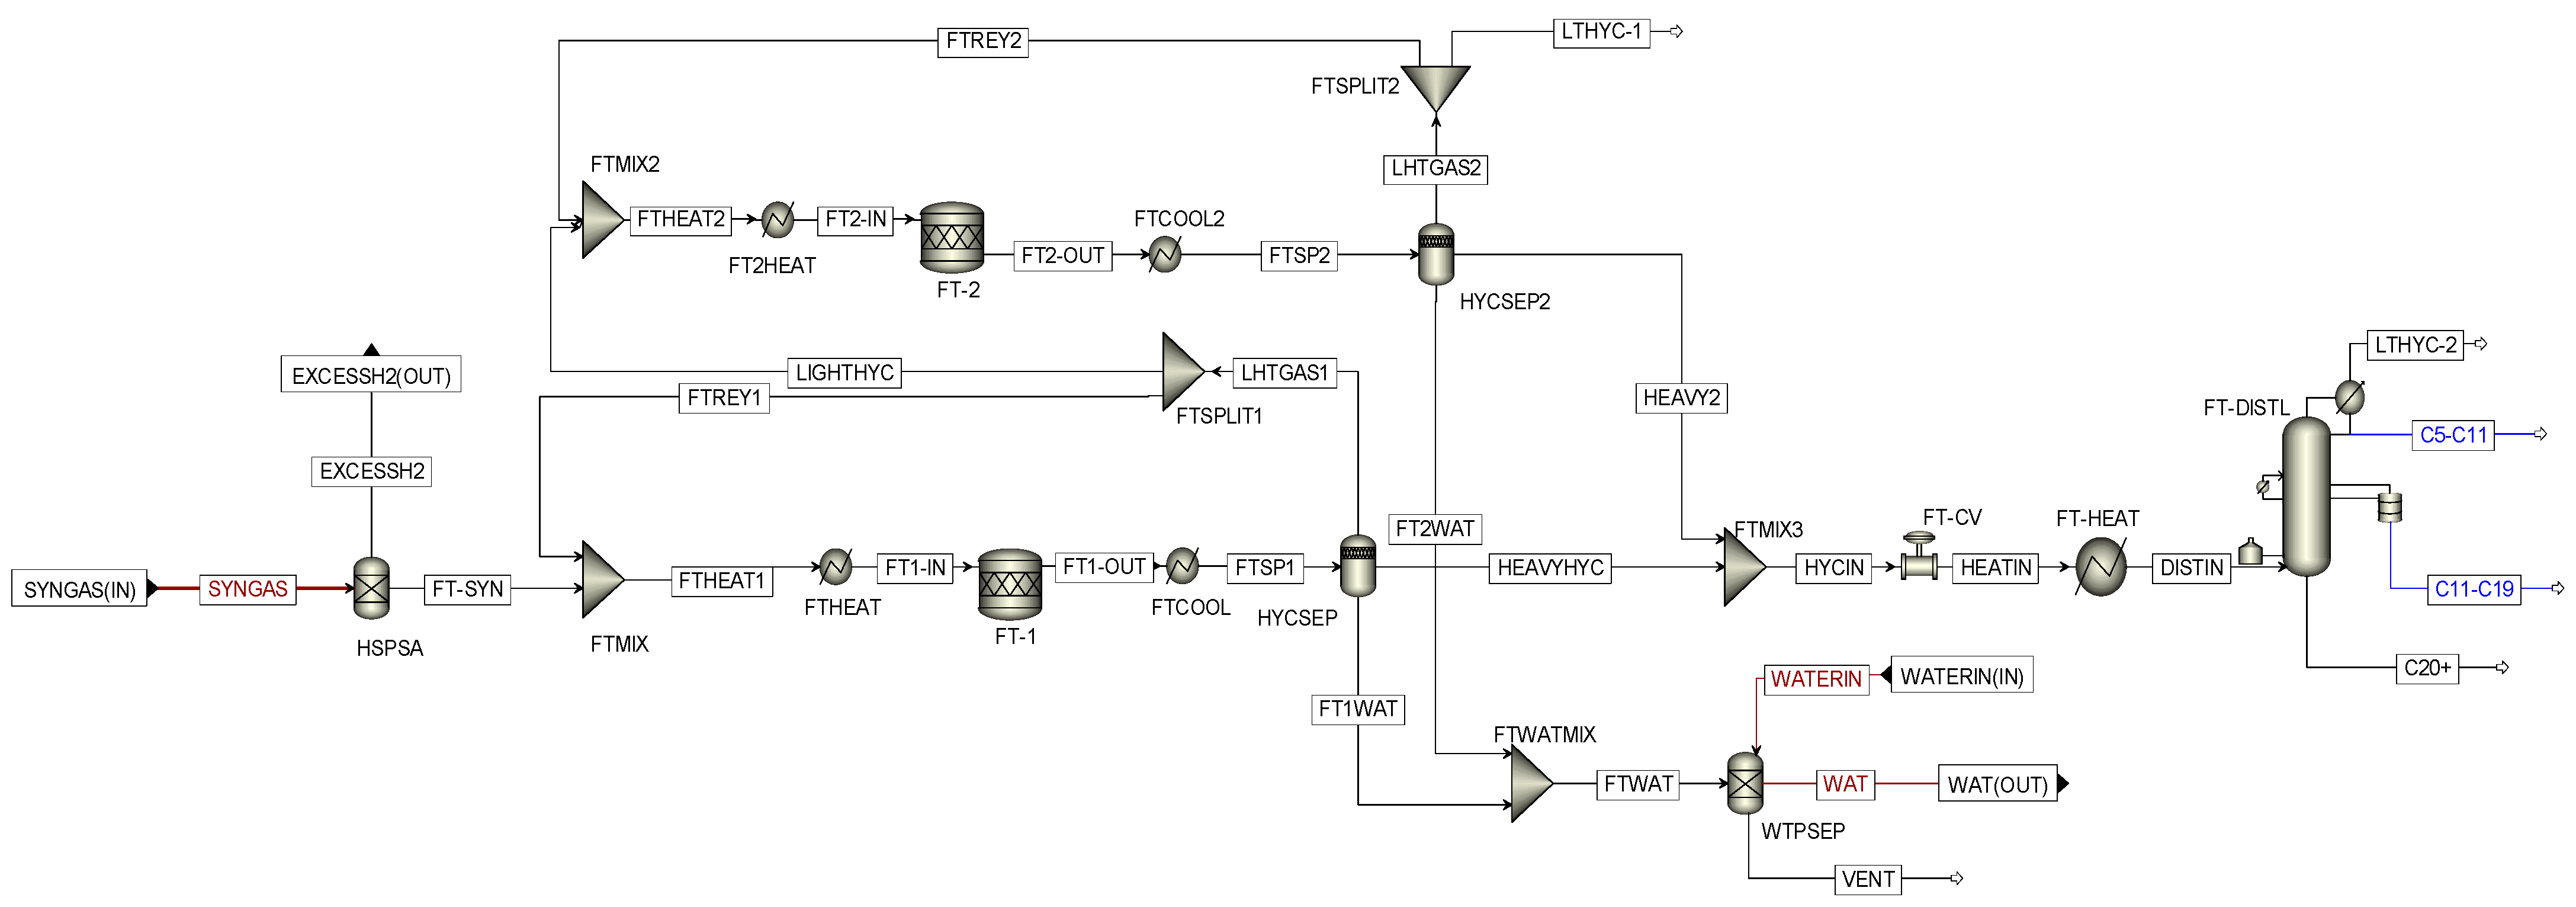
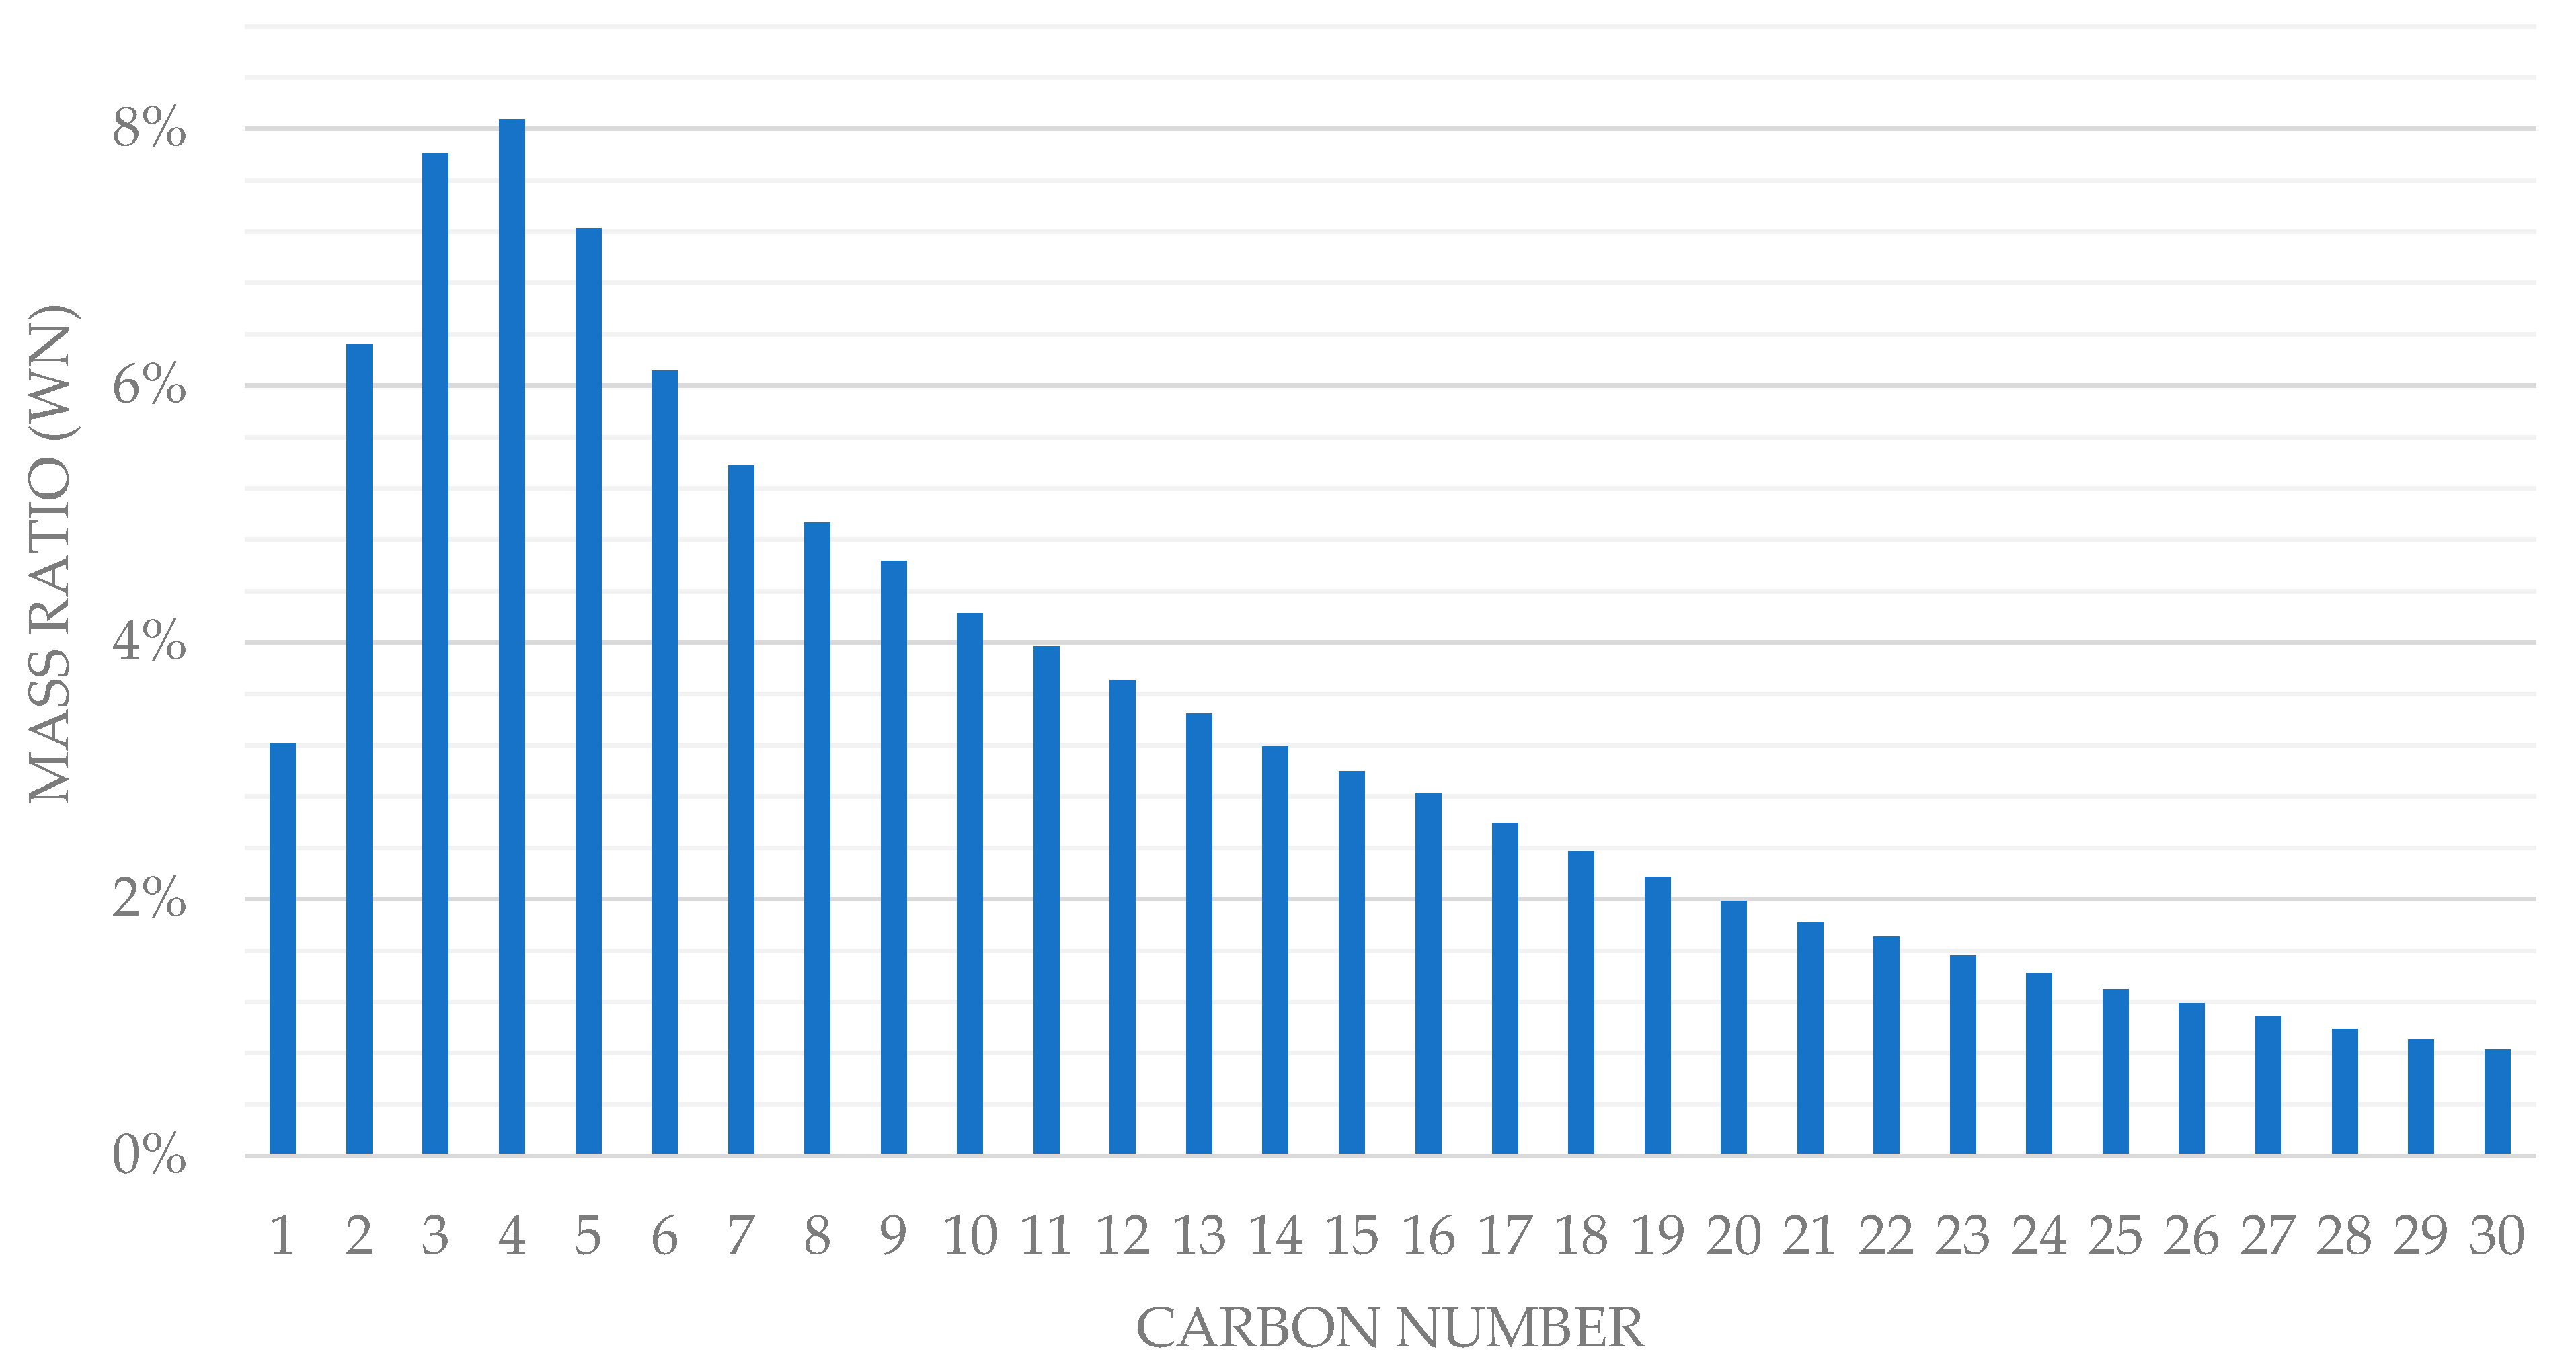
As depicted in Figure 6, the syngas produced by the RWGSP subsystem (SYNGAS) is processed through a separation method (HSPSA) that removes any excess hydrogen. This operation decreases the need for additional hydrogen from the AWEP subsystem. The syngas, composed of H2 and CO, is then blended (FTMIX) with a recycle stream to maintain a molar ratio of 2:1 [36]. After mixing, this combined stream is heated (FTHEAT) to a temperature of 230 °C, with a heat duty of 14,323 kW, and further synthesized in the Fischer–Tropsch reactor (FT-1) to produce hydrocarbons. The Anderson–Schulz–Flory (ASF) distribution is used in Equation (7) for hydrocarbon products, where α is 0.9 and Wn is the mass ratio of CnH2n+2 within the overall hydrocarbon production distribution [35]. The reactions involved in the FTSP subsystem are shown in Equation (8), where the produced hydrocarbon products include C1 to C30 paraffins. The detailed hydrocarbon distribution of CnH2n+2 with the carbon number changing from 1 to 30 is shown in Figure 7.
log(Wn/n) = nlogα + log[(1 − α)2/α]
nCO + (2n + 1)H2 → CnH2n+2 + nH2O, n = 1 to 30
After FTS reaction, the hydrocarbon stream (FT1-OUT) is cooled by FTCOOL with a heat duty of −31,508 kW. Next, the vapor–liquid–water mixture of hydrocarbons undergoes the flash operation at HYCSEP, where the vapor stream (LHTGAS1) consists of the light hydrocarbons, CO, and hydrogen. The light gas is split at FTSPLIT1, where 65% of it (FTREY1) is recycled and the remaining 45% (LIGHTHYC) is sent for the secondary FTS reaction. This secondary FTS feed is mixed with the recycling stream and preheated by FT2HEAT with a heat duty of 3457 kW prior to the secondary FTS reaction. Post synthesis, the produced hydrocarbon stream (FT2-OUT) is cooled (heat duty −6907 kW) and flashed at HYCSEP2. After that, most of light gas is recycled (FTREY2) and the remaining (LTHYC-1) is sent to downstream processing.
Heavy hydrocarbons from both primary and secondary synthesis are mixed at FTMIX3, which is preheated to 240 °C at 1 bar (at heat duty of 4797 kW) prior separation in a column (FT-DSTL). The condenser and reboiler heat duties of FT-DSTL are −4725 kW and 2230 kW, respectively. Following the fractionation process, the hydrocarbons are separated into four distinct streams: (i) LTHYC-2 representing light hydrocarbon gases; (ii) C5–C11; (iii) C11–C19; and (iv) C20+. Additionally, water streams from both primary and secondary FTS processes are, respectively, separated by HYCSEP and HYCSEP2. They are mixed at FTWATMIX as the stream FTWAT. FTWAT and another incoming water (WATERIN) from the APCP subsystem are directed to a separator WTPSEP, where a very small amount of gas impurities (0.3 kg/h with 51.0% CO2) is vented (VENT). Since this is the only small emission source of the entire FAAR complex, the overall manufacturing of the complex can be considered as near-zero emissions. This combined water stream (WAT) is subsequently directed to the AWEP subsystem for water electrolysis. The FTSP subsystem is modeled using the Peng–Robinson equation of state. Major simulation results are presented in Table 5.

4. Economic Analysis

The capital investment profile for the FAAR complex is represented and summarized in Table 6, which outlines the distribution of capital cost across its three major subsystems. The total capital expenditure (Capex) for the FAAR complex is estimated at USD 1946.31 million, distributed across three major subsystems. AWEP accounts for the largest portion at USD 753.53 million, representing approximately 38.7% of the total Capex. APCP follows closely with USD 726.52 million (37.3%), while the combined RWGSP and FTSP subsystems are allocated USD 466.26 million, comprising 24.0% of the total. This distribution indicates that AWEP and APCP together consume over 76% of the total capital investment, underscoring their dominant role in the FAAR complex’s infrastructure and cost structure. Based on Electric Power Research Institute (EPRI) estimates [40], the Capex for natural gas Allam cycle projects is approximately USD 1480 per kW of installed capacity. Using this benchmark, the APCP subsystem, with a generation capacity of 490.89 MW, results in a total Capex of about USD 726.52 million.
For the RWGSP and FTSP subsystems, the Capex was determined using the six-tenths scaling rule [41], expressed as:
C 2 = C 1 S 2 S 1 N
where C2 is the estimated cost for capacity S2, C1 is a known cost for capacity S1 [35], and N is typically 0.6. Meanwhile, the AWEP subsystem’s Capex ranges between USD 429/kW and USD 1123/kW according to EPRI data [42]. For this analysis, an average value of USD 776/kW was adopted. Given the AWEP subsystem annual consumption of 971.04 MW, its estimated Capex is approximately USD 753.52 million.
The annual variable operating cost (AVOC) for the FAAR complex is estimated at USD 543.98 million, as detailed in Table 7. Utility costs dominate the AVOC, totaling USD 320.45 million and accounting for 58.91% of the total, with electricity from renewable sources contributing USD 257.12 million (47.27%) and fired heat USD 57.07 million (10.49%). The total demand for renewable electricity, sourced from utility-scale solar PV, is 652.25 MWh, and an average price of USD 45 per MWh was adopted for the economic evaluation [43], resulting in the calculated annual electricity cost. Operating labor and maintenance costs are also significant, at USD 43.52 million (8.00%) and USD 116.78 million (21.47%), respectively. Raw material costs contribute USD 1.11 million, which is 0.20% of the AVOC, with natural gas priced at USD 3.90 per million cubic feet (MMCF) [9] and water at USD 1.40 per cubic meter, contributing USD 0.91 million (0.17%) and USD 0.20 million (0.04%), respectively. Other contributors include operating supplies (USD 17.52 million, 3.22%), plant overhead (USD 26.11 million, 4.80%), general and administrative expenses (G&A) (USD 3.26 million, 0.60%), laboratory charges (USD 6.53 million, 1.20%), and supervision (USD 8.70 million, 1.60%). On the revenue side, the annual total product revenue (ATPR) is projected at USD 743.15 million. The hydrocarbons (stream such as C5–C11, C11–C19, C20+) contribute the majority at USD 598.31 million, representing 80.51% of ATPR, based on a selling price of USD 6.50 per gallon. Hydrogen (EXCESS-H2) generates USD 144.77 million (19.48%) at a price of USD 4.50 per kg, while oxygen (OXYGEN-8) contributes a marginal USD 0.06 million (0.01%) at USD 0.10 per kg.
Table 8 outlines the key financial assumptions used in the economic evaluation of the chemical complex. The initial fixed investment is estimated at USD 1946.31 million, with an additional working capital of 5%, amounting to USD 97.31 million, bringing the total capital investment to approximately USD 2043.62 million. The annual product sales revenue is projected at USD 743.14 million, with a 5% year-over-year increase assumed to reflect market growth and pricing adjustments. Operating costs are estimated at USD 543.97 million annually, with a 2.5% annual escalation to account for inflation and maintenance. At the end of the operating life, the salvage value is estimated at 10% of the initial fixed investment, equating to USD 194.63 million. Depreciation is calculated using the straight-line method, yielding an annual depreciation expense of USD 70.06 million over the asset’s useful life. The overall analysis is referenced from Green et al. (1998) [44]. The project assumes it qualifies for the Internal Revenue Service (IRS) Section 45V tax credit [45], estimated to be USD 90.66 million, based on a base rate of USD 0.60 per kilogram of hydrogen generated with a carbon intensity below 0.45 kg CO2e/kg H2, which is possible owing to the utilization of renewable energy sources.
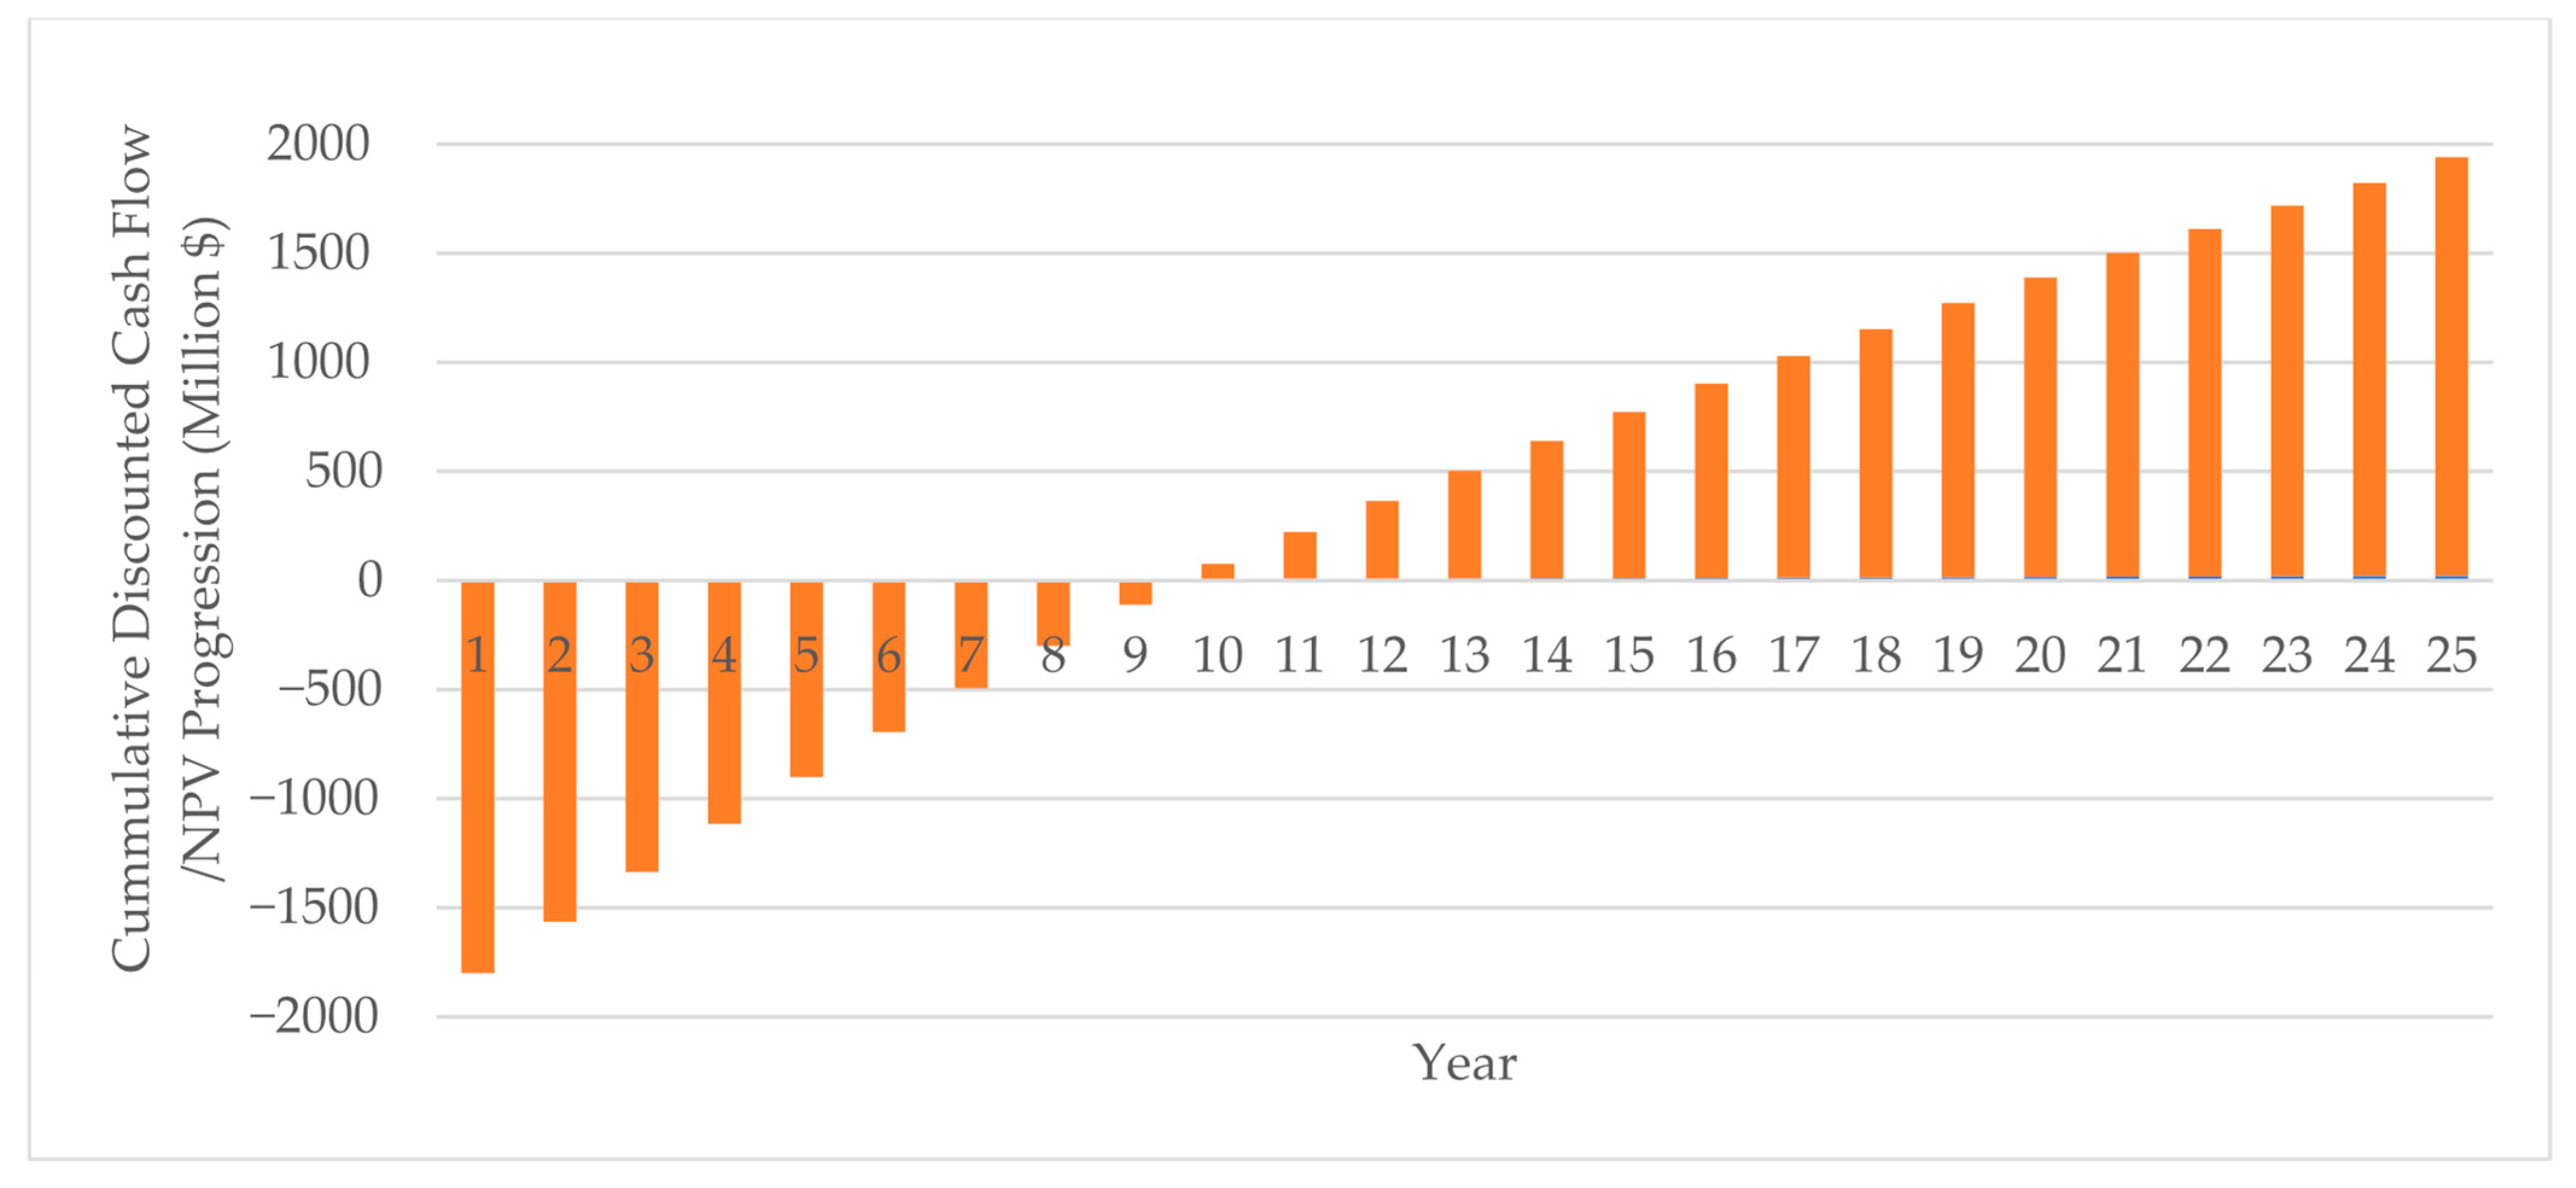
Based on parameters from Table 8, Figure 8 discloses the cumulative discounted cash flow (NPV) trajectory for the project over a 25-year horizon at an 8% discount rate. The project transitions from negative to positive NPV between Year 8 and Year 9. More precisely, when NPV reaches exactly zero, it takes about 8.7 years, indicating a discounted payback period of approximately 8.7 years. By Year 25, the cumulative NPV reaches USD 2846.42 million, demonstrating strong long-term profitability. The analysis confirms the financial viability of the project under the given assumptions, with an Internal Rate of Return (IRR) of 18% and a Profitability Index (PI) of 2.39, meaning each dollar invested generates USD 2.39 in present value returns.

5. Sensitivity Analysis

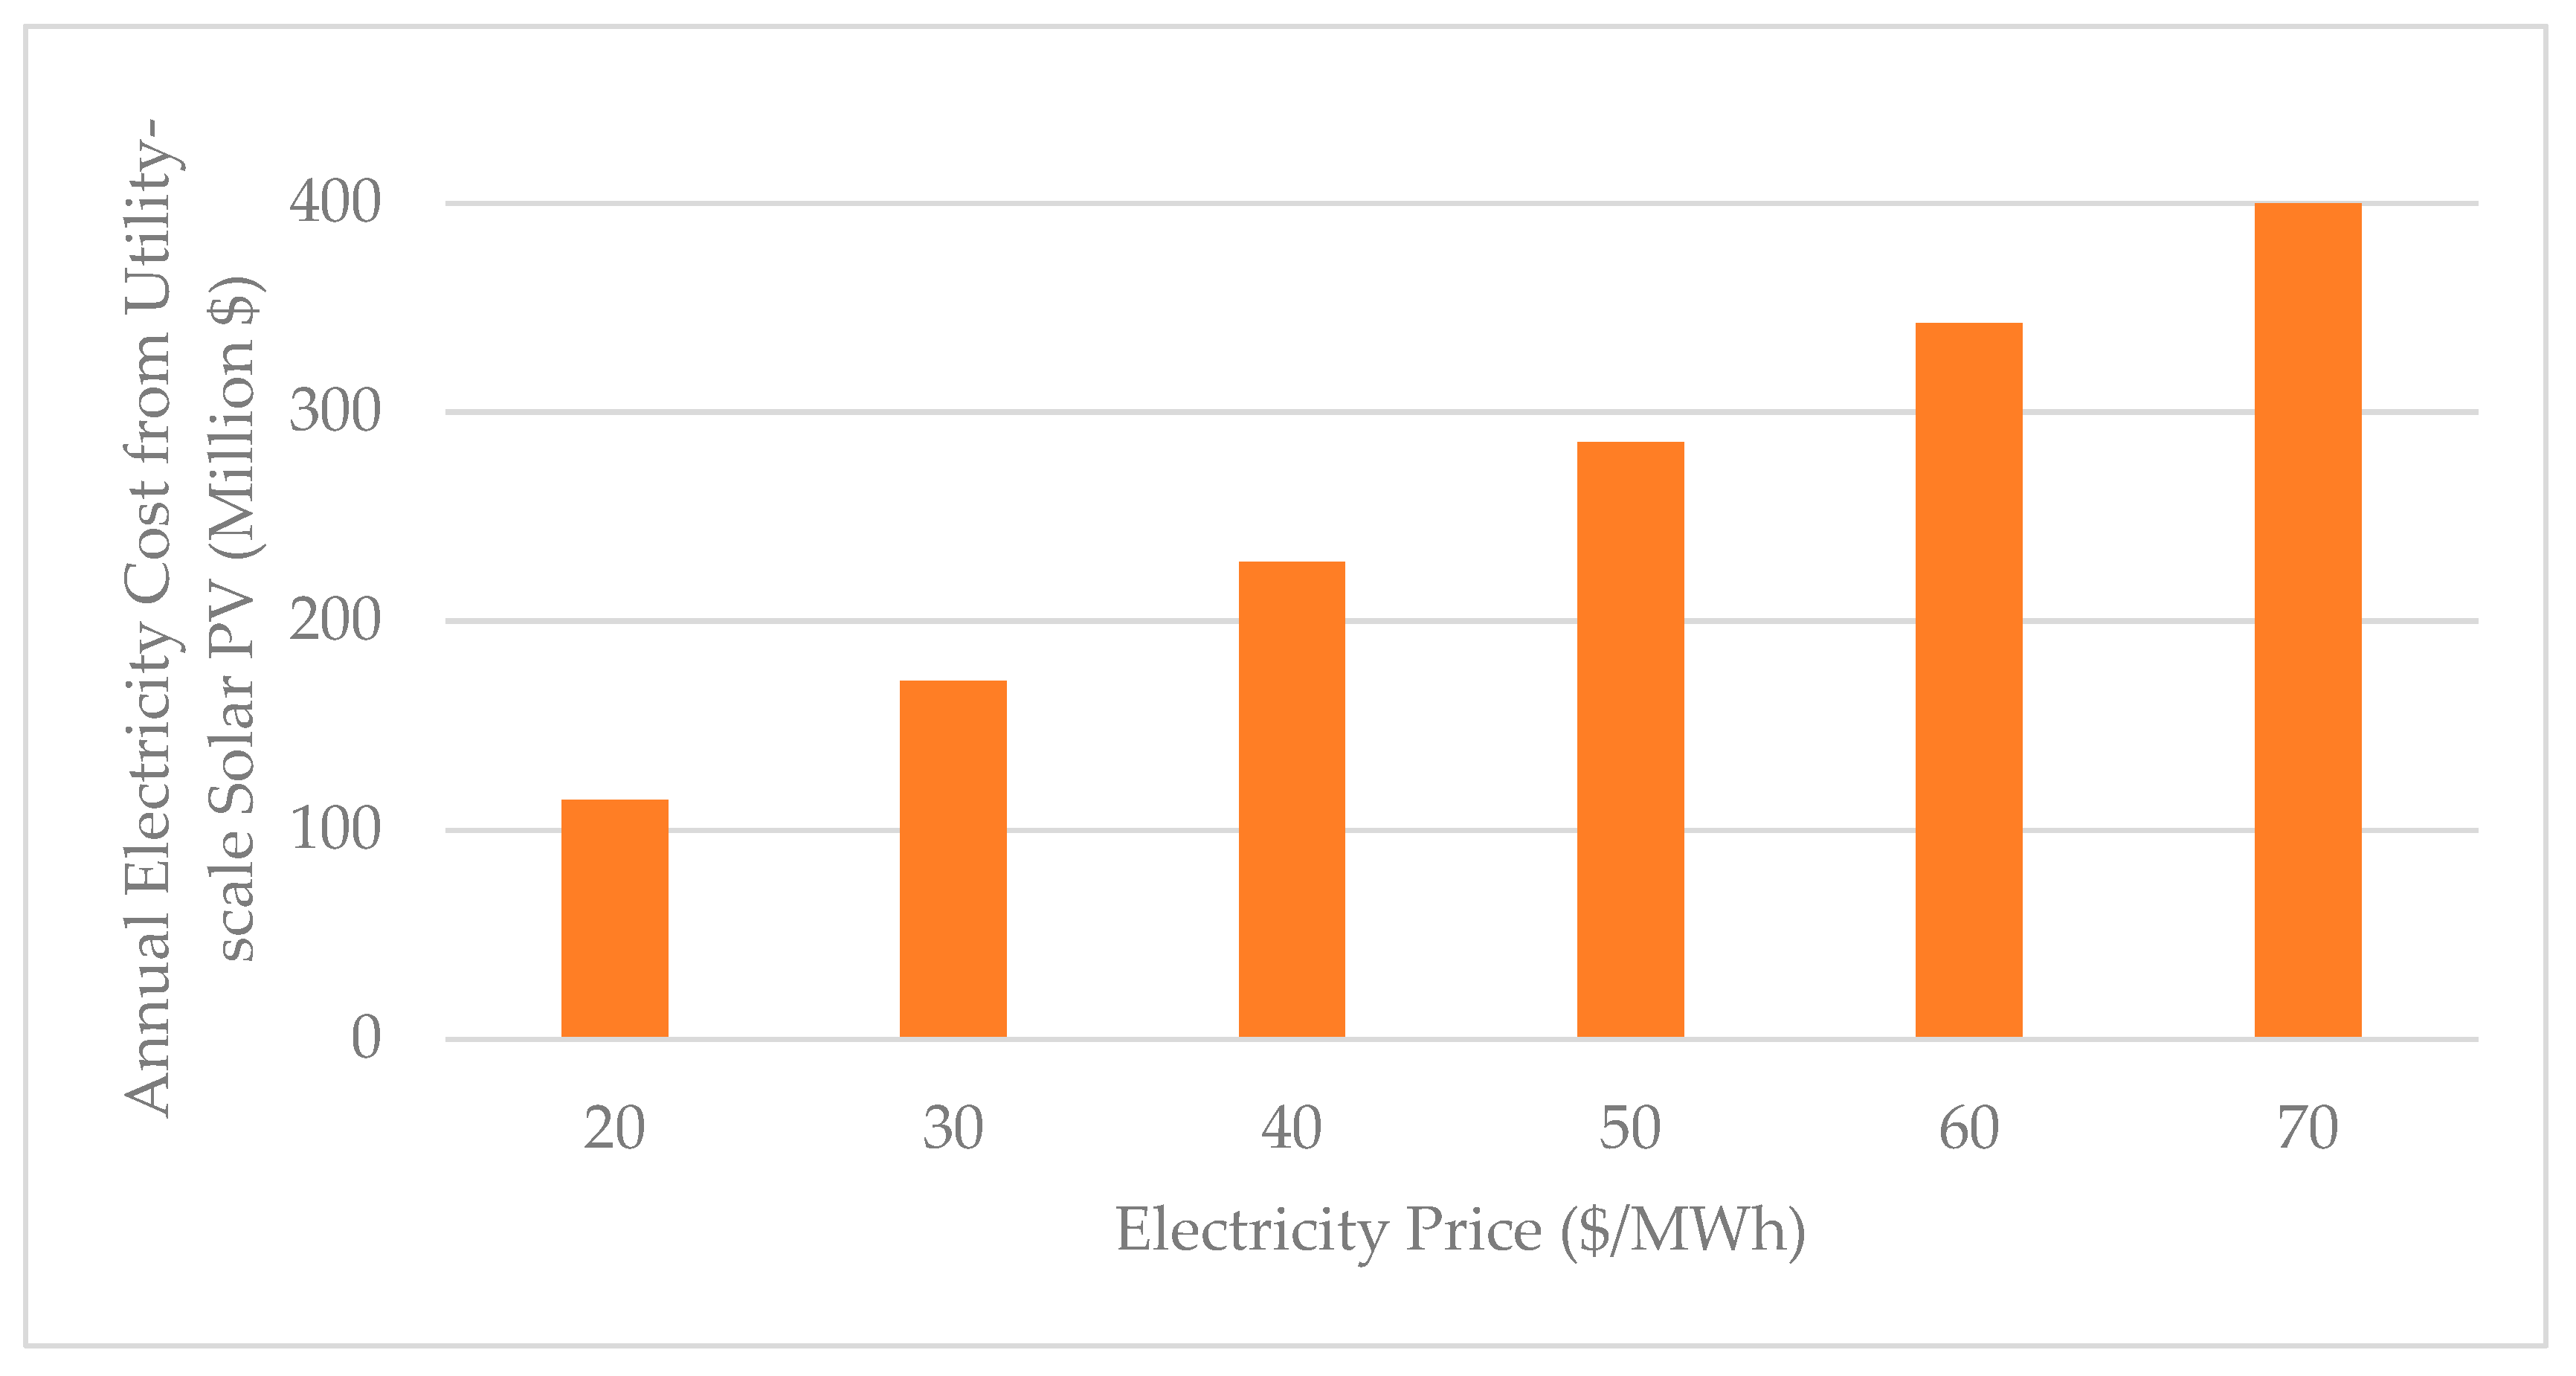
Sensitivity studies based on different electricity and hydrogen prices have also been performed in this paper as they are closely related to the operating cost of the proposed FAAR complex. Assuming utility-scale solar photovoltaic (PV) is employed as the renewable energy source, Figure 9 illustrates the sensitivity of annual electricity expenditure due to changes in utility-scale solar PV pricing. The overall renewable electricity consumption of the FAAR complex is 652.25 MWh. Thus, the annual renewable energy costs range from USD 114 million to USD 400 million as the solar electricity price varies between USD 20/MWh and USD 70/MWh [40]. This linear cost progression highlights the critical impact of electricity pricing on long-term operational expenditures, which could be used to support the strategic planning for power procurement and energy budgeting.
Figure 10 illustrates the relationship between the hydrogen price and the annual hydrogen product revenue. From Table 4, the total excess hydrogen produced is 3.67 tonne/h (i.e., 32,194,135 kg/year). As shown, a linear correlation exists, indicating that as the price of hydrogen increases from USD 2.0/kg to USD 6.0/kg, the annual product revenue rises proportionally from USD 64.4 million to USD 193.2 million. The increase in the annual product revenue of hydrogen escalates the overall annual product revenue from USD 561.7 million to USD 690.4 million, which is increased by 22.9%.
Figure 11 illustrates the cumulative discounted cash flow progression for the FAAR complex over a 25-year operating period at a 10% discount rate. As shown, the project reaches the breakeven point at Year 9.61, meaning a discounted payback period of approximately 9.61 years. By Year 25, the cumulative discounted cash flow reaches USD 1.91 billion, confirming a strong NPV. These results, along with an IRR of 18% and a PI of 1.94, affirm the long-term financial viability of the FAAR complex under conservative financial assumptions of 10% discount rate.

6. Conclusions

The developed FAAR complex presents a novel industrial ecosystem effectively integrating APCP, AWEP, FTSP, and RWGSP subsystems. Based on the feedstock of natural gas and water, the overall complex utilizing 57.1% renewable energy for its power needs can poly-generate sustainable hydrocarbons (C1–C30), pure hydrogen, and oxygen with near-zero emissions. Based on comprehensive economic and sensitivity analysis, the developed FAAR complex demonstrates its strong economic potential, having a discounted payback period of approximately 8.7 years with a profitability index of 2.39 under a normal discount rate of 8%. This study presents an exemplary model for general sustainable chemical productions, achieving near-zero emissions through partial renewable energy integration. Future potential work can focus on utilizing light gases for conversion into synthetic natural gas or other downstream products, which can further enhance the economic performance of the developed industrial complex.

Author Contributions

Conceptualization, V.A.M., Q.X. and S.W.; methodology, V.A.M. and Q.X.; software, V.A.M. and Q.X.; validation, V.A.M. and Q.X.; formal analysis, V.A.M. and Q.X.; investigation, V.A.M., Q.X. and S.W.; resources, Q.X. and S.W.; data curation, V.A.M. and Q.X.; writing—original draft preparation, V.A.M. and Q.X.; writing—review and editing, V.A.M., Q.X. and S.W.; visualization, V.A.M. and Q.X.; supervision, Q.X.; project administration, Q.X. and S.W.; funding acquisition, Q.X. and S.W. All authors have read and agreed to the published version of the manuscript.

Funding

This work was supported in part by the Texas Hazardous Waste Research Center (THWRC) and the Texas Air Research Center (TARC), both headquarters at Lamar University in Beaumont, Texas.

Data Availability Statement

The original contributions presented in this study are included in the article Further inquiries can be directed to the corresponding author.

Conflicts of Interest

The authors declare no conflict of interest.

References

  1. Ritchie, H.; Roser, M.; Rosado, P. Renewable Energy. Our World in Data. Available online: https://ourworldindata.org/renewable-energy (accessed on 15 October 2025).
  2. Allam, R.J.; Fetvedt, J.E.; Forrest, B.A.; Freed, D.A. The Oxy-Fuel, Supercritical CO2 Allam Cycle: New Cycle Developments to Produce Even Lower-Cost Electricity from Fossil Fuels without Atmospheric Emissions. In Proceedings of the ASME Turbo Expo 2014: Turbine Technical Conference and Exposition. Volume 3B: Oil and Gas Applications; Organic Rankine Cycle Power Systems; Supercritical CO2 Power Cycles; Wind Energy, Düsseldorf, Germany, 16–20 June 2014. [Google Scholar] [CrossRef]
  3. Allam, R.; Martin, S.; Forrest, B.; Fetvedt, J.; Lu, X.; Freed, D.; Brown, G.W., Jr.; Sasaki, T.; Itoh, M.; Manning, J. Demonstration of the Allam cycle: An update on the development status of a high efficiency supercritical carbon dioxide power process employing full carbon capture. Energy Procedia 2017, 114, 5948–5966. [Google Scholar] [CrossRef]
  4. Fernandes, D.; Wang, S.; Xu, Q.; Buss, R.; Chen, D. Process, and carbon footprint analyses of the Allam cycle power plant integrated with an air separation unit. Clean Technol. 2019, 1, 325–340. [Google Scholar] [CrossRef]
  5. Fernandes, D.; Wang, S.; Xu, Q.; Chen, D. Dynamic simulations of the Allam cycle power plant integrated with an air separation unit. Int. J. Chem. Eng. 2019, 6035856. [Google Scholar] [CrossRef]
  6. Guo, Q.; Wang, Z.; Liu, Y.; Wu, Y.; Wen, Z.; Xu, H.; Zhu, P.; Zhou, J.; Xiao, G. Energy Transfer and Conversion in the Allam Cycle with a Multi-Stream Heat Exchanger. Appl. Therm. Eng. 2024, 255, 124022. [Google Scholar] [CrossRef]
  7. Bocandé, D.; Rohardt, J.; Schatz, M. The Hydrogen-Fueled Allam Cycle: Thermodynamic Evaluation and Optimization after a Fuel Switch to Hydrogen. In Proceedings of the ASME Turbo Expo 2025: Turbomachinery Technical Conference and Exposition. Volume 4: Controls, Diagnostics & Instrumentation; Cycle Innovations; Education; Electric Power, Memphis, TN, USA, 16–20 June 2025. [Google Scholar] [CrossRef]
  8. Wang, S.; Fernandes, D.; Xu, Q.; Chen, D. New Conceptual Design of an Integrated Allam-Cycle Power Complex Coupling Air Separation Unit and Ammonia Plant. Ind. Eng. Chem. Res. 2021, 60, 18007–18017. [Google Scholar] [CrossRef]
  9. Liu, Y.; Wang, S.; Xu, Q.; Ho, T.C. Eco-Friendly Natural Gas Monetization Complex for Simultaneous Power Generation and Nitrogen-Based Fertilizer Production. Ind. Eng. Chem. Res. 2023, 62, 489–499. [Google Scholar] [CrossRef]
  10. Liu, Y.; Wang, S.; Xu, Q.; Huang, Y. Comprehensive Utilization of Natural Gas for Simultaneous Production of Electricity, Urea, and Liquefied Natural Gas with Inherent Carbon Capture. Clean Technol. Environ. Policy 2024, 27, 2535–2546. [Google Scholar] [CrossRef]
  11. Kato, T.; Kubota, M.; Kobayashi, N.; Suzuoki, Y. Effective Utilization of By-Product Oxygen from Electrolysis Hydrogen Production. Energy 2005, 30, 2580–2595. [Google Scholar] [CrossRef]
  12. Voldsund, M.; Jordal, K.; Anantharaman, R. Hydrogen Production with CO2 Capture. Int. J. Hydrogen Energy 2016, 41, 4969–4992. [Google Scholar] [CrossRef]
  13. Rothschild, A.; Grader, G.; Shter, G.; Landman, A.; Dotan, H. Methods and System for Hydrogen Production by Water Electrolysis. U.S. Patent 10,487,408 B2, 26 November 2019. Available online: https://patents.google.com/patent/US10487408B2/en (accessed on 20 May 2024).
  14. Sánchez, M.; Amores, E.; Abad, D.; Rodríguez, L.; Clemente-Jul, C. Aspen plus Model of an Alkaline Electrolysis System for Hydrogen Production. Int. J. Hydrogen Energy 2020, 45, 3916–3929. [Google Scholar] [CrossRef]
  15. Kumar, S.S.; Lim, H. An overview of Water Electrolysis technologies for green hydrogen production. Energy Rep. 2022, 8, 13793–13814. [Google Scholar] [CrossRef]
  16. Campbell-Stanway, C.; Becerra, V.; Prabhu, S.; Bull, J. Investigating the Role of Byproduct Oxygen in UK-Based Future Scenario Models for Green Hydrogen Electrolysis. Energies 2024, 17, 281. [Google Scholar] [CrossRef]
  17. Yu, Z.; Liu, L. Recent Advances in Hybrid Seawater Electrolysis for Hydrogen Production. Adv. Mater. 2023, 36, 2308647. [Google Scholar] [CrossRef]
  18. Ernst, K.-H.; Campbell, C.T.; Moretti, G. Kinetics of the reverse water-gas shift reaction over Cu(110). J. Catal. 1992, 134, 66–74. [Google Scholar] [CrossRef]
  19. Jadhav, S.G.; Vaidya, P.D.; Bhanage, B.M.; Joshi, J.B. Kinetics of Reverse Water-Gas Shift Reaction over Pt/Al2O3Catalyst. Can. J. Chem. Eng. 2015, 94, 101–106. [Google Scholar] [CrossRef]
  20. Daza, Y.A.; Kuhn, J.N. CO2 Conversion by Reverse Water Gas Shift Catalysis: Comparison of Catalysts, Mechanisms and Their Consequences for CO2 Conversion to Liquid Fuels. RSC Adv. 2016, 6, 49675–49691. [Google Scholar] [CrossRef]
  21. Kirsch, H.; Sommer, U.; Pfeifer, P.; Dittmeyer, R. Power-To-Fuel Conversion Based on Reverse Water-Gas-Shift, Fischer-Tropsch Synthesis and Hydrocracking: Mathematical Modeling and Simulation in Matlab/Simulink. Chem. Eng. Sci. 2020, 227, 115930. [Google Scholar] [CrossRef]
  22. González-Castaño, M.; Dorneanu, B.; Arellano-Garcia, H. The Reverse Water Gas Shift Reaction: A Process Systems Engineering Perspective. React. Chem. Eng. 2021, 6, 954–976. [Google Scholar] [CrossRef]
  23. Zhang, Q.; Bown, M.; Pastor-Pérez, L.; Duyar, M.S.; Reina, T.R. CO2 Conversion via Reverse Water Gas Shift Reaction Using Fully Selective Mo–P Multicomponent Catalysts. Ind. Eng. Chem. Res. 2022, 61, 12857–12865. [Google Scholar] [CrossRef] [PubMed]
  24. Wang, Y.-N.; Ma, W.-P.; Lu, Y.-J.; Yang, J.; Xu, Y.-Y.; Xiang, H.-W.; Li, Y.-W.; Zhao, Y.-L.; Zhang, B.-J. Kinetics Modelling of Fischer–Tropsch Synthesis over an Industrial Fe–Cu–K Catalyst. Fuel 2003, 82, 195–213. [Google Scholar] [CrossRef]
  25. Marion, M.-C.; Bertoncini, F.; Hugues, F.; Forestiere, A. Comprehensive Characterisation of Products from Cobalt Catalysed Fischer-Tropsch Reaction. In Proceedings of the DGMK/SCI-Conference, Synthesis Gas Chemistry, Dresden, Germany, 4–6 October 2006; Available online: https://www.osti.gov/etdeweb/servlets/purl/20840761 (accessed on 18 May 2024).
  26. Visconti, C.G.; Tronconi, E.; Lietti, L.; Zennaro, R.; Forzatti, P. Development of a Complete Kinetic Model for the Fischer–Tropsch Synthesis over Co/Al2O3 Catalysts. Chem. Eng. Sci. 2007, 62, 5338–5343. [Google Scholar] [CrossRef]
  27. Swanson, R.M.; Platon, A.; Satrio, J.A.; Brown, R.C.; Hsu, D.D. Techno-Economic Analysis of Biofuels Production Based on Gasification. OSTI OAI; U.S. Department of Energy Office of Scientific and Technical Information: Oak Ridge, TN, USA, 2010. [CrossRef]
  28. Todic, B.; Nowicki, L.; Nikacevic, N.; Bukur, D.B. Fischer–Tropsch Synthesis Product Selectivity over an Industrial Iron-Based Catalyst: Effect of Process Conditions. Catal. Today 2016, 261, 28–39. [Google Scholar] [CrossRef]
  29. Rafiee, A.; Panahi, M.; Khalilpour, K.R. CO2 Utilization through Integration of Post-Combustion Carbon Capture Process with Fischer-Tropsch Gas-To-Liquid (GTL) Processes. J. CO2 Util. 2017, 18, 98–106. [Google Scholar] [CrossRef]
  30. Theampetch, A.; Prapainainar, C.; Tungkamani, S.; Narataruksa, P.; Sornchamni, T.; Árnadóttir, L.; Jovanovic, G.N. Detailed Microkinetic Modelling of Syngas to Hydrocarbons via Fischer Tropsch Synthesis over Cobalt Catalyst. Int. J. Hydrogen Energy 2021, 46, 24721–24741. [Google Scholar] [CrossRef]
  31. Davies, I.; Möller, K.P. Development of a Kinetic Model for Low Temperature Fischer-Tropsch Synthesis. Chem. Eng. Sci. 2021, 241, 116666. [Google Scholar] [CrossRef]
  32. Gao, R.; Zhang, C.; Jun, K.-W.; Kim, S.K.; Park, H.-G.; Zhao, T.; Wang, L.; Wan, H.; Guan, G. Green Liquid Fuel and Synthetic Natural Gas Production via CO2 Hydrogenation Combined with Reverse Water-Gas-Shift and Co-Based Fischer-Tropsch Synthesis. J. CO2 Util. 2021, 51, 101619. [Google Scholar] [CrossRef]
  33. Ahmed, H.S. Power-to-X: Modelling of Fischer-Tropsch Synthesis in Aspen Plus. Master’s Thesis, Master’s Programme in Advanced Energy Solutions. Aalto University, Espoo, Finland, 2021. Available online: https://aaltodoc.aalto.fi/bitstream/handle/123456789/112650/master_Sayed_Ahmed_Hassan_2022.pdf?sequence=1 (accessed on 10 May 2024).
  34. Repasky, J.M.; Zeller, R.L., III. Process for the Conversion of Carbon Dioxide; World Intellectual Property Organization: Geneva, Switzerland, 2021; Available online: https://patentimages.storage.googleapis.com/5a/d5/48/81c7e5318737af/WO2021062384A1.pdf (accessed on 10 November 2023).
  35. Zang, G.; Sun, P.; Elgowainy, A.A.; Bafana, A.; Wang, M. Performance and Cost Analysis of Liquid Fuel Production from H2 and CO2 Based on the Fischer-Tropsch Process. J. CO2 Util. 2021, 46, 101459. [Google Scholar] [CrossRef]
  36. Zang, G.; Sun, P.; Delgado, H.E.; Cappello, V.; Ng, C.; Elgowainy, A.; Systems Assessment Center, Energy Systems Division, Argonne National Laboratory. The Modeling of the Synfuel Production Process; Argonne National Laboratory: Argonne, IL, USA, 2022.
  37. Azhari, N.J.; Nurdini, N.; Mardiana, S.; Ilmi, T.; Fajar, A.T.N.; Makertihartha, I.G.B.N.; Subagjo; Kadja, G.T.M. Zeolite-Based Catalyst for Direct Conversion of CO2 to C2+ Hydrocarbon: A Review. J. CO2 Util. 2022, 59, 101969. [Google Scholar] [CrossRef]
  38. Singh, H.; Li, C.; Cheng, P.; Wang, X.; Liu, Q. A Critical Review of Technologies, Costs, and Projects for Production of Carbon-Neutral Liquid E-Fuels from Hydrogen and Captured CO2. Energy Adv. 2022, 1, 580–605. [Google Scholar] [CrossRef]
  39. Modi, V.A.; Xu, Q. Modeling, and Integration of Green-Hydrogen-Assisted Carbon Dioxide Utilization for Hydrocarbon Manufacturing. Ind. Eng. Chem. Res. 2024, 63, 18043–18052. [Google Scholar] [CrossRef]
  40. EPRI Home. Epri.com. Available online: https://www.epri.com/research/products/3002008149 (accessed on 5 October 2025).
  41. Richardson, J.F. Coulson and Richardson’s Chemical Engineering; Elsevier: Amsterdam, The Netherlands, 1993. [Google Scholar] [CrossRef]
  42. Capex Rates|Electrolysis Techno-Economic Analysis. Epri.com. Available online: https://apps.epri.com/lcri-electrolysis-tea/en/capex-rates.html (accessed on 10 October 2025).
  43. U.S. DOE. 2030 Solar Cost Targets. 2021. Available online: https://www.energy.gov/eere/solar/articles/2030-solar-cost-targets (accessed on 18 March 2024).
  44. Green, D.W.; Southard, M.Z. Perry’s Chemical Engineers’ Handbook. Choice Rev. Online 1998, 35, 35–307935–3079. [Google Scholar] [CrossRef]
  45. U.S. Department of Energy. Clean Hydrogen Production Tax Credit (45V) Resources. Energy.gov. Available online: https://www.energy.gov/articles/clean-hydrogen-production-tax-credit-45v-resources (accessed on 10 October 2025).
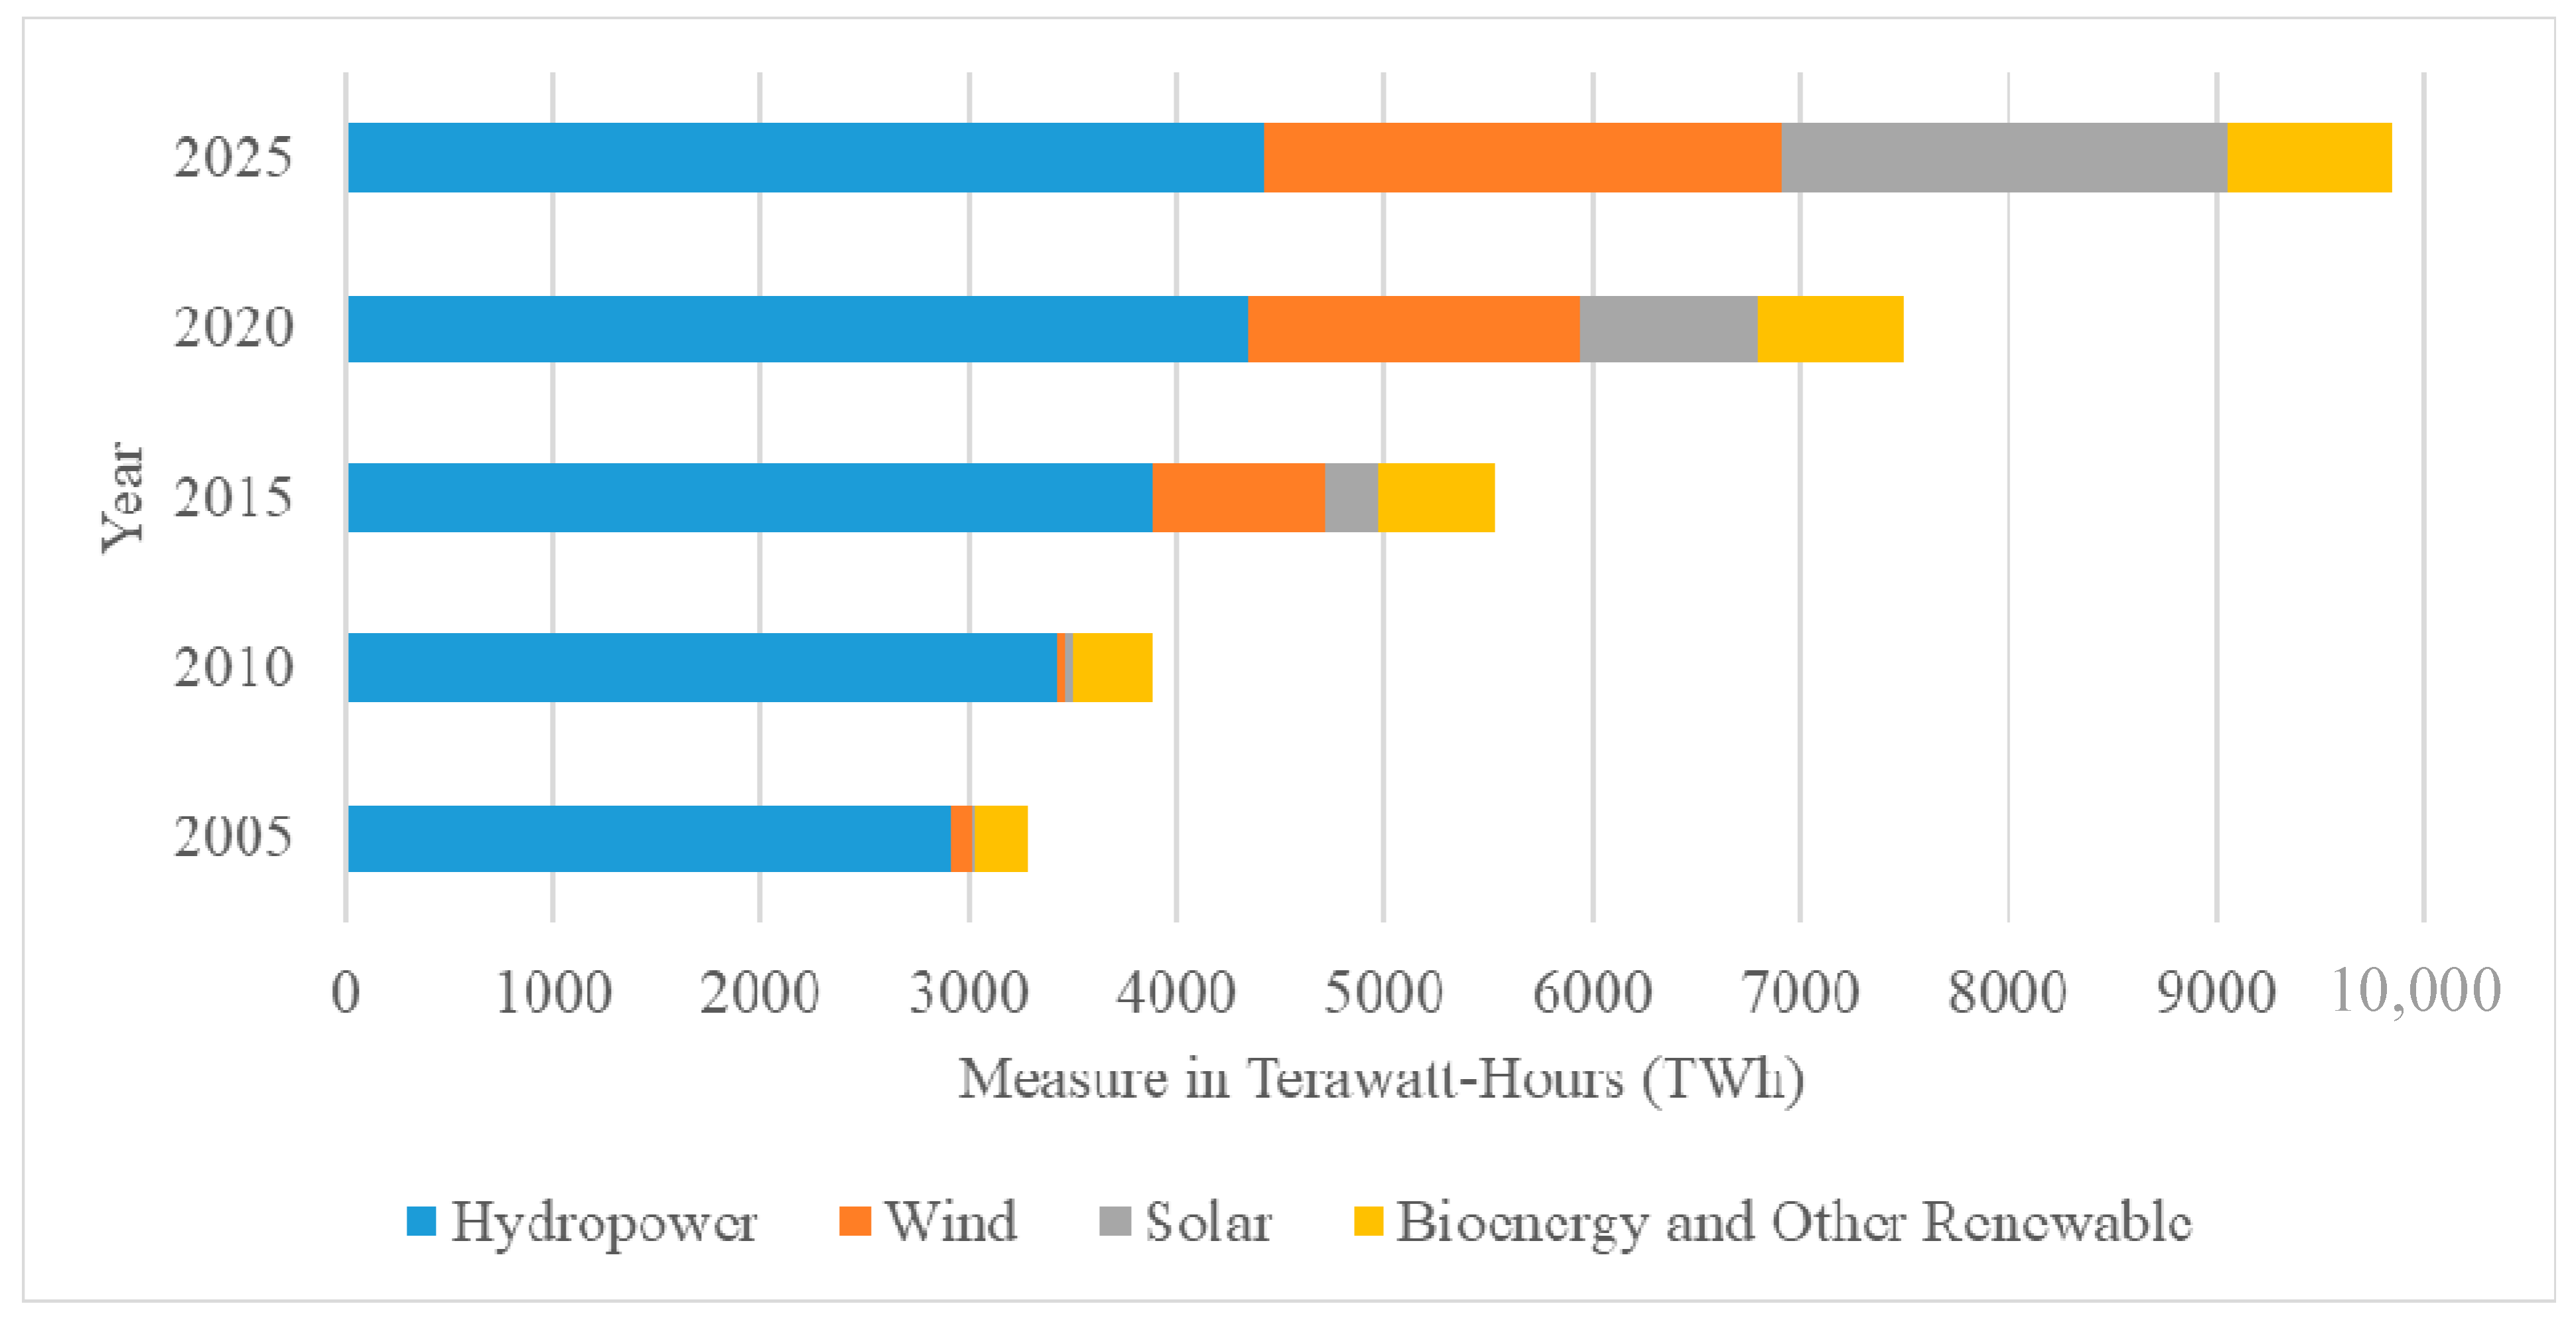
Figure 1. World-wide renewable electricity generation from 2005 to 2024.
Cleantechnol 07 00093 g001
Figure 2. Overview of the developed FAAR industrial complex.
Cleantechnol 07 00093 g002
Figure 3. Process layout of the APCP subsystem.
Cleantechnol 07 00093 g003
Figure 4. Process layout of the AWEP subsystem.
Cleantechnol 07 00093 g004
Figure 5. Process layout of the RWGSP subsystem.
Cleantechnol 07 00093 g005
Figure 6. Process layout of the FTSP subsystem.
Cleantechnol 07 00093 g006
Figure 7. Distribution of hydrocarbons produced from the FTS reactor.
Cleantechnol 07 00093 g007
Figure 8. Cumulative discounted cash flow/NPV progression at 8% discount rate.
Cleantechnol 07 00093 g008
Figure 9. Impact of solar PV price on annual utility-scale electricity expenditure.
Cleantechnol 07 00093 g009
Figure 10. Impact of hydrogen price on the annual hydrogen product revenue.
Cleantechnol 07 00093 g010
Figure 11. Cumulative discounted cash flow/NPV progression at 10% discount rate.
Cleantechnol 07 00093 g011
Table 1. Power distribution and consumption of the FAAR complex.
SubsystemPower Generation (MWh)Power Consumption (MWh)Power Source
APCP490.89NGCOMP3.45122.43 MW internal consumption and remaining 368.46 MW exported to stacks in AWEP subsystem
BFW0.03
O2COMP20.86
OXYPUMP10.55
CO2COMP61.57
RECYPUMP25.97
RWGSP0H2COMP48.71Renewable energy
AWEP0PUMP-W0.04Renewable energy
PUMP-R20.01
PUMP-R10.01
PUMPCOOL0.01
Stacks *971.04Renewable energy plus power from the APCP subsystem
FTSP0--0--
* A total of 971.04 MWh of electricity is supplied to all 557 stack units in the AWEP subsystem, of which 211 units are powered by the APCP power (368.46 MWh), and 346 units are powered by renewable energy (602.58 MWh).
Table 2. Major simulation results of the APCP subsystem.
Stream IndexT
(°C)
P
(bar)
Flow
(tonne/h)
Mass Fraction
CO2H2ON2O2H2C1–C4CO
AL-OFF5.000.030.090.890.110.000.000.000.000.00
CG23.00100.003266.150.970.000.010.020.000.000.00
COUT717.00312.002480.570.970.000.010.020.000.000.00
NGCOMB270.00330.00360.030.000.030.000.000.950.00
O2COMB717.00310.00824.480.810.000.010.180.000.000.00
OFFGAS23.43100.002.660.000.020.350.630.000.000.00
OXYGEN-425.001.00136.880.000.000.001.000.000.000.00
OXYGEN-825.001.000.070.000.000.001.000.000.000.00
PIPECO223.00100.0097.980.970.000.010.020.000.000.00
RIN16.0099.302480.570.970.000.010.020.000.000.00
ROUT44.99312.002480.570.970.000.010.020.000.000.00
TOOXYPUM16.0099.30687.600.970.000.010.020.000.000.00
TOSEP17.0029.503341.040.950.020.010.020.000.000.00
TOSPLIT216.0099.303168.170.970.000.010.020.000.000.00
TOTURB1250.00300.003341.040.950.020.010.020.000.000.00
WATERIN19.0738.0074.810.001.000.000.000.000.000.00
Table 3. Major simulation results of the AWEP subsystem.
Stream IndexT
(°C)
P
(bar)
Flow
(tonne/h)
Mass Fraction
H2OO2H2
COND25.001.0038.961.000.000.00
CWIN35.022.600.351.000.000.00
FAN-IN38.982.600.351.000.000.00
FAN-OUT35.002.300.351.000.000.00
H2-IN19.001.0017.250.000.001.00
H2-OUT25.001.000.040.190.000.81
H2PROD75.006.700.050.330.000.67
IC-R1-IN35.022.600.181.000.000.00
IC-R1-OT36.612.600.181.000.000.00
IC-R2-IN35.022.600.181.000.000.00
IC-R2-OT41.352.600.181.000.000.00
MAKEUP-W25.001.0016.791.000.000.00
MULTIH225.001.0021.370.190.000.81
O2-OUT25.001.000.250.010.990.00
O2PROD75.006.700.250.030.970.00
OXYGEN-325.001.00136.950.001.000.00
R-INLET72.807.300.631.000.000.00
R-OUT779.057.000.630.560.390.05
STACK55620.301.00166.861.000.000.00
WAT17.931.00111.411.000.000.00
WATER-IN18.801.000.301.000.000.00
Table 4. Major simulation results of the RWGSP subsystem.
Stream IndexT
(°C)
P
(bar)
Flow
(tonne/h)
Mass Fractions
CO2H2OH2CO
CO2-IN64.5233.0095.321.000.000.000.00
OFFGAS57.0033.000.081.000.000.000.00
PURGE50.030.0090.001.000.000.00
H225.101.0020.520.000.001.000.00
EXCESSH225.001.003.670.000.001.000.00
CO2+H287.3233.00135.070.870.000.120.01
COND25.0030.0038.960.001.000.000.00
REC-CO225.0030.0022.810.970.000.000.03
RWGS-IN950.0033.00135.070.870.000.120.01
RWGS-PR950.0033.00135.070.170.290.090.45
SYNGAS25.0030.0073.560.000.000.170.83
Table 5. Major simulation results of the FTSP subsystem.
Stream IndexT
(°C)
P
(bar)
Flow
(tonne/h)
Mass Fraction
CO2H2OH2COC1–C4C5–C10C11–C19C20+
SYNGAS25.0030.0073.290.000.000.170.830.000.000.000.00
FT1-IN230.0020.0092.240.010.000.120.820.040.010.000.00
FT1-OUT230.0020.0092.240.010.330.040.300.080.100.090.05
FT2-IN240.0020.0025.040.010.010.090.620.210.060.000.00
FT2-OUT230.0020.0025.040.010.250.030.230.240.130.070.04
DISTIN240.001.0025.400.000.000.000.000.040.370.380.20
C5–C1125.001.009.840.000.010.000.000.060.880.050.00
C11–C19214.331.009.630.000.000.000.000.000.040.910.05
C20+369.381.005.140.000.000.000.000.000.000.080.92
EXCESSH225.0030.003.270.000.001.000.000.000.000.000.00
VENT17.9620.000.00030.510.000.050.160.280.000.000.00
LTHYC-143.0020.008.010.030.000.050.430.410.070.000.00
LTHYC-225.001.000.790.010.020.000.080.590.290.000.00
WAT17.961.00111.410.001.000.000.000.000.000.000.00
Table 6. Capital expenditure breakdown by subsystems.
SubsystemCapex (Million USD)
1. APCP726.52
2. RWGSP + FTSP466.26
3. AWEP753.53
Total1946.31
Table 7. Breakdown of annual operating costs and product revenues.
ItemsValue (in USD M)
1. Annual Variable Operating Cost (AVOC)543.98
  1.1 Annual Raw Material Cost1.11
    1.1.1 Natural Gas0.91
    1.1.2 Water0.20
  1.2 Annual Utility Cost320.45
    1.2.1 Cooling water4.21
    1.2.2 Steam2.05
    1.2.3 Electricity (Renewable energy)257.12
    1.2.4 Fired Heat57.07
  1.3 Operating labor43.52
  1.4 Maintenance (labor + material)116.72
  1.5 Operating Supplies17.52
  1.6 Plant Overhead26.11
  1.7 General and Administrative expenses (G&A)3.26
  1.8 Laboratory Charges6.53
  1.9 Supervision8.70
2. Annual Total Product Revenue (ATPR)743.15
  2.1 Hydrogen (EXCESS-H2)144.77
  2.2 Oxygen (OXYGEN-8)0.06
  2.3 FT Fuel (C5–C11), (C11–C19), (C20+)598.31
Table 8. Financial and economic parameters considered for project evaluation.
ParametersValueNotes
Initial Fixed Investment (USD M)1946.31
Working Capital (USD M)97.315% of Initial Fixed Investment
Total Capital Investment (USD M)2043.62
Total Product Sales Revenue (USD M)743.155% annual increase every year
Total Operating Cost (USD M)543.982.5% annual increase every year
Salvage Value (USD M)194.6310% of Initial Fixed Investment
Annual Depreciation (USD M)70.06Straight-line method over 25 years
Tax (%)30
IRS Section 45V Tax Credit (USD M)90.66Base rate considered USD 0.60 per kg of H2 produced with carbon intensity
less <0.45 (kg CO2e/kg H2)
Disclaimer/Publisher’s Note: The statements, opinions and data contained in all publications are solely those of the individual author(s) and contributor(s) and not of MDPI and/or the editor(s). MDPI and/or the editor(s) disclaim responsibility for any injury to people or property resulting from any ideas, methods, instructions or products referred to in the content.