Abstract
Mining activities have a significant impact on the quality of river water in the Roșia Montană area. This region, known for its gold and other precious metal mining, serves as an example of the interaction between anthropogenic activities and the natural environment. Water from mine drainage is metal-rich and contaminates the environment, inhibiting the growth and reproduction of aquatic plants and animals, while also having corrosive effects on infrastructure. As part of the study, parameters such as pH, dissolved oxygen, biochemical oxygen demand, chemical oxygen demand, sulfates, and heavy metals were monitored for the rivers in the area (Roșia Montană, Săliște, Corna, Abrud, and Arieș). Roșia Montană river shows a decrease in pH to highly acidic values (2.69–3.95), especially in the downstream sections. Sulfate concentrations exceed 3600 mg/L, and heavy metal concentrations (Fe, Zn, As, Mn) increase significantly, indicating severe pollution, primarily originating from the Gura Mine gallery. These frequently exceed the thresholds corresponding to water quality classes I and II, and in some cases even surpass the limits of class V (the most polluted). The presence of As (27.60 µg/L) in Roșia Montană River indicates a significant ecotoxicological risk. In an attempt to treat the acid mine drainage from Roșia Montană, a natural zeolite was used at different doses. The results obtained show good efficiency of zeolite in removing the metal ions (Fe, Zn, and Mn). The results provide valuable information on the quality of river waters in the mining area of Roșia Montană and suggest that zeolite can be used effectively to decontaminate mine waters.
1. Introduction
Mining activities have long played a significant role in economic development, providing essential raw materials for various industries [1]. However, their environmental impact, particularly on water resources, has become a subject of increasing concern. One of the most critical issues associated with mining is the acid mine drainage (AMD), which results from the oxidation of sulfide minerals, leading to the release of acidic water laden with heavy metals into surrounding ecosystems [2]. This phenomenon poses severe risks to aquatic life, soil quality, and human health. Metal mining and metallurgy are one of the oldest human activities, dating back to prehistoric times, when people extracted flint for tools and weapons. Over the millennia, this activity has evolved, becoming essential for ancient civilizations that exploited precious metals. In the Middle Ages, mining expanded in Europe, fueled by the need for iron and copper for weapons and construction [3]. The Industrial Revolution brought advanced technologies that revolutionized the extraction of metal ores. Today, mining remains a strategic sector for the global economy, helping to provide essential resources for modern industries and technologies [4].
Mining and mineral processing operations typically have a significant water footprint, as numerous stages either require the use of water or result in the incidental generation of wastewater [5]. Wastewater from the mining activities is one of the most serious sources of environmental pollution, with a significant impact on the ecosystems and human health. These salty and acidic waters, often containing heavy metals such as arsenic, lead, mercury, cadmium, copper, zinc, and other mine-related constituents, can penetrate the soil [6] and watercourses, affecting the quality of natural resources and endangering flora and fauna [7,8,9]. In this context, assessing the level of pollution of watercourses in the mining areas and identifying the proper methods to reduce the impact of the acid drainage are important measures for the protection of the environment and local communities.
One of Europe’s most prolific mining districts for over 2000 years is located in Roșia Montană (Romania) in an area known as the Golden Quadrilateral, in the South Apuseni Mountains of Transylvania. While mining has contributed to regional economic growth, it has also led to significant environmental degradation, particularly affecting river water quality. The presence of AMD in local water bodies has led to elevated levels of heavy metals, including iron, lead, cadmium, and arsenic, exceeding environmental safety thresholds. Addressing this issue is crucial to mitigating its harmful effects and ensuring the sustainability of local water resources [10]. Here, as a result of the historical mining activities, the abandoned waste dumps and tailings ponds in the Roșia Montană area have a serious impact on the quality of the local streams and rivers, through contamination with heavy metals (iron, zinc, arsenic, lead, cadmium, and copper) [11], acidification of the water due to the acid mine drainage, excessive sedimentation affecting the transparency and aquatic habitats, as well as by changes in the hydrological regime altering the natural watercourses and aquatic biodiversity [12].
The acid mine drainage that continues to flow from the old mining galleries, most of which are now closed, pollutes and destroys aquatic life in the nearby rivers in the area [13]. Fish and aquatic plant mortality can occur due to factors such as water contamination, oxygen depletion, temperature fluctuations, or the presence of toxic substances [14].
Numerous remediation techniques have been proposed to treat AMD, ranging from chemical neutralization to constructed wetlands [15]. Among these, natural zeolites have emerged as a promising, cost-effective, and environmentally friendly solution for water decontamination. Zeolites with various structures and chemical compositions are known worldwide, but clinoptilolite is the most commonly used in therapy [16], medicine (traditional Indian—Ayurveda, Chinese, and Russian medicine), and the cosmetic industry [17]. They are also utilized for environmental protection, as well as in animal husbandry, agriculture, and water treatment. Zeolites possess the ability to selectively capture and eliminate pesticides, toxins, molds, heavy metals, and radioactive substances [18]. Zeolite is an efficient adsorbent due to its porous structure and ability to selectively retain molecules, being widely used in purification, dehydration, and catalysis processes [19]. Zeolites, aluminosilicate minerals with high ion-exchange capacities, have demonstrated the ability to remove heavy metals and neutralize acidity in contaminated waters [20]. Recent studies have explored their application in AMD treatment, with promising results in laboratory and field-scale trials [21,22]. Zanin et al. [23] reported that natural zeolite achieved removal efficiencies of up to 95.4% for iron, 96.0% for copper, and 85.1% for chromium at a temperature of 25.0 °C and a pH of 4.0. Similarly, Rakhym et al. [24] determined the maximum uptake capacity of lead ions by zeolite to be 14 mg/g.
The aim of this paper is to evaluate the quality of the river waters in the Roșia Montană area and to identify the pollution factors along their courses. Practically, the study tries to identify the possible anthropic pollution sources based on the results of several physico-chemical investigations. Water quality indicators, including water pH, oxygen content, biological and chemical oxygen demand, sulfate, cadmium, lead, iron, copper, cadmium, manganese, arsenic, and zinc concentrations collected at 14 points along the nearby rivers were evaluated for one year. Through experimental analyses, we seek to provide a comprehensive understanding of the challenges posed by AMD in this region and potential solutions for mitigating its effects. Our findings contribute to the ongoing discussion on sustainable mining practices and environmental remediation strategies. Ultimately, this research highlights the need for integrating innovative/natural materials like zeolites into AMD treatment frameworks to ensure the protection of water resources in mining-affected regions. The possibility of using a natural zeolite to effectively remove the heavy metals from the acid mine drainage generated at the “Gura Minei” abandoned mine was also highlighted.
2. Materials and Methods
2.1. Study Area and the Sampling Points
Roșia Montană is located in the Southern Apuseni Mountains and is one of the richest gold regions in Europe, belonging to the gold Quadrilateral. Roșia Montană is part of the northernmost belt of this metallogenetic district, where other deposits of precious metals and copper are also known [25]. Roșia Montană was included in the UNESCO list on 27 July 2021, recognizing it as a property of universal value due to its remarkable historical, cultural, and natural values [26].
Figure 1 shows the location of the region on the map of Romania, highlighting the geographical position of Alba County, respectively, the investigated area (Figure 2).
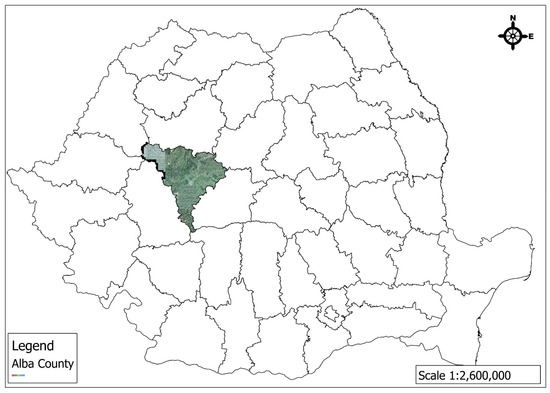
Figure 1.
Location of the region within Alba County on the map of Romania.
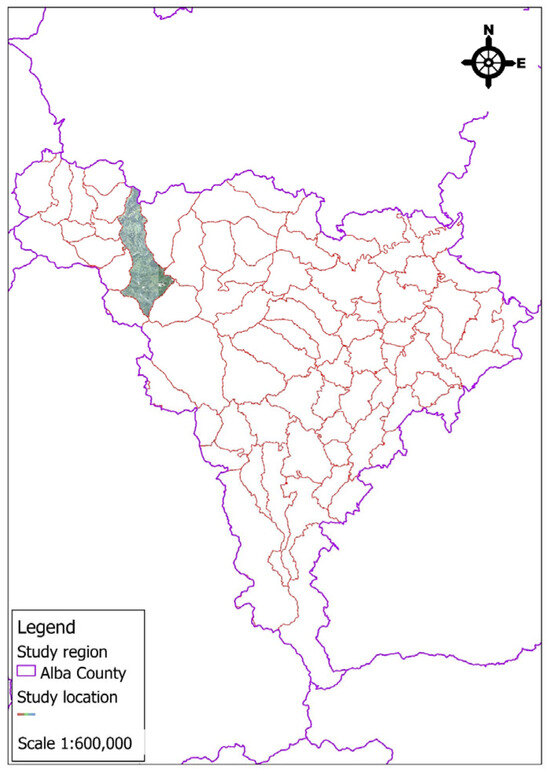
Figure 2.
Geographical position of the investigated region on the map of Alba County.
Figure 3 presents the geographical map of the Roșia Montană area, highlighting the nearby rivers and their effluents. The map was created using Quantum GIS (QGIS) version 3, which integrates free and open-source software tools.
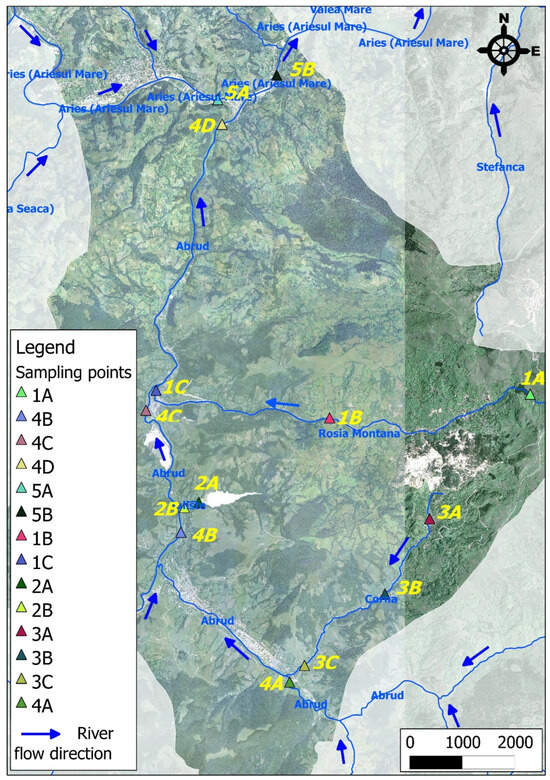
Figure 3.
Map of the Roșia Montana area and the sampling locations of river water.
Table 1 provides general information and estimated specific data for the selected watercourses in Alba County, Romania.

Table 1.
General and specific data for the investigated watercourses.
The water samples were collected quarterly during 2024 from different points in the nearby rivers throughout the Roșia Montana area, as shown in Table 2.
Table 2.
Water sampling points of the analyzed rivers.
2.2. River Water Sampling
River water samples, 14 in total, were collected from 5 to 15 cm below the water surface using a sterile 500 mL glass container. For the determination of the physico-chemical parameters, the samples were analyzed as is, immediately on the day of sampling. For the determination of metal concentrations, 2 mL of concentrated HNO3 was added to subsamples to prevent precipitation.
2.3. Mine Water Sampling
In the interior galleries, small streams have formed, flowing between the railway tracks installed in the mine. A sample of mine water was collected manually from the mine entrance, which represents the main discharge from the mine, being a combination of all infiltrations and accumulations from the mine walls. This is the most accessible location for water quality monitoring.
Before sampling, the container was rinsed 2–3 times with mine drainage, and the contents were emptied downstream of the sampling point. The sample was collected by immersing a bottle with its opening facing upstream, ensuring it filled in such a way that no air bubbles remained in the vessel. The sample was collected 5–10 cm below the water surface. After sampling, the bottle was transported to the laboratory and stored in a polyethylene bottle at 4 °C until the chemical analyses were performed.
2.4. Zeolite Characterization and Preparation
The natural zeolite tested as a low-cost sorbent originates from the locality of Rupea, Brașov County. It was obtained from volcanic rocks in the Perșani Mountains and provided by the S.C. Eleolit S.A. Company from Rupea, Brașov County, Romania.
The zeolite sample used in the sorption experiments had a grain size of 0.63–1 mm. For use in the experiments, the zeolite was repeatedly washed with distilled water to remove surface dust and then dried in an oven at 100 °C for 24 h. The mineralogical composition and physico-chemical parameters of the zeolite were provided by S.C. Eleolit S.A. Company. According to the X-ray diffraction analyses, the natural zeolite contains 71–83% clinoptilolite, 4.1–9.7% volcanic glass, 6.67% plagioclase (a soda-lime mineral from the feldspar group), 2.25–2.6% quartz, and traces of other minerals [28]. The physicochemical parameters of the natural zeolite are as follows: the cation exchange capacity is 1.51 meq/100 g, and the specific surface area (BET) is 23.4 m2/g. The specific gravity ranges from 1.65 to 1.75 g/cm3, while the total porosity is 33.08%. The water absorption is 16.21%, and the density of the zeolite ranges from 2.15 to 2.25 g/cm3. The bulk density is 0.88 kg/dm3.
2.5. Analysis of the Physico-Chemical Parameters of River and Mine Water
2.5.1. Chemicals and Reagents
Sodium hydroxide (NaOH reagent grade, ≥98%, pellets (anhydrous)), potassium iodide (KI 99.995 Suprapur), sodium thiosulfate (Na2S2O3 solution, c(Na2S2O3) = 0.1 mol/l (0.1 N) Titripur), sulfuric acid (H2SO4 98%), potassium permanganate (c(KMnO4) = 0.02 mol/l (0.1 N) Titripur), barium chloride (BaCl2·2H2O, for analysis, ≥98%), and nitric acid (HNO3 65%), were obtained from CertiPUR Merck, Darmstadt, Germany. Manganese(II) sulfate monohydrate (MnSO4·H2O, ACS reagent, ≥98%, was obtained from Sigma-Aldrich (St. Louis, MO, USA).
2.5.2. pH Value
The pH value of the samples was measured using a digital pH meter, Seven Multi (Mettler Toledo, Zurich, Switzerland).
2.5.3. Total Suspended Solids (TSS) [29]
The analysis was performed within 24 h of sampling, during which the sample was kept in the dark at a temperature between 1 and 5 °C. The glass fiber filters were pre-treated by soaking in distilled water for 2 h, then drained of wash water and dried at 105 °C until a constant weight was achieved. The filter paper was pre-washed with distilled water and dried in an oven at 105 °C until constant weight, ensuring the mass loss was less than 0.3 mg/filter.
100 mL of the sample to be analyzed was filtered using a vacuum pump. The filter containing the suspended solids was placed in a flask and dried at 105 °C until constant weight. The total suspended solids content was expressed in mg/L and calculated using the formula: TSS = (m2 − m1) · 1000/V (mg/L), where m1 is the mass of the flask with filter (mg); m2 is the mass of the flask with filter and suspended solids (mg); V is the volume of the water sample taken for analysis (mL).
2.5.4. Solids, Filterable Residue (FR) at 105 °C [30]
The filterable residue at 105 °C represents the mass of material that remains from the filtered water sample after evaporation and drying to a constant weight. It consists of dissolved organic and inorganic substances in the wastewater that are not volatile at 105 °C.
A 100 mL sample was filtered through low-porosity filter paper into a porcelain crucible that had been previously brought to a constant weight. The filtered sample was evaporated on a sand bath until complete evaporation, then dried in an oven at 105 °C until a constant weight was reached (the difference between two successive weightings should not exceed 0.0005 g).
The filterable residue dried at 105 °C is calculated using the formula FR = (m2 – m1) × 1000/V (mg/L), where m1 is the mass of the empty crucible (mg), m2 is the mass of the crucible with the filterable residue dried at 105 °C (mg), and V is the volume of the water sample taken for analysis (mL).
2.5.5. Dissolved Oxygen (DO) [31]
The determination of dissolved oxygen was performed using the iodometric method. This method involves fixing the dissolved oxygen in water onto easily oxidizable substances, specifically Mn(OH)2. For this purpose, 250 mL of water was treated with MnSO4 40% and an alkaline iodide solution (30 g NaOH + 15 g KI/100 mL). The resulting iodine was titrated with a Na2S2O3 0.025 N solution, with the amount of iodine produced being directly proportional to the amount of dissolved oxygen in the water. The amount of dissolved oxygen (DO), expressed in mg O2/L of water, was calculated using the formula DO = (V·f·CN·EOxygen)/(V1 − 4)·1000 (mg O2/L water), where V is the volume of Na2S2O3 0.025 N solution used in titration (mL), V1 is the volume of water used for determination (mL), f is the factor of the Na2S2O3 0.025 N solution used in titration, and Cn is the normal concentration of the Na2S2O3 solution.
2.5.6. Biochemical Oxygen Demand (BOD5) [32]
The BOD5 was determined based on the amount of oxygen consumed over 5 days by microorganisms in the water. Its value was calculated as the difference between the dissolved oxygen content measured immediately after sampling and that found after 5 days. The BOD5 was determined on an undiluted water sample using the formula BOD5 = m1 − m2 (mg/L), where m1 is the amount of dissolved oxygen in mg/L present in the water at the time of sampling, and m2 is the amount of dissolved oxygen in mg/L found in the water sample after 5 days.
2.5.7. Chemical Oxygen Demand (CODMn) [33]
The CODMn; was determined using the potassium permanganate method. Potassium permanganate oxidizes organic substances in water under acidic and heated conditions, and the excess permanganate is treated with oxalic acid. In an Erlenmeyer flask were introduced 100 mL of the water sample, 5 mL of H2SO4 (1:3), and 10 mL of KMnO4 (0.01N) were introduced. The reaction mixture was boiled for 10 min, then 10 mL of oxalic acid (0.01N) was added to decolorize the solution. The decolorized solution was then titrated with KMnO4 (0.01N). The was calculated using the formula CODMn; = {[(V + V1)·f − V2]·0.136·1000}/V3 (mg KMnO4/L), where V is the volume (mL) of potassium permanganate initially added to the sample, V1 is the volume (mL) of potassium permanganate 0.01N used for titration, V2 is the volume (mL) of oxalic acid added for decolorization, f is the factor of the potassium permanganate solution, 0.316 is the equivalent (mg) of KMnO4 per 1 mL of 0.01N KMnO4 solution, and V3 is the volume of the water sample analyzed (mL).
2.5.8. Sulfate Content [34]
The determination of sulfates was performed using the turbidimetric method, which is based on the precipitation of sulfate ions as barium sulfate by using BaCl2 as a precipitating reagent. The turbidity of the resulting solution was measured using a Lambda 20—Perkin Elmer UV/VIS Spectrophotometer (Waltham, MA, USA) at a wavelength of 420 nm, using cuvettes with an optical path length of 2.5 cm. The sulfate concentration in the water samples was determined based on the calibration curve previously prepared. The result was expressed in mg/L SO42−.
2.5.9. Metal Content [35]
For the determination of heavy metal content (Cu, Fe, Zn, Pb, Cd, As, Mn), water samples were analyzed using flame atomic absorption spectrometry with an atomic absorption spectrophotometer (AA700, Perkin Elmer, Waltham, MA, USA). The oxidant mixture used for flame generation was air–acetylene. To prepare the calibration curves, certified reference standard solutions (CertiPUR Merck, Darmstadt, Germany) were used.
The analysis of the samples was performed on water samples acidified with concentrated nitric acid (0.6 mL of concentrated nitric acid per 100 mL of sample) until pH ≤ 2, and then filtered through medium-porosity filter paper that was pre-washed with diluted nitric acid (d = 1.4, diluted 1:1). Both the preparation of calibration curves and the analysis of unknown samples were carried out at the specific wavelength for each metal analyzed, using cathode ray lamps for each metal: Cu—324.7 nm, Fe—372 nm, Zn—213.9 nm, Pb—283.3 nm, Cd—228.8 nm, As—193.7 nm, and Mn—279.5 nm. The metal content was determined based on the previously prepared calibration curves and was calculated using the formula Metal = c · r (mg/L), where c is the metal content in the measured solution (mg/L) and r is the dilution factor (100 mL/volume of the sample analyzed).
2.6. Zeolite Composition
The chemical composition of the zeolite was established using a Quant’X ARL energy-dispersive X-ray fluorescence spectrometer (XRF, Thermo Fisher Scientific, Waltham, MA, USA).
3. Results
3.1. Analysis of River Water in the Roșia Montană Area
Table 3, Table 4, Table 5, Table 6, Table 7, Table 8, Table 9, Table 10, Table 11 and Table 12 present the results for each of the 5 rivers analyzed in the Roșia Montană area, which are directly or indirectly affected by acid mine drainage from the mining galleries. These results are presented from upstream to downstream of the area of interest, aiming to identify the impact of mining activities on water quality.
Table 3.
Physico-chemical data recorded at three points along the Roșia Montană River, quarterly throughout the year.
Table 4.
The concentration of heavy metals recorded at the Roșia Montană River at 3 points, at 4 time points during a year.
Table 5.
Quality indicators recorded at the Săliște River at 2 points quarterly in a year.
Table 6.
The concentration of heavy metals recorded at the Săliște River at 2 points, at 4 time points during a year.
Table 7.
Physico-chemical data at 3 points recorded in the Corna River at 4 time points during a year.
Table 8.
The concentration of heavy metals recorded at 3 points at the Corna River, at 4 time points during a year.
Table 9.
Physico-chemical data at 4 points recorded in the Abrud River in 4 time points during a year.
Table 10.
The concentration of heavy metals recorded at 4 points at the Abrud River, at 4 time points during a year.
Table 11.
Physico-chemical data recorded at the Arieș River at 2 points, at 4 time points during a year.
Table 12.
The concentration of heavy metals recorded at the Arieș River at 2 points, at 4 time points during a year.
Sample 1A exhibits values for parameters such as pH, dissolved oxygen, biochemical oxygen demand, chemical oxygen demand, and sulfates that are within the normal range. However, downstream, in samples 1B and especially 1C, the results indicate significant water pollution. The higher values at point 1C can mainly be attributed to the discharge of mine water from the Gura Mine Gallery area, which is the main source of water pollution in the region. The remaining discharges are diffuse, caused by water seepage from various areas affected by mining activities in the area.
The pH values are below 6.5 (ranging from 2.69 to 3.87) at monitoring points 1B and 1C, indicating the acidic nature of the water.
The oxygen regime parameters in the river water show no significant variation; the obtained values are generally adequate for supporting aquatic ecosystems. However, the minimum value of 7.53 mg/L obtained at point 1C could be an indicator of the local stress for aquatic organisms, especially because it is accompanied by low pH and high chemical oxygen demand values. For BOD5, the values gradually increase, suggesting an accumulation of organic matter as one moves downstream or the influence of intermittent pollution sources. The CODMn values range from 16.3 to 25.0 mgO2/L, with an average around 20 mgO2/L. This range is characteristic of water with significant organic and chemical load, often exceeding the recommended limits for healthy aquatic ecosystems.
Sulfate values range from low concentrations at point 1A, typical of clean water (21.01–48.22 mg/L), to high concentrations at point 1B and extremely high concentrations at point 1C (>1000 mg/L, with a maximum of 3632 mg/L), indicating severe pollution of industrial origin and uncontrolled wastewater discharges, significantly affecting water quality and ecosystems.
The water quality of the Roșia Montană river shows significant heavy metal pollution at sampling points 1B and 1C, with concentrations of Fe2+, Zn2+, Pb2+, Cd2+, and As3+ much higher compared to point 1A. In general, at the source (1A), the recorded values are closer to safety limits, indicating major pollution upstream of point 1B and especially in the 1C area.
Analyzing the physico-chemical data from Table 5, it is observed that throughout the year, water quality in the Săliște River fluctuates more at monitoring point 2B, where organic pollution and sulfate concentrations are higher. In contrast, at point 2A, water quality remains relatively stable, with only moderate fluctuations in oxygen demand and sulfate levels.
The concentration of heavy metals in the Săliște River (Table 6) varies significantly throughout the year, with higher levels of metals such as Cu, Fe, Zn, Pb, Cd, and As observed in point 2B (middle of the river) compared to point 2A, particularly in May, while concentrations tend to decrease or stabilize by November at both sites.
The Corna River shows significant variations in water quality across its three sampling points (Table 7). At the source (River 3A), the water remains slightly acidic, with moderate levels of organic and chemical pollution, and an increase in sulfate concentrations throughout the year. In the middle section (River 3B), pollution is much higher, particularly in May, with elevated levels of organic and chemical oxygen demand, as well as sulfates. The outflow point (River 3C) shows better water quality, with more neutral pH, lower oxygen demand, and significantly reduced pollution levels, especially in terms of chemical oxygen demand and sulfates.
The concentration of heavy metals in the Corna River (Table 8) varies across three sampling points throughout the year. At River 3A (source), metal concentrations are generally low, with copper remaining below detection limits and iron decreasing from February to November. Zinc increases slightly over the year, while lead, cadmium, and arsenic concentrations remain very low. In River 3B (middle), copper and zinc concentrations rise in May and stabilize by November, while iron levels show fluctuations, and other metals remain low. At River 3C (outflow), zinc concentrations are notably higher, particularly in May, while copper is generally below detection limits, and other metals show low but detectable levels throughout the year.
The data reveal that water quality decreases as one moves downstream from the source to the Roșia Montană River. While point 4A (source) maintains relatively stable and better water quality, point 4B (before Săliște River) and point 4C (before Roșia Montană River) experience increasing pollution, particularly in terms of chemical and organic pollution. Point 4D (after Roșia Montană River) shows the most significant pollution, with high sulfate levels and lower oxygen content, indicating significant contamination, likely from mining and other industrial activities.
The heavy metal data from the Abrud River suggests that copper, iron, and zinc concentrations increase as the river flows downstream, particularly in River 4D (after Roșia Montană), where mining-related pollution contributes to higher concentrations. Lead, cadmium, and arsenic levels are consistently low or undetectable across all sites and times, indicating minimal contamination from these metals. Overall, pollution appears to increase downstream, especially in terms of iron and zinc, which are associated with mining activities in the area.
The Arieș River is the main water source in the area. Its course is affected by historical mining operations through the direct discharge of the Abrud River into the Arieș. Water samples were taken from the Arieș River before and after its confluence with the Abrud River.
The data for the Arieș River, recorded at two points, shows distinct seasonal variations. In point 5A (before the confluence with the Abrud River), the pH remains stable, ranging from 7.4 to 7.6, reflecting slightly alkaline conditions. The oxygen demand fluctuates between 12.13 mg/L in February and 11.76 mg/L in November, with biochemical oxygen demand (BOD5) varying from 5.45 mg/L in May to 6.13 mg/L in November. The chemical oxygen demand (COD) shows moderate variation, peaking at 19.7 mg/L in November and dropping to 15.6 mg/L in August. Sulfate concentrations rise significantly, from 12.5 mg/L in February to 36.14 mg/L in August, indicating possible pollution sources.
In point 1B (after the confluence with the Abrud River), the pH decreases slightly, ranging from 5.5 in November to 6.8 in May, indicating more acidic conditions. Oxygen demand decreases from 9.02 mg/L in February to 7.67 mg/L in November, but BOD5 remains relatively high, ranging from 6.09 mg/L in February to 7.02 mg/L in May. The chemical oxygen demand (COD) reaches its highest level in August at 24.1 mg/L and its lowest in May at 12.8 mg/L. Sulfate concentrations significantly increase, peaking at 125.6 mg/L in August, which suggests an elevated pollution level after the confluence with the Abrud River.
Overall, water quality seems to deteriorate downstream, especially after the confluence, as evidenced by higher sulfate levels and oxygen demand, particularly during the warmer months.
Due to the high concentration of pollutants contaminating the Abrud River, the obtained values demonstrate that it has a significant impact on the Arieș River, which is also polluted.
The heavy metal concentrations recorded at the Arieș River show significant variations over the year at two points. In point 5A, Cu has the highest concentration of 1.4 µg/L in November, Fe reached 1.08 mg/L in August, while Zn was highest at 162.6 µg/L in May. The concentrations of Pb and Cd increased at 0.63 µg/L and 0.51 µg/L in November, while As attained the maximum level of 0.10 µg/L in August.
In point 5B, copper peaked at 4.4 µg/L in May, iron reached 3.099 mg/L in May, and zinc was highest at 172.1 µg/L in May. Lead peaked at 1.12 µg/L in August, cadmium reached 2.20 µg/L in May, and arsenic was highest at 0.11 µg/L in August. Overall, heavy metal concentrations were higher in River 5B, particularly for copper, zinc, and cadmium. The iron concentration plays a key role in the reddish coloration of the water.
3.2. Mine Water Analysis
For the treatment of acidic water from the Gura Roșiei Gallery with zeolite, the study aimed to identify the potential of natural zeolite from Rupea to retain Fe, Zn, and Mn ions from wastewater. To this end, the basic physico-chemical parameters of the water were determined, as presented in Table 13.
Table 13.
The obtained values for the mine water analysis from the Gura Roșiei Gallery.
These parameters in Table 13 highlight the high degree of contamination with significant concentrations of heavy metals, mainly Fe, Mn, and Zn, whose concentrations exceed more than 38 to 424 times the maximum consent limits established by the Romanian legislation [38]
3.3. Zeolite Analysis
The XRF analysis of the natural zeolite used in this study showed that it contains significant amounts of SiO2 (70.93%) and Al2O₃ (16.21%), as well as various other oxides, such as: CaO (4.72%), K2O (3.69%), Fe2O3 (2.82%), MgO (0.46%), Na2O (0.45%), TiO2 (0.25%), BaO (0.10%), and MnO (0.05%) [39]. The loss on ignition was 0.21%.
3.4. Removal of Heavy Metal from Acid Mine Water Using Natural Zeolite
The study examines the use of zeolite for treating mine water to reduce pollution and improve environmental quality. In order to determine the influence of the natural zeolite dose and the contact time on the retention process of metals ions (Fe, Zn, and Mn) from acid water collected from the exit of the Gura Roșiei mine, the amount of zeolite was varied from 7.5 g to 20 g, using a constant volume of 100 mL of mine water with continuous stirring at 300 rpm. The variation in the concentrations of iron, zinc, and manganese ions in the acid mine drainage during its contact time with different quantities of natural zeolite is presented in Figure 4, Figure 5 and Figure 6.
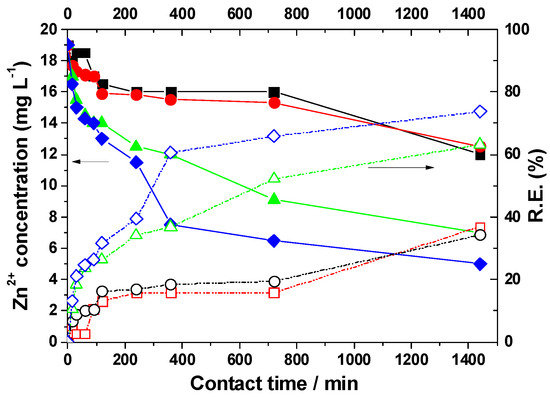
Figure 4.
Influence of zeolite dosage on residual zinc concentrations in acid mine drainage and on removal efficiency after different contact times. Zeolite dosage (g): (■) 7.5; (●) 10; (▲) 15; and (♦) 20. (−−−−) Residual concentration data. (- - - -) Removal efficiency data.
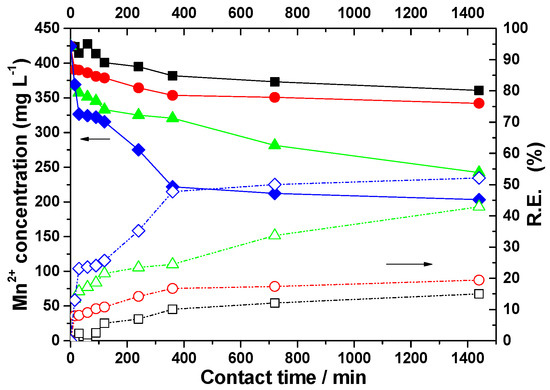
Figure 5.
Influence of zeolite dosage on residual manganese concentrations in acid mine drainage and on removal efficiency after different contact times. Zeolite dosage (g): (■) 7.5; (●) 10; (▲) 15; and (♦) 20. (−−−−) Residual concentration data. (- - - -) Removal efficiency data.
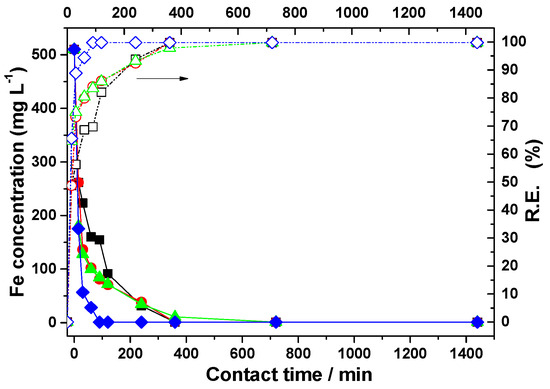
Figure 6.
Influence of zeolite dosage on residual iron concentrations in acid mine drainage and on removal efficiency after different contact times. Zeolite dosage (g): (■) 7.5; (●) 10; (▲) 15; and (♦) 20. (−−−−) Residual concentration data. (- - - -) Removal efficiency data.
The concentration of Zn2+ in the acid mine drainage in contact with a 7.5 g dose of natural zeolite decreases from an initial value of 19.0 mg/L to 12.5 mg/L. As the zeolite dose increases, the removal efficiency also improves. Thus, for a 20 g dose of zeolite, after 1440 min, the concentration reaches 5.0 mg/L.
Regarding the concentration of Mn ions in the samples in contact with natural zeolite, regardless of the applied dose, a much lower removal efficiency was observed. The most notable result was for the 20 g zeolite dose, where the Mn ions were reduced by half, from 424.5 mg/L to 203.3 mg/L.
The concentration of Fe ions decreased from 510 mg/L to 91.5 mg/L after a contact time of 120 min with zeolite at the lowest dose, and after 360 min, the Fe concentration reaches values below 1 mg/L, which are within the limits established by current regulations (5 mg/L).
As the zeolite dose increased from 7.5 g to 10 g, the Fe ions concentration decreased to 1 mg/L after 360 min of contact. However, the concentrations of Mn2+ and Zn2+ ions remained high. Based on the obtained data, it was concluded that increasing the zeolite dose to 10 g does not lead to a significant improvement in the retention process of Mn and Zn ions.
By treating the acidic mine water with 15 g of zeolite, a one-third reduction in the Fe concentration was observed, decreasing from the initial value to 175.5 mg/L after the first 15 min of contact. After a longer contact time, over 60 min, the concentration of Fe ions reached 1 ppm. However, the concentrations of Mn and Zn ions in the collected supernatants remained high, even at the 15 g zeolite dose. A slow decrease was observed, with Mn2+ reaching a concentration of 242.4 mg/L after 1440 min of contact. Regarding the Zn ion concentration, a decrease from 19.0 mg/L to 7.0 mg/L was noticed after 1440 min.
Increasing the zeolite dose to 20 g results in an improvement in the removal process of Mn and Zn metal ions.
4. Discussion
Starting in 1998, the Romanian government approved the permanent closure, conservation, and post-closure environmental monitoring of 556 mines [40]. According to the Mining Law [41], a company cannot abandon a mining project without fulfilling its legal obligations for environmental rehabilitation, implementing a closure and post-closure monitoring plan, and providing financial guarantees for these measures. However, at Roșia Montană, there are over 300 km of mines, dating from ancient times through the Middle Ages to the present day, representing a significant historical and cultural heritage [42].
Acid mine drainage represents a significant pollution problem of the watercourses in the area (Figure 7), and mine closure measures must prevent the contamination of water sources and minimize the negative environmental impact. Thus, ecological restoration programs included in mine closure plans incorporate specific measures for controlling and treating acid mine drainage [43].
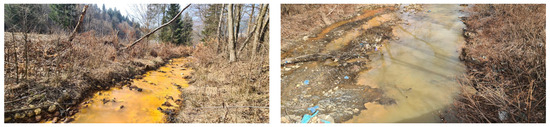
Figure 7.
Photographs showing stream waters from the investigated area (Roșia Montană) contaminated with acid mine drainage.
Our results confirm that the significant pollution of the rivers in the Roșia Montană area, as demonstrated in other studies [44], is primarily caused by the influx of arsenic, cadmium, chromium, selenium, and sulfate ions, as well as the acidic pH of certain tributaries that wash the mining galleries. The poor ecological status of the rivers in the area is mainly due to the tributaries coming from the old mining areas, where very acidic water loaded with heavy metals flows [45].
The Roșia Montană mining area is known for its gold and silver mineral resources, while Roșia Poieni is notable for its copper deposits. As a result, the Arieș River basin is more vulnerable due to the presence of historical mining activities and industrial waste deposits, which have led to water contamination with heavy metals and toxic substances [46]. This can affect water quality, biodiversity, and the health of the aquatic ecosystem, having a significant impact on the environment and the local communities. Numerous studies have analyzed the state of the watershed [47,48] while also researching various mine water decontamination techniques and the consequences of these environmental issues [49,50].
Our findings are in accordance with Neamtiu et al. [11], who indicated through their analysis of mine water that it is acidic and contains large amounts of metal ions, significantly exceeding the limit values set by regulations for industrial and urban wastewater discharge [51]. Practically, exceedances were recorded for the values of iron, manganese, and zinc. Studies conducted by Bálintová et al. [52] and Hudson-Edwards et al. [53] in areas with intense mining activity have shown similar or even higher concentrations of heavy metals—particularly iron, zinc, and arsenic—in regions affected by acid mine drainage. Additionally, recent research carried out in the Baia Mare region [54] revealed a comparable pattern of pH decline and sulfate accumulation downstream of discharge points, confirming the trends observed in the Roșia Montană and Corna rivers. The presence of arsenic in elevated concentrations, combined with low pH and high chemical oxygen demand values, is considered a strong indicator of ecotoxicological risk, a point emphasized in studies by Jiao et al. [55]. Therefore, the findings of this study complement and support the existing body of knowledge on aquatic ecosystem degradation in mining areas, while also highlighting the urgent need for remediation measures.
The results obtained are in accordance with the research of Brăhaița [56], which identified similar contamination levels in mine water, particularly for these metals, and uses limestone and plants to purify them.
The research performed with different doses of zeolite for a certain time showed a decrease in the concentration of metal ions in the acidic mine water with the increase in the natural zeolite dose, and with the increase in contact time. The low efficiency of zeolite in retaining Mn and Zn ions from acid mine water is due to the pH of 2.9 of the mine water. The removal of metal ions is inhibited due to the competition for the active sites of the zeolite between these ions and H⁺ ions, as it is well known that zeolites preferentially adsorb H⁺ ions from the solution, in larger quantities when the solution’s acidity is high [57].
The mechanism of metal ion removal from acidic mine water occurs through ion exchange and adsorption. However, the possibility of iron precipitation in the form of hydroxide should not be excluded, as traces of precipitate have been observed in some cases, especially at long contact times between the zeolite and wastewater [58]. The results indicated that the efficiency of zeolite in retaining Fe, Mn, and Zn ions from acidic mine water is high at the beginning. The lower efficiency at longer contact times may be a consequence of the reduced diffusion of cations into the pores of natural zeolite [59]. Thus, the adsorption/ion exchange process of the investigated metal ions occurs rapidly, especially in the first 120 min, due to the availability of the zeolite’s active sites to participate in the process. The difference between the concentration of metal cations in the acidic mine water and their concentration at the solid–liquid interface is high at the beginning of the experiment, which may also lead to high adsorption rates [60].
The experimental data were processed and analyzed using MATLAB software2024b, resulting in the development of a statistical mathematical model that characterizes the variation in metal concentration in acid mine water as a function of zeolite dosage over time for each of the studied samples.
Figure 8, Figure 9 and Figure 10 illustrate the surfaces representing the correlation between the three variables: dissolved metal concentration, applied zeolite dosage, and contact time for adsorption. The surface model was constructed using real experimental data. The graphical representation facilitated the development of a mathematical model to elucidate the relationships between the experimental variables and to identify general trends in the variation in dissolved metal concentrations (Fe, Zn, and Mn).
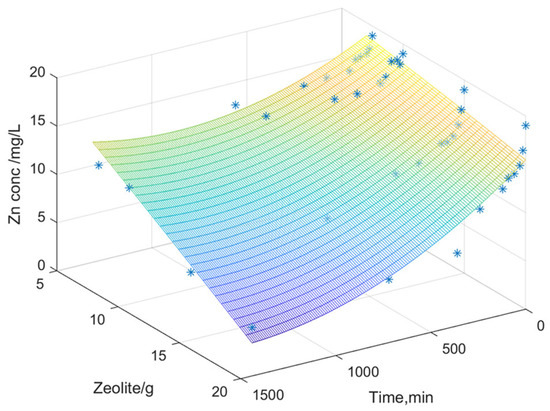
Figure 8.
Variation in the zinc content depending on the zeolite dosage and its contact time.
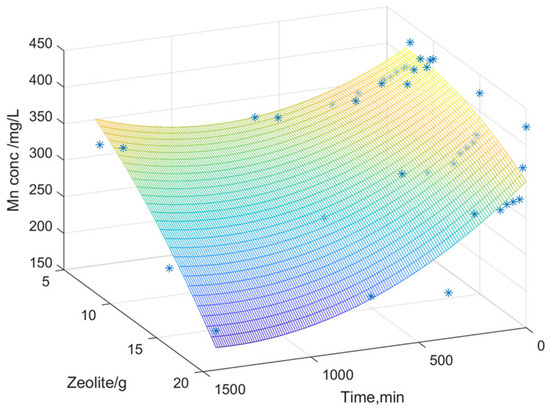
Figure 9.
Variation in the manganese content depending on the zeolite dosage and its contact time.
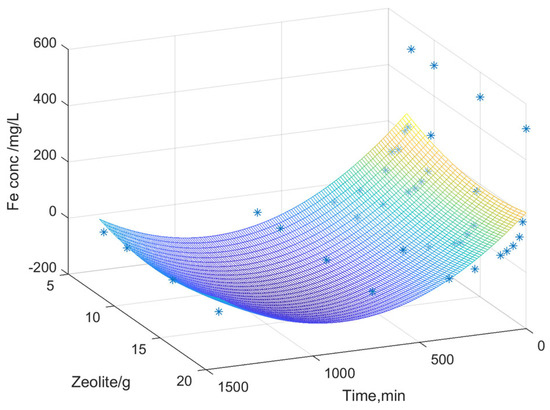
Figure 10.
Variation in the iron content depending on the zeolite dosage and its contact time.
The interpolation performed predicts values based on the experimental data obtained, generating a surface that represents a mathematical model of the values derived from the experimental analyses. The color gradient indicates variations in dissolved metal concentration as a function of zeolite dose over time (contact time between zeolite and acidic mine water). A second-order polynomial equation was chosen, where Z represents the dissolved metal concentration, X is the contact time, and Y is the zeolite dose used.
The equations and the concordance indicators for the statistical models obtained are presented in Table 14 and Table 15.
Table 14.
Equations of statistical models that describe the variation in metals as a function of zeolite dose over time.
Table 15.
The statistical concordance indicators of the equations of the obtained models.
The equations of the statistical models obtained are valid within the studied domain and can effectively serve as tools for predictive analysis [61,62].
These indicators help to evaluate the performance of the models and to better understand the phenomena and transformations in the metal adsorption process by zeolite. In the case of zinc and manganese, a good correlation is observed between the experimental values and the proposed equation, as indicated by the high correlation coefficient.
5. Conclusions
Mining activities in the Roșia Montană area have a significant impact on the water quality of the rivers in the Aries basin, polluting the environment with heavy metals and affecting aquatic ecosystems. The study monitored essential water quality parameters such as pH, dissolved oxygen, biochemical and chemical oxygen demand, sulfates, and heavy metals, providing valuable insights into the extent and sources of pollution in the area. The recorded values indicate a clear trend of water quality degradation downstream, an aspect that correlated with the identified sources of pollution in the area. Significant differences between the values recorded at the source and those at the confluence points highlight the influence of mining activities on water quality. A progressive increase in the concentration of heavy metals is observed, a phenomenon reflecting the negative impact of acid mine drainage on the aquatic ecosystem.
Over the course of a hydrological year, the data suggest the existence of moderate seasonal variability, with maximum values occurring during the warmer months, most probably due to the reduced flow rates and increased evaporation. Dissolved oxygen indicators generally remain within normal limits; however, their combination with acidic pH and high chemical oxygen demand may affect sensitive aquatic fauna. The presence of sulfates in very high concentrations, especially at discharge points, is a clear sign of severe anthropogenic pollution. Beyond natural variations, the large differences between the monitoring points reveal the significant contribution of contaminated waters originating from mining galleries. The analysis of heavy metals shows important exceedances of the maximum allowable values, especially for iron, zinc, and arsenic, in areas located near the pollution sources. Compared to the other rivers analyzed, Corna and Roșia Montană show the greatest deviations from higher quality classes, suggesting increased vulnerability.
At the same time, the results showed that the use of zeolite in the process of decontaminating acid mine water is effective, significantly reducing heavy metal concentrations. Based on these observations, zeolite proves to be a promising solution for treating contaminated water from mining areas, contributing to the improvement of water quality and the protection of ecosystems.
The study highlights the importance of constant monitoring of the water quality parameters and the implementation of effective treatment methods to reduce the negative impact of mining activities on the environment.
Author Contributions
Conceptualization, M.G. and R.B.; methodology, S.V.; software, G.-A.D.; validation, S.V., G.-A.D. and M.P.; formal analysis, R.B.; investigation, M.-T.C.; resources, M.-T.C.; data curation, M.-T.C.; writing—original draft preparation, M.G.; writing—review and editing, M.G.; visualization, S.V.; supervision, M.P.; project administration, M.G.; funding acquisition, R.B. All authors have read and agreed to the published version of the manuscript.
Funding
This research received no external funding.
Institutional Review Board Statement
Not applicable.
Informed Consent Statement
Not applicable.
Data Availability Statement
Data are contained within the article.
Acknowledgments
The authors would like to express their sincere gratitude to Eleolit S.A. Company from Rupea, Brașov County, Romania, for their generous donation of zeolite, which was essential for the successful completion of the experimental work. Their support is greatly appreciated.
Conflicts of Interest
The authors declare no conflicts of interest.
References
- Worlanyo, A.S.; Li, J. Evaluating the environmental and economic impact of mining for post-mined land restoration and land-use: A review. J. Environ. Manag. 2021, 279, 111623. [Google Scholar] [CrossRef] [PubMed]
- Rambabu, K.; Banat, F.; Pham, Q.M.; Ho, S.H.; Ren, N.Q.; Show, P.L. Biological remediation of acid mine drainage: Review of past trends and current outlook. Environ. Sci. Ecotechnol. 2020, 2, 100024. [Google Scholar] [CrossRef]
- Pollard, S. The Central European Mining Regions in the Early Modern Period. In Marginal Europe: The Contribution of Marginal Lands Since the Middle Ages; Oxford Academic: Oxford, UK, 1997. [Google Scholar] [CrossRef]
- Radebe, N.; Chipangamate, N. Mining industry risks, and future critical minerals and metals supply chain resilience in emerging markets. Resour. Policy 2024, 91, 104887. [Google Scholar] [CrossRef]
- Northey, S.A.; Mudd, G.M.; Saarivuori, E.; Wessman-Jääskeläinen, H.; Haque, N. Water footprinting and mining: Where are the limitations and opportunities? J. Clean. Prod. 2016, 135, 1098–1116. [Google Scholar] [CrossRef]
- Popa, M.; Glevitzky, M.; Popa, D.; Varvara, S.; Dumitrel, G.-A. Study on soil pollution with heavy metals near the river Ampoi, the Alba County. J. Environ. Prot. Ecol. 2012, 13, 2123–2129. [Google Scholar]
- Sharifi, S.A.; Zaeimdar, M.; Jozi, S.A.; Hejazi, R. Effects of Soil, Water and Air Pollution with Heavy Metal Ions Around Lead and Zinc Mining and Processing Factories. Water Air Soil Pollut. 2023, 234, 760. [Google Scholar] [CrossRef]
- Matebese, F.; Mosai, A.K.; Tutu, H.; Tshentu, Z.R. Mining wastewater treatment technologies and resource recovery techniques: A review. Heliyon 2024, 10, e24730. [Google Scholar] [CrossRef]
- Popa, M.; Dumitrel, G.-A.; Glevitzky, M.; Popa, D.-V. Anthropogenic Contamination of Water From Galda River—Alba County, Romania. Agric. Agric. Sci. Procedia 2015, 6, 446–452. [Google Scholar] [CrossRef][Green Version]
- Masindi, V.; Foteinis, S.; Renforth, P.; Ndiritu, J.; Maree, J.P.; Tekere, M.; Chatzisymeon, E. Challenges and avenues for acid mine drainage treatment, beneficiation, and valorisation in circular economy: A review. Ecol. Eng. 2022, 183, 106740. [Google Scholar] [CrossRef]
- Neamtiu, I.A.; Al-Abed, S.R.; McKernan, J.L.; Baciu, C.L.; Gurzau, E.S.; Pogacean, A.O.; Bessler, S.M. Metal contamination in environmental media in residential areas around Romanian mining sites. Rev. Environ. Health 2017, 32, 215–220. [Google Scholar] [CrossRef]
- Dumitrel, G.A.; Glevitzky, M.; Popa, M.; Vica, M.L. Studies regarding the heavy metals pollution of streams and rivers in Rosia Montana Area, Romania. J. Environ. Prot. Ecol. 2015, 16, 850–860. [Google Scholar]
- Wolkersdorfer, C.; Mugova, E. Effects of Mining on Surface Water. In Encyclopedia of Inland Waters, 2nd ed.; Mehner, T., Tockner, K., Eds.; Elsevier: Amsterdam, The Netherlands, 2022; pp. 170–188. [Google Scholar] [CrossRef]
- Mustafa, S.A.; Al-Rudainy, A.J.; Salman, N.M. Effect of environmental pollutants on fish health: An overview. Egypt. J. Aquat. Res. 2024, 50, 225–233. [Google Scholar] [CrossRef]
- Nyquist, J.; Greger, M. A field study of constructed wetlands for preventing and treating acid mine drainage. Ecol. Eng. 2009, 35, 630–642. [Google Scholar] [CrossRef]
- Grifasi, N.; Ziantoni, B.; Fino, D.; Piumetti, M. Fundamental properties and sustainable applications of the natural zeolite clinoptilolite. Environ. Sci. Pollut. Res. 2024. [Google Scholar] [CrossRef]
- Souza, I.M.S.; García-Villén, F.; Viseras, C.; Perger, S.B.C. Zeolites as Ingredients of Medicinal Products. Pharmaceutics 2023, 15, 1352. [Google Scholar] [CrossRef]
- Senila, M.; Cadar, O. Modification of natural zeolites and their applications for heavy metal removal from polluted environments: Challenges, recent advances, and perspectives. Heliyon 2024, 10, e25303. [Google Scholar] [CrossRef] [PubMed]
- Pérez-Botella, E.; Valencia, S.; Rey, F. Zeolites in Adsorption Processes: State of the Art and Future Prospects. Chem. Rev. 2022, 122, 17647–17695. [Google Scholar] [CrossRef]
- Buzukashvili, S.; Sommerville, R.; Rowson, N.A.; Waters, K.E. An overview of zeolites synthesised from coal fly ash and their potential for extracting heavy metals from industrial wastewater. Can. Metall. Q. 2023, 63, 130–152. [Google Scholar] [CrossRef]
- Coman, M.; Oros, V.; Miloiu, E.; Taro, G.; Pop, R. Phytoremediation Possibilities for Contaminated Mining Areas from Romania. ProEnvironment 2009, 2, 203–207. [Google Scholar]
- Vințan, P.D. Theoretical and Experimental Research on Treatment and Monitoring Installations for Polluted Water Discharged from Closed and Rehabilitated Mining Waste Sites and Deposits. Ph.D. Thesis, University of Petroșani, Petroșani, Romania, 23 November 2019. (In Romanian). [Google Scholar]
- Zanin, E.; Scapinello, J.; de Oliveira, M.; Lazarotto Rambo, C.; Franscescon, F.; Freitas, L.; Muneron de Mello, J.M.; Fiori, M.A.; Oliveira, J.V.; Dal Magro, J. Adsorption of heavy metals from wastewater graphic industry using clinoptilolite zeolite as adsorbent. Process Saf. Environ. Prot. 2017, 105, 194–200. [Google Scholar] [CrossRef]
- Rakhym, A.B.; Seilkhanova, G.A.; Kurmanbayeva, T.S. Adsorption of lead (II) ions from water solutions with natural zeolite and chamotte clay. Mater. Today Proc. 2020, 31, 482–485. [Google Scholar] [CrossRef]
- Baciu, C.; Goossens, M.; Reusen, I.; Tote, C.; Delalieux, S.; Raymaekers, D.; Dobrota, C.; Pop, C.; Varga, I.; Roba, C.; et al. Report on Rosia Montana Case Study Investigations—Version 2. 2012. Available online: https://impactmin.geonardo.com/downloads/impactmin_d73.pdf (accessed on 3 March 2025).
- UNESCO World Heritage Centre—Decision 44 COM 8B.26 Roșia Montană Mining Landscape (Romania). Available online: https://whc.unesco.org/en/decisions/7945/accesed15.12.2024 (accessed on 15 December 2024).
- The Cadastral Atlas of Waters in Romania. Part 1—Hydro-Morphological Data on the Surface Hydrographic Network (In Romanian); National Water Council, Institute of Meteorology and Hydrology: Bucharest, Romania, 1992; Available online: http://www.geomorphologyonline.com/students_materials/GFR/books/1992_Atlasul-Cadastrului-Apelor-Din-Romania.zip (accessed on 12 May 2025).
- About Zeolite. Available online: https://zeolitesproduction.com/despre-zeolit/ (accessed on 10 December 2024).
- SR EN 872:2005; Water quality—Determination of Suspended Solids—Method by Filtration Through Glass Fibre Filters. BSI: London, UK, 2005. Available online: https://e-standard.eu/Search?q=872%3A2005+ (accessed on 1 May 2024).
- STAS 9187:1984; Surface, Underground and Waste Waters. Residuum Determination. ASRO: Bucharest, Romania, 1984; (In Romanian). Available online: https://e-standard.eu/en/standard/16815 (accessed on 3 May 2024).
- SR EN 25813:2000; Water Quality. Determination of Dissolved Oxygen. Iodometric Method. ASRO: Bucharest, Romania, 2000; (In Romanian). Available online: https://e-standard.eu/en/standard/25490 (accessed on 3 May 2024).
- SR EN 1899-2:2002; Water Quality—Determination of Biochemical Oxygen Demand After n Days (BODn)—Part 2: Method for Undiluted Samples (ISO 5815:1989, Modified). ASRO: Bucharest, Romania, 2002; (In Romanian). Available online: https://e-standard.eu/en/standard/27527 (accessed on 3 May 2024).
- SR EN ISO 8467:2001; Water Quality. Determination of Permanganate Index. International Organization for Standardization: Geneva, Switzerland, 2001. Available online: https://e-standard.eu/en/standard/26286 (accessed on 3 May 2024).
- APHA Method 4500-SO42−: Standard Methods for the Examination of Water and Wastewater. Available online: https://law.resource.org/pub/us/cfr/ibr/002/apha.method.4500-so42.1992.pdf (accessed on 6 May 2024).
- Glevitzky, M.; Bostan, R.; Vică, M.L.; Dumitrel, G.-A.; Corcheş, M.-T.; Popa, M.; Glevitzky, I.; Matei, H.-V. Environmental Contamination and Mining Impact: Physico-Chemical and Biological Characterization of Propolis as an Indicator of Pollution in the Roșia Montană Area, Romania. Plants 2025, 14, 866. [Google Scholar] [CrossRef] [PubMed]
- Order No. 161/2006—The Norm Regarding the Classification of Surface Water Quality in Order to Establish the Ecological Status of Water Bodies. (In Romanian). Available online: https://legislatie.just.ro/Public/DetaliiDocumentAfis/72574 (accessed on 4 October 2023).
- European Parliament; Council of the European Union. Directive 2000/60/EC of the European Parliament and of the Council of 23 October 2000 Establishing a Framework for Community Action in the Field of Water Policy; Official Journal of the European Communities: Brussels, Belgium, 2000; Volume L327, pp. 1–72. [Google Scholar]
- NTPA-001/28.02.2002; Norms Concerning the Limits for Pollutant Loads in Industrial and Municipal Wastewater Discharged into Natural Receiving Bodies (In Romanian), Official Gazette of Romania, No. 187 of 20 March 2002. Available online: https://novainstal.ro/legislatie-mediu/normativ-ntpa-001-2002/ (accessed on 12 May 2025).
- Varvara, S.; Popa, M.; Bostan, R.; Damian, G. Preliminary Considerations on the Adsorption of Heavy Metals from Acidic Mine Drainage Using Natural Zeolite. J. Environ. Prot. Ecol. 2013, 14, 1506–1514. [Google Scholar]
- Radu, V.M.; Vîjdea, A.M.; Ivanov, A.A.; Alexe, V.E.; Dincă, G.; Cetean, V.M.; Filiuță, A.E. Research on the Closure and Remediation Processes of Mining Areas in Romania and Approaches to the Strategy for Heavy Metal Pollution Remediation. Sustainability 2023, 15, 15293. [Google Scholar] [CrossRef]
- Mining Law No. 85 of 18 March 2003, The Parliament of Romania, Published in: The Official Gazette No. 197 of 27 March 2003. Available online: https://legislatie.just.ro/Public/DetaliiDocument/42627 (accessed on 11 October 2024).
- Apostol, O.; Mäkelä, H.; Vinnari, E. Cultural sustainability and the construction of (in)commensurability: Cultural heritage at the Roşia Montană mining site. Crit. Perspect. Account. 2023, 97, 102577. [Google Scholar] [CrossRef]
- Anekwe, I.M.S.; Isa, Y.M. Bioremediation of acid mine drainage—Review. Alex. Eng. J. 2023, 65, 1047–1075. [Google Scholar] [CrossRef]
- Bănăduc, D.; Curtean-Bănăduc, A.; Cianfaglione, K.; Akeroyd, J.R.; Cioca, L.-I. Proposed Environmental Risk Management Elements in a Carpathian Valley Basin, within the Roşia Montană European Historical Mining Area. Int. J. Environ. Res. Public Health 2021, 18, 4565. [Google Scholar] [CrossRef] [PubMed]
- Viktorovich Larionov, M.; Haykaram Galstyan, M.; Garnik Ghukasyan, A.; Gagik Matevosyan, L.; Lendrush Hakobjanyan, I.; Arayik Gharibyan, P.; Yakhsibek Sayadyan, H.; Shahen Sargsyan, K. The ecological and sanitary-hygienic assessment of the river systems located in the technogenic polluted zone of the Caucasus. Egypt. J. Aquat. Res. 2024, 50, 189–199. [Google Scholar] [CrossRef]
- Friedel, M.J.; Tindall, J.A.; Sardan, D.; Fey, D.; Poptua, G.L. Reconnaissance Study of Water Quality in the Mining-Affected Aries River Basin, Romania. In U.S. Geological Survey Open-File Report; U.S. Geological Survey: Reston, VA, USA, 2008; p. 40. [Google Scholar]
- Bird, G.; Brewer, P.A.; Macklin, M.G.; Serban, M.; Balteanu, D.; Driga, B. Heavy metal contamination in the Arieş river catchment, western Romania: Implications for development of the Roşia Montană gold deposit. J. Geochem. Explor. 2005, 86, 26–48. [Google Scholar] [CrossRef]
- Levei, E.A.; Șenilă, M.; Miclean, M.; Abraham, B.; Roman, C.; Ștefănescu, L.; Moldovan, O.T. Influence of Rosia Poieni and Rosia Montana Mining Areas on the Water Quality of the Aries River. Environ. Eng. Manag. J. 2011, 10, 23–29. [Google Scholar] [CrossRef]
- Yang, Y.; Li, B.; Li, T.; Liu, P.; Zhang, B.; Che, L. A review of treatment technologies for acid mine drainage and sustainability assessment. J. Water Process Eng. 2023, 55, 104213. [Google Scholar] [CrossRef]
- Mosai, A.K.; Ndlovu, G.; Tutu, H. Improving acid mine drainage treatment by combining treatment technologies: A review. Sci. Total Environ. 2024, 919, 170806. [Google Scholar] [CrossRef]
- Decision No. 188 of 28 February 2002—Regulation on Establishing Pollutant Load Limits for Industrial and Urban Wastewater Discharged into Natural Receptors—NTPA 001/2002. Available online: https://legislatie.just.ro/Public/DetaliiDocument/98308 (accessed on 10 October 2024).
- Bálintová, M.; Singovszká, E.; Holub, M.; Demčák, Š. Influence of Acid Mine Drainage on Surface Water Quality. Water Resources in Slovakia: Part I. The Handbook of Environmental Chemistry; Negm, A., Zeleňáková, M., Eds.; Springer: Cham, Switzerland, 2018; Volume 69. [Google Scholar] [CrossRef]
- Hudson-Edwards, K.A.; Macklin, M.G.; Brewer, P.A.; Dennis, I.A. Science Report—Assessment of Metal Mining—Contaminated River Sediments in England and Wales. Available online: https://assets.publishing.service.gov.uk/media/5a7ba7dae5274a7318b90115/scho1108bozd-e-e.pdf (accessed on 2 April 2025).
- Sur, I.M.; Moldovan, A.; Micle, V.; Polyak, E.T. Assessment of Surface Water Quality in the Baia Mare Area, Romania. Water 2022, 14, 3118. [Google Scholar] [CrossRef]
- Jiao, Y.; Zhang, C.; Su, P.; Tang, Y.; Huang, Z.; Ma, T. A review of acid mine drainage: Formation mechanism, treatment technology, typical engineering cases and resource utilization. Process Saf. Environ. Prot. 2023, 170, 1240–1260. [Google Scholar] [CrossRef]
- Brăhaița, I.-D. Passive Remedy Techniques for Acid Mining Waters Using Limestone and Plant. Ph.D. Thesis, “BABEŞ-BOLYAI” University Cluj-Napoca, Cluj-Napoca, Romania, 2020. (In Romanian). [Google Scholar]
- Motsi, T. Remediation of Acid Mine Drainage Using Natural Zeolite. Ph.D. Thesis, University of Birmingham, Birmingham, UK, March 2010. [Google Scholar]
- Xu, W.; Yang, H.; Mao, Q.; Luo, L.; Deng, Y. Removal of Heavy Metals from Acid Mine Drainage by Red Mud–Based Geopolymer Pervious Concrete: Batch and Long–Term Column Studies. Polymers 2022, 14, 5355. [Google Scholar] [CrossRef]
- Damian, G.; Varvara, S.; Bostan, R. Preliminary Investigations on the Use of Different Natural Sorbents for Removal of Heavy Metal from Acid Mine Drainage (Case Study: “Larga de Sus” Mine). Young Sci. J. 2013, 1, 95–104. [Google Scholar]
- Motsi, T.; Rowson, N.A.; Simmons, M.J.H. Adsorption of heavy metals from acid mine drainage by natural zeolite. Int. J. Miner. Process 2009, 92, 42–48. [Google Scholar] [CrossRef]
- Popa, M.; Glevitzky, I.; Dumitrel, G.-A.; Popa, D.; Virsta, A.; Glevitzky, M. Qualitative analysis and statistical models between spring water quality indicators in Alba County, Romania. Sci. Papers. Ser. E. Land Reclam. Earth Obs. Surv. Environ. Eng. 2022, 11, 358–366. [Google Scholar]
- Gluck, A. Mathematical Methods in the Chemical Industry; Tehnică Publishing House: Bucureşti, Romania, 1971; pp. 58–61. (In Romanian) [Google Scholar]
Disclaimer/Publisher’s Note: The statements, opinions and data contained in all publications are solely those of the individual author(s) and contributor(s) and not of MDPI and/or the editor(s). MDPI and/or the editor(s) disclaim responsibility for any injury to people or property resulting from any ideas, methods, instructions or products referred to in the content. |
© 2025 by the authors. Licensee MDPI, Basel, Switzerland. This article is an open access article distributed under the terms and conditions of the Creative Commons Attribution (CC BY) license (https://creativecommons.org/licenses/by/4.0/).