Abstract
Elevated fluoride levels in drinking water pose a significant health risk for communities relying on groundwater in the Ethiopian Central Rift Valley. This study aims at characterizing real groundwater samples from the Ethiopian Central Rift Valley and evaluating the performance of an integrated membrane process based on reverse osmosis (RO) and membrane crystallization (MCr) for fluoride removal and its recovery as mixed fluoride salts. Groundwater analysis revealed fluoride concentrations of 20.8 mgL−1 at the Meki-01 site and 22.7 mgL−1 at the Meki-02 site, both exceeding the WHO guideline of 1.5 mgL−1. In addition, total dissolved solids exceeded 1000 mgL−1 at both sites, classifying the water as brackish. A commercial RO membrane demonstrated excellent fluoride and ion rejection, with fluoride removal rates exceeding 99%. The total dissolved solids (TDS) removal efficiency reached 89%. The mean water permeability of the membrane was 4.52 Lm−2h−1bar−1. The retentate produced in the RO unit reached a concentration of 70 mgL−1, which was then treated using osmotic membrane distillation–crystallization (OMD-Cr) and/or vacuum membrane crystallization (VM-Cr). This process facilitated the recovery of mixed salts while achieving an almost zero-liquid discharge. The study confirms the successful removal of fluoride and its recovery as mixed salt, along with the recovery of water in an environmentally friendly and manageable way.
1. Introduction
The demand for freshwater supply is continuously increasing due to population growth, global warming, and the geography of our planet [1]. Groundwater is the primary drinking water source for many populations, particularly in developing countries with decentralized water systems [2,3]. However, it can be contaminated by organic and inorganic substances, as well as disease-causing microorganisms. Inorganic contamination often involves ions such as chloride, sulfate, arsenate, fluoride, and heavy metals [4].
Fluoride is a reactive natural element that can enter water systems through the weathering of fluoride-rich minerals and human activities [5,6]. Fluorine compounds are essential in various industries, including semiconductors, pharmaceuticals, fertilizers, metallurgy, phosphate production, glass manufacturing, and nuclear applications [7]. Due to both natural and human activities, water sources can have higher fluoride concentrations [8].
Fluoride contamination in drinking water is a global issue that can lead to serious health problems [9]. The World Health Organization (WHO) has established two maximum fluoride concentration levels: 1 mgL−1 for cooler climates and 1.5 mgL−1 for warmer climates [10]. This distinction arises from the higher water consumption in warmer regions [11,12]. WHO’s recommendation of 1.5 mgL−1 is based on a daily water intake of 2 L. Fluorosis is widespread in at least 25 countries, particularly in India, China, and parts of Africa. As of 2004, millions have been affected, especially in these regions, likely for many years [13]. In 2006, WHO recognized 28 nations where elevated fluoride concentrations in drinking water were associated with dental and skeletal fluorosis, with India, Ethiopia, and China being the most affected [14].
Communities relying on groundwater in the Ethiopian Rift Valley are severely affected [15,16,17]. The Ethiopian Central Rift Valley is part of a vast basin stretching from Syria and Jordan to Malawi and Mozambique. Its unique geological and climatic conditions contribute to some of the highest fluoride concentrations globally, especially in deep wells in semi-arid regions. Over 8.5 million people in this area are subjected to elevated concentrations of naturally occurring fluoride, primarily from acid volcanic rocks with a high fluoride and low calcium content. More than 40% of deep and shallow wells in the region have fluoride levels reaching up to 26 mgL−1 [18]. In the Ziway–Shala Basin of the Ethiopian Rift Valley, fluoride concentrations in drinking water for rural residents have varied from 1.1 to 68 mgL−1, as indicated by studies on the prevalence of dental fluorosis [19]. In addition, an exceptionally high fluoride level of 177 mgL−1 has been documented in Ethiopia [20].
The daily consumption of fluoride, mainly from drinking water and beverages but also from food, poses a significant risk of dental and skeletal fluorosis for many people in the rural areas of the Ethiopian Central Rift Valley. Unfortunately, the absence of alternative water sources with lower fluoride levels prevents these communities from finding a solution. A study conducted in rural Ethiopian villages found that water with high fluoride concentrations (over 10 mgL−1) accounted for 86% of the daily fluoride intake for households (30 mgday−1), with the remainder coming from food sources [21].
In fluoride-affected regions, several methods are commonly employed to defluoridate natural water sources including adsorption, coagulation–precipitation, electrogoagulation, and ion exchange [22,23,24]. Adsorption, particularly using activated alumina, is effective, achieving high fluoride removal rates; however, a significant drawback is the rapid exhaustion of the adsorbent, requiring considerable time for regeneration and potentially leading to secondary pollution from the disposal of fluoride-containing waste solutions [22]. Electrocoagulation (EC) can effectively remove fluoride, achieving removal efficiencies of up to 99% across initial concentrations ranging from 0 to 50 mg L−1, but it faces limitations in competitive applications for groundwater treatment under specific conditions [25]. Ion exchange treatment holds great potential, with fluoride removal rates of up to 95%, but the high cost of resins makes this method expensive; while resin regeneration is straightforward, it generates large volumes of fluoride-laden waste, posing additional challenges [22]. Other conventional techniques tend to be labor-intensive, less effective at high fluoride concentrations, produce significant sludge, and lack compactness for easy operation [23]. Consequently, advanced technologies such as membrane processes are emerging as effective alternatives [26,27].
Membrane technology for water purification utilizes semi-permeable membranes to filter out impurities from water. The membrane process provides numerous benefits, including the ability to eliminate various contaminants, maintain consistent water quality, and operate effectively across a broader pH range compared to other methods. Furthermore, it is a one-step process that requires fewer chemicals. The growing complexity of water sources and the high demand for desalinated water have driven significant advancements in membrane technology, improving efficiency and reducing costs [28]. Reverse osmosis (RO) is one of the most common methods, where pressure forces water through a membrane to remove dissolved salts, bacteria, and other impurities, making it ideal for desalination and producing very pure water [22,29]. RO has been also proposed as a method for removing fluoride from water [30]. Nevertheless, it produces a large amount of discharged brines [31]. For example, RO desalination typically achieves a product water recovery of 40–50% for seawater and 50–90% for brackish water [32,33]. Consequently, a concentrate retentate (or brine) flow is produced, which requires environmentally responsible management [34]. Membrane distillation–crystallization is becoming a promising technology for the concurrent recovery of water and salt crystallization [35]. Thus, it can be used to concentrate the RO retentate until the saturation of the concentration, aiming at the recovery of both water and salts.
In our previous research [36,37], we conducted two distinct studies that tried to combine RO and MCr. The first involved synthetic feed water, where we successfully developed the integrated process RO-MCr to remove fluoride and recover it as pure sodium fluoride salt [36]. This study confirmed the effectiveness of the RO membrane in fluoride removal, showcasing both the high performance and promising water permeability. In our second study, we applied the RO-MCr approach to real groundwater samples [37]. However, while we achieved effective fluoride removal, we were unable to recover fluoride as a mixed salt. In this work, we employed two membrane crystallization configurations: osmotic membrane distillation–crystallization (OMD-Cr) and vacuum membrane crystallization (VM-Cr), in order to concentrate the RO retentate and facilitate the production of crystals. Groundwater samples collected from the Central Rift Valley area of Ethiopia and a deep study of operation conditions was performed. Finally, the evaporation of the final concentrated solution was performed aiming at the recovery of salts while minimizing the discharge of brines.
2. Materials and Methods
2.1. Sampling Sites
The sampling sites are located in Ethiopia’s Central Rift Valley (ECRV), specifically in the Dugda district of the Oromia Region, approximately 141 km from the capital city, Addis Ababa. The district comprises one town administration (Meki town) and 34 rural kebeles, which are the smallest administrative units in Ethiopia.
Two samples were collected in October 2022 and September 2023, from Meki town. A GPS device was utilized to identify the geographic coordinates of the sampling locations. The sites include Meki-01 at coordinates 8°08′36″ N, 38°48′38″ E and Meki-02 at 8°08′36″ N, 38°48′39″ E. Figure 1 shows a map of water sampling sites.
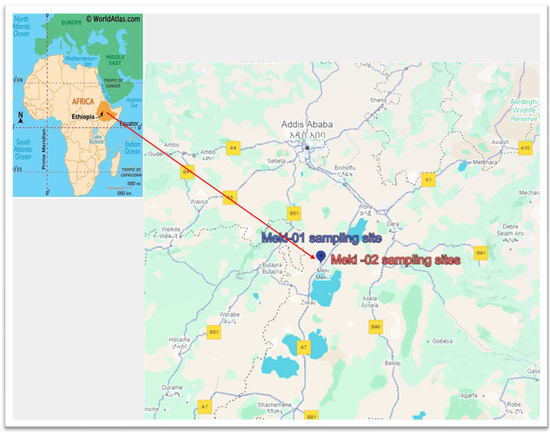
Figure 1.
Water sampling locations in the Central Rift Valley of Ethiopia, Meki town. The sampling sites are in close proximity to one another, causing overlap.
Both wells are privately owned shallow wells. The first well is not properly covered, while the second well is well constructed with a sealed slab and is pumped to a reservoir. The owners of the second well provide water to the neighborhood for a fee during shortages of municipal water supply. Most households in the town have their own wells nearby. During our sampling, we observed that some households use well water for domestic purposes, while others have stopped using it due to elevated fluoride concentrations and salinity. For example, the Meki-01 sampling well was abandoned when we returned a year later. Many similar cases exist in the town.
2.2. Physicochemical Analysis
The groundwater samples were examined for key physicochemical water quality parameters, including temperature, pH, electrical conductivity (EC), total dissolved solids (TDS), and concentrations of Ca2+, Na+, K+, Mg2+, SO₄2−, Cl−, F−, CO32−, and HCO3−. Temperature, pH, conductivity, and fluoride levels were measured immediately after sample collection using the HACH HQ40d Multiparameter Portable Water Quality Kit (Hach Europe GmbH, Germany, and the WTW Portable ISE Meter pH/ION 3310 (WTW, Weilheim, Germany) for fluoride ion measurements. Cation analysis was conducted using Inductively Coupled Plasma-Optical Emission Spectroscopy (ICP-OES) equipment from Agilent Technology, Santa Clara, CA, USA). The chloride concentration was determined using the Charpentier-Volkard titration method (APHA Method 4500-Cl-C), while carbonate and bicarbonate concentrations were assessed through double titration with phenolphthalein and methyl orange (APHA Method 2320 B). TDS was measured using the standard gravimetric method (APHA Method 2540-C), considered the most accurate [38]. This method involves evaporating the sample to dryness at 103 °C, then heating it to 180 °C to eliminate any trapped water, and finally weighing the remaining residues [38]. The physicochemical analyses of the permeate and retentate was also performed after the filtration experiments on the actual water samples.
2.3. Experimental Setups
2.3.1. Reverse Osmosis (RO)
The RO FT17 lab-scale device (Armfield, Ringwood, UK) was utilized to assess membrane performance in crossflow filtration. It allows for a quick evaluation using various membrane types with small sample volumes (1 L). Figure 2 illustrates the crossflow filtration unit. The RO experiments were conducted using a polyamide urea flat-sheet reverse osmosis membrane (Trisep X-20™, Lenntech, Delfgauw, the Netherlands), which is specifically designed for treating feed water with a high fouling potential [39]. The choice of this membrane was based on its flux and ability to remove salts. Table 1 outlines the specifications of the commercial membrane as provided by the supplier. Concerning the experimental procedure, prior to conducting the experiments, the membrane was extensively rinsed with ultrapure water (18.2 MΩ/cm) and immersed in it for a minimum of one day before being installed in the testing cell. Subsequently, the membrane was positioned in the filtration unit and compacted with ultrapure water at 5 bar for 30 min to ensure stability.
Reverse osmosis experiments were conducted at varying operating pressures (20–40 bar) to evaluate permeate flux, water permeability, and the rejection of ions and total dissolved solids (TDS). The chosen operational pressure range of 20–40 bar allows us to observe trends in system performance, with an optimum operating pressure identified at 25 bar. This optimal pressure falls well within the typical range for brackish water desalination (15–28 bar). We also reported this optimal pressure in our previous study [36], where we considered a range of 15–40 bar. The resulting retentates were collected and stored for use as the feed stream in both osmotic membrane distillation–crystallization (OMD-Cr) and vacuum membrane distillation–crystallization (VM-Cr). Both systems are interesting because VM-Cr gives a larger driving force, and in OMD-Cr, high-concentrated solutions could be used if available (like residual brines in desalination plants). A comparison of the overall mass transfer coefficients (Kov) of both systems is required to evaluate the final membrane area necessary for further scaling up [40,41]. They are not competitive alternatives but different possibilities for applications in different contexts.
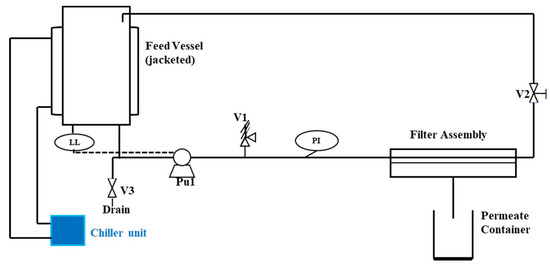
Figure 2.
A process flow diagram of the crossflow filtration unit. Legend: PI—pressure indicator (gauge); LL—low-level sensor (pump protection); V1 is the stainless steel pressure relief valve set to relieve at a little above 40 bar, V2 is the sprung backpressure valve and V3 is a drain valve [42] and adopted from [36].

Table 1.
The specification of commercial X-20TM RO membrane [39].
Table 1.
The specification of commercial X-20TM RO membrane [39].
| Trisep X-20TM | Specifications |
|---|---|
| Membrane type | Polyamide-urea thin film |
| Maximum operating T° | 50 °C |
| Minimum salt rejection | 98.5% |
| Maximum operating pressure | 41 bar |
| Continuous operating pH range | 4–11 |
| Maximum Silt Density Index (SDI) (15 min) | 5.0 |
| Maximum turbidity | 2 NTU |
Permeate flux (J), water permeability (Lp), rejection rates (R), and osmotic pressure (∆π) were calculated using Equations (1)–(4).
Permeate fluxes from the crossflow membrane filtration tests under varying operating conditions were calculated by measuring the weight of the permeate collected over specified time intervals per unit membrane area (Equation (1)) [43]:
where J (Lh−1m−2) is the permeate water flux, V (L) is the permeate volume, A (0.00636 m2) is the effective membrane surface area, and Δt (h) represents the time interval for collecting the permeate. The permeate weight was recorded using a balance with a precision of ±0.01 g. All weight measurements were converted to volume using the density of water at 4 °C (1000 gL−1). Furthermore, the pure water permeability was calculated using Equation (2) [43]:
where Lp is the pure water permeability (Lh−1m−2bar−1), and ΔP and Δπ represent the differences in transmembrane pressure and osmotic pressure across the membrane, respectively, measured in bar. The equation referenced for determining osmotic pressure differences across a membrane is derived from Van’t Hoff’s law, which relates osmotic pressure to solute concentration Equation (3) [44]:
where vi is the number of total ions in the dissociated sample, ci is the concentration (gL−1) of the total ions, R is the ideal gas constant (L barK−1mol−1), T (K) is the temperature at each operating condition, and MW (gmol−1) is the molar mass of the total ion.
The rejection (%) was determined by Equation (4) [45]:
where Cp and Cf denote the concentrations of permeate and feed, respectively, measured in mgL−1.
2.3.2. Osmotic Membrane Distillation–Crystallization
The experimental setup for osmotic membrane distillation–crystallization is depicted in Figure 3. This configuration utilizes a membrane contactor as a non-selective barrier between two solutions: the feed solution undergoing distillation/crystallization as water permeates through the membrane, and the osmotic solution containing a high concentration of NaCl. The apparatus used in this study was the hollow fiber membrane contactor model 2.5 × 8 Extra-Flow Module™ Liqui-Cel® from Membrane GmbH, Wuppertal, Germany, with key specifications listed in Table 2. The permeate side was maintained at room temperature. Two Masterflex (Gelsenkirchen, Germany) peristaltic pumps circulated the feed and osmotic streams from their respective reservoirs to the membrane contactor in a counter-current arrangement. The feed stream flowed through the lumen side of the membranes, while the osmotic stream circulated around the shell side.
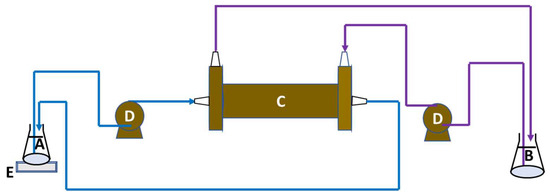
Figure 3.
Schema of the osmotic membrane distillation–crystallization setup. A—feed solution; B—osmotic solution; C—membrane contactor; D—peristaltic pumps; E—balance.
Table 2.
Specifications of the Liquid-Cel hollow fiber contactor membrane [46].
The OMD-Cr study was conducted using two types of feed solutions: a raw water sample without RO preconcentration (direct use of the groundwater) and a feed solution consisting of the RO retentate, this is, with RO preconcentration. The osmotic solution was prepared using NaCl at concentrations of 200 and 300 gL−1. Both the feed and osmotic solutions were maintained at 20 ± 1 °C.
2.3.3. Vacuum Membrane Distillation–Crystallization
Figure 4 illustrates the experimental setup for vacuum membrane distillation–crystallization. The membrane utilized is a commercially available hydrophobic polypropylene (PP) hollow fiber membrane, specifically the 3M™ Liqui-Cel™ MM-1 × 5.5 Series Membrane Contactor from 3M Deutschland GmbH, Wuppertal, Germany. Key characteristics of the fibers and module are summarized in Table 3. According to the membrane specifications, a vacuum is maintained inside the membrane fibers, allowing the feed to flow along the shell side during the VMD experiments.
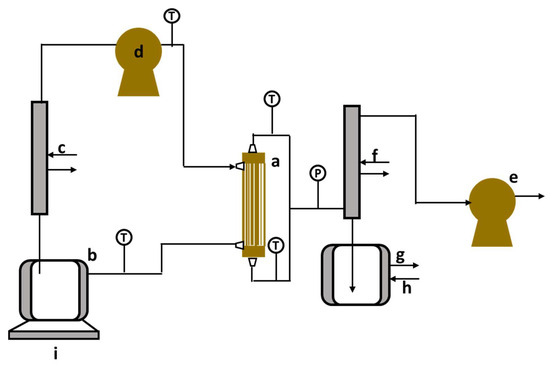
Figure 4.
Vacuum membrane distillation–crystallization setup. a—membrane contactor; b—feed tank; c—heater; d—gear pump; e—vacuum pump; f—condenser; g—permeate tank, h—cooler, and i—balance [41].
Table 3.
Specifications of the 3M™ Liqui-Cel™ MM-1 × 5.5 Series hollow fiber membrane contactor [41].
In the setups, the weight of the feed tank (b) is measured every minute using a balance (LP 4202 I, VWR, Milan, Italy; precision: 0.01 g) (i), while temperature is recorded by a data logger (Testo 176 T2, Cuesmes, Belgium) connected to PT100 temperature probes (Fabritius, Brussels, Belgium; precision: 0.01 °C). Each experiment typically runs for 30 min to achieve stable temperature conditions before the data collection begins. Between experiments, the feed side is rinsed with deionized water. Permeate conductivity is monitored using a Metrohm 914 pH/conductometer (Metrohm AG, Herisau, Switzerland) to detect the total membrane wetting. All experiments are conducted at least twice, and average values are presented in the graphs with the standard error as error bars.
The vacuum membrane distillation–crystallization (VMD-Cr) study utilized RO preconcentrated retentate as the feed stream. The RO retentate is sourced from both actual water samples and synthetic solutions designed to replicate the fluoride concentrations found in real samples. The retentate was stored in a closed vessel at 36 °C in a water bath for 24 h before the transfer to the VMD system. This moderate temperature was chosen to improve mass transfer and increase the solubility of certain minerals in the concentrate. Preliminary experiments using RO concentrate from synthetic water prepared with NaF showed that testing at 36 °C significantly enhanced the mass transfer compared to 30 °C. Moreover, this temperature ensures the consistency, stability, and readiness of the solution for experiments. Hence, the study was conducted at a controlled temperature of 36 °C, with a feed flow rate set at 300 mLmin−1 and a minimum permeate pressure of 15 mbar. The operating conditions were first optimized using synthetic water similar to the RO preconcentrate.
Two parameters were used to characterize the membrane system: transmembrane flux (J, m3m−2s−1) and the overall mass transfer coefficient (Kov, m3m−2s−1). Transmembrane flux (J) was calculated by measuring the feed tank weight over time with a balance (LP 4202I, VWR, Milan, Italy). The flux values presented in the results section are averages calculated using Equation (5) [47].
In this equation, A represents the active surface area of the membrane, ρwater denotes the density of water, and wf (ti) is the weight of the feed reservoir at the time ti.
Mass transfer from the feed to the osmotic solution takes place due to the difference in water activity across the membrane. Consequently, the key parameter for evaluating this process is the overall mass transfer coefficient, Kov (m3 m−2 s−1), which can be calculated using the following equation (Equation (6)) [46,48]:
In this context, J represents the water flux as determined in Equation (5). The variable a denotes the water activity on both the feed (f) and osmotic (p) side, while and refer to the water vapor pressures of the feed and the osmotic solution, respectively.
The transmembrane flux J from VMD-Cr is calculated by monitoring the weight of the feed tank over time. This flux is the mean derived from measurements taken every three hours using Equation (5). The experimental overall mass transfer coefficient, Kov, can be determined through [49] Equation (7):
where represents the vapor pressure difference between the feed and permeate sides, with indicating the saturation pressure at the membrane and a denoting the water activity. The subscripts f, p, and m refer to feed, permeate, and membrane, respectively. is the permeate vapor pressure. Water activities are calculated as outlined by Sandler [50], while saturation pressures (in mmHg) are derived using Antoine’s equation [41,48], where T [°C] represents the temperature at the membrane surface. Both water activity and vapor pressure are computed at the specific operating temperature. The water activity for the total ionic solution is determined using Equation (8), assuming that the osmotic coefficients for the relevant salt concentration are available in the literature. If these values are not accessible, water activities are computed using the method described by Sandler [50], which is detailed in Appendix A.
In this context, represents the osmotic coefficient, v denotes the number of ions that the solute molecule dissociates into within the solution, m is the molality (mol kg−1), M is the molar mass (g mol−1) of the solvent, and aw signifies the water activity.
The Antoine equation is employed to calculate the vapor pressure of water (p*, in mm Hg) at a specific temperature (T, in °C) [46,48]:
The processes of the RO system and membrane crystallization are illustrated in Figure 5 below.
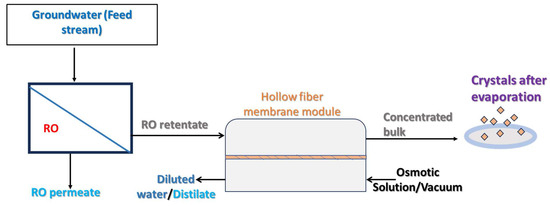
Figure 5.
A schematic representation of membrane crystallization with the RO preconcentration of the samples.
2.4. Crystal Recovery Procedures and Characterization
2.4.1. Recovery Procedures
In both membrane crystallization processes, the feed retentate became more concentrated, resulting in a noticeable color change and turbidity after several hours of permeation. When the volume of the feed tank reached its minimum level, the process was halted. The bulk solution was then transferred to a covered beaker and left at room temperature overnight to facilitate crystal development. The following day, a sufficient sample was taken from the bulk solution, centrifuged at 4500 rpm for 20 min, and subsequently filtered. However, no crystals were recovered, although some yellow color was found on the filter paper. This lack of crystal formation may be attributed to insufficient supersaturation levels and the presence of interfering substances that hindered the crystallization process. In the second attempt, the remaining portion of the feed retentate was kept in an oven at a temperature of 40 °C using evaporation Petri dishes. The low temperature (40 °C) was deliberately chosen by assuming lower temperatures allow for a more controlled and gradual evaporation process which is beneficial for managing supersaturation and minimizing rapid nucleation. This controlled approach is known to enhance crystal quality by favoring orderly crystal growth over uncontrolled precipitation. Furthermore, low temperatures provide a practical balance between energy efficiency and process performance, especially in preventing the thermal degradation of sensitive components. During this step, crystal growth was observed prior to the complete evaporation of the bulk solution. The successful crystallization is likely attributable to the increased concentration of solutes caused by evaporation, which enhanced the conditions for the nucleation and subsequent crystal growth.
The process to recover crystals from groundwater samples using RO integrated with the two membrane configurations (OMD-Cr and VM-Cr) is as follows: the RO preconcentrate from the RO process → the RO concentrate was processed using OMD-Cr → the concentrate obtained from OMD-Cr was divided, and a portion of the retentate was filtered, and the remaining portion was evaporated in an oven at 40 °C → recovered crystals dried at room temperature → the dried crystals were characterized according to crystallization techniques.
2.4.2. Characterization Techniques
The recovered crystals were characterized using several techniques, including Polarized Light Microscopy (PLM), X-ray Diffraction (XRD), Scanning Electron Microscopy (SEM), Energy Dispersive X-ray Spectroscopy (EDX), and particle size distribution analysis. Detailed descriptions of each technique are presented as supporting information in Appendix B.
3. Results and Discussion
3.1. Physicochemical Analyses of Water Sources
The physicochemical properties of groundwater samples from the two sites are presented in Table 4.
Table 4.
Physicochemical characteristics of water samples from Meki-01 and Meki-02 sampling sites.
The characteristics of the water sources, including fluoride concentrations and the levels of various cations and anions, along with the high total dissolved solids (TDS), make the water unsuitable for drinking. The fluoride concentration at the Meki-01 is 20.8 mgL−1, while at the Meki-02, it is 22.7 mgL−1. In addition, the TDS of both sources exceeds 1000 mgL−1, classifying the well water as brackish. These values significantly exceed the World Health Organization (WHO) guideline recommendations for safe drinking water [51]. Despite these high levels of contaminants, the owners (and neighborhoods) of the second well (Meki-02) do not deny that they use this water for drinking during times of scarcity.
In both well water sources, the sulphate and bicarbonate levels are very high. Particularly, the sulphate and bicarbonate levels of Meki-01 is highly elevated, 786 and 970 mgL−1, respectively. Groundwater with a high pH (above 9) is considered alkaline and can significantly impact the concentration and behavior of both cations and anions. The increased pH alters the chemical equilibria, solubility of minerals, and ion interactions [52,53]. Apart from health effects, high levels of sulphate in groundwater, especially in combination with iron and other metals, can accelerate corrosion in pipes and infrastructure, leading to water quality issues and costly repairs. Similarly, a high level of bicarbonate in the presence of calcium and magnesium ions typically indicates that the water is hard, meaning it has a high concentration of dissolved minerals, particularly calcium and magnesium, which can lead to scaling in pipes and water heaters [54].
Dissolved solids in water can significantly impact its taste. WHO [55] has established a taste rating criterion for drinking water based on total TDS levels. According to this criterion, water with TDS levels below 300 mgL−1 is rated as excellent; between 300 and 600 mgL−1 as good; between 600 and 900 mgL−1 as fair; between 900 and 1200 mgL−1 as poor; and above 1200 mgL−1 as unacceptable. Based on this criterion, the results indicate that both water sources are classified as poor and unacceptable for drinking, respectively (see Table 4).
The sampling was done at the end of September and in early October, the end of the rainy season in Ethiopia, which occurs from mid-June to mid-September. This period is crucial for increasing groundwater recharge and raising the water table. Groundwater recharge significantly influences the overall groundwater quality by diluting the concentrations of various substances. Therefore, it can be speculated that the values presented in Table 4 may be higher during the dry season. Pritchard, Mkandawire [56] reported that groundwater quality is affected by the rainy season. In this study, fluoride, total TDS, and conductivity values were found to increase during the dry season. Furthermore, a study conducted on well waters in India confirmed that the concentrations of the major cations and anions listed in Table 4 are influenced during and after the rainy season. It was also noted that lower concentrations of TDS were recorded when the groundwater table was higher [57].
3.2. RO Results
The trends of permeate flux across the membrane as a function of applied operating pressures over time was evaluated. The results indicated that, except for the highest applied operating pressure of 40 bar, the transmembrane flux gradually increased at first, then stabilized at a steady state, before starting to decrease toward the end (see Figure 6). It is also noted that the permeate flux rises linearly with the increase in applied operating pressure, ranging from 20 to 40 bars. The mean flux values were found to be between 75 ± 2 Lm−2h−1 and 166 ± 9 Lm−2h−1 (Figure 7).
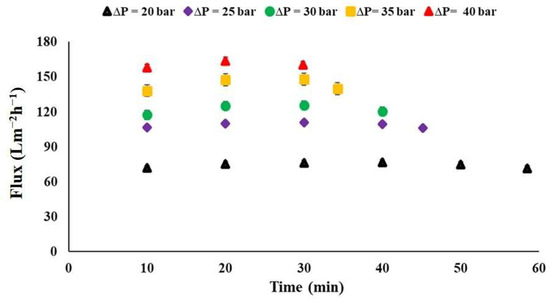
Figure 6.
Permeate flux through the commercial membrane as a function of applied operating pressure over time, Meki-02 sampling site.
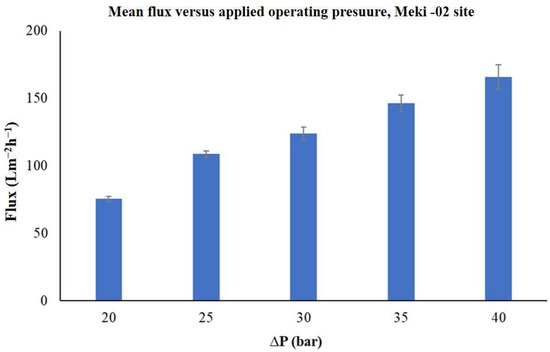
Figure 7.
The average permeate flux of the commercial membrane as a function of applied operating pressure, Meki-02 sampling site.
The mean water permeability of the membrane for the Meki-02 water sample under various operational conditions is presented in Figure 8. As observed here above, the transmembrane flux is influenced by the applied pressure; however, the average water permeability values appear to be independent of the applied operating pressure at pressures higher than 25 bar. Permeability is an intrinsic property of the membrane, governed by its material and structural characteristics. While flux increases with pressure, permeability remains constant because it reflects the membrane’s inherent ability to allow water passage under a unit driving force.
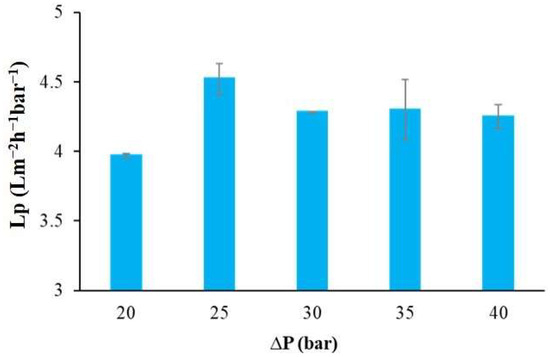
Figure 8.
The mean water permeability of the commercial membrane as a function of applied operating pressure, Meki-02 sampling site.
According to Yang, Ma [58], the typical water permeability values for commercial thin-film composite (TFC) RO membranes for brackish water ranges from 2 to 8 Lm−2h−1bar−1. In this study, the maximum recorded water permeability was 4.52 ± 0.11 Lm−2h−1bar−1, at the operating condition of 25 bar. This value is in line with the value obtained for synthetic water in our previous study [36]. In addition, Lumami Kapepula, García Alvarez [59] used a similar commercial RO membrane to remove heavy metals from surface water. They reported a maximum water permeability of 2.7 Lm−2h−1bar−1, which was influenced by the concentration of the surface water.
The average rejection rate of the membrane for the major cations, anions, and TDS of the water sample of Meki-02 was calculated from the retentate and permeate analysis values and is presented in Figure 9 as a function of applied operating pressure. It is observed that the rejection of the pollutants in the water sample appear to be unaffected by the applied operating pressure. The presence of multiple solutes can affect the rejection through competitive interactions. These interactions may not be significantly influenced by changes in pressure, especially if solute sizes and charges vary widely (See Table 4). In this study, the average fluoride rejection is above 99% (99.4 ± 0.1).
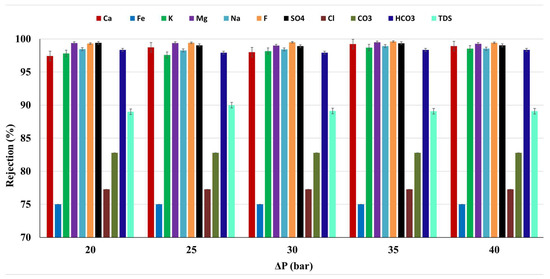
Figure 9.
The average pollutants rejection of the commercial membrane as a function of applied operating pressure, Meki town sampling site.
The total dissolved solids (TDS), resulting from both natural and human-induced contamination, serve as a fundamental and crucial parameter in assessing water quality [60]. The commercial membrane effectively removes 89.3% of total dissolved solids (TDS) from the Meki-02 water sample, resulting in a concentration of 172 ± 7 mgL−1. In addition, it achieves a pollutant removal exceeding 98% for ions such as Ca2+, K+, Na+, and HCO3−. For Mg2+ and SO₄2−, the rejection is even higher, exceeding 99% (see Figure 9).
The results of the RO experiment demonstrate the production of high-quality water that meets WHO standards, highlighting the effectiveness of RO in giving safe and clean water for consumption. However, while the system achieves a commendable mean water recovery of 76.5%, the remaining 23.5% constitutes a concentrated retentate that poses significant environmental concerns. This retentate, filled with pollutants such as salts, heavy metals, and organic compounds, must be managed responsibly to prevent harm to soil, aquatic ecosystems, and groundwater resources. To address this challenge, further activities are essential to enhance resource recovery and move toward a zero-liquid discharge (ZLD) approach. It can be effectively achieved through membrane distillation and membrane crystallization techniques (MCr), which offer distinct advantages in brine management compared to conventional methods. MCr operates at lower temperatures and can utilize low-grade or waste heat, resulting in a reduced energy consumption. In addition to this, it enables the gradual concentration of brine and facilitates the recovery of high-purity water, minimizing liquid waste. The process also supports the controlled crystallization of solids, simplifying final waste handling and reducing environmental risks associated with brine disposal. Therefore, transitioning to ZLD not only minimizes environmental risks but also aligns with sustainable water management practices by emphasizing circular economy principles. By linking the 76.5% recovery of high-quality permeate to the need for innovative strategies to manage the 23.5% retentate, this study underscores the importance of addressing retentate management to ensure the overall sustainability of the RO process.
3.3. Membrane Distillation–Crystallization Results
Crystallization studies were conducted as detailed in Section 2.3.2 (OMD-Cr) and Section 2.3.3 (VM-Cr). The RO preconcentrate described in Section 2.3.1 was used as the feed solution for the crystallization configurations. Although the feed solution contains various ions in significant amounts, the analysis specifically focused on the fluoride concentration and conductivity. The fluoride concentration in the RO concentrates ranges from 63 to 70 mgL−1, while the conductivity measures between 5.39 and 5.58 mScm−1. Additionally, the pH was recorded at 8.97.
3.3.1. Osmotic Membrane Distillation–Crystallization Results
- ▪
- OMD-Cr without RO preconcentration
OMD experiments were conducted on a raw water sample (without RO preconcentration) collected from the Meki-01 site at selected flow rates (250 to 300 mLmin−1) while keeping osmotic concentration and flow rates constant.
To examine the impact of flow rates on the transmembrane flux, measurements were taken every 20 min over a 2-h period. The findings indicate that the average flux achieved at a flow rate of 250 mLmin−1 is slightly greater than the flux at 300 mLmin−1, measuring 6.59 (±1.30) × 10−7 m3 m−2 min−1 and 6.25 (±1.32) × 10−7 m3 m−2 min−1, respectively. This trend is less pronounced in the overall mass transfer resistances when comparing with the flux (see Figure 10).
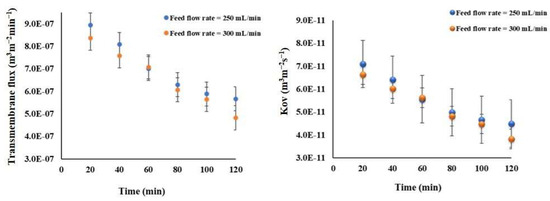
Figure 10.
The effect of the feed flow rate on the transmembrane water flux and mass transfer coefficient for the Meki-01 sample without RO pretreatment over time trend. The osmotic flow rate and concentration are 300 mLmin−1 and 150 g NaCl L−1, respectively.
The effect of osmotic agent concentration on transmembrane flux and the overall mass transfer coefficient in the processes was studied using the raw water sample of Meki-01. Experiments were conducted at 200, 250, and 300 gL−1 NaCl osmotic solutions. The result indicated that the transmembrane flux tends to increase proportionally with increasing osmotic agent concentration (see Figure 11a). The strength of the osmotic solution influences the difference in osmotic pressure across the membrane. Higher osmotic agent concentrations increase osmotic pressure, which drives water vapor from the feed solution to the permeate side. Generally, as the concentration of the osmotic agent increases, the transmembrane flux may initially increase due to a stronger driving force for water vapor. Under typical conditions, this would lead to a constant overall mass transfer coefficient that remains unaffected by concentration, provided that the flux increases in proportion to the driving force [46,61]. In this study, the calculated overall mass transfer coefficient (Kov) remains relatively constant (see Figure 11b). The Kov values at the concentrations of 200, 250, and 300 g NaCl L−1 are 4.86 × 10⁻¹¹, 4.59 × 10⁻¹¹, and 4.84 × 10⁻¹¹ m3 m−2 s−1, respectively.
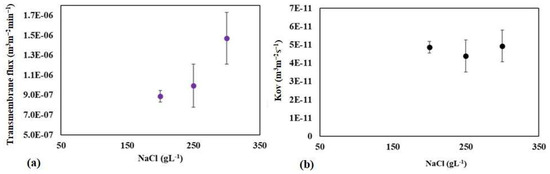
Figure 11.
The effect of feed osmotic concentration on the mean transmembrane flux (a) and overall mass transfer coefficient (b) at the Meki-01 sample site without RO preconcentration steps. The feed flow rate is 200 mLmin−1 while the osmotic flow rate is 300 mLmin−1.
- ▪
- OMD-Cr with RO preconcentration
A crystallization experiment was conducted using a OMD-Cr setup. The RO preconcentrated solution of the Meki-02 water sample was the feed solution of the setup. The osmotic concentration was 250 g NaClL−1. The feed flow rate was 200 mLmin−1 while the osmotic flow rate was 300 mLmin−1. The feed and osmotic solutions were maintained at a temperature of 20 ± 1 °C.
To investigate the trends of the transmembrane flux, measurements were taken every 20 min over a 2-h period. Figure 12 illustrates the relationship between flux and time. During the first 15 min of each experiment, there was a noticeable increase in transmembrane flux. Afterwards, it significantly decreased over time.
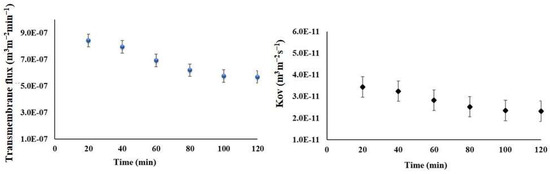
Figure 12.
The transmembrane flux and overall mass transfer coefficient of the RO preconcentrate from the Meki-02 sample over time trend (RO → OMD-Cr). The feed and osmotic flow rates are 200 and 300 mLmin−1, respectively, and the osmotic concentration is 300 g NaCl L−1.
After the 2-h study of the transmembrane flux trend, permeation continued for an additional 13 h to facilitate crystallization. The feed retentate became more concentrated and was then transferred to a covered beaker. It was left at room temperature overnight to allow for crystal development; however, no crystals were formed.
The fluoride concentration and conductivity of the feed retentate were measured. The findings show that the fluoride concentration was 374.7 mgL−1, which is around 17 times higher than that of the raw water (22.7 mgL−1) and six times higher than the RO concentrate (62.6 mgL−1). Similarly, the conductivity of the retentate was measured at 16.6 mScm−1, approximately six times greater than the raw water (2.8 mScm−1) and more than three of that of the RO retentate (5.4 mScm−1).
3.3.2. Vacuum Membrane Crystallization Results
The VMCr study was done until the full feed water in the tank reached its minimum level. The permeate flux and the overall mass transfer coefficient were studied. The complete permeation of the feed water took nearly 46 h, and the results are presented in four segments: the first three 12-h periods and the final 10 h. The permeate flux, overall mass transfer coefficient, and mean feed temperature are presented in Table 5. The results show that the permeate flux decreases over the entire 46-h study period; however, it increases linearly during each individual period. The mean permeate flux is 2.52 × 10⁻⁸ ± 4.94 × 10⁻⁹ m3s−1m−2 and the overall mass transfer coefficient (Kov) is 5.81 (±1.14) × 10−12 m3m−2s−1. The mean feed temperature is 36.94 ± 0.33 °C, the temperature IN and OUT of the feed in each individual period is constant (see supporting Figure A1).
Table 5.
The permeate flux and Kov of the VM-Cr study.
A total of 46 h of permeation was done to facilitate the crystallization of the feed. The feed retentate became more concentrated with a color change and was too turbid. When the volume of the feed tank had reached the minimum level of the setup, the retentate was transferred to a covered beaker, then left at room temperature overnight to allow for crystal development; however, no crystals were formed. The fluoride concentration and conductivity of the feed retentate were measured. The results show that the fluoride concentration is 180.0 mgL−1, which is around eight (8) times higher than that of the raw water (22.7 mgL−1) and more than double that of the RO concentrate (70.0 mgL−1). Similarly, the conductivity of the retentate was measured at 10.5 mScm−1, approximately five times greater than the raw water (2.8 mScm−1) and double that of the RO retentate (5.4 mScm−1).
- ▪
- Crystal recovery and characterization
The procedures for recovering crystals and powder from the two membrane crystallization configurations are described in Section 2.4.1. The crystals recovered from these configurations are presented in Figure 13. In addition, crystals crystallization was done according to the techniques detailed in Section 2.4.2. The variation in crystal size and color obtained from osmotic membrane distillation–crystallization (OMD-Cr) and vacuum membrane crystallization (VM-Cr), despite using the same feed source, can be attributed to differences in supersaturation levels. OMD-Cr and VM-Cr operate under distinct mechanisms of water removal, leading to varying supersaturation rates that directly influence nucleation and crystal growth. OMD-Cr typically allows for more controlled supersaturation, resulting in uniform crystal formation, while VM-Cr may induce rapid changes, leading to varied crystal sizes [61].
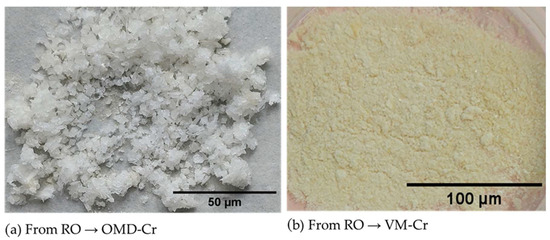
Figure 13.
Real images depicting the recovered crystal/powder using the integration of RO with OMD-Cr and RO with VM-Cr processes.
Moreover, operational conditions such as the temperature and pressure inherent to each process also influence crystallization. VM-Cr operates under vacuum, which causes rapid solvent evaporation and can lead to smaller, less uniform crystals. In contrast, the osmotic-driven process of OMD-Cr is more gradual, promoting the growth of larger, well-defined crystals [62].
- ▪
- Microscope analysis
A microscopic observation was conducted to analyze the nature of the solid powder recovered from the VM-Cr process. The results of this observation revealed that the obtained solid is a mixture of various crystalline structures. Figure 14 shows that the compound consists of larger crystals as well as very fine powder.
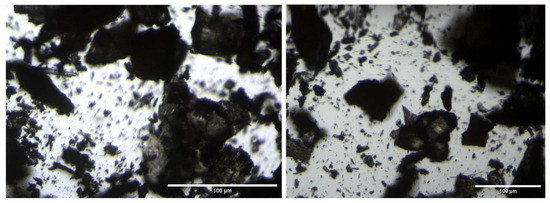
Figure 14.
Microscopic images of the obtained solid matter from the RO → VM-Cr configuration.
- ▪
- Scanning electron microscopy (SEM) analysis
SEM analysis was performed to examine structural images. Figure 15 presents the SEM images from two different membrane crystallization configurations. In the OMD-Cr system, the crystals had a pyramidal shape, characterized by triangular faces that converge at a pointed vertex (see Figure 15a). In contrast, the SEM images from the VM-Cr system revealed an octahedral shape, indicative of a face-centered cubic crystal system, which suggests the presence of fluoride (see Figure 15b).
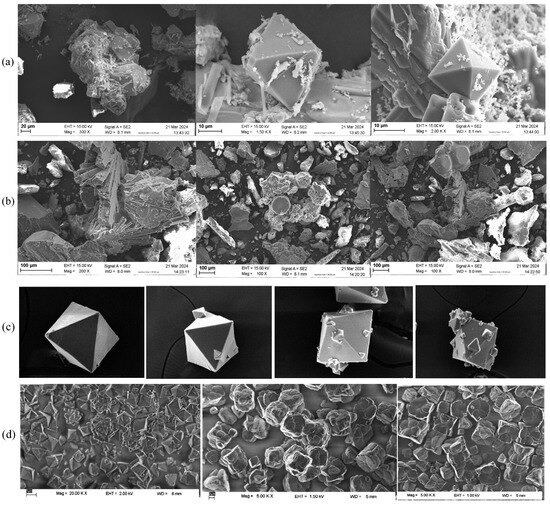
Figure 15.
SEM images of crystals obtained from the RO integration with two membrane crystallization configurations: (a) from RO → OMD-Cr, (b) from RO → VM-Cr, and (c) images of fluoride salts from a semi-batch reactor process used for sodium fluoride crystallization [63]. In addition, images in (d) are from a fluoride removal study using cryolite crystallization [64] and are reprinted with permission.
Since the compound consists of a mixture of crystals, the physicochemical characterization of the water reveals the presence of various metals, which leads to variations in both particle size and shape. Each metal can influence the crystal lattice of the fluoride salt. For instance, aluminum fluoride (AlF3) exhibits a different crystal structure compared to calcium fluoride (CaF2), affecting the overall morphology observed in the SEM images. The surface characteristics of the salts can vary based on the metal ions present; some compositions may display smoother surfaces, while others may show rough or porous features, thereby impacting their appearance in the SEM images [64].
Pyramidal fluoride-containing crystals are crystalline solids that incorporate fluoride ions (F−) in their structure, exhibiting a distinct pyramidal shape. Pyramidal fluoride-containing crystals, such as fluorite (CaF2), are characterized by their distinct pyramid-like shapes formed by the arrangement of fluoride ions within their crystal lattice. These crystals typically form through the cooling of fluoride-rich solutions or evaporation processes, leading to the precipitation of fluoride ions and cations. Pyramidal fluoride crystals are significant in various applications, including dental care and material science, highlighting their importance in both industrial and geological contexts [64,65,66].
Figure 15c,d presents images from a study on fluoride crystallization using different techniques. These images are included for comparison, as some crystal lattices resemble those found in this research. Specifically, the crystals shown in Figure 15c, derived from a semi-batch reactor process used for sodium fluoride crystallization [63], and those in Figure 15d, from a fluoride removal study by cryolite crystallization [64], illustrate this point. However, it is crucial to emphasize that these studies utilized high concentrations of fluoride-containing solutions and different recovery techniques to achieve such structures.
- ▪
- Energy Dispersive X-ray Spectroscopy (EDX) analysis
EDX analysis was performed to analyze the elemental composition of the recovered crystals. The EDX analysis confirmed the presence of calcium, sodium, potassium, magnesium, fluoride, and chloride, along with other ions, consistent with the expected composition of the water sample (see Table 4). In addition, a considerable atomic percentage of silicon and alumni was also detected. These elements may originate from the natural composition of groundwater, and at high concentrations, they can potentially impact water quality and crystallization behavior. The results are illustrated in Table 6 and Figure 16a from the OMD-Cr process and Figure 16b from the VM-Cr process. The EDX analysis provided a clear characterization of the elemental profile of the water sample, confirming the expected presence of mixed fluoride salts. The EDX analysis provided a clear characterization of the elemental constituents of the water sample, confirming the expected presence of mixed fluoride salts.
Table 6.
Detected elements and their corresponding atomic percentage (at %) of the recovered crystals.
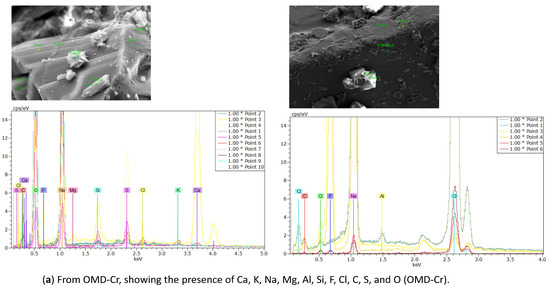
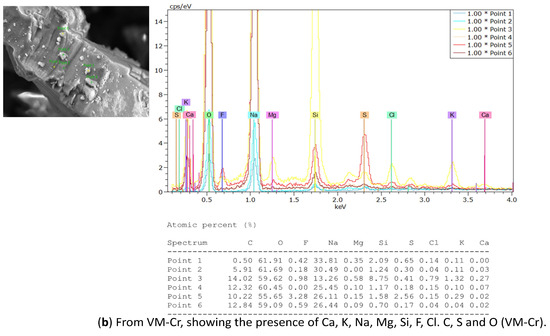
Figure 16.
The EDX spectrum of recovered crystals from the two membrane crystallization configurations (OMD-Cr and VM-Cr).
- ▪
- X-ray diffraction (XRD) analysis
The XRD pattern of the obtained crystals is shown in Figure 17. We have tried to identify the peaks as best as possible; unfortunately, fluoride may not produce a significant peak in the XRD pattern from the crystals obtained from the membrane crystallization systems compared with commercial NaF crystal samples and from the Match version 3.0 software compound background. The most likely reason for this might be that fluoride is present in trace amounts which requires a higher abundance of crystalline material to produce detectable diffraction peaks. Fluorine has a K-band (specific range of wavelengths in the electromagnetic spectrum) that is close to that of oxygen. If the atomic percentage of Fluorine is not sufficiently high, it can be difficult to detect its peak because of the interference of oxygen [67]. However, the search match from the OMD-Cr and VM-Cr process (see Figure A2 and Figure A3 as supporting information) indicate the presence of fluoride in different salts. The Figure of Merit (FoM) for Fluorine is indicated from 0.6006 to 0.6462, which suggests a moderate level of quality in the match.
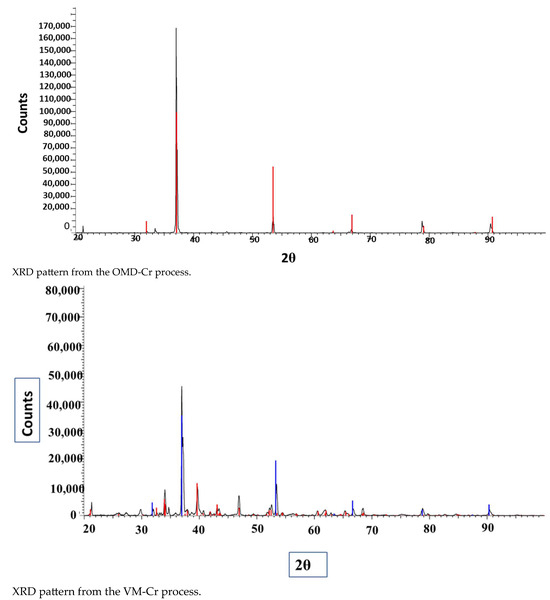
Figure 17.
XRD spectra of the crystals recovered from the integration of the RO system with the two membrane crystallization configurations (RO → OMD-Cr and RO → VM-Cr).
- ▪ Particle size distribution analysis
The particle size distributions were measured, revealing differences between the crystals recovered from the two membrane crystallization configurations. The average particle size of the mixed crystals from the OMD-Cr system was 400 µm, with a standard deviation of ±302 µm (Figure 18a), indicating significant variability in the crystal sizes. In contrast, the average particle size for crystals obtained from the VM-Cr system was 246 µm, with a standard deviation of ± 190 µm, also suggesting broad size distributions (Figure 18b). This variability implies a wide range of particle sizes, potentially from fine particles close to 0 μm to larger ones exceeding 400 μm.
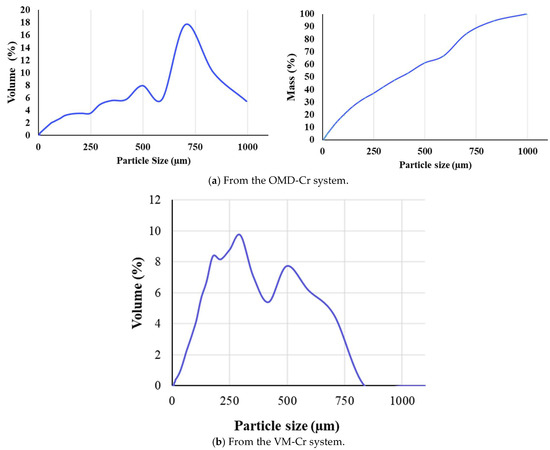
Figure 18.
The particle size distribution of crystals recovered from the integration of the RO system with the two membrane crystallization configurations (RO → OMD-Cr and RO → VM-Cr).
Chen et al. [64] reported that cryolite particles typically range from 3–60 μm, with larger particles forming in staged crystallization processes using aluminum salts. A recent study by Sinharoy et al. [68] found that calcium fluoride produced via fluidized bed crystallization has a broader size range, with an average of approximately 153 μm. Furthermore, our previous study [36] found that crystals formed from sodium fluoride in synthetic water had a particle size of 161 ± 74 µm.
Moreover, a Focused Beam Reflectance Measurement (FBRM) study was done on the VM-Cr retentate for 3 h to track the dynamic changes in the particle size growth (see Figure A4 as supporting information), which shows the mean square weight (Sqr Wt) as a function of time. The FBRM refers to a technique used to analyze and monitor particle systems in real time, primarily in liquids or slurries. It provides insights into particle size, count, and distribution by measuring the chord lengths of particles. The results show that the mean square weight (Sqr Wt) of the crystals decreases from 110 μm2 to 56 μm2 during the first 40 min. It then increases to 78 μm2 over the next 20 min (1 h in total), after which it remains nearly constant for the next 2 h.
The experimental results demonstrate that both membrane crystallization systems, OMD-Cr and VM-Cr, effectively recover fluoride in the form of mixed salts. The salt can be revalorized, offering potential for reuse in various applications and contributing to sustainable waste management. Each system has unique operational characteristics that make them suitable for different contexts. A detailed cost–benefit analysis is essential for selecting the most appropriate system for practical, large-scale implementation. However, a preliminary assessment highlights significant differences in complexity, energy consumption, and operational cost between the two systems. The OMD-Cr system is notably simpler in design and operation. It requires only two pumps, a membrane module (as outlined in Section 2.3.2), and a widely available osmotic agent, sodium chloride (NaCl). One of its key advantages is that it operates efficiently at room temperature, minimizing energy consumption. In addition, the components are inexpensive and readily available, making the system cost-effective and easier to manage.
In contrast, the VM-Cr system involves a more sophisticated setup. It requires additional equipment such as a condenser, a heater, and various devices for temperature and pressure control (refer to Section 2.3.3). To maintain optimal conditions for condensation, the system also requires chemicals like isopropanol. These factors contribute to higher energy demands and a more complex operation and maintenance. As a result, the VM-Cr system may incur significantly higher operational and capital costs.
Given these considerations, the OMD-Cr system appears to be more economically advantageous, particularly in scenarios where minimizing operational costs is a priority. Although research in this specific area is still limited, a study by Ruiz Salmón and Luis [69] supports the use of osmotic membrane systems, indicating that they are more cost-effective than other membrane configurations currently in use.
4. Conclusions
The physicochemical analyses revealed that the water sources are unsuitable for drinking due to high fluoride concentrations and elevated levels of various cations and anions, as well as high total dissolved solids (TDS). At the Meki-01 site, the fluoride concentration is 20.8 mg L−1, while at Meki-02, it is 22.7 mg L−1. Furthermore, TDS at both sites exceeds 1000 mg L−1, classifying the water as brackish. These values significantly exceed WHO guidelines for safe drinking water.
The commercial RO membrane exhibited a high performance, achieving fluoride rejection exceeding 99% and reducing the total dissolved solids (TDS) by 89.3%, resulting in a final concentration of 172 ± 7 mg L−1. The system demonstrated an average water permeability of 4.5 ± 0.1 Lm−2h−1bar−1, consistent with typical values reported for brackish water RO membranes (2–8 Lm−2h−1bar−1). The treated water met WHO standards, confirming the membrane’s efficacy in producing potable water.
Despite the high purification efficiency, the process yielded a mean water recovery of 76.5%, generating a concentrated retentate stream (23.5%) that presents both environmental and water wastage concerns. To mitigate these issues, integrating the RO system with OMD-Cr and VM-Cr configurations enhanced water recovery and enabled fluoride crystallization as a mixed salt. Although the final crystallization step still required low-temperature evaporation to promote complete crystal formation, the combined system effectively reduced liquid discharge. Therefore, this innovative technology not only addresses the critical issue of fluoride contamination in groundwater but also minimizes environmental waste discharge. We are currently studying the application of solar evaporation as the last step to achieve the objective of zero discharge.
Overall, this study underlines the potential for these integrated systems to serve as sustainable alternatives in water treatment processes, contributing to better resource management and environmental protection. For future perspectives, additional resources such as funding, infrastructure, and materials will be necessary for conducting large-scale testing to evaluate effectiveness under real-world conditions. Furthermore, performing a detail financial evaluation to assess economic feasibility, comparing various systems and their integration with other defluoridation and water purification technologies, including solar crystallization for crystal recovery. In this work, the integrated RO and membrane crystallization processes were designed to operate under energy-efficient and minimized fouling conditions; RO was conducted at low pressures, while membrane crystallization was carried out at relatively low temperatures of 20 °C for OMD-Cr and 36 °C for VM-Cr. Nevertheless, potential constraints related to energy demands during scale-up and membrane fouling during extended operation remain important considerations for future development. Addressing these areas will enhance the viability and impact of these innovative water treatment solutions.
Author Contributions
Conceptualization, W.Z.O., E.A. and P.L.; Methodology, W.Z.O. and P.L.; Software, W.Z.O.; Validation, P.L.; Formal analysis, W.Z.O.; Investigation, W.Z.O.; Resources, E.A. and P.L.; Data curation, W.Z.O.; Writing—original draft, W.Z.O.; Writing—review & editing, P.L.; Visualization, P.L.; Supervision, E.A. and P.L.; Project administration, E.A. and P.L.; Funding acquisition, E.A. and P.L. All authors have read and agreed to the published version of the manuscript.
Funding
This research received no external funding.
Institutional Review Board Statement
Not applicable.
Informed Consent Statement
Not applicable.
Data Availability Statement
Data will be available upon request.
Acknowledgments
We would like to acknowledge the support of the research group Membrane Technology for a Sustainable World at the Institute of Mechanics, Materials and Civil Engineering (iMMC) at UCLouvain. Our gratitude also goes to the car drivers who assisted in transporting us to the water sample collection sites. Furthermore, we would like to acknowledge the financial support from the Network for Advancement of Sustainable Capacity in Education and Research in Ethiopia (NASCERE) and the Académie de Recherche et d’Enseignement Supérieur (ARES) for all their grants.
Conflicts of Interest
The authors declare no conflicts of interest associated with this study.
Appendix A. Water Activity
The extended Debye–Hückel theory [50], as shown below, is applied, to estimate ionic activity coefficients. These were then used to calculate water activities (Equation (8)), considering ion pairing effects, ionic strength, and dielectric constants.
With mw = 0.018 kgmol−1, the mass of solvent in one mole of solvent, v is the number of ions after the dissociation of the electrolyte, MAB (molsolute/kgsolvent) is the electrolyte concentration, z is the valence of the ion after dissociation, and I is the ionic strength.
Water activity of the osmotic solution:
ms = 0.018 (kg/mol)
V = 2 (Na = 1+; Cl = 1−)
Appendix B. Supporting Information
Crystals Characterization Techniques
- Polarized Light Microscopy (PLM)
PLM is the preferred technique for determining whether a sample is crystalline. Amorphous samples do not exhibit birefringence under polarized light, while crystalline samples do. During polymorph screening, PLM can assess the amorphous/crystalline content, helping to identify samples that warrant further characterization by X-ray diffraction (XRD). In addition, PLM can differentiate between various crystalline polymorphs based on their shape, morphology, size, and other optical characteristics.
- X-ray diffraction characterization (XRD)
The crystal structure of the sample was determined by the XRD technique. The instrument used to analyze the sample is D8-I (D8 Discover) from Bruker which is used to analyze powders and thin samples. The program used for the measurement is 2theta scan from 20° to 100° at a step size of 0.02° and time step of 2.4 s. The X-ray tube is Cobalt, and the tube voltage and current are 30 mA and 30 kV, respectively.
- Scanning electron microscopy (SEM)
The microstructure of the surface of the crystal sample has been analyzed by the scanning electron microscope ULTRA-55 from Zeiss with a field emission electron beam source (FESEM). A scanning electron microscope employs a focused beam of high-energy electrons. Specifically, the SEM uses accelerated electrons carrying a significant amount of kinetic energy that is dissipated in a variety of signals. Those signals are produced by the electron–sample interactions coming from the incident electrons decelerated in the solid sample. The external morphology (texture), the chemical composition, and the crystalline structure of the sample were revealed.
- Energy Dispersive X-ray Spectroscopy (EDX)
EDX is an analytical method used to ascertain the elemental makeup of materials. It operates by bombarding a sample with high-energy electrons, resulting in the emission of X-rays from the sample’s elements. These emitted X-rays are subsequently analyzed to identify and quantify the present elements. It is conducted using a SEM equipped with an EDX detector. The analysis was performed at an acceleration voltage of 20 kV.
- Particle size distribution of crystals
The size distributions of particles were measured by an equipment known as Coulter LS100Q from Beckman. This device is equipped with a Micro Volume Module that allows for measurements of sample particles suspended in a liquid. The Coulter LS100Q can measure particles from 0.4 µm to 900 µm. Moreover, it possesses a sonicator that helps to disperse the particles. For the program, the main parameters are the time of measurement and the time of ultrasound. In both cases, it is 1 min. Ultrasound was used to break aggregates in the crystal sample and results after the ultrasound were considered.
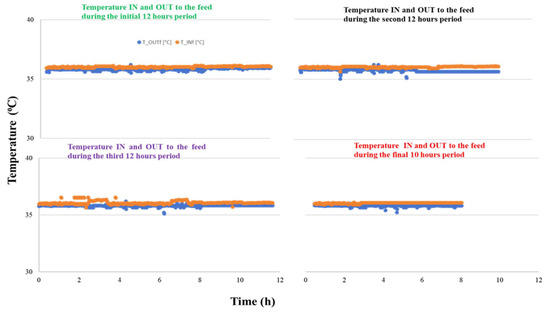
Figure A1.
Feed temperature trends (IN and OUT) over the 46-h RO-VM-Cr study period.
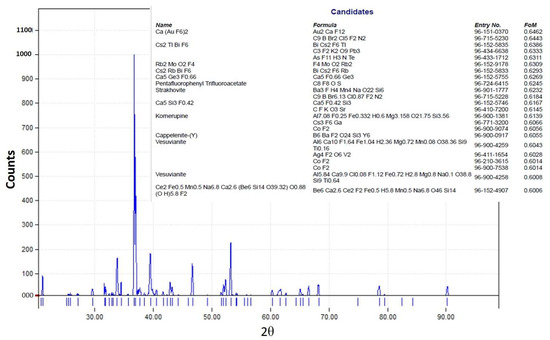
Figure A2.
XRD pattern from the VM-Cr process.
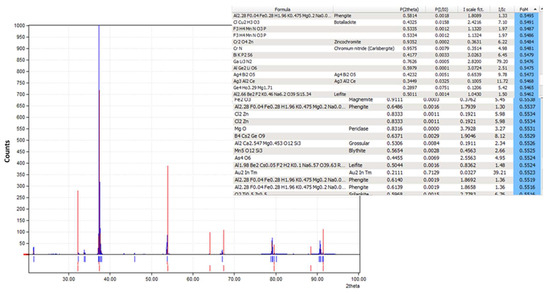
Figure A3.
XRD pattern from the OMD-Cr process.
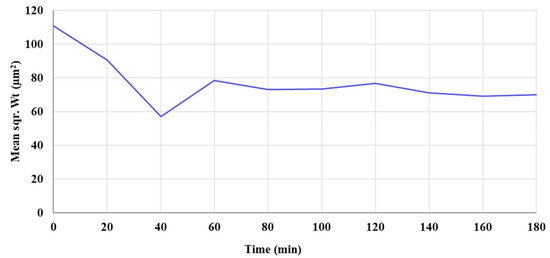
Figure A4.
The mean square weight (Squ Wt) of the recovered crystals as a function of time (from VM-Cr).
References
- World Bank Group. Water Storage Is at the Heart of Climate Change Adaptation; World Bank Group: Washington, DC, USA, 2023; Available online: https://www.worldbank.org/en/news/feature/2023/02/03/water-storage-is-at-the-heart-of-climate-change-adaptation (accessed on 12 December 2024).
- Keri, R.S.; Hosamani, K.M.; Seetharama Reddy, H.R.; Nataraj, S.K.; Aminabhavi, T.M. Application of the electrodialytic pilot plant for fluoride removal. J. Water Chem. Technol. 2011, 33, 293–300. [Google Scholar] [CrossRef]
- Gangani, N.; Joshi, V.C.; Sharma, S.; Bhattacharya, A. Fluoride contamination in water: Remediation strategies through membranes. Groundw. Sustain. Dev. 2022, 17, 100751. [Google Scholar] [CrossRef]
- Sharma, S.; Bhattacharya, A. Drinking water contamination and treatment techniques. Appl. Water Sci. 2017, 7, 1043–1067. [Google Scholar] [CrossRef]
- Brindha, K.; Elango, L. Fluoride in groundwater: Causes, implications and mitigation measures. In Fluoride Properties, Applications and Environmental Management; Monroy, S.D., Ed.; Applications and Environmental Management, Nova Publishers: New York, NY, USA, 2011; pp. 111–136. [Google Scholar]
- Waghmare, S.S.; Arfin, T. Fluoride removal from water by various techniques. Int. J. Innov. Sci. Eng. Technol. 2015, 2, 560–571. [Google Scholar]
- Bejaoui, I.; Mnif, A.; Hamrouni, B. Performance of Reverse Osmosis and Nanofiltration in the Removal of Fluoride from Model Water and Metal Packaging Industrial Effluent. Sep. Sci. Technol. 2014, 49, 1135–1145. [Google Scholar] [CrossRef]
- Barathi, M.; Kumar, A.S.K.; Rajesh, N. Impact of fluoride in potable water—An outlook on the existing defluoridation strategies and the road ahead. Coord. Chem. Rev. 2019, 387, 121–128. [Google Scholar] [CrossRef]
- Bhatnagar, A.; Kumar, E.; Sillanpää, M. Fluoride removal from water by adsorption—A review. Chem. Eng. J. 2011, 171, 811–840. [Google Scholar] [CrossRef]
- Biswas, K.; Gupta, K.; Goswami, A.; Ghosh, U.C. Fluoride removal efficiency from aqueous solution by synthetic iron (III)–aluminum (III)–chromium (III) ternary mixed oxide. Desalination 2010, 255, 44–51. [Google Scholar] [CrossRef]
- Jacks, G. Fluoride in groundwater: Mobilization, trends, and remediation. In Groundwater Assessment, Modeling, and Management; CRC Press: Boca Raton, FL, USA, 2016; pp. 339–349. [Google Scholar]
- Kimambo, V.; Bhattacharya, P.; Mtalo, F.; Mtamba, J.; Ahmad, A. Fluoride occurrence in groundwater systems at global scale and status of defluoridation—State of the art. Groundw. Sustain. Dev. 2019, 9, 100223. [Google Scholar] [CrossRef]
- World Health Organization (WHO). Fluoride in Drinkingwater, Background Document for Development of WHO Guidelines for Drinking-Water Quality; WHO: Geneva, Switzerland, 2004. [Google Scholar]
- Fawell, J. Fluoride in Drinking-Water; WHO IWA publishing: London, UK, 2006. [Google Scholar]
- Rango, T.; Vengosh, A.; Jeuland, M.; Tekle-Haimanot, R.; Weinthal, E.; Kravchenko, J.; Paul, C.; McCornick, P. Fluoride exposure from groundwater as reflected by urinary fluoride and children’s dental fluorosis in the Main Ethiopian Rift Valley. Sci. Total Environ. 2014, 496, 188–197. [Google Scholar] [CrossRef]
- Rango, T.; Vengosh, A.; Jeuland, M.; Whitford, G.M.; Tekle-Haimanot, R. Biomarkers of chronic fluoride exposure in groundwater in a highly exposed population. Sci. Total Environ. 2017, 596, 1–11. [Google Scholar] [CrossRef]
- Tekle-Haimanot, R.; Melaku, Z.; Kloos, H.; Reimann, C.; Fantaye, W.; Zerihun, L.; Bjorvatn, K. The geographic distribution of fluoride in surface and groundwater in Ethiopia with an emphasis on the Rift Valley. Sci. Total Environ. 2006, 367, 182–190. [Google Scholar] [CrossRef]
- Tekle-Haimanot, R. Study of Fluoride and Fluorosis in Ethiopia with Recommendations on Appropriate Defluoridation Technologies. In Consultancy Report; UNICEF: Addis Ababa, Ethiopia, 2005; pp. 1–55. [Google Scholar]
- Rango, T.; Kravchenko, J.; Atlaw, B.; McCornick, P.G.; Jeuland, M.; Merola, B.; Vengosh, A. Groundwater quality and its health impact: An assessment of dental fluorosis in rural inhabitants of the Main Ethiopian Rift. Environ. Int. 2012, 43, 37–47. [Google Scholar] [CrossRef]
- Mumtaz, N.; Pandey, G.; Labhasetwar, P.K. Global fluoride occurrence, available technologies for fluoride removal, and electrolytic defluoridation: A review. Crit. Rev. Environ. Sci. Technol. 2015, 45, 2357–2389. [Google Scholar] [CrossRef]
- Dessalegne, M.; Zewge, F. Daily dietary fluoride intake in rural villages of the Ethiopian Rift Valley. Toxicol. Environ. Chem. 2013, 95, 1056–1068. [Google Scholar] [CrossRef]
- Jadhav, S.V.; Bringas, E.; Yadav, G.D.; Rathod, V.K.; Ortiz, I.; Marathe, K.V. Arsenic and fluoride contaminated groundwaters: A review of current technologies for contaminants removal. J. Environ. Manag. 2015, 162, 306–325. [Google Scholar] [CrossRef]
- Ahmad, S.; Singh, R.; Arfin, T.; Neeti, K. Fluoride contamination, consequences and removal techniques in water: A review. Environ. Sci. Adv. 2022, 1, 620–661. [Google Scholar] [CrossRef]
- Thamarai, P.; Deivayanai, V.C.; Karishma, S.; Yaashikaa, P.R.; Saravanan, A. Effective removal of fluoride ions from contaminated water using electrochemical techniques: A critical review on recent developments and environmental perspective. J. Hazard. Mater. Adv. 2024, 16, 100483. [Google Scholar] [CrossRef]
- Mousazadeh, M.; Alizadeh, S.M.; Frontistis, Z.; Kabdaşlı, I.; Karamati Niaragh, E.; Al Qodah, Z.; Naghdali, Z.; Mahmoud, A.E.; Sandoval, M.A.; Butler, E.; et al. Electrocoagulation as a promising defluoridation technology from water: A review of state of the art of removal mechanisms and performance trends. Water 2021, 13, 656. [Google Scholar] [CrossRef]
- Alkhudhiri, A.; Darwish, N.; Hilal, N. Membrane distillation: A comprehensive review. Desalination 2012, 287, 2–18. [Google Scholar] [CrossRef]
- Naidu, G.; Jeong, S.; Choi, Y.; Jang, E.; Hwang, T.M.; Vigneswaran, S. Application of vacuum membrane distillation for small scale drinking water production. Desalination 2014, 354, 53–61. [Google Scholar] [CrossRef]
- Damtie, M.M.; Woo, Y.C.; Kim, B.; Hailemariam, R.H.; Park, K.D.; Shon, H.K.; Park, C.; Choi, J.S. Removal of fluoride in membrane-based water and wastewater treatment technologies: Performance review. J. Environ. Manag. 2019, 251, 109524. [Google Scholar] [CrossRef] [PubMed]
- Okamoto, Y.; Lienhard, J.H. How RO membrane permeability and other performance factors affect process cost and energy use: A review. Desalination 2019, 470, 114064. [Google Scholar] [CrossRef]
- Moran Ayala, L.I.; Paquet, M.; Janowska, K.; Jamard, P.; Quist-Jensen, C.A.; Bosio, G.N.; Mártires, D.O.; Fabbri, D.; Boffa, V. Water Defluoridation: Nanofiltration vs Membrane Distillation. Ind. Eng. Chem. Res. 2018, 57, 14740–14748. [Google Scholar] [CrossRef]
- Shaji, E.; Sarath, K.V.; Santosh, M.; Krishnaprasad, P.K.; Arya, B.K.; Babu, M.S. Fluoride contamination in groundwater: A global review of the status, processes, challenges, and remedial measures. Geosci. Front. 2024, 15, 101734. [Google Scholar] [CrossRef]
- Semiat, R.; Hasson, D. Seawater and brackish-water desalination with membrane operations. In Membrane Operations: Innovative Separations and Transformations; John Wiley & Sons: Hoboken, NJ, USA, 2009; pp. 221–243. [Google Scholar]
- Miller, S.; Shemer, H.; Semiat, R. Energy and environmental issues in desalination. Desalination 2015, 366, 2–8. [Google Scholar] [CrossRef]
- Damtie, M.M.; Hailemariam, R.H.; Woo, Y.C.; Park, K.D.; Choi, J.S. Membrane-based technologies for zero liquid discharge and fluoride removal from industrial wastewater. Chemosphere 2019, 236, 124288. [Google Scholar] [CrossRef]
- Yadav, A.; Singh, K.; Panda, A.B.; Labhasetwar, P.K.; Shahi, V.K. Membrane distillation crystallization for simultaneous recovery of water and salt from tannery industry wastewater using TiO2 modified poly (vinylidene fluoride-co-hexafluoropropylene) nanocomposite membranes. J. Water Process Eng. 2021, 44, 102393. [Google Scholar] [CrossRef]
- Ousman, W.Z.; Alemayehu, E.; Luis, P. Fluoride Removal and Recovery from Water Using Reverse Osmosis and Osmotic Membrane Crystallization. Clean Technol. 2023, 5, 973–996. [Google Scholar] [CrossRef]
- Ousman, W.Z.; Alemayehu, E.; Luis, P. Integration of reverse osmosis and membrane distillation for fluoride removal from groundwater aiming at a zero-waste discharge process. J. Environ. Chem. Eng. 2025. under review. [Google Scholar]
- American Public Health Assocoation (APHA). Standard Methods for the Examination of Water and Wastewater; APHA Press: Denver, CO, USA, 2017; Available online: https://yabesh.ir/wp-content/uploads/2018/02/Standard-Methods-23rd-Perv.pdf (accessed on 25 November 2024).
- Lenntech. Trisep X-20: The Proven Low Fouling RO Membrane; Lenntech: Delfgauw, The Netherlands, 2022. [Google Scholar]
- Sparenberg, M.-C.; Ruiz Salmón, I.; Luis, P. Economic evaluation of salt recovery from wastewater via membrane distillation-crystallization. Sep. Purif. Technol. 2020, 235, 116075. [Google Scholar] [CrossRef]
- Sparenberg, M.-C.; Hanot, B.; Molina-Fernandez, C.; Luis, P. Experimental mass transfer comparison between vacuum and direct contact membrane distillation for the concentration of carbonate solutions. Sep. Purif. Technol. 2021, 275, 119193. [Google Scholar] [CrossRef]
- Armfield. FT17 Cross-Flow Filtration Unit: Instructional Manual, in ISSUE 4; Armfield: Ringwood, UK, 2018. [Google Scholar]
- Baker, R.W. Membrane Technology and Applications; John Wiley & Sons: Hoboken, NJ, USA, 2004. [Google Scholar]
- Kiil, F. Kinetic model of osmosis through semipermeable and solute-permeable membranes. Acta Physiol. Scand. 2003, 177, 107–117. [Google Scholar] [CrossRef] [PubMed]
- Bartels, C.; Franks, R.; Rybar, S.; Schierach, M.; Wilf, M. The effect of feed ionic strength on salt passage through reverse osmosis membranes. Desalination 2005, 184, 185–195. [Google Scholar] [CrossRef]
- Ruiz Salmón, I.; Janssens, R.; Luis, P. Mass and heat transfer study in osmotic membrane distillation-crystallization for CO2 valorization as sodium carbonate. Sep. Purif. Technol. 2017, 176, 173–183. [Google Scholar] [CrossRef]
- Luis, P.; Van Aubel, D.; Van der Bruggen, B. Technical viability and exergy analysis of membrane crystallization: Closing the loop of CO2 sequestration. Int. J. Greenh. Gas Control 2013, 12, 450–459. [Google Scholar] [CrossRef]
- Martínez, M.B.; Jullok, N.; Negrín, Z.R.; Van der Bruggen, B.; Luis, P. Membrane crystallization for the recovery of a pharmaceutical compound from waste streams. Chem. Eng. Res. Des. 2014, 92, 264–272. [Google Scholar] [CrossRef]
- Luis, P. Fundamental Modeling of Membrane Systems: Membrane and Process Performance; Elsevier: Amsterdam, The Netherlands, 2018. [Google Scholar]
- Sandler, S.I. Chemical, Biochemical, and Engineering Thermodynamics, 5th ed.; John Wiley & Sons: Hoboken, NJ, USA, 2017. [Google Scholar]
- Water and Sanitation; World Health Organization. Guidelines for Drinking-Water Quality [Electronic Resource]: Incorporating First Addendum; World Health Organization: Geneva, Switzerland, 2006; Volume 1, Recommendations. [Google Scholar]
- Subba Rao, N.; Subrahmanyam, A.; Ravi Kumar, S.; Srinivasulu, N.; Babu Rao, G.; Rao, P.S.; Reddy, G.V. Geochemistry and quality of groundwater of Gummanampadu sub-basin, Guntur District, Andhra Pradesh, India. Environ. Earth Sci. 2012, 67, 1451–1471. [Google Scholar] [CrossRef]
- Soceanu, A.; Dobrinas, S.; Dumitrescu, C.I.; Manea, N.; Sirbu, A.; Popescu, V.; Vizitiu, G. Physico-chemical parameters and health risk analysis of groundwater quality. Appl. Sci. 2021, 11, 4775. [Google Scholar] [CrossRef]
- Gao, M.; Xiao, W.; Miao, L.; Yang, Z.; Liang, W.; Ao, T.; Yang, Q.; Chen, W. Prussian blue and its analogs: A robust platform for efficient capacitive deionization. Desalination 2024, 574, 117278. [Google Scholar] [CrossRef]
- World Health Organization (WHO). Guidelines for drinking-water quality. WHO Chron. 2011, 38, 104–108. [Google Scholar]
- Pritchard, M.; Mkandawire, T.; O’Neill, J. Assessment of groundwater quality in shallow wells within the southern districts of Malawi. Phys. Chem. Earth Parts A/B/C 2008, 33, 812–823. [Google Scholar] [CrossRef]
- Subba Rao, N. Seasonal variation of groundwater quality in a part of Guntur District, Andhra Pradesh, India. Environ. Geol. 2006, 49, 413–429. [Google Scholar] [CrossRef]
- Yang, Z.; Ma, X.-H.; Tang, C.Y. Recent development of novel membranes for desalination. Desalination 2018, 434, 37–59. [Google Scholar] [CrossRef]
- Lumami Kapepula, V.; García Alvarez, M.; Sang Sefidi, V.; Buleng Njoyim Tamungang, E.; Ndikumana, T.; Musibono, D.D.; Van Der Bruggen, B.; Luis, P. Evaluation of commercial reverse osmosis and nanofiltration membranes for the removal of heavy metals from surface water in the Democratic Republic of Congo. Clean Technol. 2022, 4, 1300–1316. [Google Scholar] [CrossRef]
- Pushpalatha, N.; Sreeja, V.; Karthik, R.; Saravanan, G. Total dissolved solids and their removal techniques. Int. J. 2022, 2, 13–20. [Google Scholar] [CrossRef]
- García Alvarez, M.; Lumami Kapepula, V.; Sang Sefidi, V.; Buleng Njoyim Tamungang, E.; Ndikumana, T.; Musibono, D.D.; Van Der Bruggen, B.; Luis, P. Osmotic Membrane Distillation Crystallization of NaHCO3. Energies 2022, 15, 2682. [Google Scholar] [CrossRef]
- Osman, W.N.; Nawi, N.M.; Samsuri, S.; Bilad, M.R.; Wibisono, Y.; Yáñez, E.H.; Saad, J.M. A review on recent progress in membrane distillation crystallization. ChemBioEng. Rev. 2022, 9, 93–109. [Google Scholar] [CrossRef]
- Kim, H.-J.; Kim, W.-S. Configuration of sodium fluoride crystal characterized by surface crystals on mother crystal. J. Cryst. Growth 2001, 233, 326–335. [Google Scholar] [CrossRef]
- Chen, J.Y.; Lin, C.W.; Lin, P.H.; Li, C.W.; Liang, Y.M.; Liu, J.C.; Chen, S.S. Fluoride recovery from spent fluoride etching solution through crystallization of Na3AlF6 (synthetic cryolite). Sep. Purif. Technol. 2014, 137, 53–58. [Google Scholar] [CrossRef]
- Saeed Zango, M.; Pelig-Ba, K.B.; Anim-Gyampo, M.; Gibrilla, A.; Abu, M. Assessment of the mineralogy of granitoids and associated granitic gneisses responsible for groundwater fluoride mobilization in the Vea catchment, Upper East Region, Ghana. Sustain. Water Resour. Manag. 2022, 8, 4. [Google Scholar] [CrossRef]
- Gulina, L.; Tolstoy, V.; Murin, I. Crystallization of New Inorganic Fluoride Nanomaterials at Soft Chemistry Conditions and Their Application Prospects. Russ. J. Inorg. Chem. 2024, 69, 285–296. [Google Scholar] [CrossRef]
- Tachibana, S.; Yamagishi, H.; Orikasa, Y. Fluorine and Oxygen K-edge X-ray Absorption Near Edge Structure of Ytterbium Fluoride Sulfide. Mem. SR Cent. Ritsumeikan Univ. 2019, 21, 7–9. [Google Scholar]
- Sinharoy, A.; Lee, G.Y.; Chung, C.M. Process Intensification for Enhanced Fluoride Removal and Recovery as Calcium Fluoride Using a Fluidized Bed Reactor. Int. J. Mol. Sci. 2024, 25, 4646. [Google Scholar] [CrossRef]
- Ruiz Salmón, I.; Luis, P. Membrane Crystallization via Membrane Distillation. Chem. Eng. Process. 2018, 123, 258–271. [Google Scholar] [CrossRef]
Disclaimer/Publisher’s Note: The statements, opinions and data contained in all publications are solely those of the individual author(s) and contributor(s) and not of MDPI and/or the editor(s). MDPI and/or the editor(s) disclaim responsibility for any injury to people or property resulting from any ideas, methods, instructions or products referred to in the content. |
© 2025 by the authors. Licensee MDPI, Basel, Switzerland. This article is an open access article distributed under the terms and conditions of the Creative Commons Attribution (CC BY) license (https://creativecommons.org/licenses/by/4.0/).