1. Introduction
Legal frameworks, such as the European Union’s Circular Economy Package, contain clear targets for waste recycling rates. Accordingly, 55% (by weight) of municipal waste must be recycled in every member state of the European Union by 2025 [
1,
2]. Taking into account the average recycling rate of 38% (by weight) reported by the EU-27 countries in 2019, it is clear that the quantities of material sent for treatment will have to increase significantly in the coming years [
3]. Higher required recycling rates limit the possibility of sending untreated waste for incineration or energy recovery or sending it to landfill, which means that the quantities of waste sent for treatment will have to increase in the coming years [
4]. There is also a focus on increasing the effectiveness of treatment plants, with the aim of utilizing unused recycling potential, particularly for commercial waste [
5,
6]. This can be achieved through more precise mechanical treatment and the even greater use of sensor-supported sorting machines [
7,
8,
9]. Effective use of this technology in turn places clear requirements on the particle size and volume consistency of the waste stream [
8,
10,
11,
12].
The focus of this research is on the shredding process step of mixed commercial waste (MCW) in a mechanical treatment/processing line. In the case of MCW, it is a very inhomogeneous waste stream [
13], which consists in particular of plastics, wood, paper, metals and inert materials [
5]. The heterogeneity is primarily attributable to the variable composition of the materials. In the case of mechanical treatment of MCW, we speak of so-called splitting or plants producing refuse-derived fuels (RDFs). The shredding step is usually the first step in these treatment plants and is generally unavoidable in order to convert the waste into a transportable and separable piece size. It also has a direct influence on the quality of the material in terms of particle size, throughput and, in particular, its consistency [
8,
12,
14]. Furthermore, the shredding process step accounts for a significant proportion of the energy consumption of the entire treatment plant. The throughput capacity of the shredder is of particular importance, as it ultimately provides information about the treatment capacity of the entire mechanical treatment plant and is therefore an important performance parameter. Currently, mechanical treatment units and plants usually provide a low level of machine, process, and material flow data, which also include throughput capacity [
12]. The main reason for this lies in the cost structure for the necessary sensor technology, but also in the limited selection of suitable systems and solutions or their often difficult retrofitting [
11]. For this reason, information such as throughput performance cannot currently be used on a large scale for online/on-time optimization of individual units or for optimization of the overall process [
15]. Increased use of digitalization would contribute significantly to a better circular economy [
16].
In principle, systems for measuring throughput are already available on the market, such as optical measuring systems (volume flow measurement) or belt scales integrated into the conveyor system (mass flow measurement). In addition to the high costs already mentioned, the difficult operating conditions should also be noted. For example, dust emissions lead to problems during operation, especially with optical measuring systems [
17]. The accuracy of belt scales depends on a variety of factors and is often significantly lower in reality than in theory [
18].
Based on this problem, it seems sensible to research alternative solutions in the direction of more cost-effective systems that are suitable for the ambient conditions (e.g., dust, low material density, etc.) and can also be retrofitted if necessary. In order to facilitate a cost-effective retrofit and thus ensure scalability, research must take into account the possibility of using conventional machine controls. In particular, high-performance industrial computers, which would facilitate the implementation and use of AI models, for example, are not state of the art in the field of (mobile) machine technology for the treatment of MCW. Consequently, the emphasis should be directed towards mathematically uncomplicated models that can be implemented in a localized manner. The specific focus of this work is on the question of whether knowledge of time series data of machine parameters, such as the drum speed or the drum power, as well as the geometry of the cutting tools and the machine settings (cutting-gap, etc.) enable an indirect measurement or estimation of the volume throughput rate when treating solid mixed waste.
In this work, a new methodological approach for measuring volumetric throughput was applied as part of the ReWaste F research project [
19]. Models were developed which allow the indirect determination of the volumetric throughput rate on the basis of existing machine parameters. The volumetric throughput capacity is considered to be particularly relevant compared to the mass throughput capacity, as the performance of downstream units (e.g., drum screens) is more strongly influenced by the volumetric flow rate [
20,
21]. Depending on the modelling approach, existing machine parameters were taken into account as basic data for modelling. Large-scale shredding tests of mixed commercial waste carried out as part of the predecessor project (ReWaste4.0) served as the database for modelling and subsequent verification [
22]. Using the example of a single-shaft shredder (Terminator 5000 SD; Komptech GmbH, Frohnleiten, Austria), three different configurations of cutting tool geometries and different setting parameters were analyzed and performance data in the form of volume and mass throughput were measured [
23,
24]. Two modelling approaches—the so-called regression model and the displacement model—were developed using these measurement data.
The method of indirect estimation of the volumetric throughput capacity of the shredder represents a completely new approach in this area of application. As a result, alternatives to conventional cost-intensive systems for measuring the volumetric throughput capacity will be available in the future, making a further significant contribution to the future digitalized mechanical treatment of solid waste.
2. Material and Methods
The first step deals with data collection. The different newly developed modelling approaches and the two reference models are described under Methodology and Model Development. The selected statistical methods are also described.
2.1. Data Collection
In this section, reference is made to the tests carried out and the test carriers analyzed, and the measurement setup, the measurement data obtained, and the data recording and preparation are discussed in detail.
The topics of pilot lines and experimental research based on large-scale tests are the primary research methods applied in the projects ReWaste4.0 and ReWaste F, which focus on the development of a Smart Waste Factory and, consequently, intelligent waste treatment. The database required to answer the research question was collected during large-scale tests (pilot line 4.0) as part of the ReWaste4.0 project in October 2019 [
22]. Khodier et al. [
23] describe all the details of the experimental setup and procedure. This is divided into the areas of material, process control, geometry of the cutting tools, and the entire test sequence. The focus was on the shredding of mixed commercial waste. At a glance, the experimental setup was as follows: The waste was fed directly into the shredder using a wheel loader. The same basic type of shredder was used in all cases. From the outfeed conveyor of the shredder, the waste was passed to a digital material flow monitoring system (DMFMS), which measures the current throughput in volume and mass. The waste leaving the machine was collected in a product pile. The process step of pre-shredding using a single-shaft shredder was analyzed in different equipment variants with regard to the cutting geometries. In addition, the influence of the machine parameters drum speed and cutting-gap setting was analyzed.
A Terminator 5000 SD from Komptech served as the test machine. This is a diesel engine-driven single-shaft shredder with a hydraulic drive system and drum drive on both sides. The drum drive enables load-dependent speed control including a reversing function. Overload protection is also integrated.
2.1.1. Measurement Setup for Data Acquisition
The model development described below is based on the machine data relevant to the object of research. Not all of the machine data required for the analysis were collected as standard or provided by the machine. For this reason, an additional measurement setup was required to record the drum torque of the machine. Feyerer et al. [
25] describes the measurement application, taking into account that it is simple and cost-effective in order to enable later scalability. Due to the fact that the test carriers are machines with a diesel engine-powered hydraulic drive system, the mechanical output torque of the hydraulic motor was determined according to the formula for
of the hydraulic motor, according to Formula (1). Ref. [
26] appears to make sense. It is calculated from the hydraulic differential pressure of the hydraulic pump
, the displacement volume
, and the mechanical–hydraulic efficiency
.
To determine the pressure difference
, the inlet and outlet pressures at the axial piston variable displacement pump were determined using two pressure sensors of type SCP01-600-44-07 from Parker (Parker Hannifin GmbH, Vienna, Austria) [
27], with a suitable measuring range of 0–600 bar. Due to the fact that this is an axial piston variable displacement pump, the displacement was also not constant. The displacement is defined by the swiveling angle. The adjustment is carried out electrically. By changing the intensity of the current, the swivel angle of the pump is adjusted accordingly, which changes the displacement volume. The mechanical–hydraulic efficiency was assumed to be 90% [
26]. All three tested machines were equipped with a drum drive on both sides. Due to the mechanical coupling via the shredding drum and the resulting synchronization, only the one-sided drum torque was measured.
The volume throughput rate was recorded using a material flow measuring system specially developed by Komptech (Komptech GmbH, Frohnleiten, Austria), the so-called digital material flow monitoring system (DMFMS). This hook-lift mobile device is positioned as a following unit to the shredder under investigation during tests and essentially consists of a horizontally arranged 6.2 m-long and 1.4 m-wide conveyor belt, which has an integrated belt scale for measuring the mass throughput rate. The belt speed is 0.44 m/s. The belt scale works with an accuracy of ±2% in the spectrum of 25–100% of the absolute measured throughput, in a valid throughput rate range of 5–100 t/h, and provides measured values every 3 s, which correspond to the arithmetic mean value from this period. The volume throughput rate is measured via special measuring beams, using laser triangulation, above the conveyor belt. In detail, the system measures the height profile of the material flow at a frequency of 200 Hz. Taking the belt speed into account, the specific volume throughput is determined and updated every 2 s, calculated from the average value from this period.
2.1.2. Data Recording and Preparation
A Dewesoft Sirius R2DB DAQ data acquisition system (Trbovlje, Slovenia) was used for data recording. This ensured time-synchronized recording of all the measurement data described above. Further data analysis was carried out using the Dewesoft X3 and MATLAB R2022a software systems. All of the measurement data required for this research work were collected as part of the pilot line 4.0 [
22]. The authors of [
23] investigated the influences of the parameters cutting tool geometry, cutting-gap, and drum speed on the volume and mass throughput rate, as well as the energy consumption, in a total of 32 test series, according to
Table 1. The different cutting tool geometries and cutting-gap settings are illustrated in
Figure 1.
For the present research topic, the machine data of the drum speed and drum torque , as well as the process data of the specific volume throughput , each related to one hour, are relevant. In order to ensure a higher number of comparable machine settings for the subsequent evaluation of the model, it was necessary to reduce the different variants of the cutting-gap setting parameter. Subsequently, a distinction was only made between the settings open (cutting-gap ≥ 50%) or closed (cutting-gap < 50%).
No grouping is required in the case of the drum speed setting parameter. This parameter is subsequently taken into account in the modelling as a dynamic variable in the form of time series information (continuous measurement parameter). Based on these definitions, and taking into account the cutting tool geometries and the cutting-gap setting, the 32 individual test series were allocated to six groups according to
Table 2. Irregularities were discovered in the time series data for test series 3, 4, 24, and 30, as the volume throughput rate in the measurement data increases without justification over a longer period of time despite the constant drum speed. The cause is suspected to be an error in the data recording of one of the two measurement signals. In addition, the time series data of test series 7 show a clear decrease in the volume throughput rate at constant drum speed, which can be explained by insufficient feeding of the machine during this period. Due to these findings, the test series mentioned were subsequently excluded from all considerations, which is why a total of 27 test series were available for modelling and evaluation.
Due to the physical distance between the respective test machine (Terminator 5000 SD) and the DMFMS, a time correction or shift of the measurement data of the specific volume throughput capacity by the time offset
had to be taken into account. These corrections were calculated from the geometric distances according to
Figure 2, and take into account the conveyor belt speeds, as well as the assumption of the free fall of the material between the shredding drum and the discharge belt as well as between the discharge belt and the collection belt of the DMFMS, as according to Formula (2). Here, the height
is representative of the vertical distance between the shredding drum and the outfeed conveyor, the length
represents the center path on the outfeed conveyor, the length
represents the total length of the discharge conveyor, the height
represents the vertical distance between the discharge conveyor (of the shredder) and the collection conveyor of the DMFMS, the length
represents the distance from the start of the collecting conveyor to the measuring point of the volume throughput rate, and the length
represents the distance between the start of the collecting conveyor and the impact point of the material. The parameter
represents the acceleration due to gravity, and the variables
, and
the conveyor belt speeds of the discharge outfeed, discharge, and collecting conveyor, respectively.
The measurement data were initially stored in the form of time series data with a standardized resolution of 1000 Hz, and were updated with different resolutions depending on the sensor type. For example, the drum speed is available with a resolution of 10 Hz, the drum torque with 100 Hz, and the volume flow rate with 0.5 Hz. For further modelling, it was therefore necessary to reduce the resolution, as not all parameters could be updated at the same repetition rate, which is why the data resolution was subsequently set to 0.1 Hz in the first instance. This data reduction was carried out by calculating the arithmetic mean of the respective measurement points. Furthermore, each data set was limited to a test time of one hour, i.e., 360 (0.1 Hz) data points per parameter, in order to ensure identical observation periods. Initial analyses and observations showed that the selected resolution of 0.1 Hz was too high for the possible description of a correlation. Considerations suggested that a longer observation interval, i.e., a lower data resolution, would appear to make sense, as data-averaging reduces or smooths out disturbance variables and thus provides average values in the form of load or speed levels for the respective period as a basis for comparison. For this reason, the data resolution was ultimately set at 0.016 Hz. This corresponds to one measured value per minute, or 60 measuring points per hour and test series.
2.2. Methodology and Model Development
A new methodological approach was developed to address this research topic. This is based on the idea of enabling a model-based determination or approximation of the volume throughput rate on the basis of available machine parameters, as well as information on setting parameters and the input material. In detail, measured data from machine parameters are used to determine or approximate the volume throughput rate using two different calculation methods. These calculated process data were then verified using the measured volume throughput rate.
Figure 3 illustrates the basic approach to the problem as a method graphic.
The two modelling approaches developed are described in detail in the following subsections. Furthermore, the two reference models for the subsequent evaluation are also described. Finally, reference is also made to the statistical methods used.
2.2.1. Regression Model
The so-called regression model illustrates the first modelling approach developed. This is based on the consideration that the power
at the shredding drum, which can be calculated according to Formula (3), is possibly related to the volume throughput rate
. This consideration is supported by the fact that for the calculation of the drum power, both the drum torque
as a measure of the load, as well as the drum speed
as a measure of the possible volume displacement, are considered. The drum torque can be determined using the measured output torque
on the axial piston variable displacement pump, the reduction ratio of the planetary gearbox
, and the consideration of the double-sided drum drive
according to Formula (4), and subsequently also by the Formula (5). This allows the relationship between the tooth force
and the effective distance to be portrayed, which results from the halving of the drum diameter
. The author of [
28] has already demonstrated that the force required for crushing is in direct proportion to the increase in surface area.
The drum speed
is another important reference variable. Khodier et al. [
23] have already shown that the drum speed has a significant influence on the volume throughput rate. Furthermore, it can be assumed that a drum speed of zero means that the volume throughput rate must also be zero, as no material can be crushed or displaced during this period. This can occur if the machine’s overload protection is activated, for example in the event of contact with an impurity. The reversing function of the machine is a special case [
24]. This results in a negative drum speed. This mode is triggered depending on the situation, for example by the overload protection, or automatically by the program. These boundary conditions were also taken into account in the regression model, so that a drum speed equal to or less than zero leads to a volume throughput rate of zero in this period.
Based on the calculated drum performance and the measured volume throughput rate, the statistical method of linear regression was used to visualize the possible relationship between these two variables. A linear model was used, as preliminary investigations have shown that the use of a quadratic model does not lead to a better approximation. The volume throughput rate is referred to as the criterion value
, which is subsequently calculated or estimated by the model. In the first instance, the measured volume throughput rate is used to describe the regression line. The drum power is used as a predictor value
and represents the future input value. The variables
and
form the coefficients to be calculated, whereby
is the slope of the regression line and
represents the offset, i.e., the shift of the line along the y-axis at
[
29]. The regression line is described according to the general Formula (6) [
29], where
represents the estimated volume throughput.
The regression lines are modelled for each group according to
Table 2. For the subsequent model evaluation, a model is formed for each test from the respective group, with the exception of the same test. The corresponding model coefficients are determined by arithmetically averaging all coefficients’ variables
and
of the respective groups. Using Formula (7), the model-based determination of the volume flow rate is carried out in the form of time series information for each test series.
2.2.2. Displacement Model
As an alternative to the regression model, a second modelling approach was developed with the so-called displacement model. This is based on the idea of determining the volumetric throughput based on the theoretical displacement volume and taking into account the drum speed. The theoretical displacement volume
can vary depending on the design of the cutting geometry (see
Figure 1) using the technical data from
Table 3 and according to the Formulas (8) and (9), and describes the theoretical displacement volume per drum revolution.
The theoretical displacement volume describes the volume that results from the complete cross-sectional area of all cutting tools on the shredding drum during a complete 360° rotation. In reality, the material is fed into the hopper of the shredding machine from above. The material is caught by the shredding drum and pressed against the counter comb to shred the material at this point. It then falls down onto a conveyor belt and is discharged. Due to the installation situation, the effective range of the shredding drum is limited to approx. 120° per revolution due to the geometry. In addition, the geometry of the cutting tools, due to the relatively large cutting-gaps, tends to result in a ripping and not a cutting–shredding effect, whereby the resulting material quality is coarser and also more undefined [
8]. Furthermore, in the case of the treatment of mixed commercial waste, a high degree of inhomogeneity in the material composition and a fluctuating material composition is to be expected [
4].
In order to be able to take these effects and their influences into account, corresponding correction factors for the real displacement volume
were determined on the basis of the available test data. This is calculated from the volume throughput of the respective test series
and the average drum speed
, according to Formula (10). Taking into account the previously determined theoretical displacement volume, the following can be calculated according to Formula (11), and the theoretical correction factor
can be determined for each test series, depending on the respective cutting tool configuration.
The correction factors
applicable for the model are determined for each test series
by arithmetically averaging all theoretical correction factors
of the respective groups, as according to
Table 2. The theoretical correction factor
determined explicitly for the respective test series
is again not taken into account in order to ensure independence of the data. This results in an independent correction factor
for each test series
. With the help of these correction factors, the modeled volume flow rates
of each test series
can be calculated according to Formula (12).
2.2.3. Mean Value Model (Reference Model 1)
In order to evaluate the performance of the models, a meaningful reference is required: the simplest estimator, which is also often used in practice, is the average throughput from previous experience. This approach is implemented in the mean value model. In detail, the arithmetic mean values of the respective groups are calculated according to
Table 2. The volume throughput capacity explicitly available for the respective test series
is again not taken into account in order to ensure the independence of the data.
2.2.4. ANOVA Model (Reference Model 2)
Khodier et al. [
23] have already analyzed the influences of cutting geometries, cutting-gap settings, and drum speeds, according to
Table 1, on the volume and mass throughput as well as the energy requirement. A variance analysis was used to develop a model that describes the different influences. The volume throughput rates to be expected from the model for the respective test series based on the settings serve as a second reference for the performance measurement of the two newly developed model approaches.
2.3. Statistical Methods
The consideration of statistical methods is of particular relevance to this research topic. This allows, for example, correlations between different parameters to be categorized, the quality of the models to be examined on the basis of the accuracy of the predictions, or the significance in relation to the accuracy of the different models to be assessed. All methodologies for the statistical assessment of the analyses are described in detail in the following subsections.
2.3.1. Test for Normal Distribution
The reliable applicability of most parametric tests requires normally distributed data, so testing for normal distribution is also one of the most important goodness-of-fit tests in statistics [
30]. For the correlation analysis, using the Pearson correlation coefficient and the calculation of confidence intervals, normally distributed data are required. For example, the Shapiro–Wilk test or Kolmogorov–Smirnov test are used to test data sets for the presence of a normal distribution [
31]. Due to the small sample size, particular attention was paid to the Shapiro–Wilk test for the present investigations, as it is suitable for statistical testing for the normal distribution of data with small sample sizes [
31].
2.3.2. Non-Parametric Data Analysis
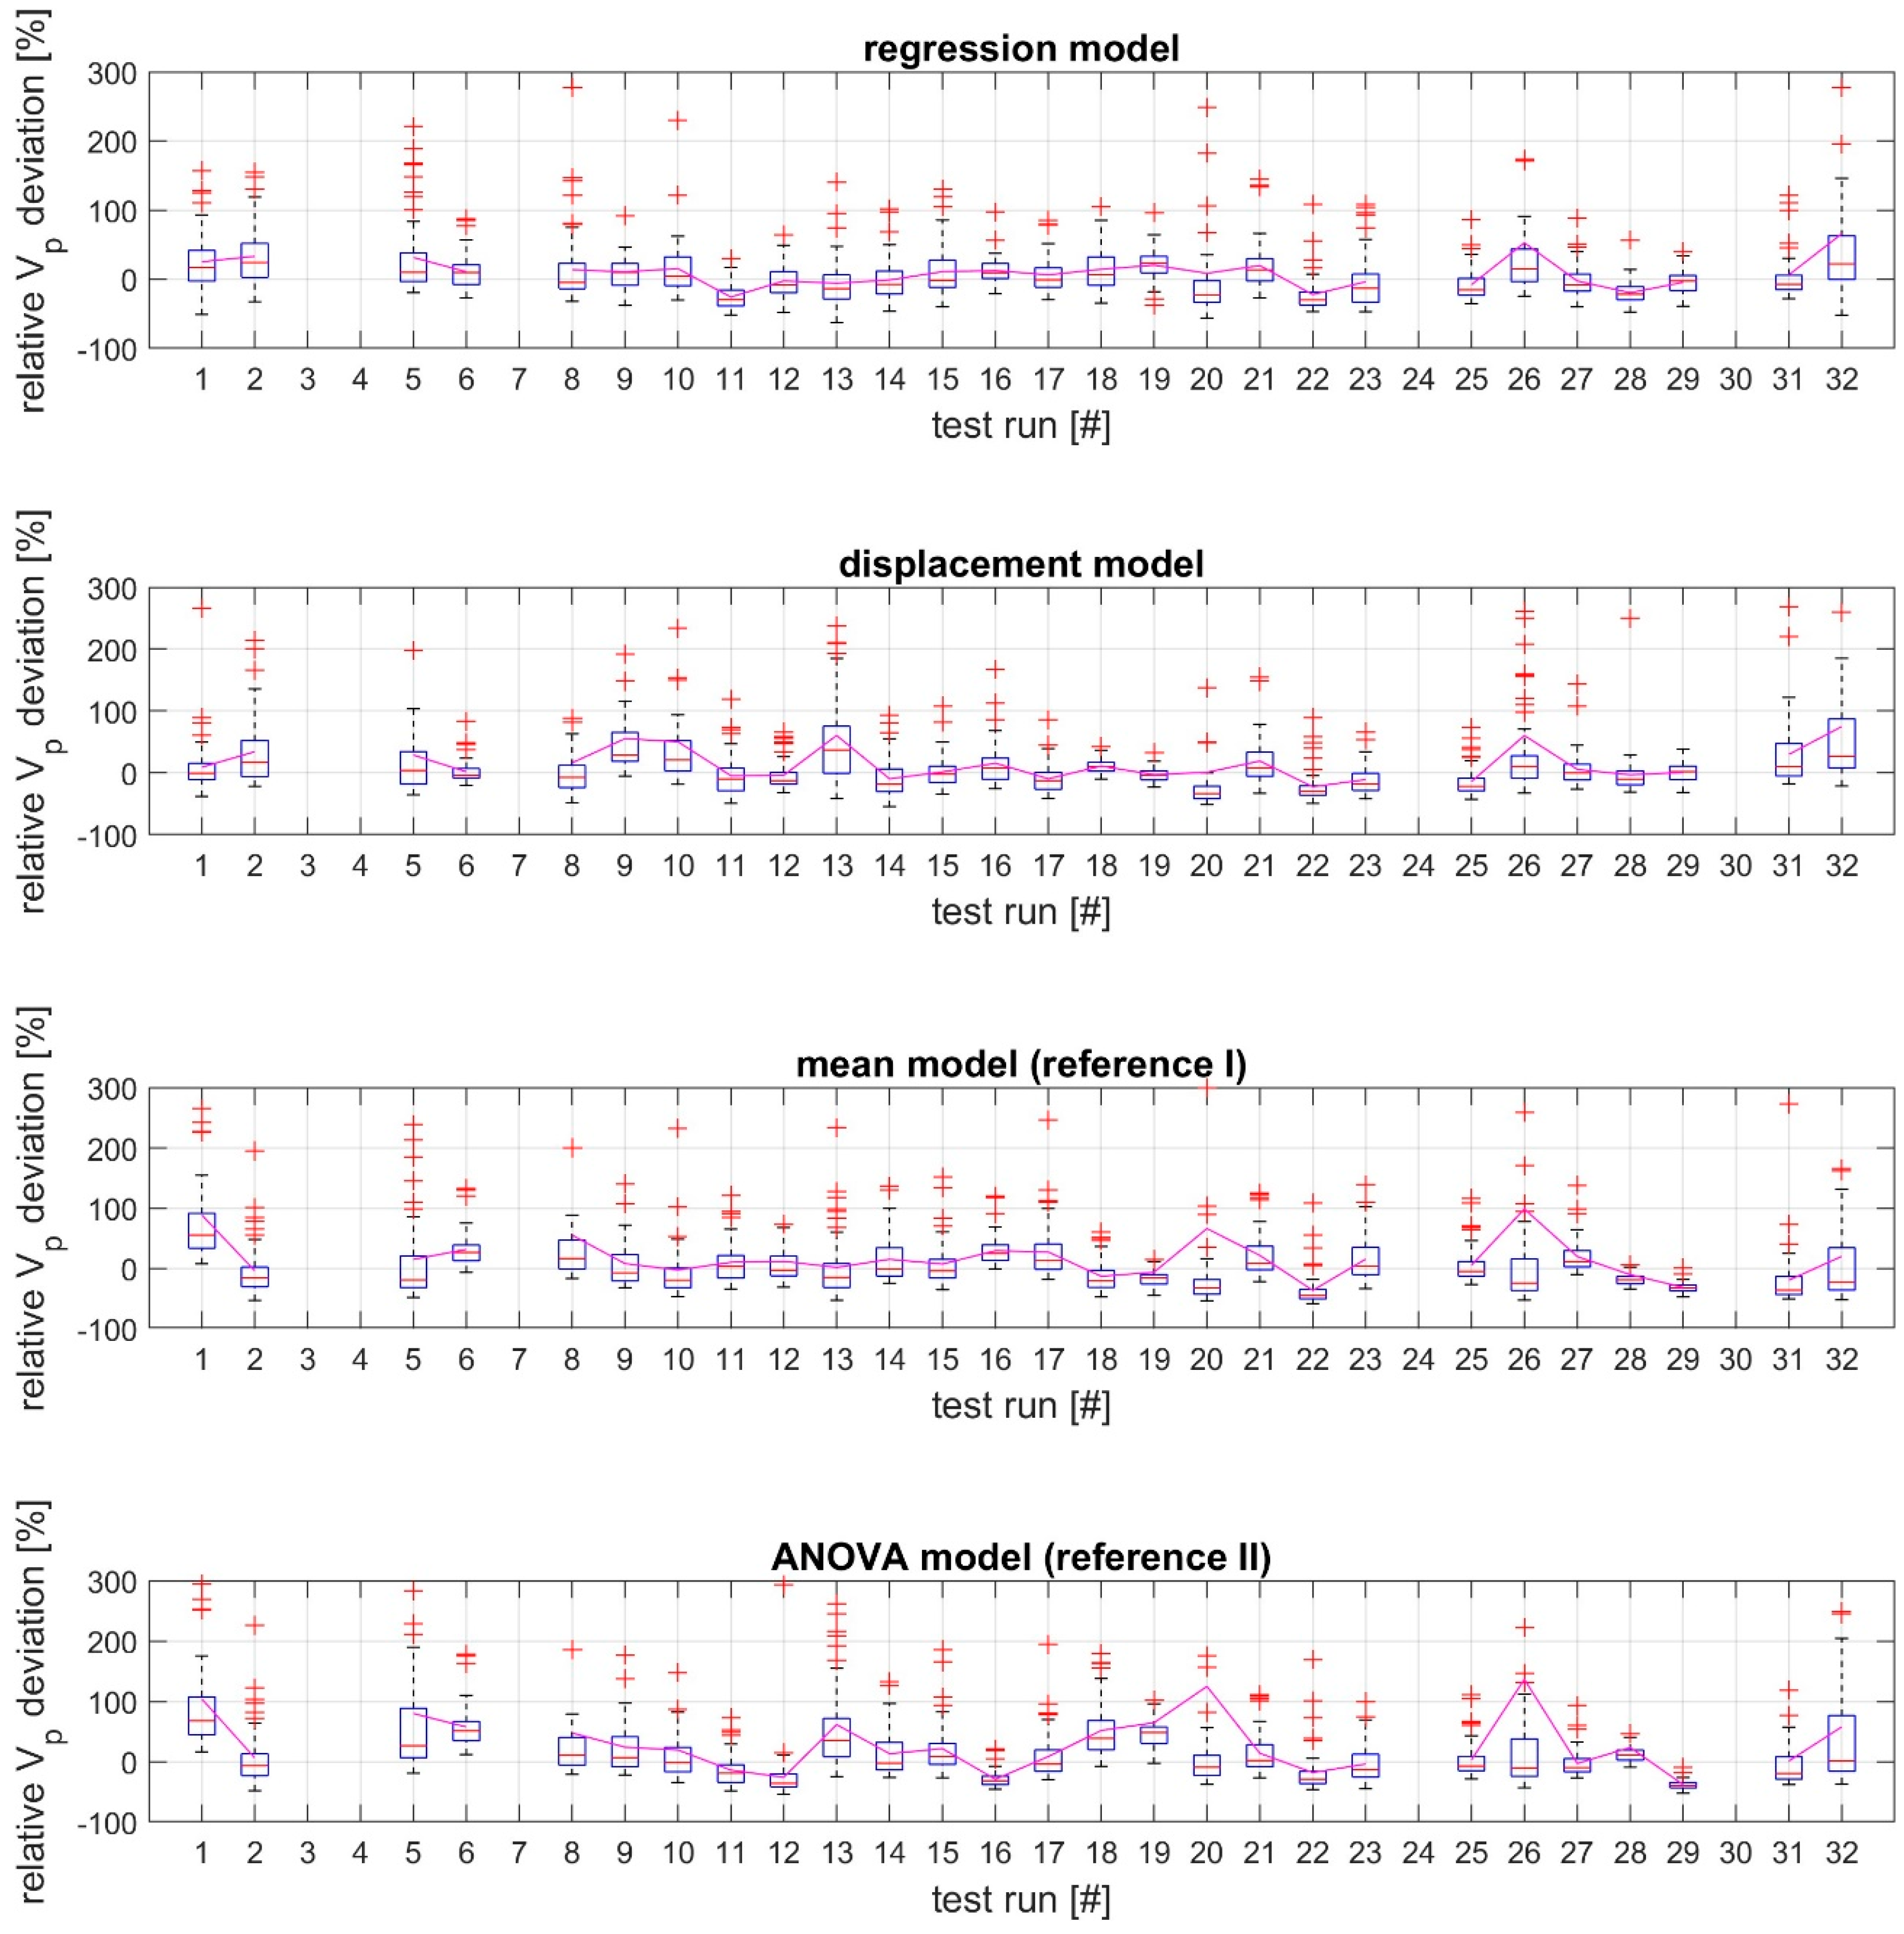
Non-parametric statistical approaches can be used to compare test series that do not have normally distributed data sets. For example, the interquartile range (IQR) is used as a measure of statistical dispersion, whereby this represents the dispersion of the middle 50% of the data. The interquartile range is defined as the difference between the third quartile (Q3) and the first quartile (Q1) in a data set. This is often displayed graphically as part of a boxplot, allowing for quick interpretation. The boxplot visualizes the interquartile range as a box, usually in combination with the mean and median of the entire sample. The samples outside the interquartile range are displayed up to a distance of or and are plotted as whiskers. The significance of the interquartile range lies in the aspect of robustness against outliers, as only the middle 50% of the data are taken into account and the influence of outliers is therefore low.
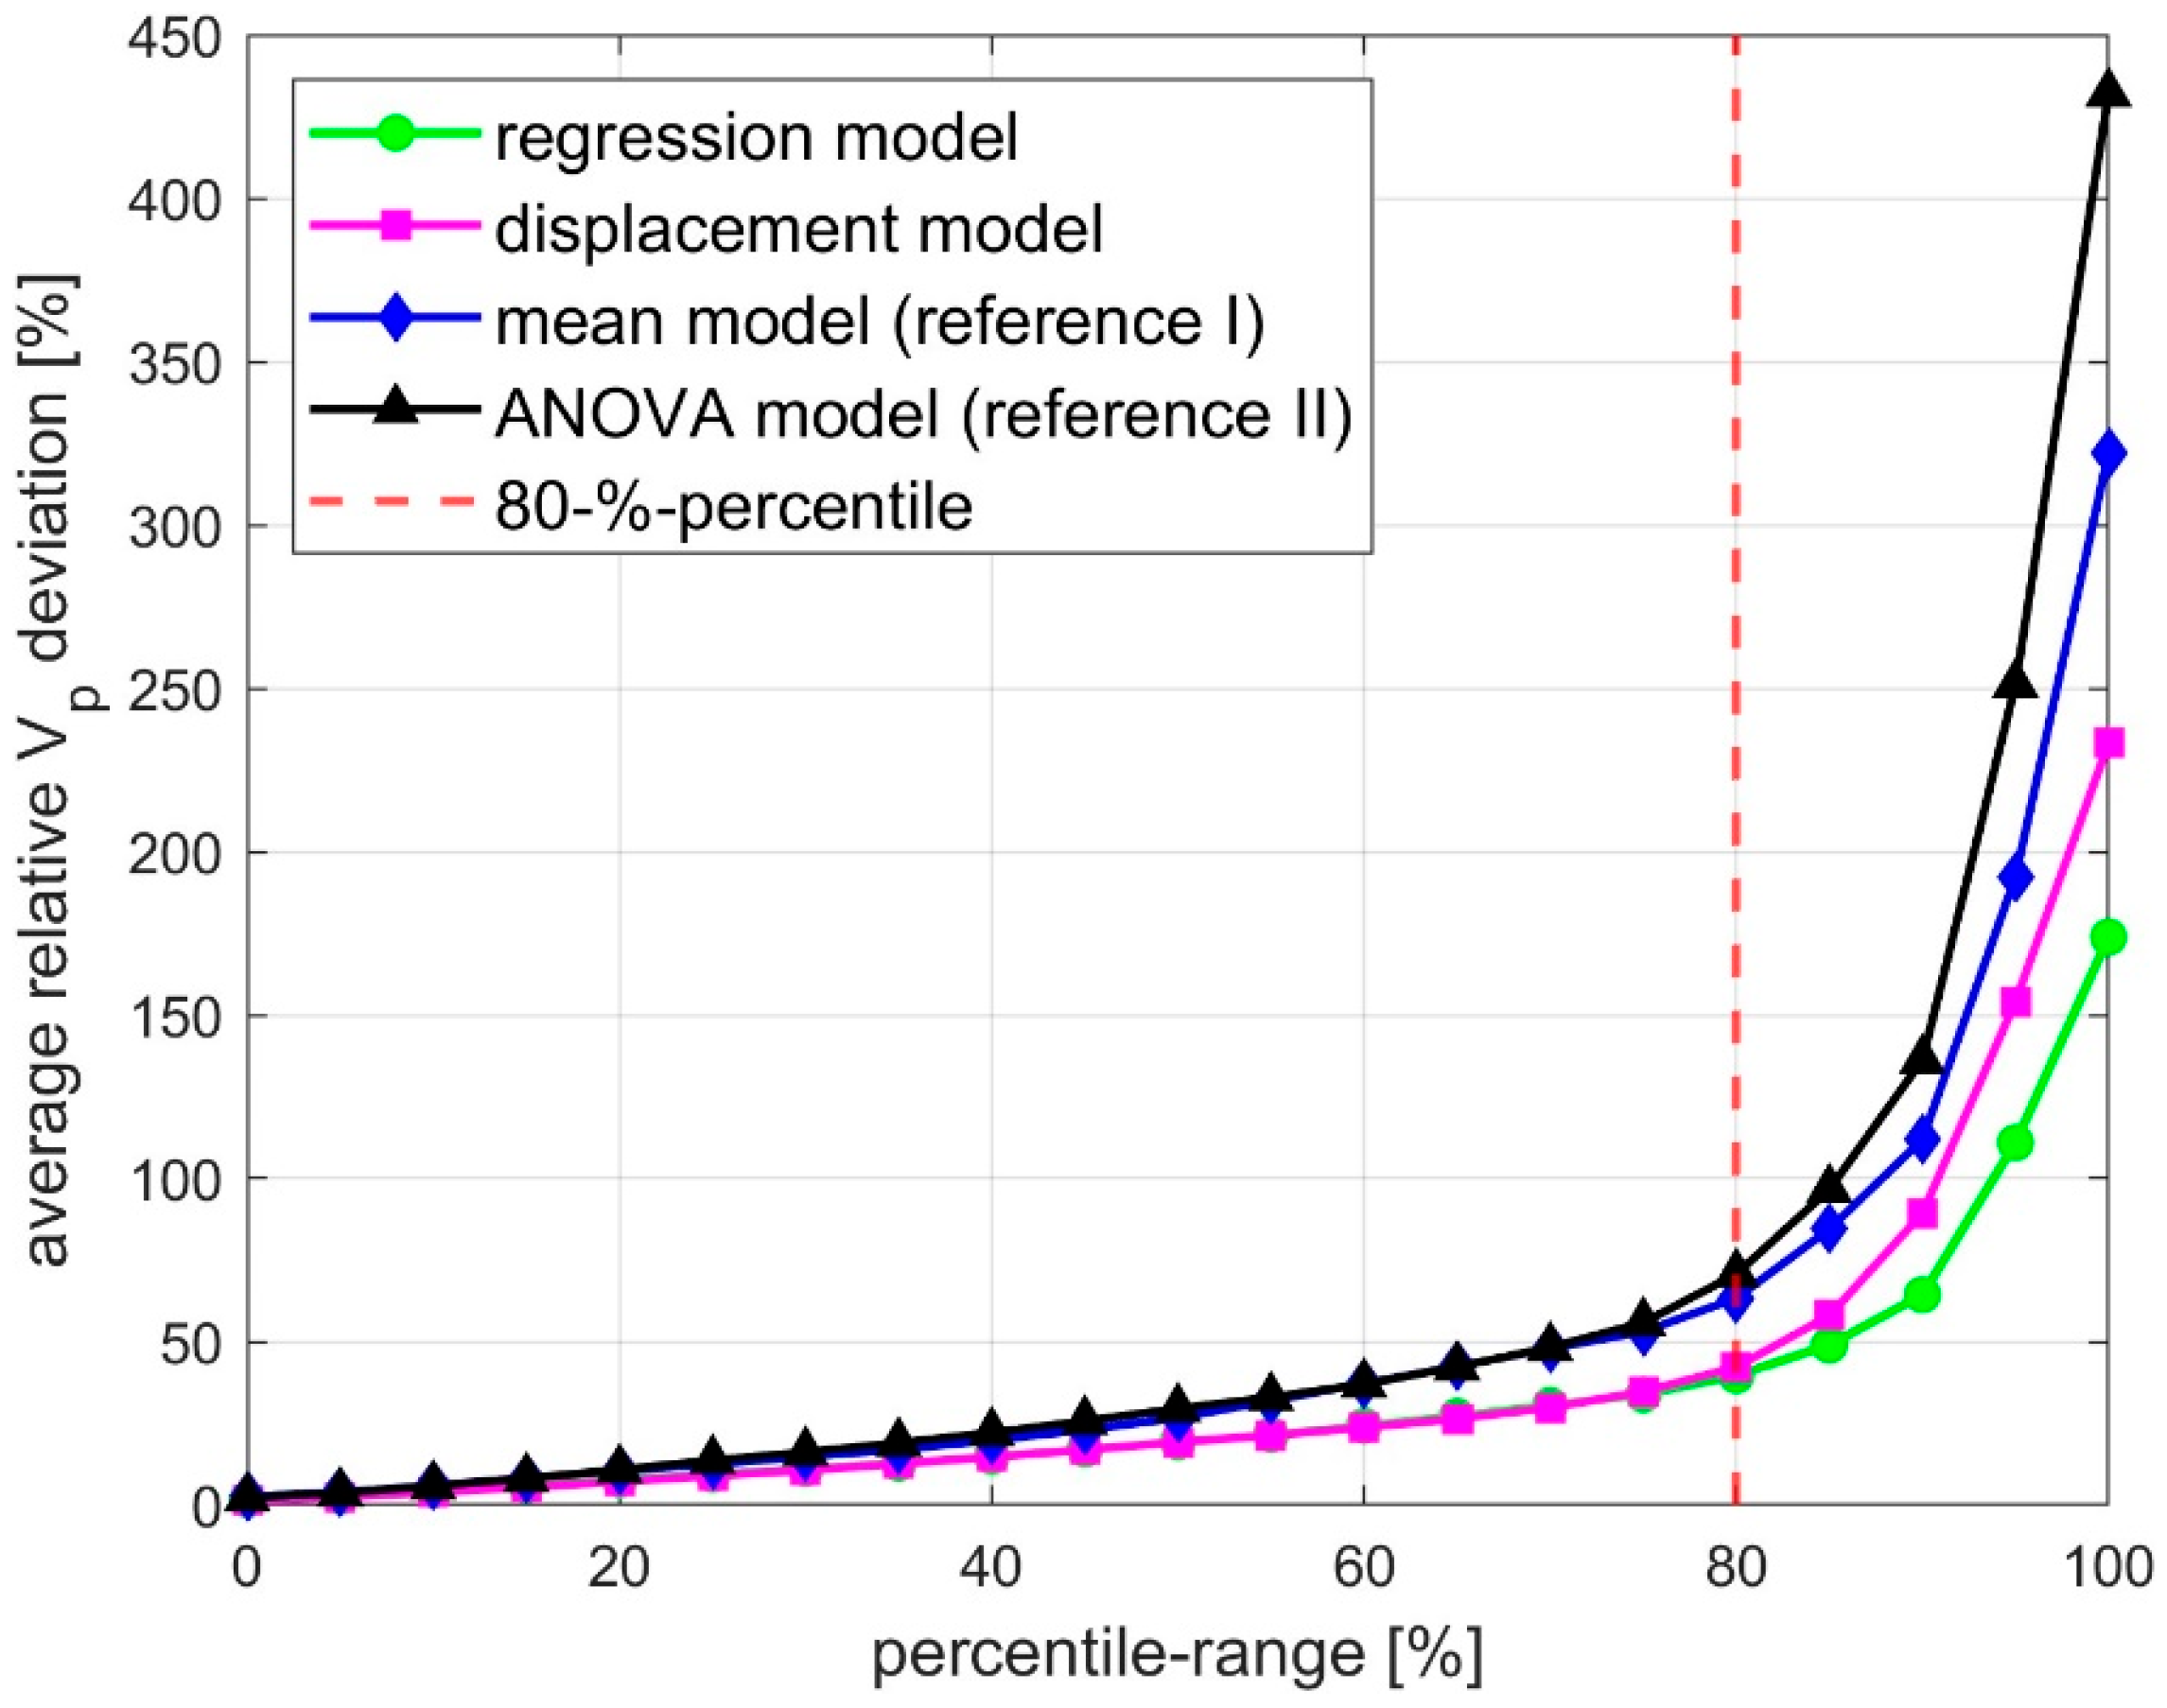
In order to consider a larger proportion of the data in the evaluation, a larger range, for example between the 10th and 90th percentiles, can be considered instead of the interquartile range. This means that 80% of the data points are taken into account and only 20% are not considered.
4. Conclusions
The investigative process has shown that the regression and displacement models are credible and perform better than the reference models. The regression model provides a 23% more accurate estimate when the 80th percentile of the non-specific configuration (“all configurations”) is considered, and the displacement model provides 21% more accuracy than the best reference model (mean value model). However, these models are still less accurate than commercial solutions for direct measurement of the volume throughput capacity. The mixed commercial waste (input material) is inhomogeneous, which complicates the relationship. No proof exists that the cutting-gap setting influences prediction accuracy, but the results suggest better model results from an open cutting-gap. There are already major differences in configurations. The models’ performance for variant V is the best, with the highest levels of prediction accuracy. In consideration of the 80th percentile, the displacement model demonstrates a 27% higher accuracy in estimating volume throughput performance than the reference model (mean value model). In this instance, the developed displacement model provides an estimation accuracy of ±27%, the developed regression model provides an accuracy of ±32%, and the mean value model provides an accuracy of ±54%. A comparison of the regression and displacement models reveals a certain degree of similarity.
The regression model performs better when measurement data (including outliers) are fully taken into account. The displacement model is more cost-effective as it is based solely on drum speed and geometry data. The regression model requires supplementary drum torque information. The regression model’s key strength is its ability to calculate the throughput rate, which is dependent on the load (here, drum power). This eliminates the risk of errors caused by poor loading, showing that the model approaches are appropriate for measuring performance.
These findings are important for future advancements and emphasize the need for more accurate models. The models are currently too unreliable to replace existing direct measurement systems. They need to be about ±10% accurate for that to happen. Tests using more homogeneous materials, like wood, could give more data to optimize the models. More data are needed on the cutting-gap setting to spot finer differences. The next phase is to integrate the calculation models into the test vehicles’ machine control software, enabling their validation in future test series. Adding data from these test series in various settings will improve model accuracy.
In addition to optimizing the models described, the use of AI could also be an interesting area of research in this context. These methods, including deep-learning algorithms, impose greater demands on computing power, yet they may also enhance the precision of predictions.


