Article

Solar, Wind, Hydrogen, and Bioenergy-Based Hybrid System for Off-Grid Remote Locations: Techno-Economic and Environmental Analysis

1
School of Engineering and Technology, Central Queensland University, Melbourne, Victoria 3000, Australia
2
Department of Mechanical Engineering, Rajshahi University of Engineering & Technology, Rajshahi 6204, Bangladesh
3
Mechanical and Aerospace Engineering, Missouri University of Science and Technology, Rolla, MO 65409, USA
4
Queensland Micro-and Nanotechnology Centre, Griffith University, Nathan, QLD 4111, Australia
*
Author to whom correspondence should be addressed.
Clean Technol. 2025, 7(2), 36; https://doi.org/10.3390/cleantechnol7020036
Submission received: 28 February 2025 / Revised: 15 April 2025 / Accepted: 20 April 2025 / Published: 23 April 2025

Abstract

:
Transitioning to clean energy in off-grid remote locations is essential to reducing fossil-fuel-generated greenhouse gas emissions and supporting renewable energy growth. While hybrid renewable energy systems (HRES), including multiple renewable energy (RE) sources and energy storage systems are instrumental, it requires technical reliability with economic efficiency. This study examines the feasibility of an HRES incorporating solar, wind, hydrogen, and biofuel energy at a remote location in Australia. An electric vehicle charging load alongside a residential load is considered to lower transportation-based emissions. Additionally, the input data (load profile and solar data) is validated through statistical analysis, ensuring data reliability. HOMER Pro software is used to assess the techno-economic and environmental performance of the hybrid systems. Results indicate that the optimal HRES comprising of photovoltaic, wind turbines, fuel cell, battery, and biodiesel generators provides a net present cost of AUD 9.46 million and a cost of energy of AUD 0.183, outperforming diesel generator-inclusive systems. Hydrogen energy-based FC offered the major backup supply, indicating the potential role of hydrogen energy in maintaining reliability in off-grid hybrid systems. Sensitivity analysis observes the effect of variations in biodiesel price and electric load on the system performance. Environmentally, the proposed system is highly beneficial, offering zero carbon dioxide and sulfur dioxide emissions, contributing to the global net-zero target. The implications of this research highlight the necessity of a regional clean energy policy facilitating energy planning and implementation, skill development to nurture technology-intensive energy projects, and active community engagement for a smooth energy transition. Potentially, the research outcome advances the understanding of HRES feasibility for remote locations and offers a practical roadmap for sustainable energy solutions.

1. Introduction

Alleviation of global climate issues requires a notable shift towards renewable energy (RE)-based systems, enabling the mitigation of substantial (about two thirds) greenhouse gas (GHG) emissions borne by the energy sector. In particular, the UN sustainable development goals (SDG) call for ensuring affordable and clean energy supply to all and increasing the RE share by 2030 [1]. Eventually, RE-based energy generation is increasing worldwide. Rationally, Australia is committed to reducing GHG emissions by 43% below 2005 levels by 2030 and achieving net zero by 2050. Moreover, aging infrastructure, unreliability, and higher operational costs, along with climate concerns, are driving the early retirement of many Australian coal power plants [2]. While RE adoption is progressing, the current energy transition indicates an urgent need for more absorption of renewables wherever feasible. Off-grid remote communities usually depend on diesel-based energy systems, emitting extensive carbon dioxide (CO2), a major contributor to GHG emissions. Australian off-grid remote locations account for above 6% of the electricity use of the country [
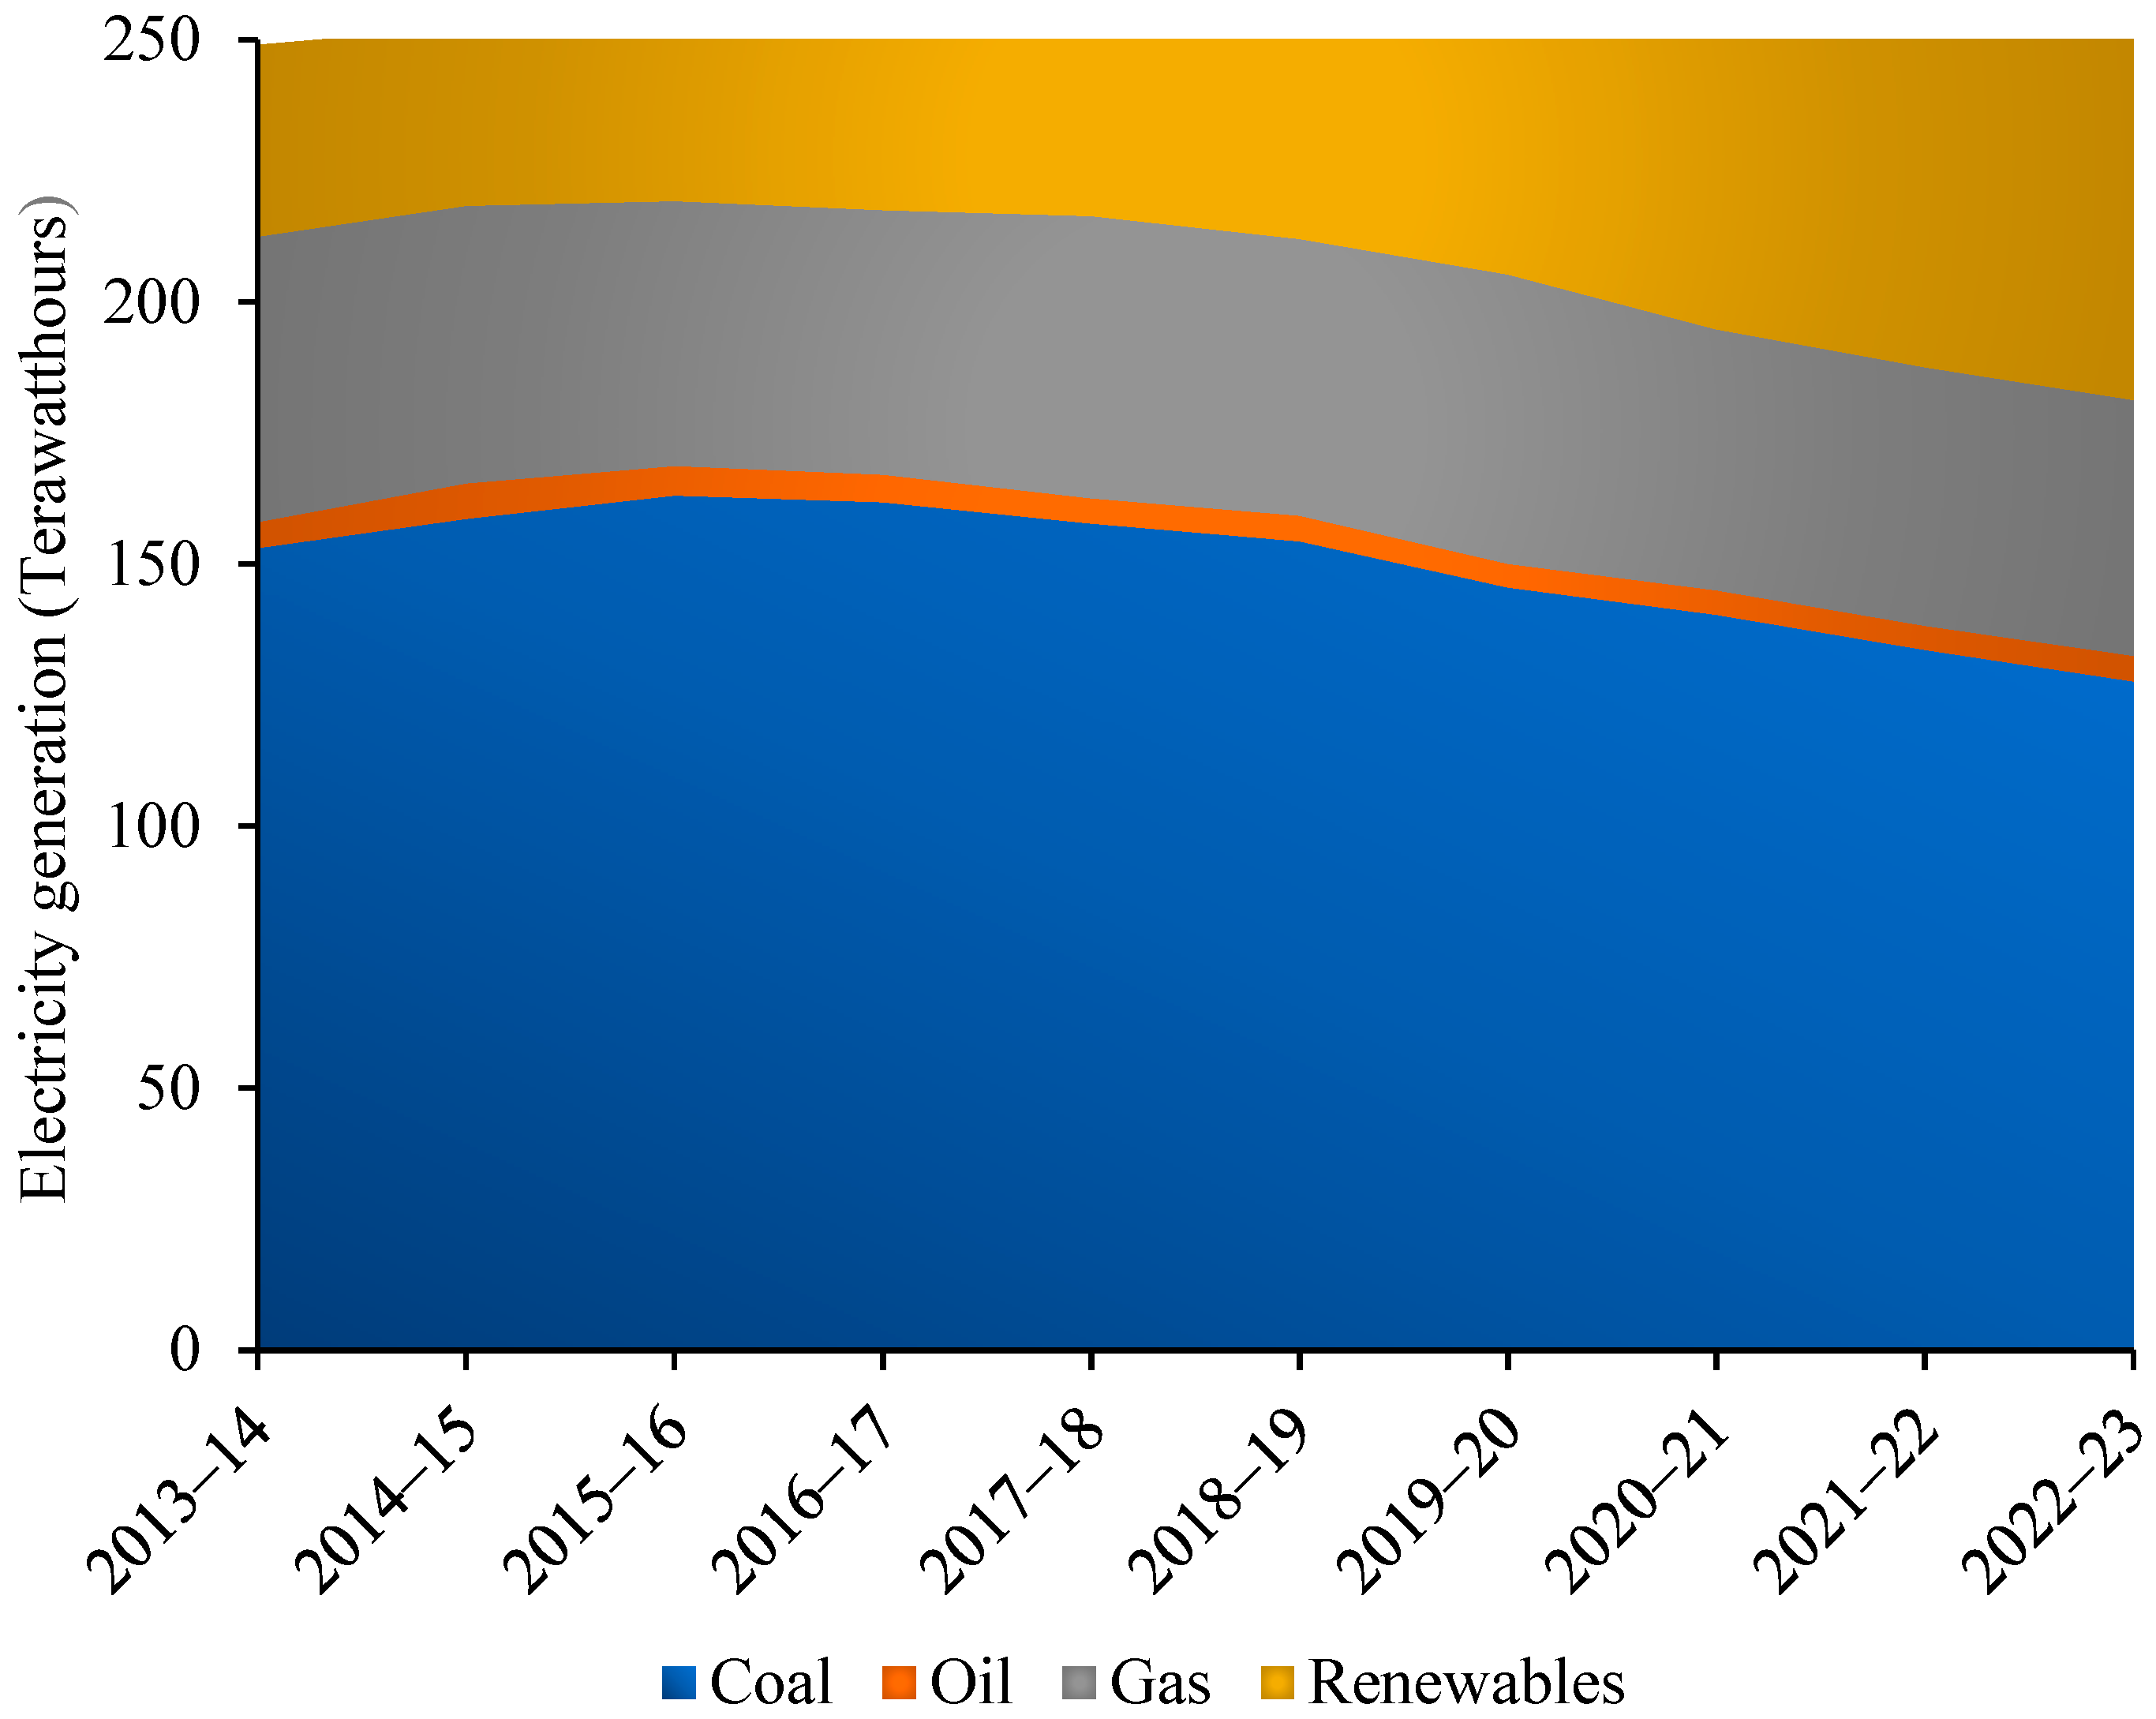
3]. Most of these regions portray the traditional lands of the First Nations peoples, facing consistent challenges in access to reliable and clean energy systems despite their lands being rich in renewable sources. Promoting RE growth and achieving the net-zero targets demands the replacement of carbon-based energy generation utilizing these renewables. Based on the latest official energy data [4], a sketch of the annual electricity generation in Australia is presented in Figure 1, which shows that the lion’s share of electricity generation comes from non-renewables. Although the share of non-renewable generation has decreased in recent years, it is still more than 60% in 2022-23, which needs to be lowered to meet the net-zero target.
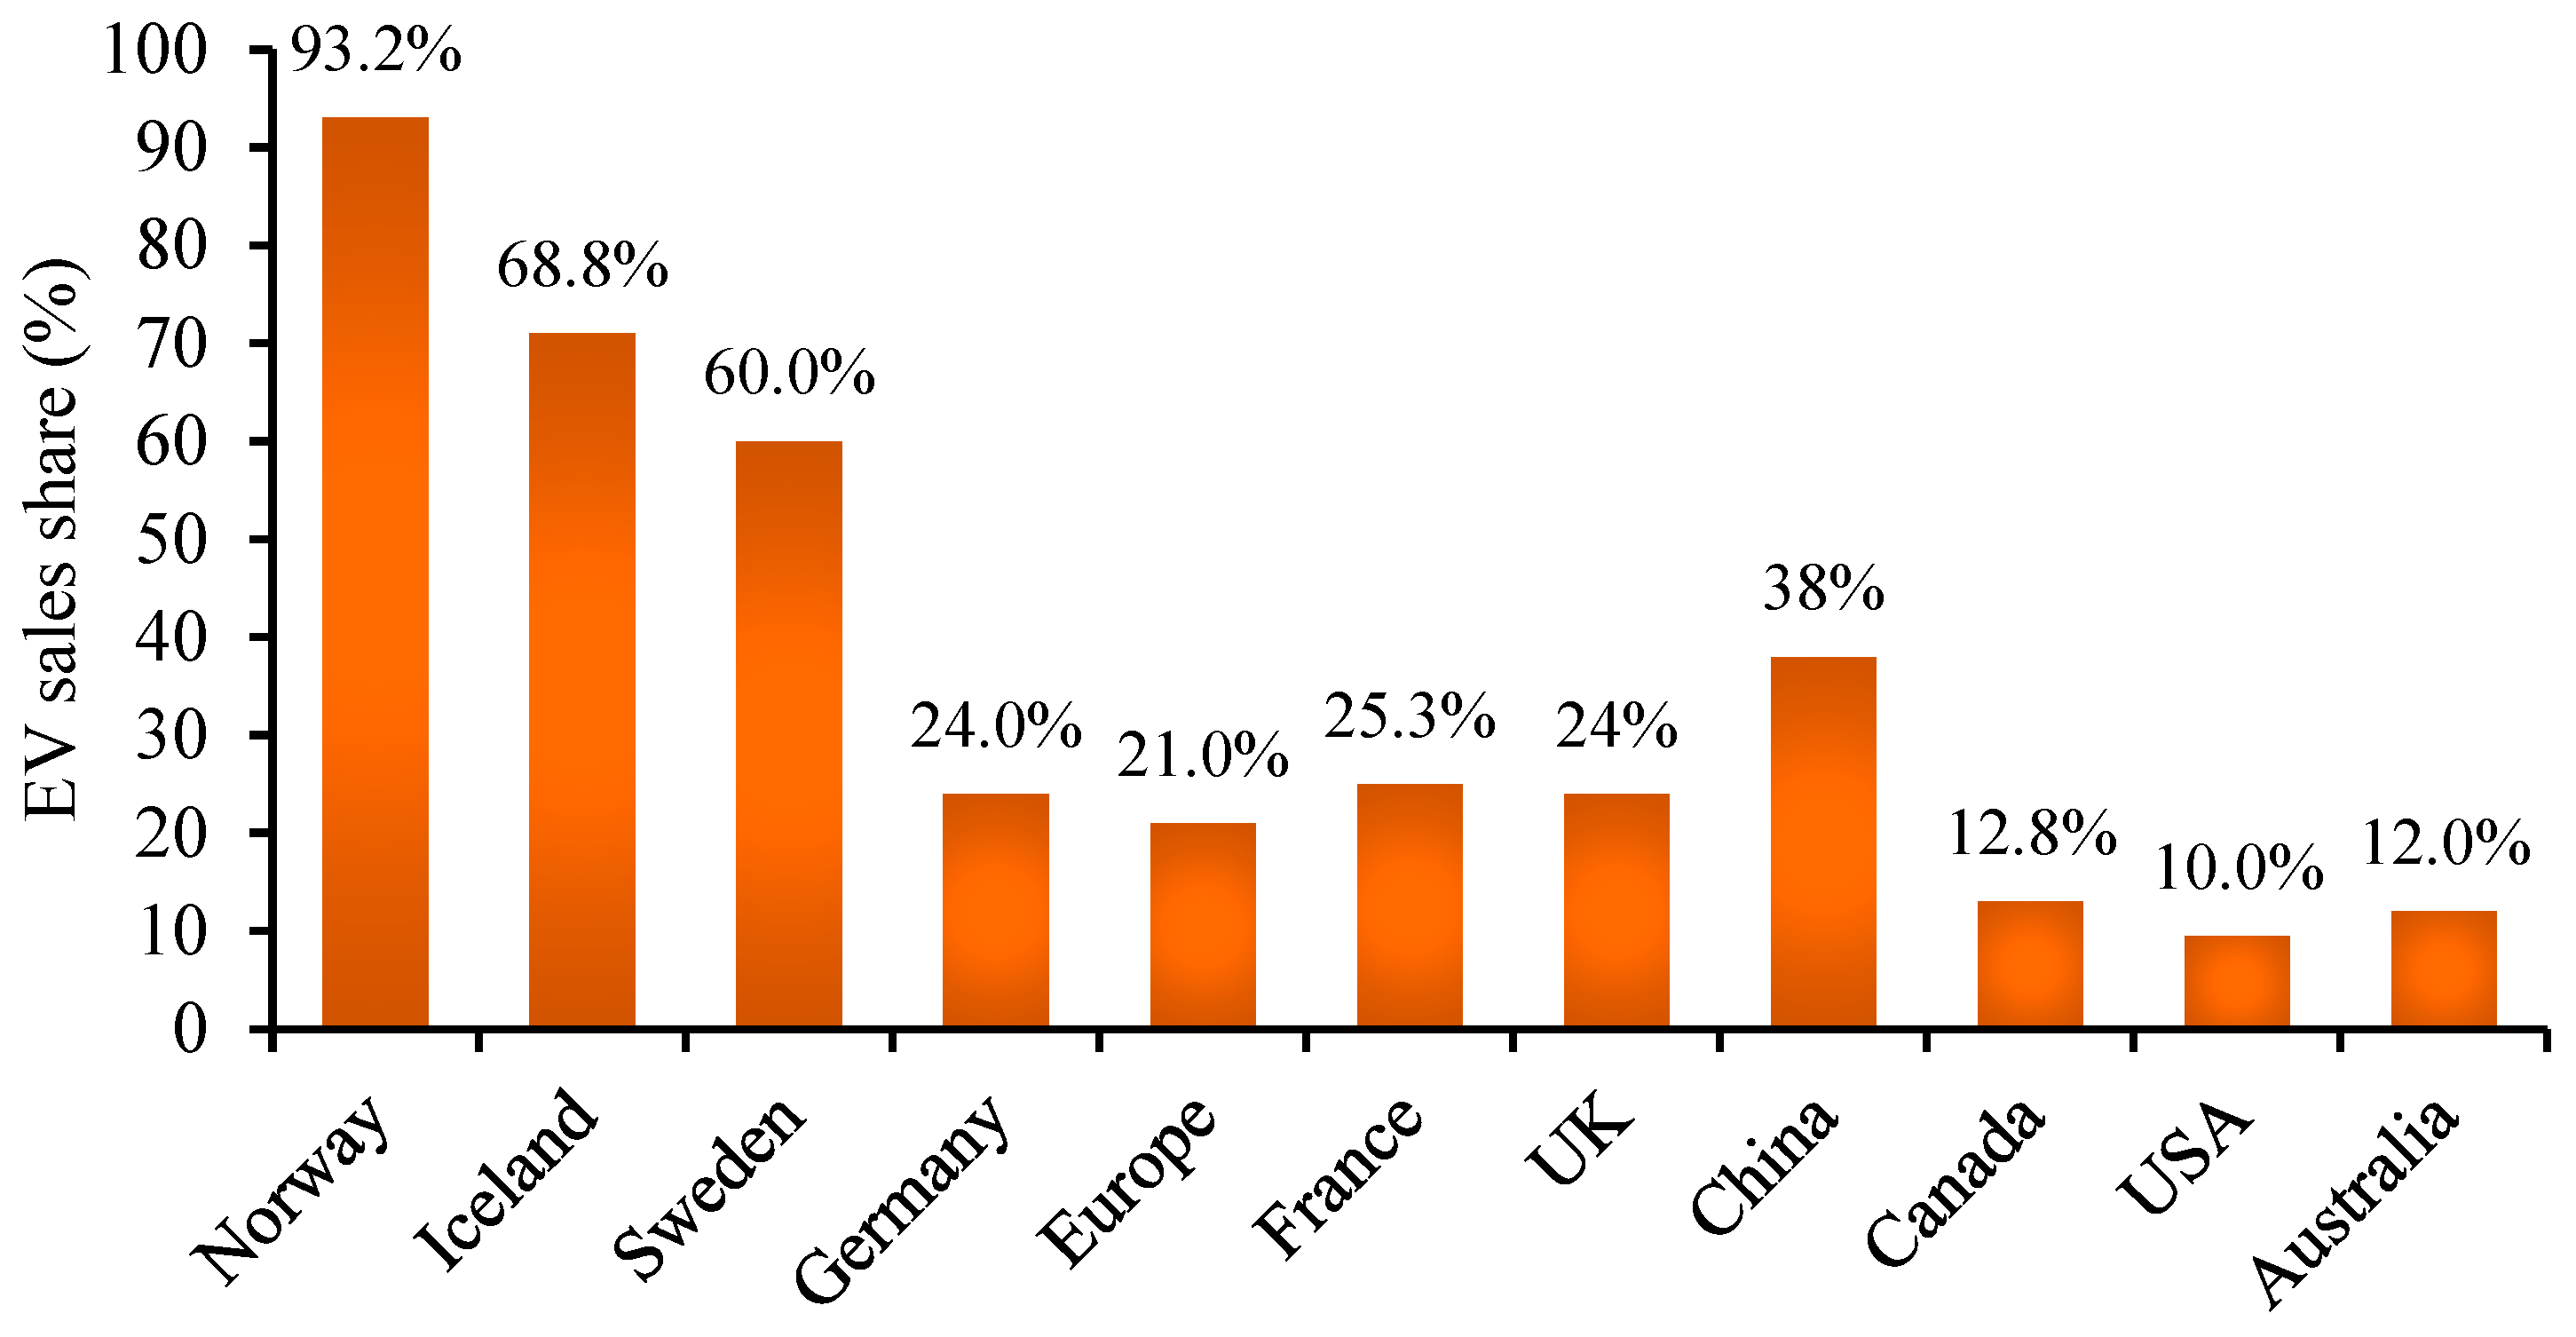
Transportation, another critical sector in the net-zero plan, accounts for almost 21% of Australia’s emissions. Widening the adoption of electric vehicles (EVs) is one of the potential steps to reduce dependency on conventional fuel, accelerate decarbonization, and improve public health, which is reflected in the National Electric Vehicle Strategy [5]. Potentially, RE-based EV charging can provide increased benefits by replacing traditional fuel [6] and promoting RE use and generation. Figure 2 shows the global position of Australia in EV uptake [
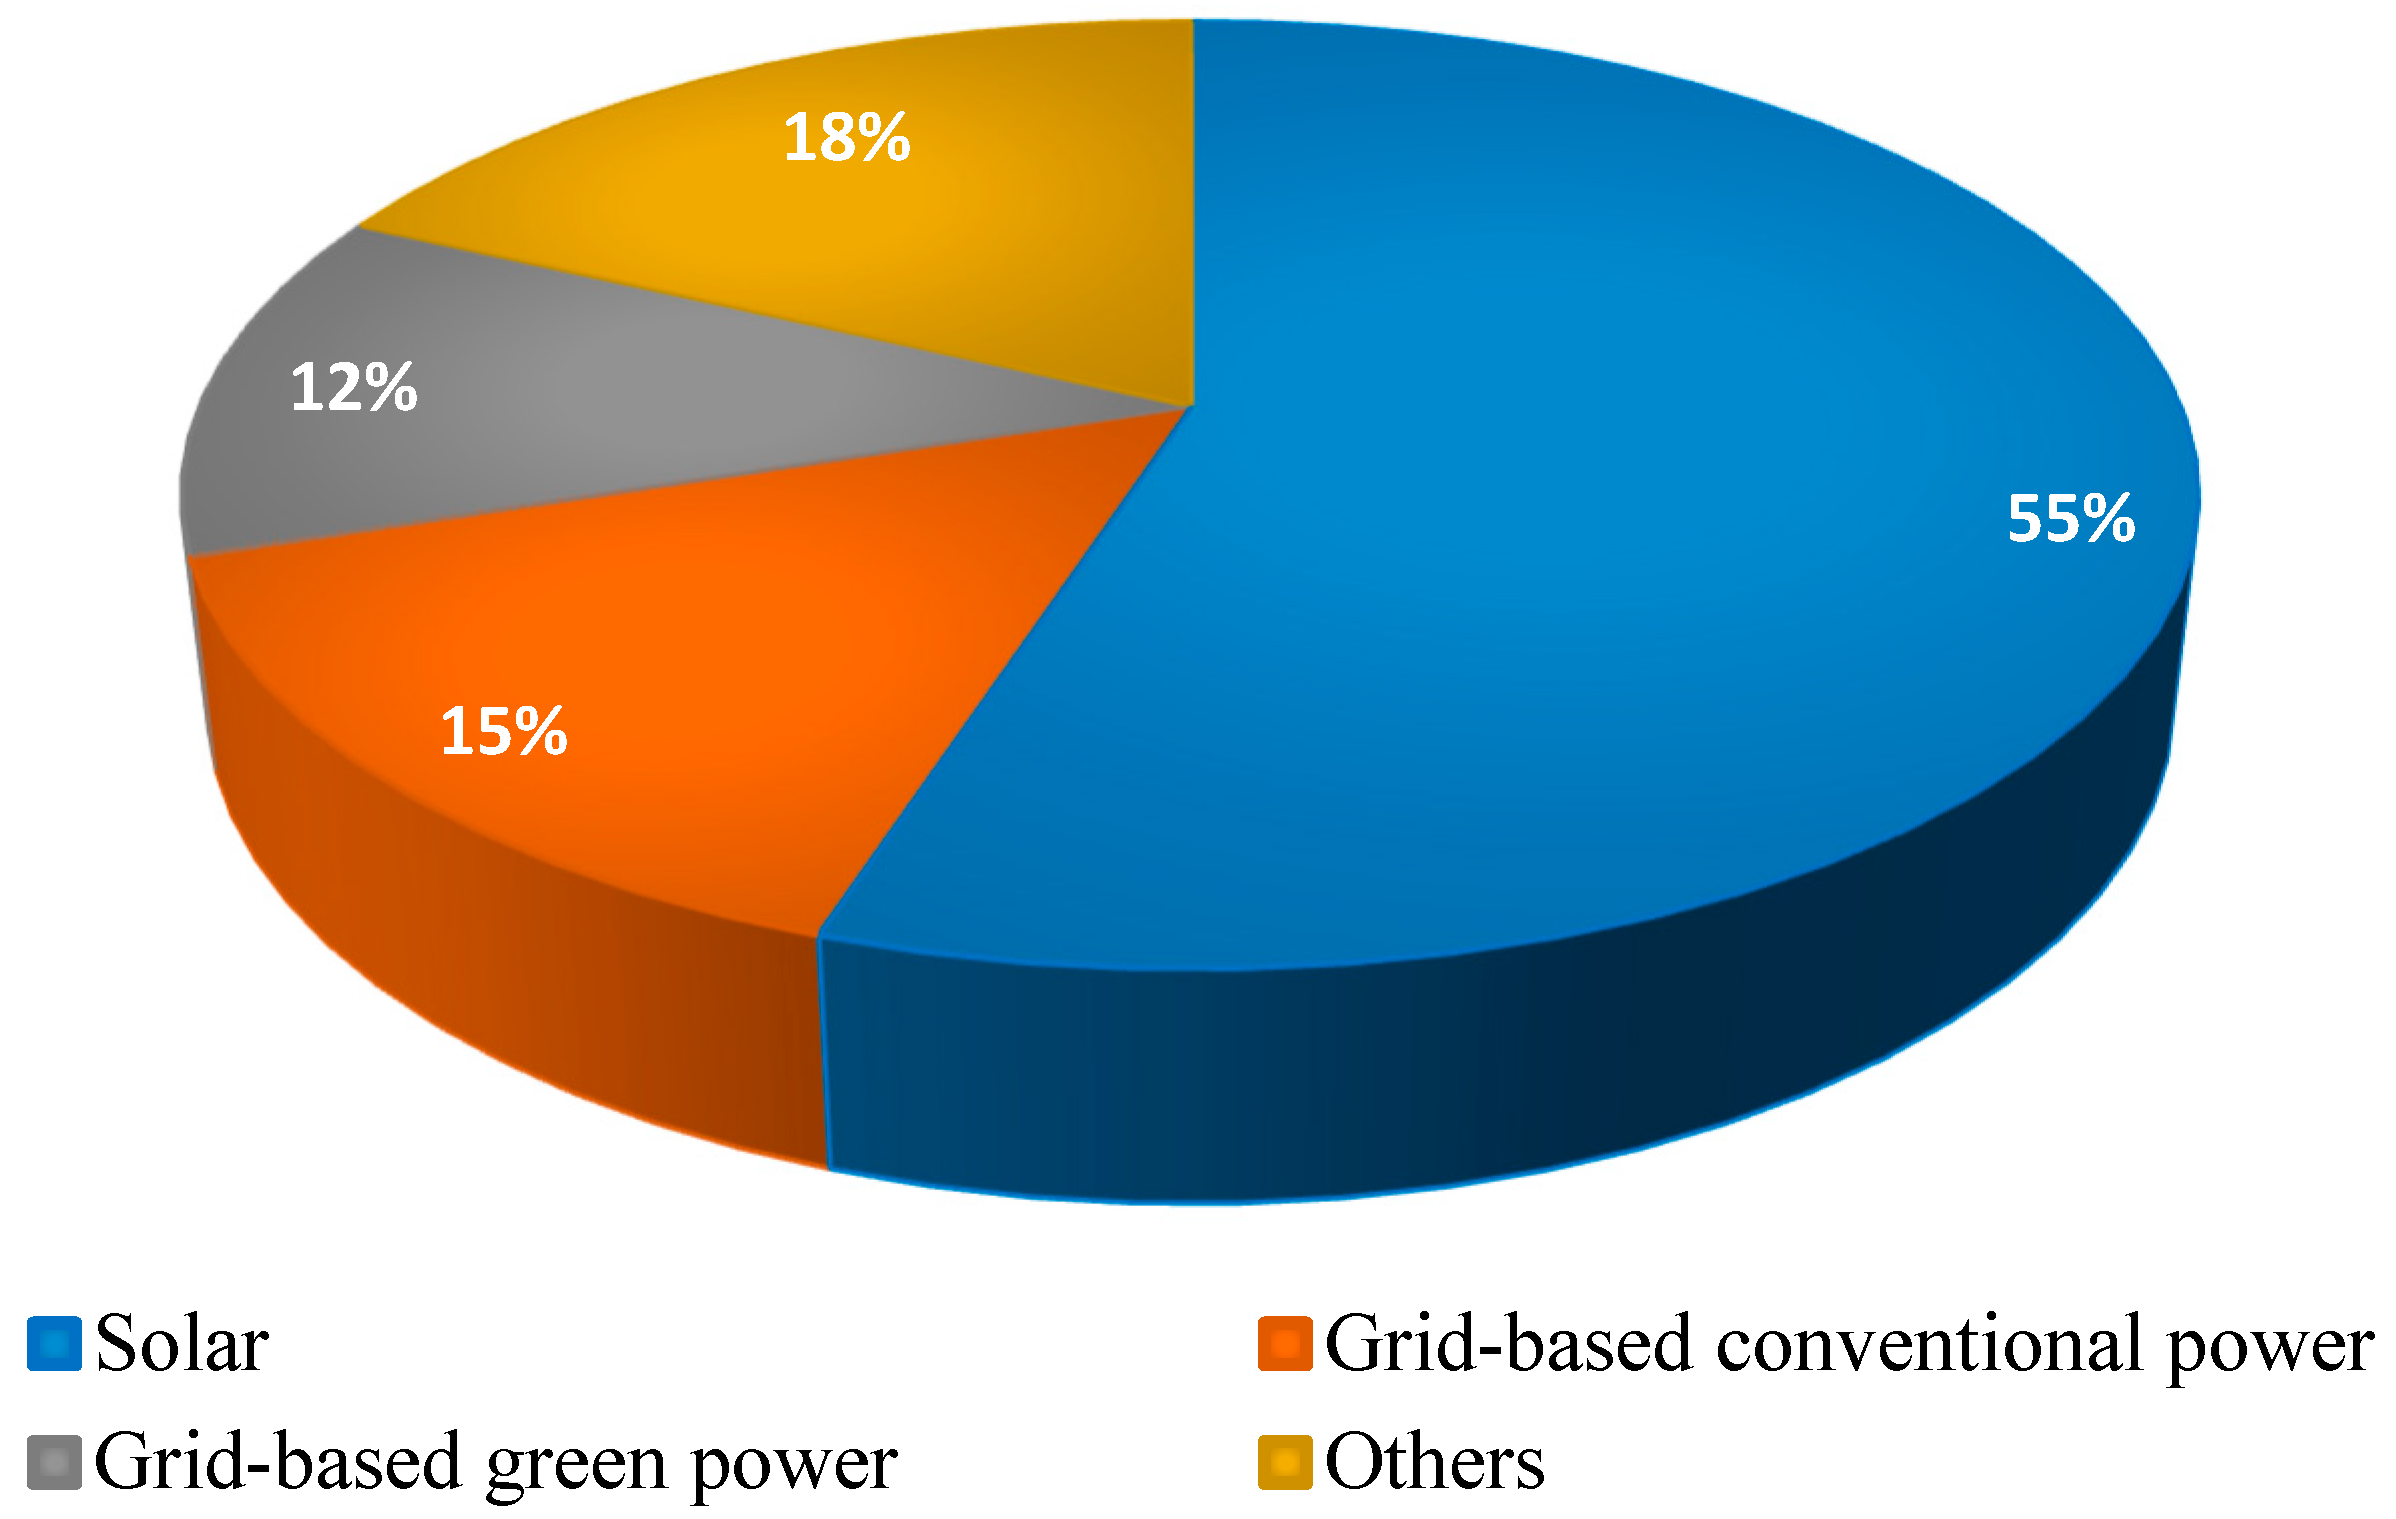
7] and Figure 3 exhibits the higher consumer preferences for RE application for EV charging based on the data sourced in [8].
While RE-based energy systems are crucial for limiting fossil-fuel use and decarbonization, energy storage systems (ESS) are critical to support intermittent-natured RE generation. A hybrid renewable energy system (HRES) can include multiple RE sources and ESSs, where one source can support another to meet any energy deficit. Furthermore, ESSs are supportive of storing energy during surplus generation and supplying it when the RE is not available. Thus, one component can complement another, increasing the reliability and efficacy of the energy system [9]. RE can be harnessed from solar, wind, biomass, geothermal, hydro, and other sources, among which solar photovoltaic (PV) and wind are prominent. While promoting RE-based energy systems calls for diverse sources, hydrogen plays a vital role in sustainable global RE adoption. Hydrogen energy is a future energy carrier with the properties of long-term energy storage [10]. Renewable hydrogen can provide clean energy through electricity and heat generation and serve as a transport fuel. Moreover, bioenergy-based electricity generation is another green technology to reduce dependence on conventional fuel and combat carbon emissions [11]. Biodiesel, a renewable and biodegradable biofuel, provides zero sulfur emission while reducing carbon monoxide, particulate matter, and hydrocarbon emissions [12].
Implementation of an HRES with multiple energy sources and storage systems requires an optimal design to ensure technical reliability and economic efficiency. NREL’s hybrid optimization and model for multiple energy resources (HOMER) software is a versatile tool that offers a simple and highly feasible simulation and optimization technique [13] and has been widely used to evaluate techno-economic solutions of energy projects in past research. In the study [14], the implementation of a grid-connected hybrid energy system, including PV and reformer fuel cell, is examined using HOMER while comparing different PV tracking systems. PV/fuel cell (FC)/battery and PV/battery systems are analyzed in Malaysia to replace diesel-based energy systems [15]. The levelized cost of hydrogen (COH) was found as USD 99.9/kg, limiting the frequent operation of FC. With a cost of energy (COE) of 0.323 USD/kWh, the PV/battery system provided the optimal configuration [15]. Al-Badi et al. [16] compared the diesel-based system with PV, wind turbine (WT), FC, and battery-integrated hybrid systems and found the PV/wind/FC system as optimal with an energy cost of USD 0.436/kWh and net present cost (NPC) USD 2.1 billion. Garip et al. [17] conducted a techno-economic analysis of grid-connected hybrid energy systems, including PV, WT, biomass generators, battery, and diesel generators (DG) for a Turkish university campus. They optimized the hybrid systems considering load capacities below and above 5 MW. For both scenarios, the grid-connected PV, WT, and diesel-included system was found as optimal, providing up to 82% emission reduction. The addition of a biomass generator and battery was not cost-effective due to the lack of sufficient biomass resources and high component cost, respectively. However, they recommended including the maximum possible renewable sources in HRES through proper economic valuation [17]. Hybrid systems, including PV, WT, micro-hydro, battery, DG, and biodiesel generator (BDG), were found optimal for designing a rural microgrid [18]. This system could deliver energy at USD 0.196, offering an 81.2% renewable fraction. In [19], biodiesel-based energy generation is included to counteract the DG-generated pollution in the energy system of Indian Island. The HRES consisting of wind, tidal energy, and biodiesel has been examined with different energy storage technologies, including lithium-ion battery (LIB), lead acid battery (LAB), flywheel, and pumped hydro. According to the result, both the LIB and LAB integrated systems are found as optimal systems with similar COE (USD 0.263/kWh) and NPC (USD 1.3 M). It is worth mentioning that thermal energy systems (TES) offer an effective option for RE utilization and energy efficiency where stored thermal energy can be delivered during peak hours and as needed [20]. Optimal sizing of hybrid systems, including PV, WT, concentrated solar power system, battery, and TES, is studied in [21], where TES is used to store thermal energy from the solar system. Leveraging the benefits of multiple energy sources and storages, the study obtained a low-cost energy of 0.18 USD/kWh. Optimization of an EV charging station is also studied in [22], where the HRES offers 44.4% wind energy and 55.6% PV with the cost of energy of USD 0.064/kWh.
Australia is enriched with plenty of renewable resources, including solar and wind, that attract potential HRES research within the academia. Profitability analysis on PV/battery hybrid systems is conducted for residential energy consumers in Southeastern Australia [23]. The capacity of the system components is analyzed based on low, moderate, and high load demand following a time-of-use tariff structure. The result shows the maximum benefits for the high-demand consumers referring to the suitability of the PV/battery system for community microgrids. The authors of the study [24] examined the feasibility of a fully RE-based hybrid system for Western Australia’s remote communities. Different combinations of hybrid systems are analyzed, including PV, FC system, and battery, and compared with the diesel-based system. According to this analysis, the PV/FC/battery system was found as most efficient with NPC 3.23 M$, COE $ 0.342, and zero CO2 emissions. The techno-economic analysis of PV, wind, battery, FC, and diesel integrated hybrid systems in regional Western Australia is studied in [25]. This study found the good performance of FC included system in carbon emission reduction; however, with a higher COE (USD 0.524/kWh) and NPC (USD 4.58 M). A summary of the HRES-based research in Australia is included in Table 1.
The literature shows the promising role of RE-based energy systems in delivering low-cost energy and emission reduction. Although previous studies offer diverse and potential HRES-based research, off-grid remote locations need more attention to meet global decarbonization. Therefore, the main purpose of the study is to design and evaluate a hybrid renewable energy system to provide cost-efficient, reliable, and clean energy to remote Australian communities, particularly Palm Island. The study seeks to address existing research gaps by integrating bioenergy, hydrogen fuel cells, and electric vehicle (EV) loads into the energy system alongside traditional renewable components like PV, wind turbines, and batteries. It addresses several critical concerns in the existing context as follows:
  • Implementation of net-zero targets requires phasing out of fossil-fuel-based plants and reliable RE-based systems. While energy supply through solar, wind, and hydrogen energy gains much research attention, combining bioenergy with these technologies remains underexplored—particularly in the remote locations of Queensland, Australia—despite its potential to enhance RE application. The present research studied an HRES comprising PV, WT, battery, FC, and biodiesel generator, which can provide insights to the energy researchers and policymakers with the applicability of such energy systems and expand the RE-research horizon limiting fossil-fuel use.
  • To maintain a reliable energy supply in an intermittent-natured RE-dominated system use of DG is common in past research [18,32,33]; however, it is conducive to carbon emission. In this study, the application of a biodiesel generator supports the proposed RE-based system with a dispatchable renewable source, avoiding the use of fossil-fuel-based DG and unexpected CO2 emissions. Considering Queensland’s leading position in Australia’s bioenergy policies and its efforts on sustainable biofuel generation and use, utilizing such local resources contributes to the state’s zero-emission target [34].
  • The inclusion of EVs in an HRES alongside residential loads in remote settings is uncommon, especially in Australia. Such a system has the potential to reduce transport-generated emissions using RE and provide environmental benefits, which is considered in this work. Furthermore, this aspect is supportive of Queensland’s Zero-Emission Vehicle Strategy aiming to place Queensland as a powerhouse of clean vehicles [35].
To bridge the research gaps, the main objectives of this study are as follows:
  • Performance evaluation: Analyze various HRES configurations combining PV, WT, FC, battery, and BDG, with and without diesel generators, in terms of technical, economic, and environmental efficiency.
  • Emission reduction from transport: Assess the impact of integrating EV loads into the HRES, aiming to reduce transportation-related emissions in remote areas.
  • System optimization: Identify the optimal hybrid system configuration that achieves a balance among cost-effectiveness, low carbon emissions, and reliability under different operational conditions.
  • Sensitivity analysis: Investigate the robustness of the optimal system by examining its performance under variable load conditions and biodiesel price fluctuations.
The HOMER Pro software is used in this study to conduct a detailed techno-economic analysis of various HRES configurations, providing valuable insights into cost-effectiveness, carbon emissions, and system efficiency. Potentially, the research underscores the socio-economic benefits of transitioning to renewable energy, supporting government initiatives aimed at cleaner energy and improved quality of life for remote communities. By addressing the identified gaps and making the above contributions, the study not only advances the understanding of HRES feasibility for remote locations but also offers a practical roadmap for sustainable energy solutions that can be replicated in similar contexts globally.
The rest of the paper is structured as follows: Section 2 includes materials and methods of the study, which discusses the hybrid systems configurations and optimization strategy, and the input data information. Section 3 presents the results and discusses the techno-economic, environmental, and sensitivity analysis. Section 4 outlined the validation of the input data. Section 5 concludes the research study.

2. Materials and Methods

This study analyzed four hybrid systems to examine the feasibility of supplying cost-effective energy with optimal decarbonization at Palm Island using HOMER software. Furthermore, Python 3.9 Programming and Microsoft Excel are used for visualization and data validation. Through the simulation and optimization process, HOMER provided feasible solutions for hybrid systems and assessed the optimal system. A brief of the methodology followed in the study is presented in Figure 4.

2.1. HOMER Technique

The HOMER analysis is executed encompassing both pre- and post-analysis. Initially, at the pre-HOMER analysis stage, several input data are determined including load profile, resource parameters (PV, wind, temperature, etc.), cost and technical specification of the components, and project constraints. During the HOMER analysis stage, technical feasibility is examined by the simulation of possible configurations. The energy balance of the system is calculated at hourly time step over a year and compared to the corresponding demand. Economic calculations are then conducted if the configuration is deemed feasible [17]. In the optimization process, decision variables, including components’ capacity ((capacity of PV, converter, hydrogen system (FC, electrolyzer and HT), BDG and DG, number of WT and battery)) and dispatch strategy are optimized, minimizing the objective function (net present cost) and complying the constraints (e.g., maximum annual capacity shortage, minimum renewable fraction and operating reserve). The optimization process continues until convergence is achieved in both system design (exercising the precision in the decision variables) and net present cost (satisfying the precision criteria) [36]. Upon obtaining the optimized feasible configurations, these are sorted ascending net present cost, enabling the evaluation of the optimal system. In the post-HOMER stage, the performance of the optimal system is analyzed, and, a sensitivity analysis is conducted to assess the effect of uncertain conditions on the optimal system using multiple values of input parameters (load and biodiesel price). Additionally, the input data used for the load profile and solar resources are validated using a correlation analysis.

2.2. System Configurations and Optimization

In this work, four hybrid system configurations are studied as described in Table 2 and sketched in Figure 5 below.
Proper sizing of the system components is crucial to ensure cost-effective load supply. This aspect leads to an iterative process of simulation and optimization with varying components’ sizes, following the control strategy and satisfying the system constraints [37]. While the economic parameters, including net present cost and cost of energy, play a crucial role in cost minimization and attainment of an optimal system, HOMER ranks the feasible configurations based on the total net present cost or NPC. This cost refers to the difference between the present value of all the system costs (e.g., installation and operating costs, replacement costs, fuel costs, and others) and all the revenues (e.g., salvage, electricity sales, and others) earned over the project lifetime. In the cost evaluation, NPC is calculated for each system component and for the system itself [36].
In this work, the prime objective function ( Obj   Func ) is to minimize the total NPC of the HRESs as expressed in Equation (1) [38] below:
Obj   Func = min ( N P C ) = m i n N = 1 25 D r C c a p + C O & M + C r e p + C f u e l C s a l
where C c a p is the capital cost, C O & M is operation and maintenance (O&M) cost, C r e p is replacement cost, C f u e l is fuel cost and C s a l is the salvage value of the system. Here, D r represents the discount rate, and N is the project lifetime in years. D r can be calculated using the real interest rate i following Equation (2) [38]:
D r = 1 1 + i N
Salvage value is considered to be the revenue of the system referring to the remaining value of the system components that can be accrued at the end of the project duration, and it can be calculated in Equation (3) [36] as follows:
C s a l = C r e p · L r e m L c o m p
where L r e m and L c o m p are the remaining life of the component and the lifetime of the component, respectively, in years.
The annual value of total NPC gives the total annualized cost (TAC), which is calculated based on total NPC as expressed in Equation (4) [36]:
T A C = C R F ( i ,   N ) × N P C
where C R F ( i ,   N ) refers to the capital recovery factor and can be derived as in Equation (5) below:
C R F i ,   N = i ( 1 + i ) N ( 1 + i ) N 1
COE presenting the average cost required to produce 1 kWh of useful energy by the system is evaluated using T A C and can be expressed as Equation (6) [36]:
C O E = T A C E s
where E s is the total electric load served in a year (kWh/year).

2.3. Study Location Parameters

2.3.1. Palm Island in Australia

The study intends to supply clean energy to the remote Palm Island in Australia. Figure 6 shows the geographical location of this island, which is in regional North Queensland, 60 km away from the Great Barrier Reef World Heritage area and Great Barrier Marine Park. The climate of this tropical region is projected to experience a mean temperature rise of 0.68 °C by 2030 and 1.25 °C by 2050, along with a sea level rise and prolonged heatwaves. This island suffers from approximately 6530 t CO2-equivalent emissions per year, with most of the emissions originating from diesel-based electricity generation (28%) and the transport sector (23%). While diesel-based generator is the primary energy source, there is a provision of RE supply covering 20% of the load; however, only 4.5% of it is functional. The high cost of energy, coupled with high energy demand, is placing financial stress on the communities of this tropical island [39].

2.3.2. Load Profile

The average daily energy demand of Palm Island is 828.51 kW, with a greater share of residential energy consumption. The average household energy consumption of the island is higher than the average Queensland household, providing an annual residential energy consumption of about 177 MW [39]. In this study, the daily load profile of energy consumption, as shown in Figure 7, is developed based on a residential load of a similar climate region from the HOMER database. The load is matched using the Koeppen-Geiger Climate Classification System with an average daily demand of 470.38 kW to simulate the existing demand. A random variability of 2% in day-to-day and timestep is considered to achieve a more accurate result in load estimation [18].
To reduce transport-generated carbon emissions and promote worldwide EV uptake, a hypothetical EV load is also included in the system, considering the local condition. Palm Island has 337 registered cars, which are owned by 46% of the residents. A population of 100 EVs is considered in this study, which can replace about 30% of conventional household vehicles, referring to a 30% reduction in carbon emissions produced by these vehicles. Based on the average EV charging profile in Australia [40], the EV load profile is generated, which mostly uses daytime RE generation for charging the vehicles, as shown in Figure 8. It can be observed that the EV charging started to increase at 9 am when the solar was available and went to a maximum of about 150 kW at 1 pm when the PV generation was highest as well. Afterward, the load started to decrease in line with the usual PV generation. This type of load pattern can be greatly efficient in utilizing RE and any excess electricity generation. The average EV load is 36.79 kW with a daily average of 883 kWh, as estimated in HOMER.

2.3.3. Meteorological Information

The meteorological data, namely solar, temperature, and wind data, are imported from the NASA Surface Meteorology and Solar Energy database from HOMER software. Figure 9a,b present the monthly solar global horizontal irradiance (GHI) and temperature data, respectively. The tropical climate of the island offers mostly warmer months with an average solar radiation of 5.14 kWh/m2/day annually. The highest average radiation is observed during November, offering 6.37 kWh/m2/day, while June offers the lowest radiation, which is 3.76 kWh/m2/day. The annual average temperature of this region is 23.66 °C. The higher temperatures are observed during December to March, while the temperature is lower during June to August.
Figure 9c shows the monthly wind resource data based on the climate of the location. The annual average wind speed is obtained as 6.53 m/s. Interestingly, the wind speed is mostly higher during April to August when the solar radiation is comparatively lower. Hence, during this period, the mix of solar and wind resources can complement each other to make the energy system more stable and reliable, realizing the benefits of HRES.

2.4. System Components

Different components, including PV, wind turbine, biodiesel generator, hydrogen fuel cell, battery, and diesel generator, are used to perform the feasibility study of the hybrid systems. A brief of the system components is discussed in the below paragraphs.

2.4.1. Solar Photovoltaic

Solar PV provides unbounded energy without releasing harmful GHG [41] and is one of the major sources of RE in the system. The size of PV is optimized using HOMER to meet the load demand. The capital cost of PV is AUD 930/kW with an O&M cost of AUD 14/kW/year. The lifetime of the PV is 25 years referring to the same duration of the project, so no replacement cost is needed. The derating factor is 88% which is used to consider any power loss effect on the real output power of the PV [42] due to weather conditions, dust, or others. Based on the solar radiation, PV panel temperature, and derating factor, the PV output is determined in the following Equation (7) [42]:
P P V = Y P V   f P V G ¯ T G ¯ T ,   S T C 1 + α P T C T C ,   S T C
where Y P V   is the rated capacity of the PV array; f P V is the derating factor of PV in percent, G ¯ T refers to the solar radiation incident on the PV array; G ¯ T ,   S T C refers to the incident radiation at the standard test conditions; α P is the temperature co-efficient of power; T C and T C ,   S T C denote the PV cell temperature and the PV cell temperature under the standard test conditions.

2.4.2. Wind Turbine

Wind turbine offers the other major source of renewables in the hybrid system. HOMER evaluated the output power of WT based on the wind speed, hub height, and air density. In the first step, the wind speed at the hub height (referring to the height from the ground to the rotor center) is calculated using Equation (8). Then, based on the power curve, the desirable power output at standard temperature and pressure is derived. Later, the power output is adjusted considering the actual air density using Equation (9) [36] below:
U h u b = U a n e m · l n z h u b z 0 l n z a n e m z 0
where U h u b is the wind speed at the WT’s hub height, U a n e m refers to the wind speed at the height of the anemometer (m/s), z h u b is the hub height of the WT (m), z 0 is the length of the surface roughness (m), and z a n e m refers to the height of the anemometer (m).
P W T G = ρ ρ 0   ·   P W T G ,   S T P
where P W T G refers to the power output of the WT in kW, P W T G ,   S T P refers to the power output of the WT at standard temperature and pressure in kW, ρ refers to the actual air density in kg/m3, and ρ o is the air density at standard temperature and pressure, which is 1.225 kg/m3.
In this study, XANT-L-33 WT is used with a rated capacity of 330 kW. These turbines provide high reliability in remote locations with low maintenance. The rotor diameter of the WT is 33 m, with a hub height of 55 m. The cut-in and cut-out speeds of the WT are 3 m/s and 20 m/s, respectively. The capital cost of the WT is taken as AUD 471,429 with an O&M cost of AUD 5657/year. The lifetime is 30 years, so any replacement cost is not considered.

2.4.3. Battery

A battery energy storage system is employed to store the surplus energy from renewable sources to use during the unavailability of RE or as needed. Considering the technical maturity and high efficiency, a lithium-ion battery is used [43] with a rated capacity of 100 kWh. The capital and replacement cost of the battery system is AUD 785/kWh, with an O&M cost of AUD 14/kWh/year. The maximum charge power of the battery storage bank can be derived following Equation (10) [36]:
P b a t t , c m a x = N b a t t I m a x V n o m 1000
where N b a t t refers to the battery numbers of the storage bank, I m a x refers to the maximum charge current of the battery storage in ampere and V n o m refers to the nominal voltage of the battery storage in volts.

2.4.4. Electrolyzer

Green hydrogen production through water electrolysis is a carbon-free technology that can be performed through water electrolysis employing an electrolyzer. The electrolyzer uses surplus renewable electricity generated by PV or WT to produce hydrogen following Equation (11) [44]:
H 2 O   H 2 + 1 2   O 2
A generic electrolyzer is used in this study with a capital cost of AUD 737/kW, a replacement cost of AUD 371/kW, and an O&M cost of AUD 16/kW/year. The efficiency of the electrolyzer is 85%, with a lifetime of 15 years.

2.4.5. Hydrogen Tank

The hydrogen produced from the electrolyzer is required to be stored in a hydrogen tank (HT), which can serve the hydrogen to a fuel cell as required. The energy held by the HT can be derived in Equation (12) [45] below:
E H T = V H T ρ H 2   L H V H 2
where V H T refers to the volume of the tank and ρ H 2 and L H V H 2 refers to the hydrogen density and the lower heating value of the hydrogen, respectively.
The capital cost of the HT is AUD 286/kW with an operational cost of AUD 14/kW/year. The lifetime of the HT is 25 years, so no replacement cost is considered.

2.4.6. Fuel Cell

The stored hydrogen can be used to generate electricity by a fuel cell, providing a carbon-free technology for electricity generation. It combines hydrogen from the hydrogen tank and oxygen from the air to generate electricity, leaving water as a by-product [46]. The efficiency of the FC is approximated as 60% considering the values of fuel intercept co-efficient and slope as 0.0003 kg/h/kW and 0.05 kg/h/kW, respectively [15]. FC efficiency can be derived in Equation (13) [47] as follows:
η F C = V ¯ c × n c , F C × I F C Q × H H V h y d
where V ¯ c is the average voltage of a cell, n c , F C is the total cell number of FC, I F C is the current in FC. H H V h y d represents the gross calorific value of hydrogen.
The capital cost, replacement cost, and O&M cost are taken as AUD 857/kW, AUD 714/kW, and AUD 0.01/kW/operating hour, respectively.

2.4.7. Biodiesel Generator

Biodiesel can be used in a diesel generator with little or no modifications and is modeled in this study from the generator component of HOMER Pro. Biodiesel can be blended with diesel offering a percentage varying from 0 to 100% and aiding in fossil-fuel use reduction. B5, B20, and B100 are the most available biodiesel fuels, referring to 5%, 20%, and 100% biodiesel in the fuel. This study considered fuel B100, which can be sourced from a biodiesel plant located in Brisbane, Queensland. The plant produces biodiesel using waste streams and by-products, avoiding any negative impact on the production of food and human needs [48]. The fuel consumption of the BDG can be obtained from Equation (14) [36] below:
F B D G = F i ·   P R B D G + F s ·   P B D G
where F i and F s refers to the fuel curve intercept co-efficient (L/h/kW) and fuel curve slope (L/h/kW), respectively; P R B D G and P B D G refers to the rated power (kW) and output power (kW) of the BDG, respectively.
The size of the biodiesel generator is optimized, considering a search space between 100 to 800 kW. The fuel intercept co-efficient of the generator is taken as 0.028 L/h/kW, representing the biodiesel consumption at no load conditions, and the slope is 0.253 L/h/kW, representing the marginal fuel consumption [36]. The capital, replacement, and O&M costs of BDG are AUD 714/kW, AUD 357/kW, and AUD 0.04/kW/operating hour, respectively. The price of biodiesel is taken as 1.70 AUD/L in this study.

2.4.8. Diesel Generator

A diesel generator is used to simulate the existing system and evaluate hybrid systems’ performance through comparative analysis. According to the HOMER optimization, a 1200 kW DG is considered. The capital cost, replacement cost, and O&M costs are AUD 314/kW, AUD 286/kW, and AUD 0.04/operating hour, respectively. According to the fuel curve, the fuel consumption of this generator is 300 L/h. The overall efficiency of DG can be calculated as Equation (15) [49] below:
η o v e r a l l = η b r a k e t h e r m a l × η g e n e r a t o r
where η b r a k e t h e r m a l represents brake-thermal efficiency and η g e n e r a t o r is generator efficiency.

2.4.9. Converter

The hybrid system comprised of AC and DC components requires a converter for AC to DC and DC to AC conversion. In this study, the converter efficiency is taken as 95% for both AC and DC conversion. The output power of the converter can be derived in Equations (16) and (17) [42] as below:
P i n v , o u t = η i n v P D C
P r e c , o u t = η r e c P A C
where P i n v , o u t , η i n v and P D C present the output power, efficiency, and input DC power of the device working as an inverter. While P r e c , o u t , η r e c , and P A C present the output power, efficiency and input AC power when it is working as a rectifier.
A summary of the cost of the system components is included in Table 3 below.

2.5. Reliability Metrics

Reliability maintenance of intermittent RE-based hybrid systems is challenging. Capacity shortage, a reliability metric, refers to the load deficit amount that can occur in a system due to the supply of lower capacity than the required operating capacity, including the operating reserve [54]. If a system at any time is incapable of providing enough supply to meet the desired load and the operating reserve, then the deficit amount is recorded as a capacity shortage [55]. To ensure system reliability, HOMER assesses the capacity shortage fraction ( f c s ) evaluating the total capacity shortages ( E c s ) over the year with respect to the annual electric load ( E l o a d ) which can be expressed in the following Equation (18) [36]:
f c s = E c s   E l o a d
where E c s and E l o a d are in kWh/yr.
To maintain the reliability of the hybrid systems in this study, the maximum annual capacity shortage is taken as 0%. Moreover, to ensure reliable energy supply during uncertain conditions, such as due to an increase in load or decrease in renewable energy supply, operating reserve metrics are considered, which are taken as 10% of load, 25% of solar, and 50% of wind power. Thus, the system can respond and supply sufficient energy in case of a 10% load increase or a 25% reduction of solar energy and a 50% reduction of wind energy.

2.6. Dispatch Strategies

Dispatch strategies refer to the algorithm used to dispatch the generators and control the storage operation during periods of inadequate RE generation in hybrid systems. The role of dispatch strategy is vital in maintaining the system’s reliability and delivering sound environmental and economic outcomes [33]. Load following (LF) and cycle charging (CC) are two default economic dispatch strategies offered by HOMER Pro. LF strategy operates the generators to produce power only to meet any load and not to charge a battery. The loads are supplied mainly by the RESs, and the storage systems are usually energized by excess RE generation [32], indicating increased RE use [56]. In the CC strategy, the generators run at full capacity to serve any load unmet by the RE sources, and then any additional power from the generators charges the storage [33], indicating increased reliability of the system [56]. Moreover, the Combination strategy is another technique that uses both the default strategies at each time step. Furthermore, HOMER facilitates user-defined dispatch algorithm applications using MATLAB Link Module interface. This study considered both LF and CC strategies. These strategies work as one of the decision variables where HOMER simulates the feasible configurations following both the strategies and evaluates the system performance in order with the strategy providing better cost-efficiency.

2.7. Project Economics

Several economic factors are required to consider defining the economic condition of the project in HOMER. Project lifetime, an important economic factor, is taken as 25 years, based on which the NPC of a system is evaluated. The real discount rate is taken as 7% [57], which is used to evaluate the discount factor and the total annualized cost of the project. The inflation rate is taken as 3.8% based on the rate during the second quarter of 2024 in Australia [58]. Moreover, the Australian dollar (AUD) is used as the currency for the economic evaluation of this study.

3. Results and Discussion

3.1. Hybrid Energy Systems Evaluation

Four hybrid energy systems, A, B, C, and D, as described in Section 2.2, are analyzed to enable renewable sources as the main sources of energy while supported by the energy storage systems to store and supply energy as needed. The optimum solution is evaluated to meet the load demand while minimizing NPC and COE and complying with the system constraints. HOMER simulated the systems considering both the default strategies, while the LF strategy is found suitable for System A and the CC strategy is found optimal for systems B, C and D.

3.1.1. Economic and Technical Analysis for Hybrid Energy Systems

System A is considered to be the reference case comprising diesel generator, PV, and battery systems. Considering the current renewable integration capacity, this case is modeled to allow a 20% renewable fraction. Based on the HOMER simulation, a 620 kW PV combined with one battery (100-kWh) is found sufficient to simulate the existing renewable fraction condition. The diesel generator capacity is optimized by HOMER, which is 940 kW. The share of electricity generation by diesel and PV are 75.7% and 24.3%, respectively. The result shows that the DG was operated for 8136 h per year, offering an operational life of 1.84 years. Undoubtedly, the dominance of diesel-based generation accounts for substantial emissions of CO2 and other pollutants. The NPC, COE, and O&M costs of this system are AUD 27.5 M, AUD 0.574, and AUD 2.27 M, respectively.
In System B, PV is the main source of electricity generation which provides 80.4% of the total electricity generation. HOMER optimized this configuration with 5645 kW PV and four batteries. Due to the larger size of PV, annually, 2,983,719 kWh of excess electricity is observed. The electrolyzer operated for 3873 h per year, usually from 7 am to 5 pm, and produced 92,753 kg of hydrogen annually. The stored hydrogen is utilized by the FC to generate electricity and support the load demand as required. The size of the BDG is optimized using a search space of 100 kW to 800 kW, while a 500 kW BDG is selected considering the optimal performance of the system. According to the economic results, NPC and COE of this system are AUD 14.1 M and AUD 0.272, respectively, with an O&M cost of AUD 0.48 M.
System C is enhanced with four WTs (330-kW each) and 2154 kW PV capacity. The provision of multiple WTs instead of a larger size is beneficial in increasing the reliability of the system in case of any maintenance or breakdown of one [59]. Noticeably, while the PV is available to supply the load only during the daytime, WTs generated energy both day and night and thus greatly reduced the O&M cost with lesser operation of the storage systems. During any supply deficit from PV and/or WT, the FC, BDG, and battery contributed to meeting the load demand. The electricity production share of PV, WT, FC, and BDG is 41.8%, 42.5%, 13.5%, and 1.98%, respectively. The diesel generator operates only for 29 h/year, providing 0.25% energy supply. It is observed that, in the absence of BDG, DG operated for 449 h/year, resulting in increased carbon emission. With NPC AUD 9.79 M and COE AUD 0.189, this design offers a 95.6% renewable fraction and improved environmental performance. It can be noted that the use of FC with PV and WT gives better economic performance compared to PV alone, referring to the benefits of dual RE sources complementing each other and delivering reduced system costs. A similar result can be seen in past research, in which PV/wind hybrid technology included with FC provided the best RE system solution compared to the PV/FC system [60].
System D excludes the conventional generation and provides a clean energy system including PV, WT, FC, BESS and BDG. While PV and WT provide the main energy generation, BESS and FC support the storage of energy and maintain the reliability of the system by supplying energy as required. CC strategy is found optimal in this system, allowing generators to run at full load, improvement of fuel efficiency with lower fuel consumption, and sufficiently charged batteries to provide system stability in need. In this system, the backup dispatchable generation is provided by the BDG only, avoiding any carbon-based generators. The capacity of the components is optimized considering the fulfillment of load demand and capacity shortage conditions while providing a minimum NPC and COE. Thereby, the scenario includes a PV with 2266 kW capacity, an FC with 600 kW, a BDG with 500 kW together with 4 WT (each 330 kW) and four batteries (each 100 kW). The energy supplied by PV, WT, FC, and BDG is 43.1%, 41.6%, 13.4%, and 1.8%, respectively. Likewise, in System C, the application of dual RE sources and dual storage systems increases the reliability and stability of the system. Additionally, the use of BDG as the only dispatchable backup generation with clean fuel reduces GHG emissions and increases environmental benefits. This design offers the best economic performance with NPC AUD 9.46 M, COE AUD 0.183, and O&M cost AUD 0.24 M. Furthermore, this system reliably provided a 96.4% renewable fraction, outperforming the performance of other configurations. A comparison of the technical analysis of the hybrid systems is shown in Table 4.
A summary of the economic performance of the hybrid systems is shown in Table 5, while Figure 10 visually represents the economic comparison of the hybrid systems. It is observed that by integrating RE sources, NPC is reduced in System B, System C, and System D by 48.73%, 64.4%, and 65.6%, respectively, and the cost of energy is decreased by 52.61%, 67.07%, and 68.19%, respectively, compared to the reference case (System A). Evidently, System D, presenting the PV/BESS/WT/FC/BDG system, offers the best economic performance.
A comparison between the cost of the components in the hybrid systems B, C, and D is presented in Figure 11. It is noted that in the absence of WT, the system cost increased due to the higher PV capacity and increased BDG operation. It accords to the economic benefits of adding multiple renewable sources in a hybrid system.

3.1.2. Environmental Analysis

Reduction of carbon emissions through HRES is one of the key aspects aimed in this study. As depicted in Table 6, the highest GHG emissions come from System A, which simulates the existing system at Palm Island. By RE integration, the CO2 emissions of System B and System C are lowered by 98.27% and 99.37%, respectively, to the reference case system. The addition of BDG in the systems, along with PV and WT, extended the environmental benefits. In the biodiesel production process, CO2 is absorbed during the growth of the feedstock (e.g., plants), so more CO2 can be sequestered than is emitted during combustion [61]. Moreover, biodiesel can reduce CO and SO2 in contrast to diesel fuel. Moreover, the incorporation of EV loads in this study assisted in carbon reduction that could be generated from the transportation sector. As mentioned earlier, transportation accounts for about 23% of the carbon emissions at Palm Island. Hence, the replacement of conventional vehicles through EVs reduces this transport sector-generated carbon emissions. Although energy consumption by EVs can produce carbon emissions, reduction of fossil-fuel consumption due to the substitution of conventional vehicles with EVs and renewable energy generation for EV charging can minimize this impact and contribute to achieving net carbon emission reduction [62]. Thus, System D, the all-renewable sources-based system, provides the lowest GHG emission with zero CO2 and SO2, which is promising and highly supportive of net-zero targets.
Thereby, System D representing PV/BESS/WT/FC/BDG configuration is the optimal option among the hybrid systems and hence, considered to be the proposed system in this study.

3.2. Optimal System Performance

3.2.1. Load Balancing Operation

Energy dispatch in the optimal system has been observed, as depicted in Figure 12, which validates the load balancing performed by the system. It is observed that, during the early hours of the morning, the load is supplied by both the FC and wind generation. As soon as the PV is available at 6 am, FC generation is ceased, and the load demand is met with PV and WT together and continued till 4 pm. Gradually, PV and wind generation decreased, and FC was reinstated to meet the load demand. At 6 pm both the WT and PV generation went to a minimum; FC provided the maximum load supply, and the battery discharged to provide the load deficit. Thus, the energy stored in FC and the battery is utilized to maintain the reliability of the system in the absence of RE generation. During the next hour, there was no PV or wind generation. The BDG came into operation to meet the load demand together with FC, and the battery was charged with the surplus energy. At 8 pm the load was supplied by available wind power and FC generation. Also, HOMER found discharging the battery more economical than the BDG power supply. During the following hours, WT and FC generation were sufficient to meet the load and charge the battery with the excess energy, while FC provided the major energy supply. Thus, the load is mostly supplied by PV, WT, and FC, portioning to 46.6%, 36%, and 23.4% energy supply in order on the demonstrated day. Due to the oversized RE sources, especially PV, annually, 1,563,573 kWh of excess electricity is observed in this system, which is 17.5% of the total energy generation. This excess electricity can be managed by feeding it into a dump load as required. The system has a 0.045% unmet electric load and 0.095% capacity shortage annually, which can be considered to be negligible [63].

3.2.2. Renewable Energy Generation

Solar Generation

PV is one of the major renewable sources in this system which generates power varying from 0 kW to 2383 kW. It supports the system by supplying solar energy to meet the load and producing hydrogen energy through water electrolysis. Usually, the PV power is available from 6 am to 6 pm, with the highest generation between 10 am to 1 pm, as depicted in Figure 13. The PV operated for 4368 h and produced 3,854,795 kWh of energy annually. The year-round average output energy is 10,561 kWh/day, with a capacity factor of 19.4%. The capital cost of the PV is AUD 2,107,734.21, and the O&M cost is 369,632.09 AUD, while the PV produced energy at 0.0552 AUD/kWh.

Wind Generation

Wind energy is the other key RE source used in the optimal system. The energy supplied by the WTs contributed to the load demand, day and night, depending on the required wind speed availability, as depicted in Figure 14. These turbines generated power ranging from 0 kW to 1340 kW with a mean power output of 425 kW/year and a capacity factor of 32.2%. The annual wind energy production is 3,719,064 kWh with 7426 operational hours. The total capital cost of the WTs is AUD 1,885,716.00, and the O&M cost is AUD 263,605.76, while the WTs produced energy at 0.0496 AUD/kWh.

Hydrogen System Energy Generation

The total renewable energy supplied to the electrolyzer is 2,795,755 kWh/year, which yields an annual production of 60,247 kg of hydrogen, as depicted in Figure 15 and Figure 16, respectively. The hourly rate of hydrogen production per year varied from 0 kg to 25.9 kg, offering 6.88 kg on average. The electrolyzer runs for 4692 h per year, providing an average input power of 26.6%, respecting its rated capacity.
The capacity of the hydrogen tank is 1000 kg which could store 33,333 kWh energy. The FC consumed 60,674 kg of hydrogen to generate 1,200,261 kWh of energy per year, as depicted in Figure 17. It operated for 3671 h year-round and provided hourly 327 kW power on average. As illustrated in Figure 18, FC operated mostly at night in the absence of PV and insufficient wind generation. It is observed that the FC provided an autonomy of 65.7 h to sustain the load, referring to its long-term energy storage capability. Thus, the backup supply of the system is predominantly offered by the FC, compared to the battery having short-term energy storage properties. Promisingly, it validates the significant role of hydrogen energy-based FC for efficient load balancing in hybrid systems [64]. The average fuel consumption of FC is 166 kg per day and 6.93 kg per hour. The cost of hydrogen (COH) obtained is 13.5 AUD/kg.

Battery Energy Supply

The optimized battery bank capacity is 400 kWh; however, to maintain the minimum SoC at 20%, the usable nominal capacity is 320 kWh for this system. The annual energy used to charge the battery is 29,206 kWh, while the annual energy supplied is 26,285 kWh, with an annual throughput of 27,707 kWh. The battery autonomy is low, 0.631 h, which can be assumed due to the availability of multiple RE sources and hydrogen storage. As HOMER optimizes hybrid systems based on economic considerations, hence, to provide backup supply in the absence of RE generation, operating FC is deemed more economical than discharging the battery. Thus, HOMER chose a lower-capacity battery bank, and eventually, it provided a lower autonomy. Due to the CC strategy of the system, an average energy cost of 0.261 AUD /kWh accounts for the lower operation of this generator.

BDG Power Supply

BDG provided a backup supply in the system in need, running 476 h per year with 162 starts. The generator consumed 47,247 L of biodiesel per year, with an average fuel consumption of 129 L/day and 5.39 L/h. The annual production is 160,406 kWh with an average power supply of 337 kW. The capacity factor is 3.66% referring to the lower operation of this generator.

3.2.3. Comparison with the Existing Studies

While the HRES proposed in this study, including solar PV, wind turbine, hydrogen fuel cell systems, battery, and biodiesel generators, is uncommon, an effort is made to evaluate the performance with the other studies including similar components. For instance, a PV, WT, battery, and hydrogen energy-based HRES provided energy at 0.232 AUD/kWh and 0.189 AUD/kWh at 0% and 1% capacity shortage in order [38]. Moreover, the least-cost systems, including WT, BDG, tidal turbine and battery [19] and PV, WT, micro-hydro system, battery, BDG, and DG [18], provided the COE 0.263 AUD/kWh and 0.196 AUD/kWh, respectively. In contrast, the COE evaluated in the current study is 0.183 at 0.095% capacity shortage, presenting the efficacy of the proposed system. Furthermore, environmental efficiency is a key factor for the evaluation of HRES performance, which is absent in [38], while [19] demonstrates reduced CO2 with zero SO2 and [18] reports a CO2 emission of 54,669 kg/year. Notably, the present study outperforms the previous studies with zero CO2 and SO2 emissions. Thus, the proposed hybrid system delivering promising economic and environmental results, presents the state of the art in the current research.

3.3. Sensitivity Analysis

A sensitivity analysis is performed to see the effect of changes in biodiesel price and primary load on the economic results of the optimal system. The price of biodiesel is volatile, which is interconnected with the price of feedstock and crude oil. Hence, this sensitivity analysis can assist in assuming the future cost benefits due to any biodiesel price variation. Moreover, within the project lifetime, the lifestyle of the residents can be changed, resulting in a change in electrical appliances or any equipment and, hence, electric load demand. Moreover, considering this island a potential tourist destination, seasonal variations in load demand can happen. Hence, the sensitivity analysis using the load parameter is instrumental to examine the feasibility of the optimal system during such uncertain conditions.

3.3.1. Effect of the Biodiesel Price Variation

The price of biodiesel is considered to increase by 20%, resulting in AUD 2.04/L, and decrease by 20%, giving the price AUD 1.36/L. It is observed that the BDG operation is more sensitive to the price increase than decreases. With the reduction of the fuel price net present cost and cost of energy of the system are reduced by 2.0% and 2.19%, respectively, with almost the same BDG energy production, without any change in the operational hours. However, at the increased fuel price PV size is increased, and the BDG operation is limited to 442 h/year, lowering biodiesel consumption by 7.5%. The NPC and COE of this case are increased to 1.9% and 1.64%, respectively. It shows that the economic parameters (NPC and COE) are mostly affected by the price decrease rather than the increase. Table 7 summarizes the results of the biodiesel price variation in the system.

3.3.2. Effect of Load Variation

To evaluate the performance of the optimal system at increased load conditions, the annual average load (11,289 kWh/day) is varied to 12,000 kWh, 13,000 kWh, and 14,000 kWh daily. It has been observed that, at the average load of 12,000 kWh/day, the system NPC and COE are increased to MAUD 10.07 and AUD 0.184, respectively. To meet the load, PV size is increased with higher BDG operation. As the load increased to 13,000 kWh/day and 14,000 kWh/day, the load was met by further increased PV capacity and increased BDG operation added with the higher number of batteries. An increase in component size/operation resulted in higher system costs which is illustrated in Figure 19. It is observed that, despite the load increase, the system can meet the load with a negligible capacity shortage of below 1%.

4. Data Analysis and Validation

Generally, actual load profile data of remote locations such as Palm Island are not always accessible, and hence, it requires considering the regional conditions for using any speculated data into HOMER [65]. Nevertheless, the role of load profile has great significance in HOMER simulation and optimization, and hence, to ensure the reliability of the result, efforts have been made to validate the load profile data used in this study. Herein, from an open-access database provided by Ergon Energy Network, the energy provider of the studied island, month-wise energy usage data from 2016 to 2023 has been collected and used to validate the experimental load profile data obtained from the HOMER database. Statistical analysis is widely used to evaluate data quality in research [66] and is considered to assess the applicability of the experimental data used. Pearson correlation co-efficient (PCC) is a popular correlation analysis method that can find the degree of association between two linearly correlated data objects [67,68].
The value of PCC, or r, varies from −1 to +1, referring to a perfect negative and perfect positive relationship, respectively, and can be evaluated in Equation (19) [69] as below:
r = n x y ( x ) ( y ) n ( x 2 ) ( x ) 2 n ( y 2 ) ( y ) 2
where n is the number of paired data objects, and x and y are the variables observed.
Spearman correlation is another correlation method that evaluates the correlation strength using the rank of the data points rather than the value and can be applied to both linear and monotonic data. Spearman correlation co-efficient (SCC) between two variables x i and y i can be derived using Equation (20) [68] below:
ρ s = 1 6 · i = 1 N d 2 N ( N 2 1 )
where d refers to the difference between the rank of the variables x i and y i and N is the number of the observations.
The value of ρ s 
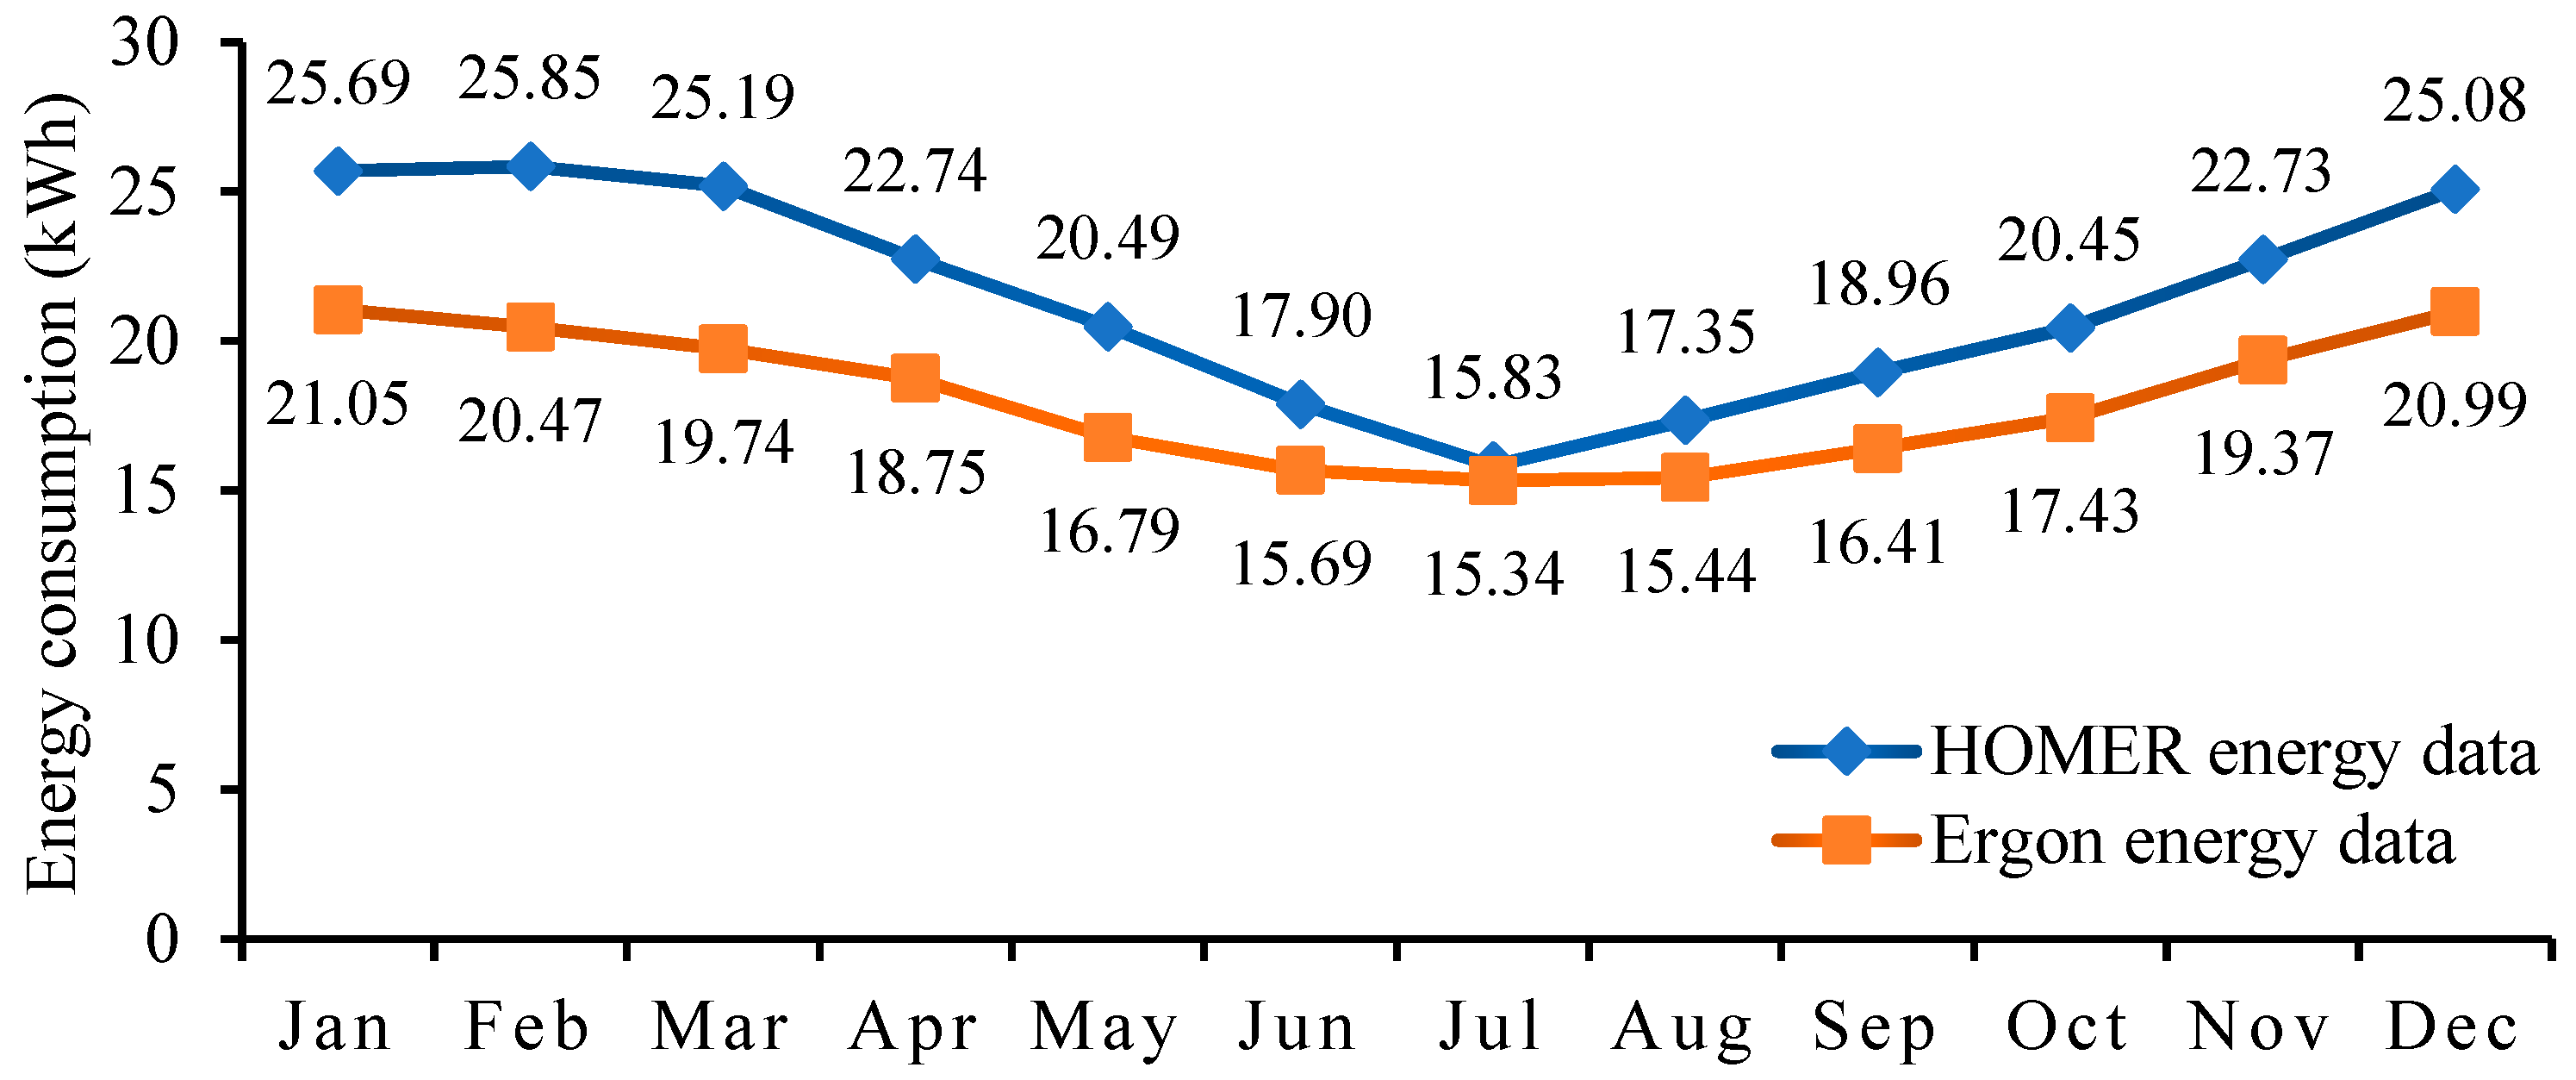
varies from −1 to +1, and the same interpretation as Pearson applies to explain the correlation strength. For improved reliability, both correlation methods are applied in this study to provide knowledge about the degree of association or similarity of these two datasets. In this regard, daily energy consumption data per residential consumer on the island is evaluated from the experimental data to compare with that of the energy provider’s data. Python programming offers user-friendly and efficient functions for correlation analysis and is used to execute this data analysis. According to the result, the values of the PCC and SCC are obtained as 0.977 and 0.951, which are very close to 1. Clearly, this result shows a very strong relationship between the two datasets. Furthermore, the p-value can be evaluated to analyze the significance of the result. This p-value refers to the probability of getting this strong correlation value from the data objects that are not truly correlated with the same extent [67], and it usually should be less than 0.05 to confirm the result’s significance [69]. Using the SciPy function of Python, the p-value is obtained as ‘0’, which fairly shows the gravity of the evaluated correlation strength by both methods. Hence, the load profile data from HOMER can be considered to be highly correlated to the Ergon Energy data referring that both datasets can carry the same information [67]. Furthermore, the strong positive relationship between the two datasets can mean that the prediction of the output value using both datasets should be very close. The presentation of the data patterns is included in Figure 20. Figure 21 shows the linear positive relationship between the two datasets.
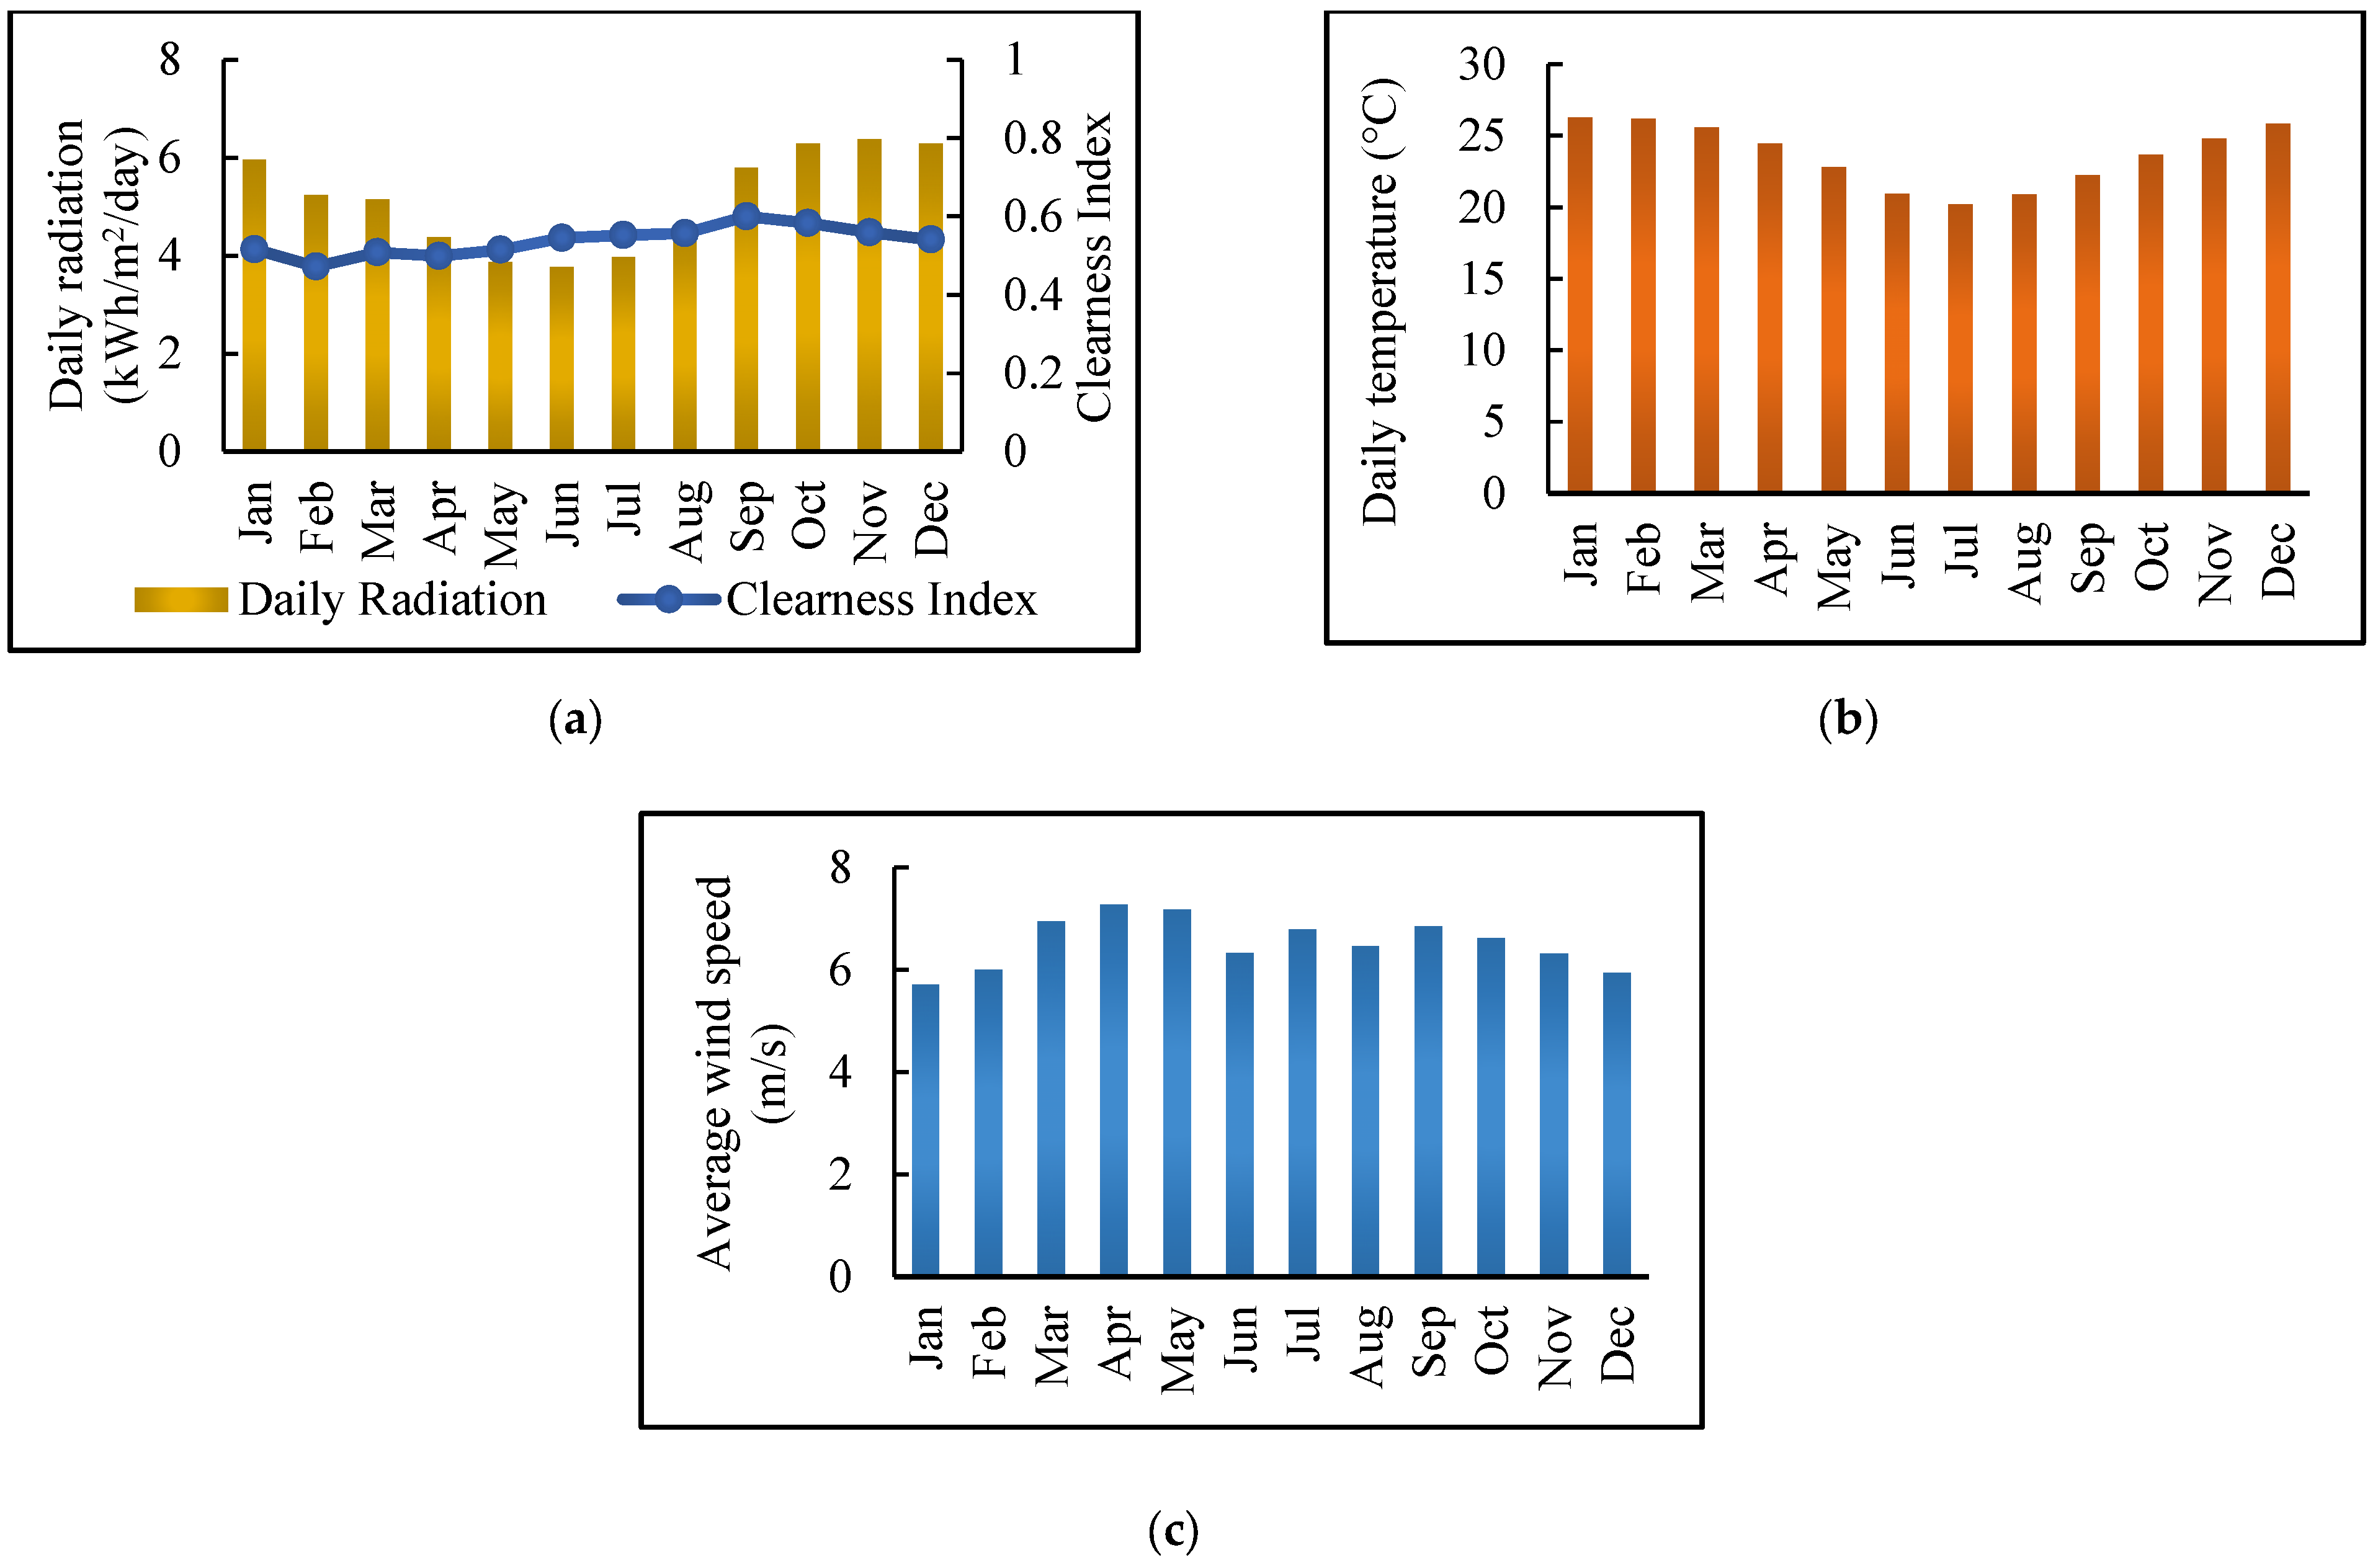
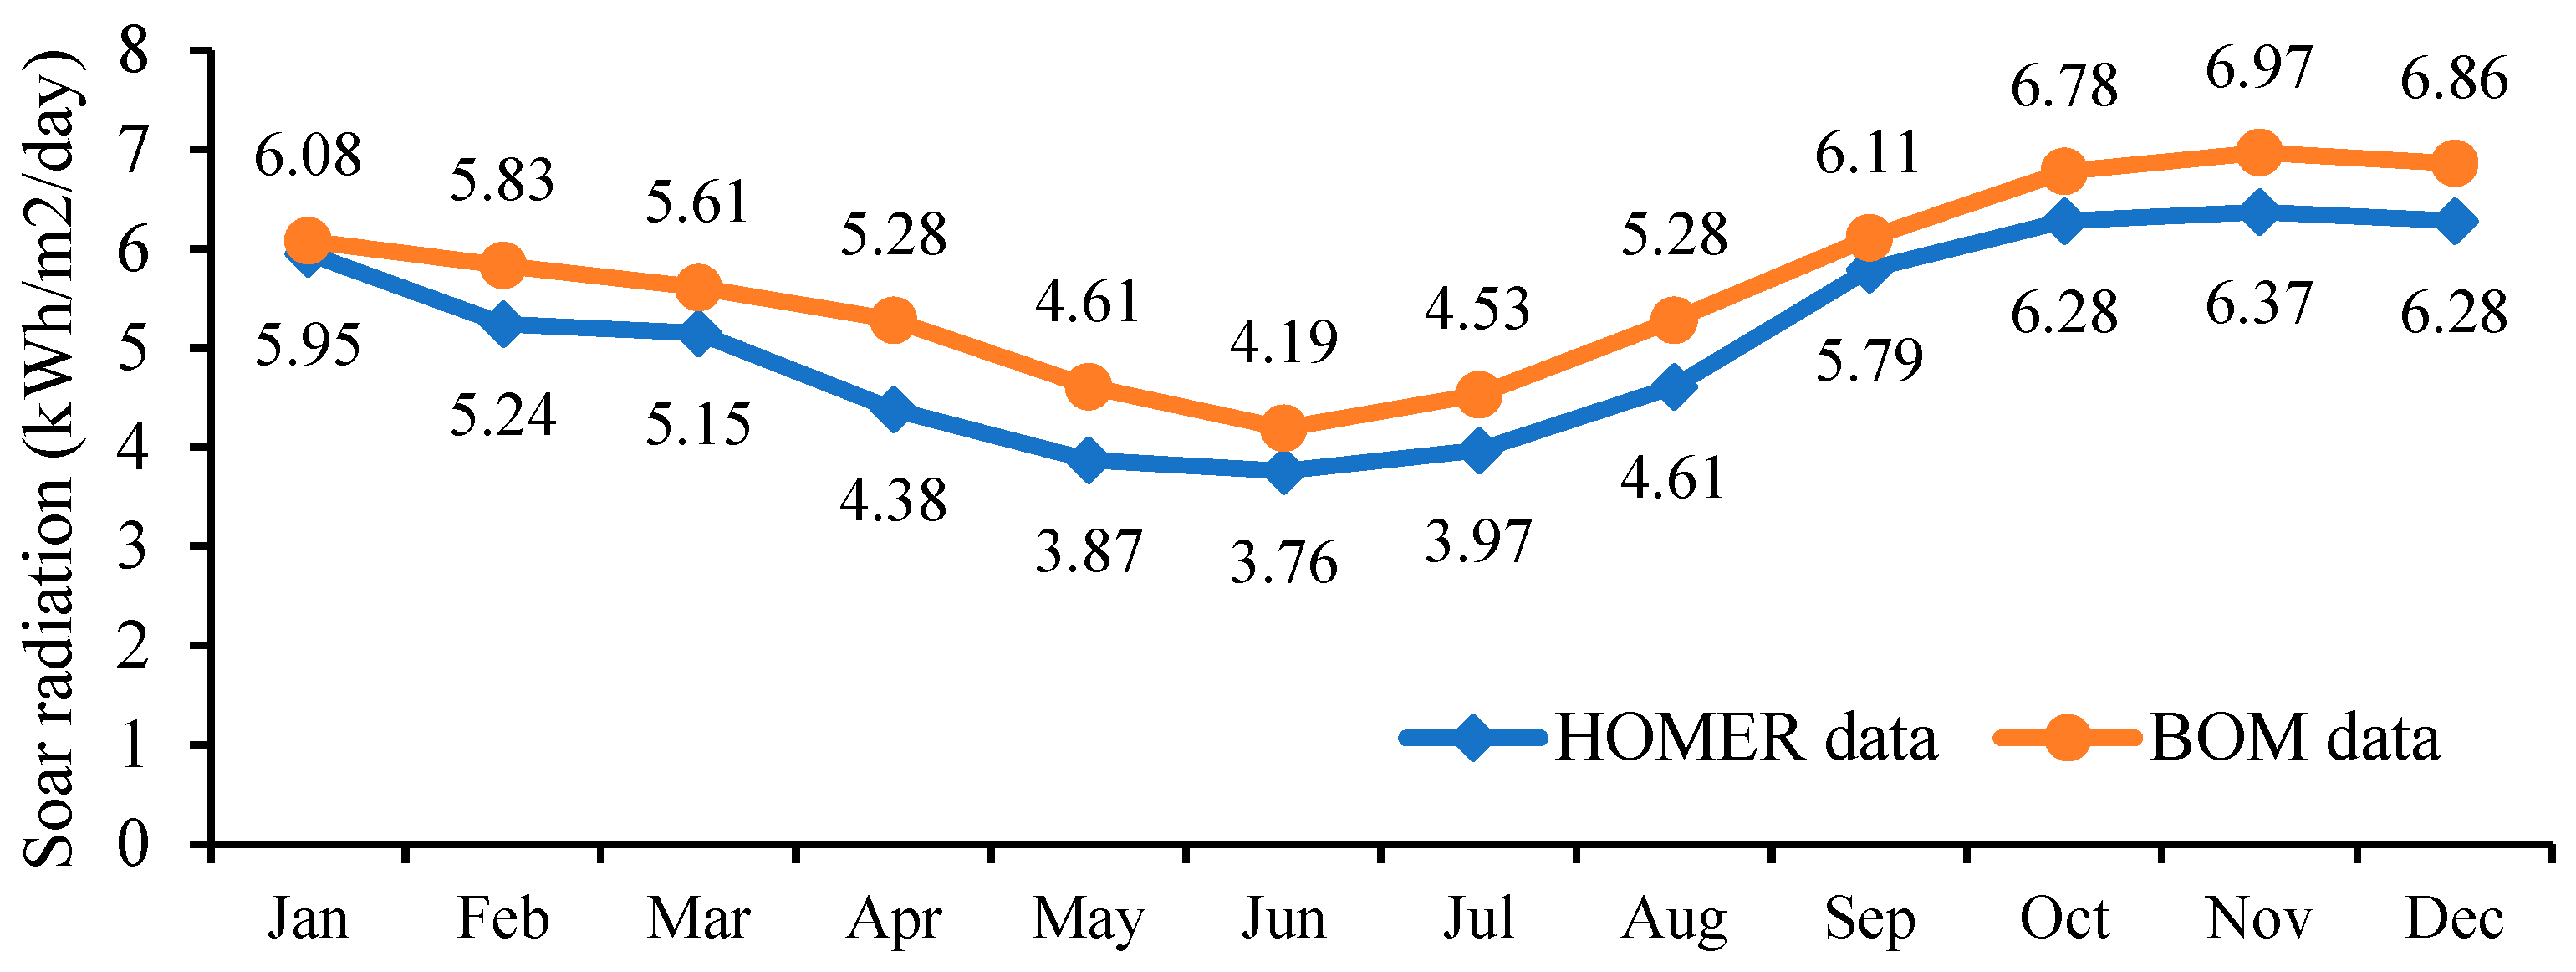
Further validation is carried out using the solar data. Monthly mean solar data are collected from the Bureau of Meteorology (BOM), which gives information from 2007 to 2024, while the solar data used from the HOMER database provides the monthly average values over 22 years (1983–2005). As exhibited in 
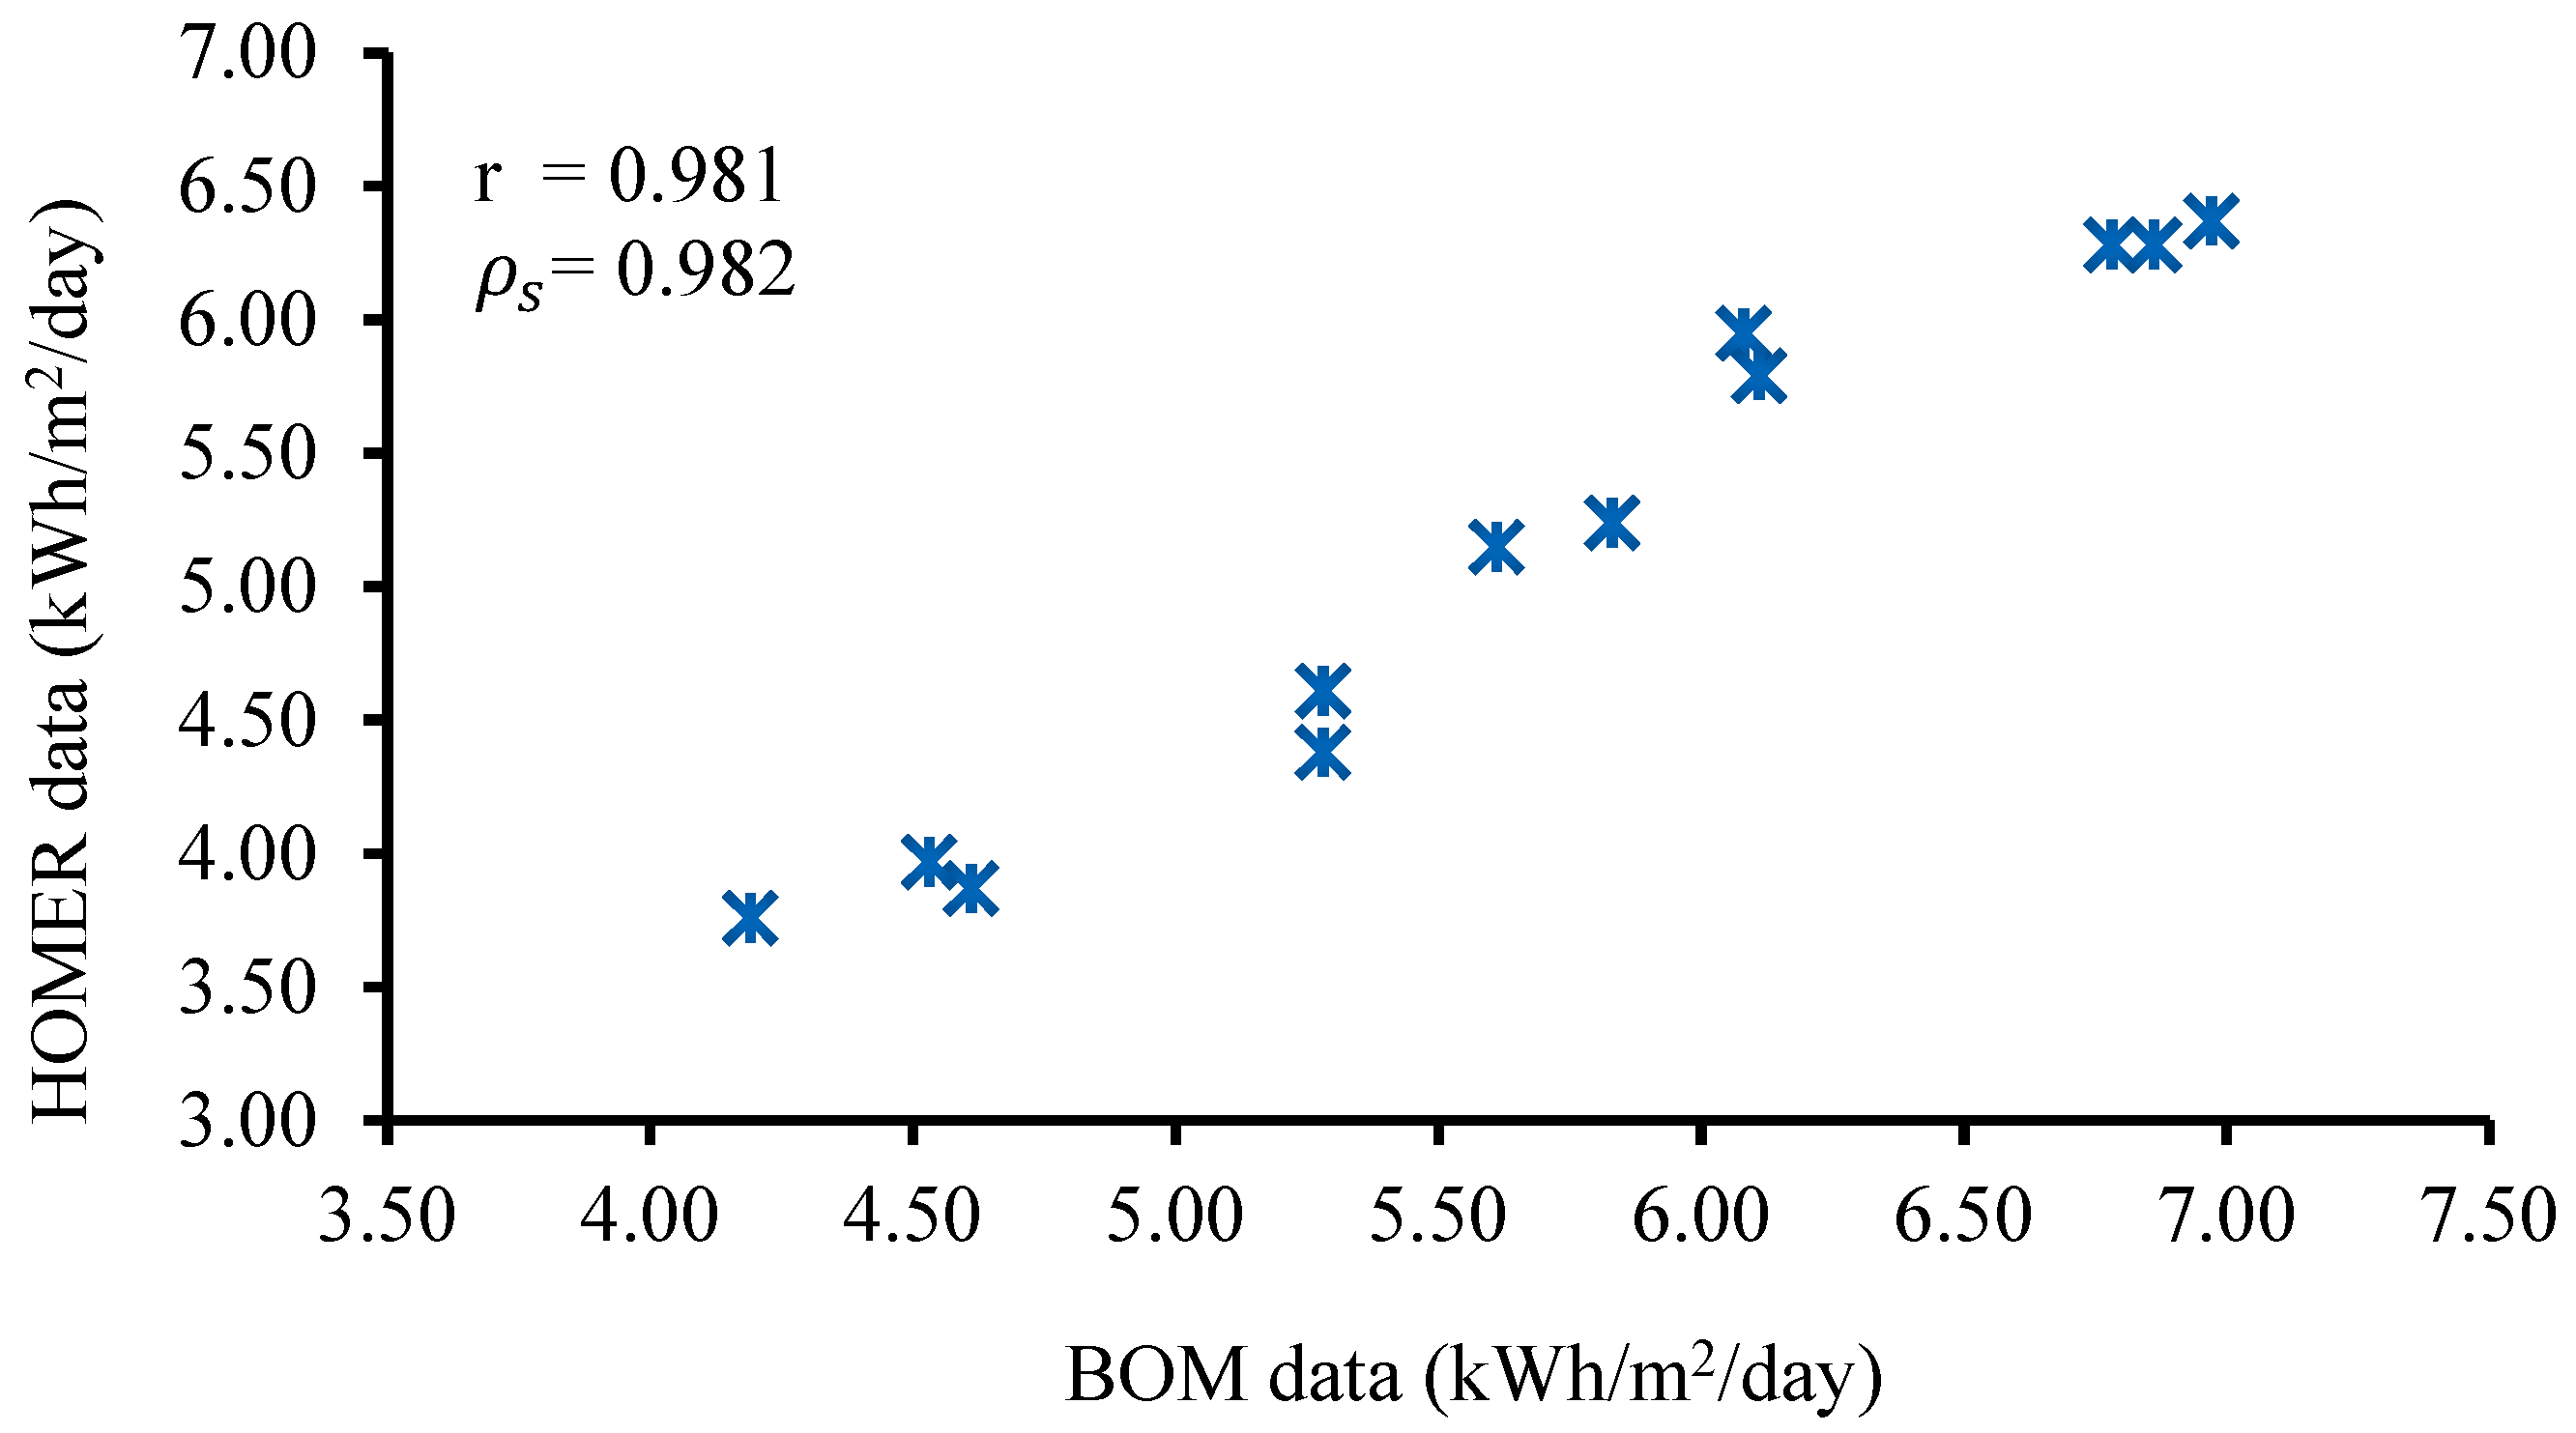
Figure 22, both datasets present very close daily radiation values and convey a similar pattern, offering the highest value in December and the lowest value in June. Furthermore, to evaluate the similarity in the information content between the two datasets, the correlation analysis is performed using Python programming, as in the earlier case. According to the result, the values of PCC and SCC are 0.981 and 0.982, respectively, with a p-value of ‘0’. Hence, it represents the strong positive correlation between these two datasets with high significance as well, which is depicted in Figure 23. Hence, this result refers to the acceptability of the solar data from HOMER to be used for this analysis of the studied location. The data used for both the load profile and solar data validation are included in the Supplementary Material section.

5. Conclusions

This research conducts a feasibility study of hybrid renewable energy system implementation aiming to deliver clean energy to a remote location, Palm Island in Australia. HOMER software is used to evaluate the technical, economic and environmental performances. The proposed system comprises all-renewable energy-based sources, including solar, wind, hydrogen, and bioenergy. The inclusion of multiple renewable energy sources and energy storage systems delivered economic and environmental benefits in hybrid renewable systems. The main contributions of this research are summarized as follows:
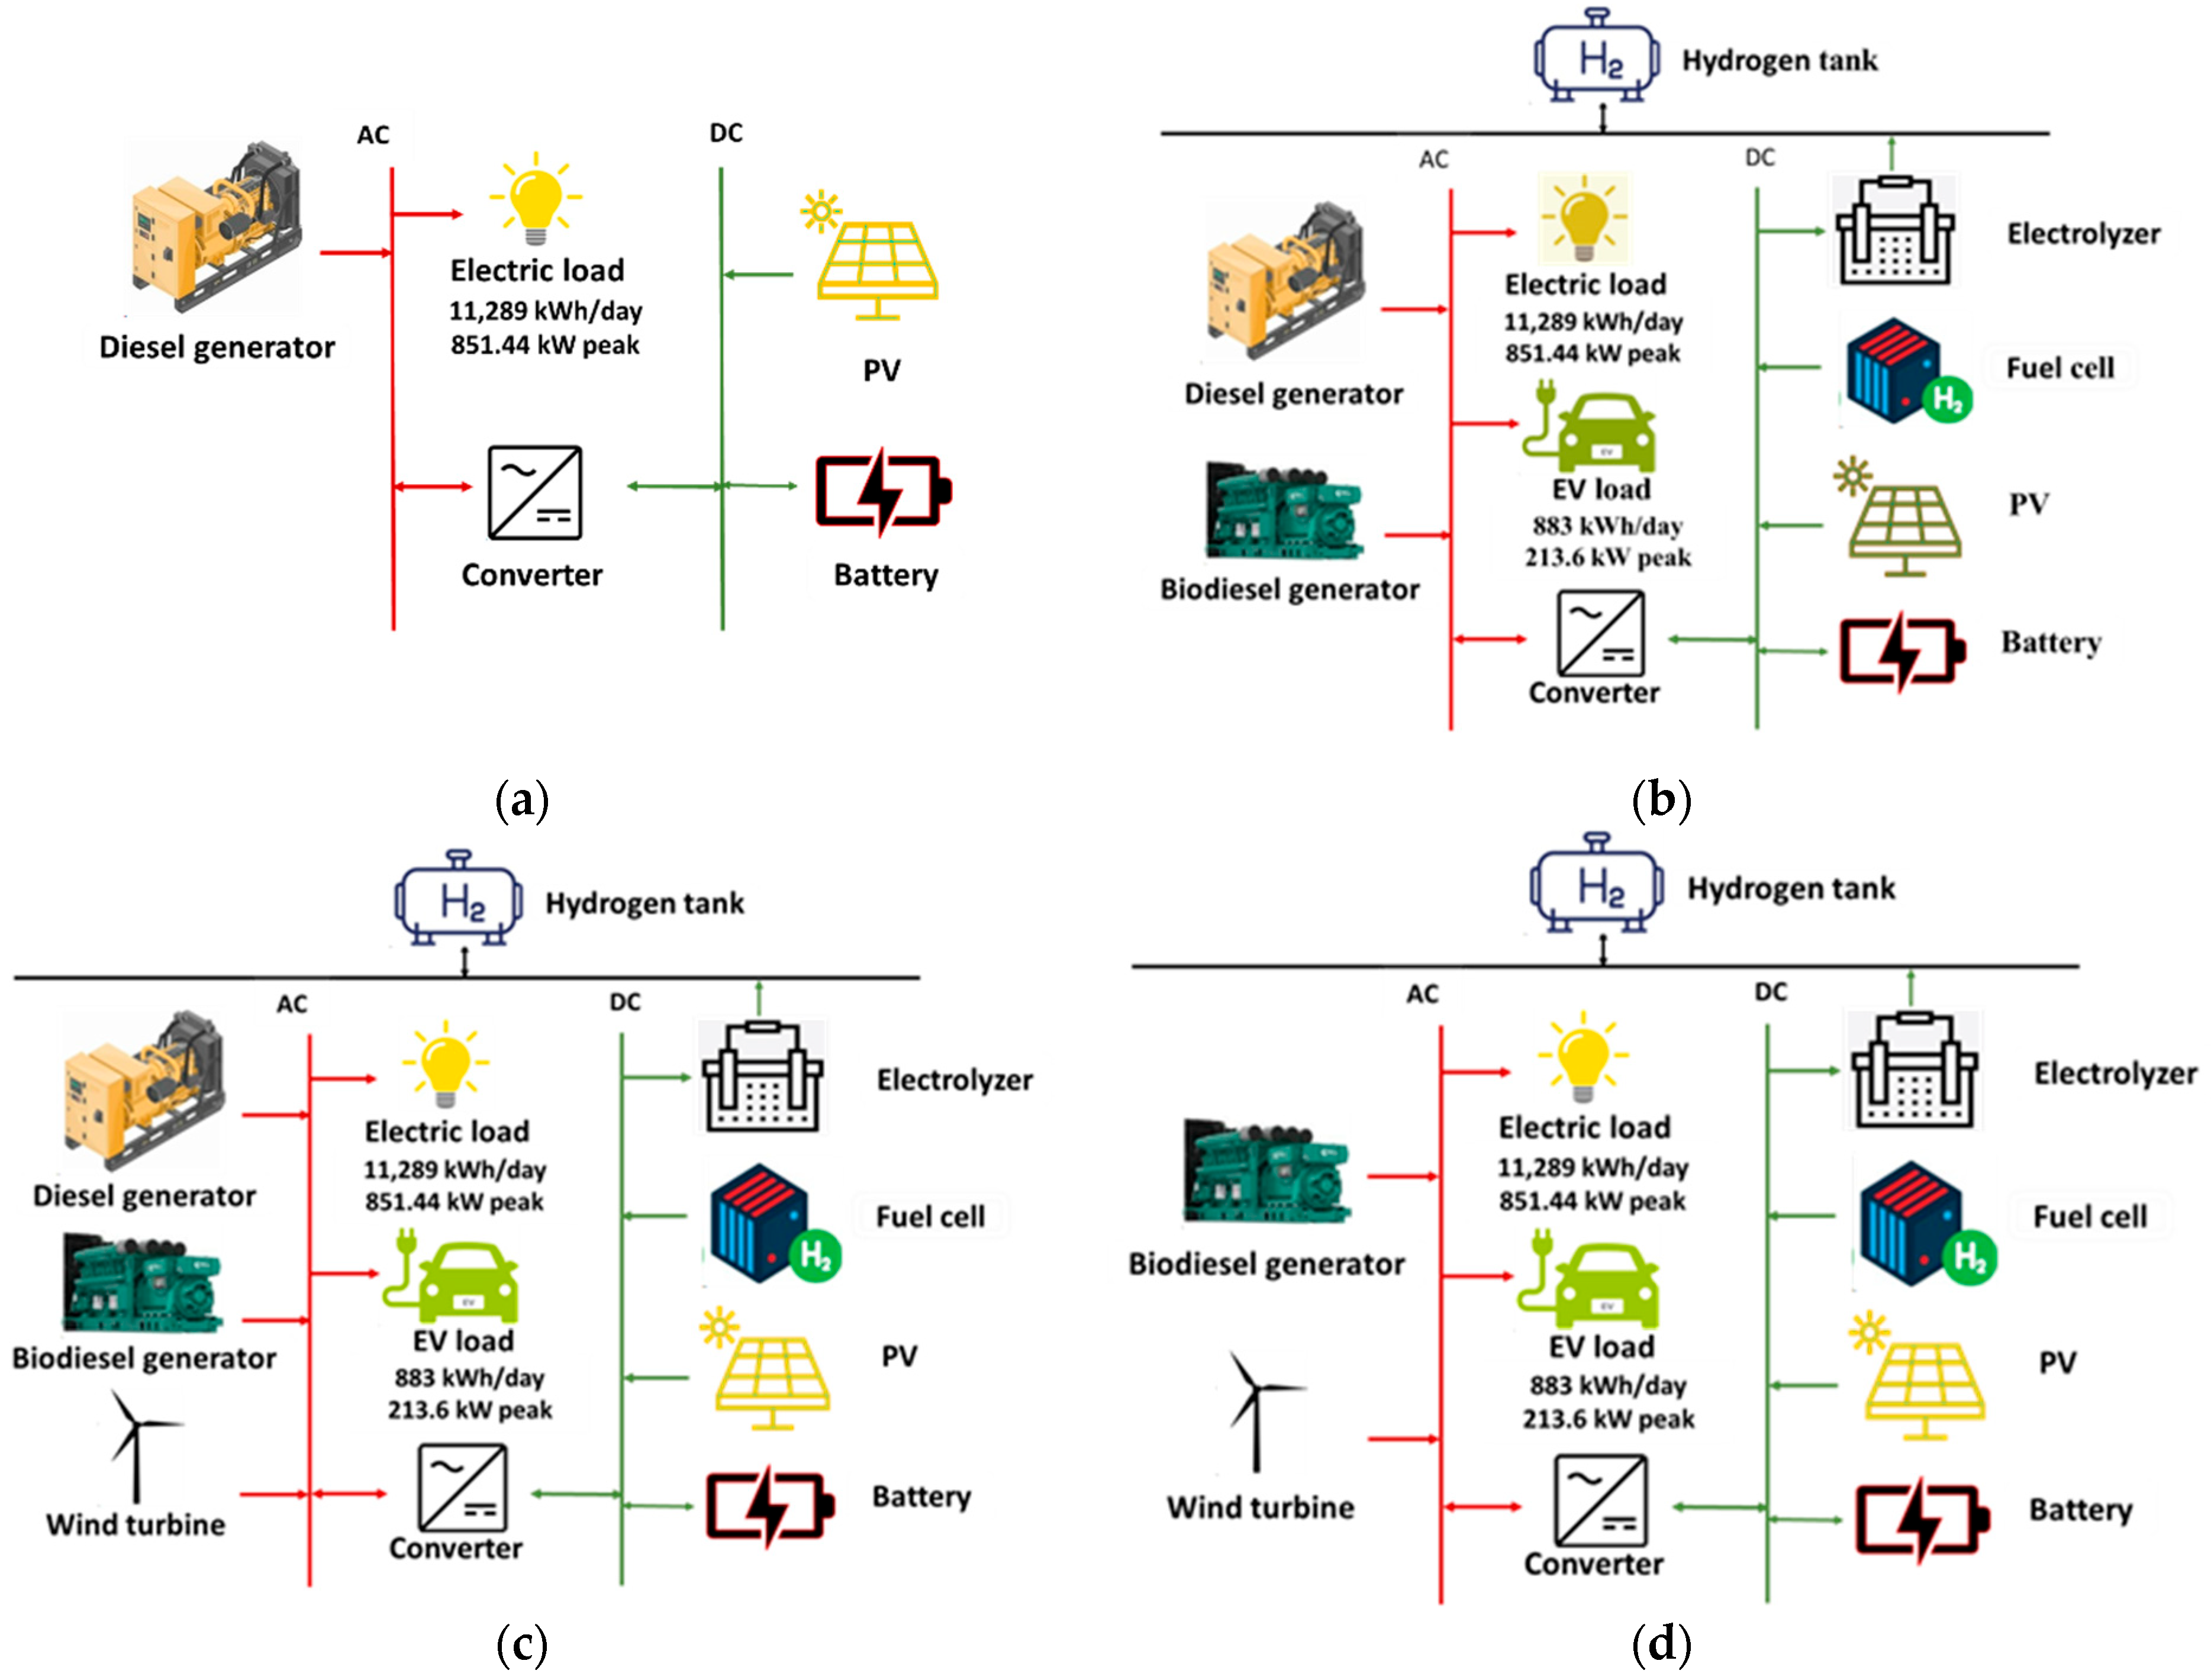
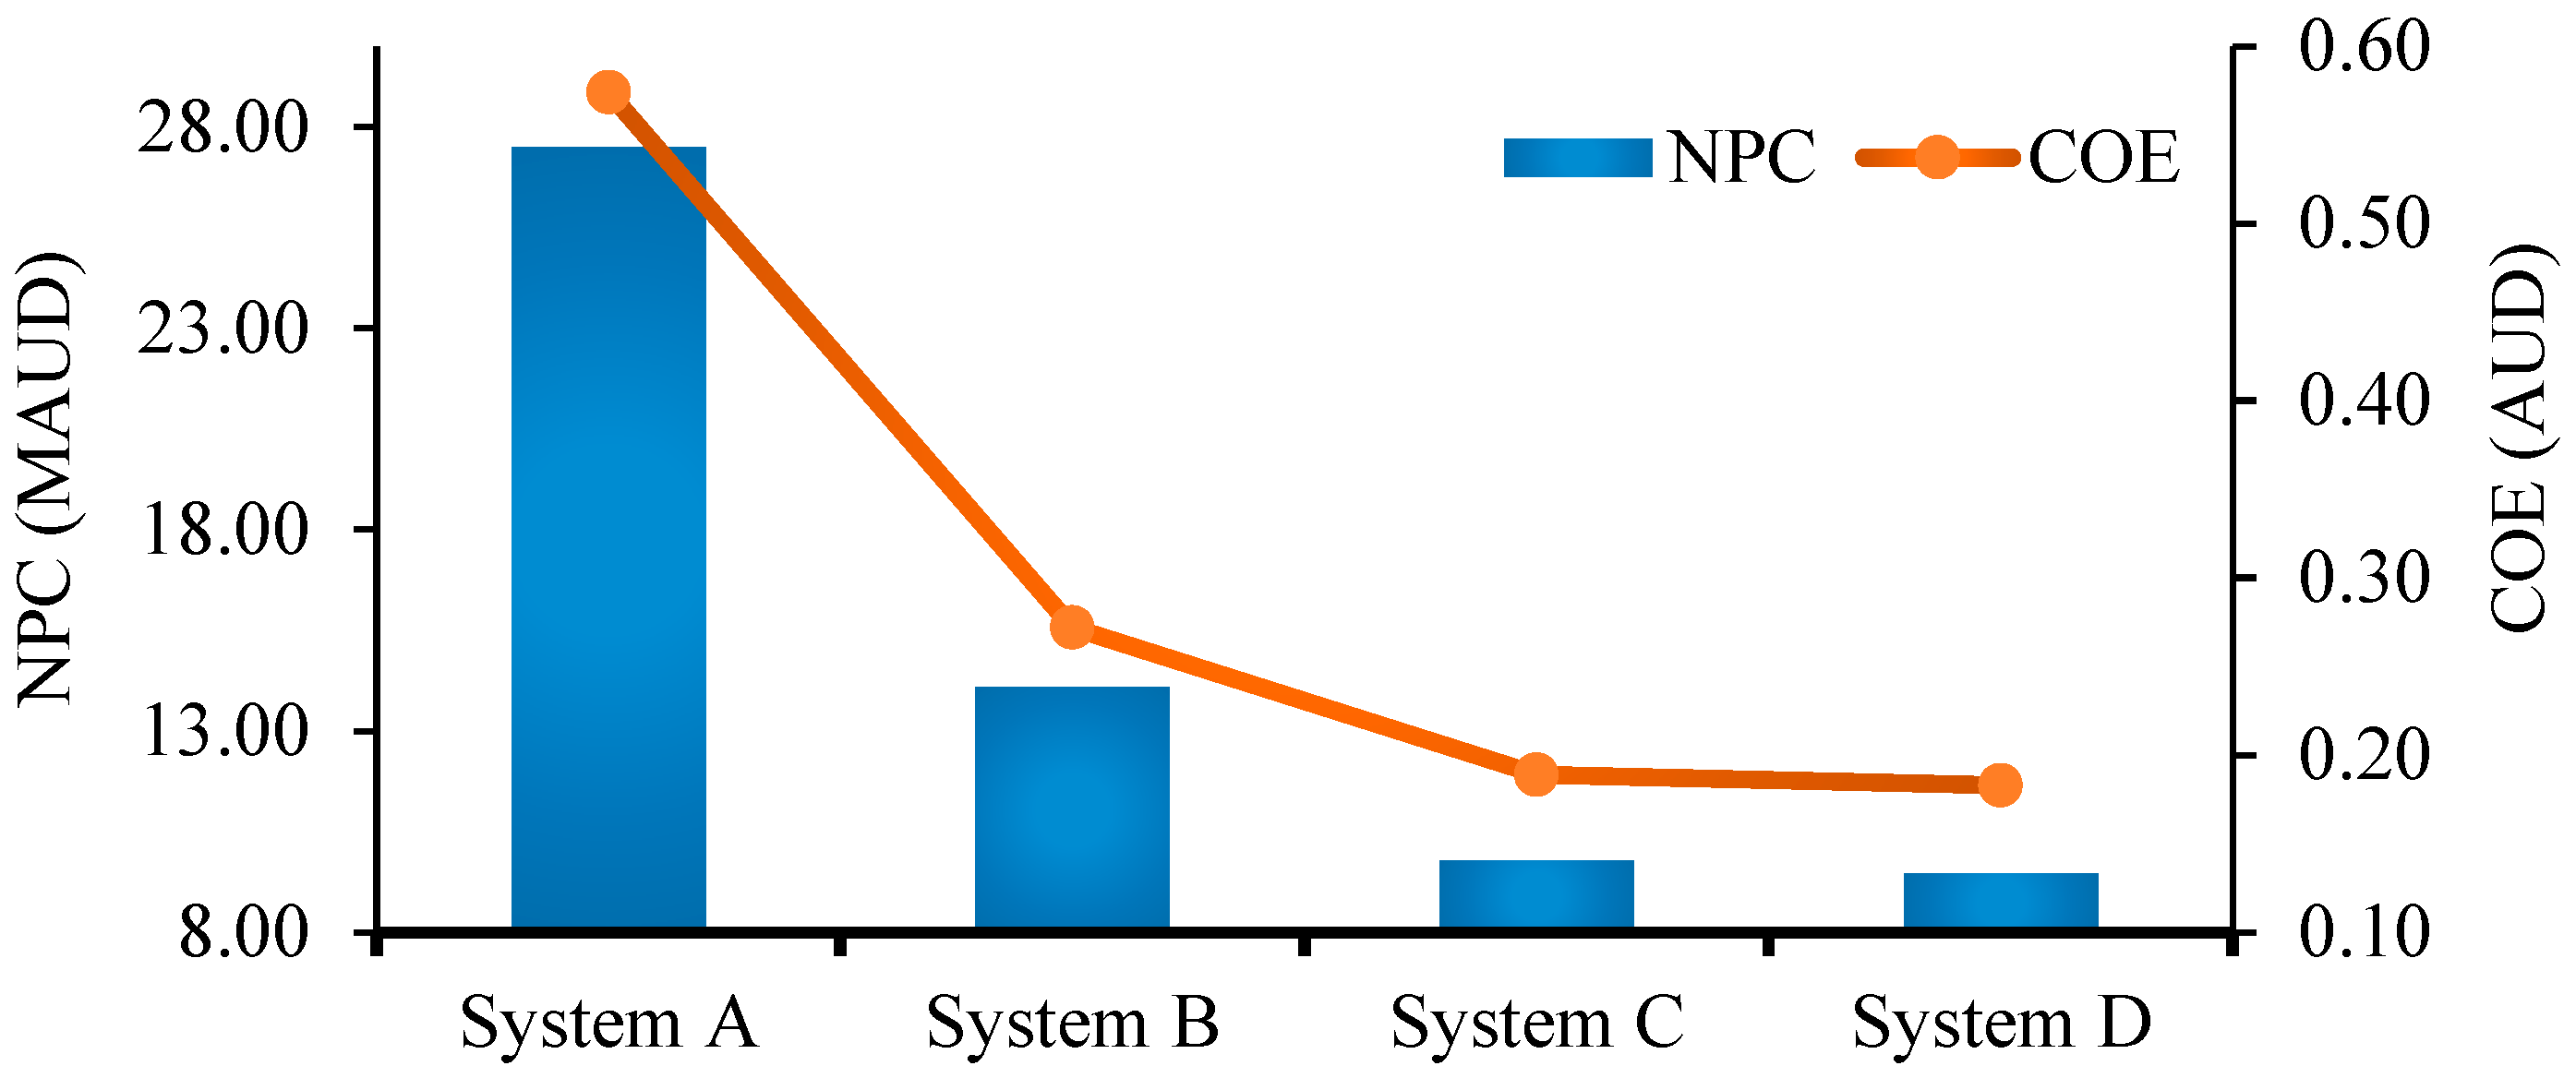
  • Several hybrid system configurations (PV/BESS/DG, PV/BESS/FC/BDG/DG, PV/BESS/WT/FC/BDG/DG, and PV/BESS/WT/FC/BDG) are analyzed. Appraisal of economic and environmental benefits through the inclusion of multiple RE sources and storage systems in hybrid renewable systems is observed;
  • An EV load has been considered with the residential load to examine the feasibility of the system with future EV uptake;
  • PV/BESS/WT/FC/BDG system offered the optimal performance with NPC AUD 9.46 M, COE AUD 0.183, and zero CO2 and SO2 emissions;
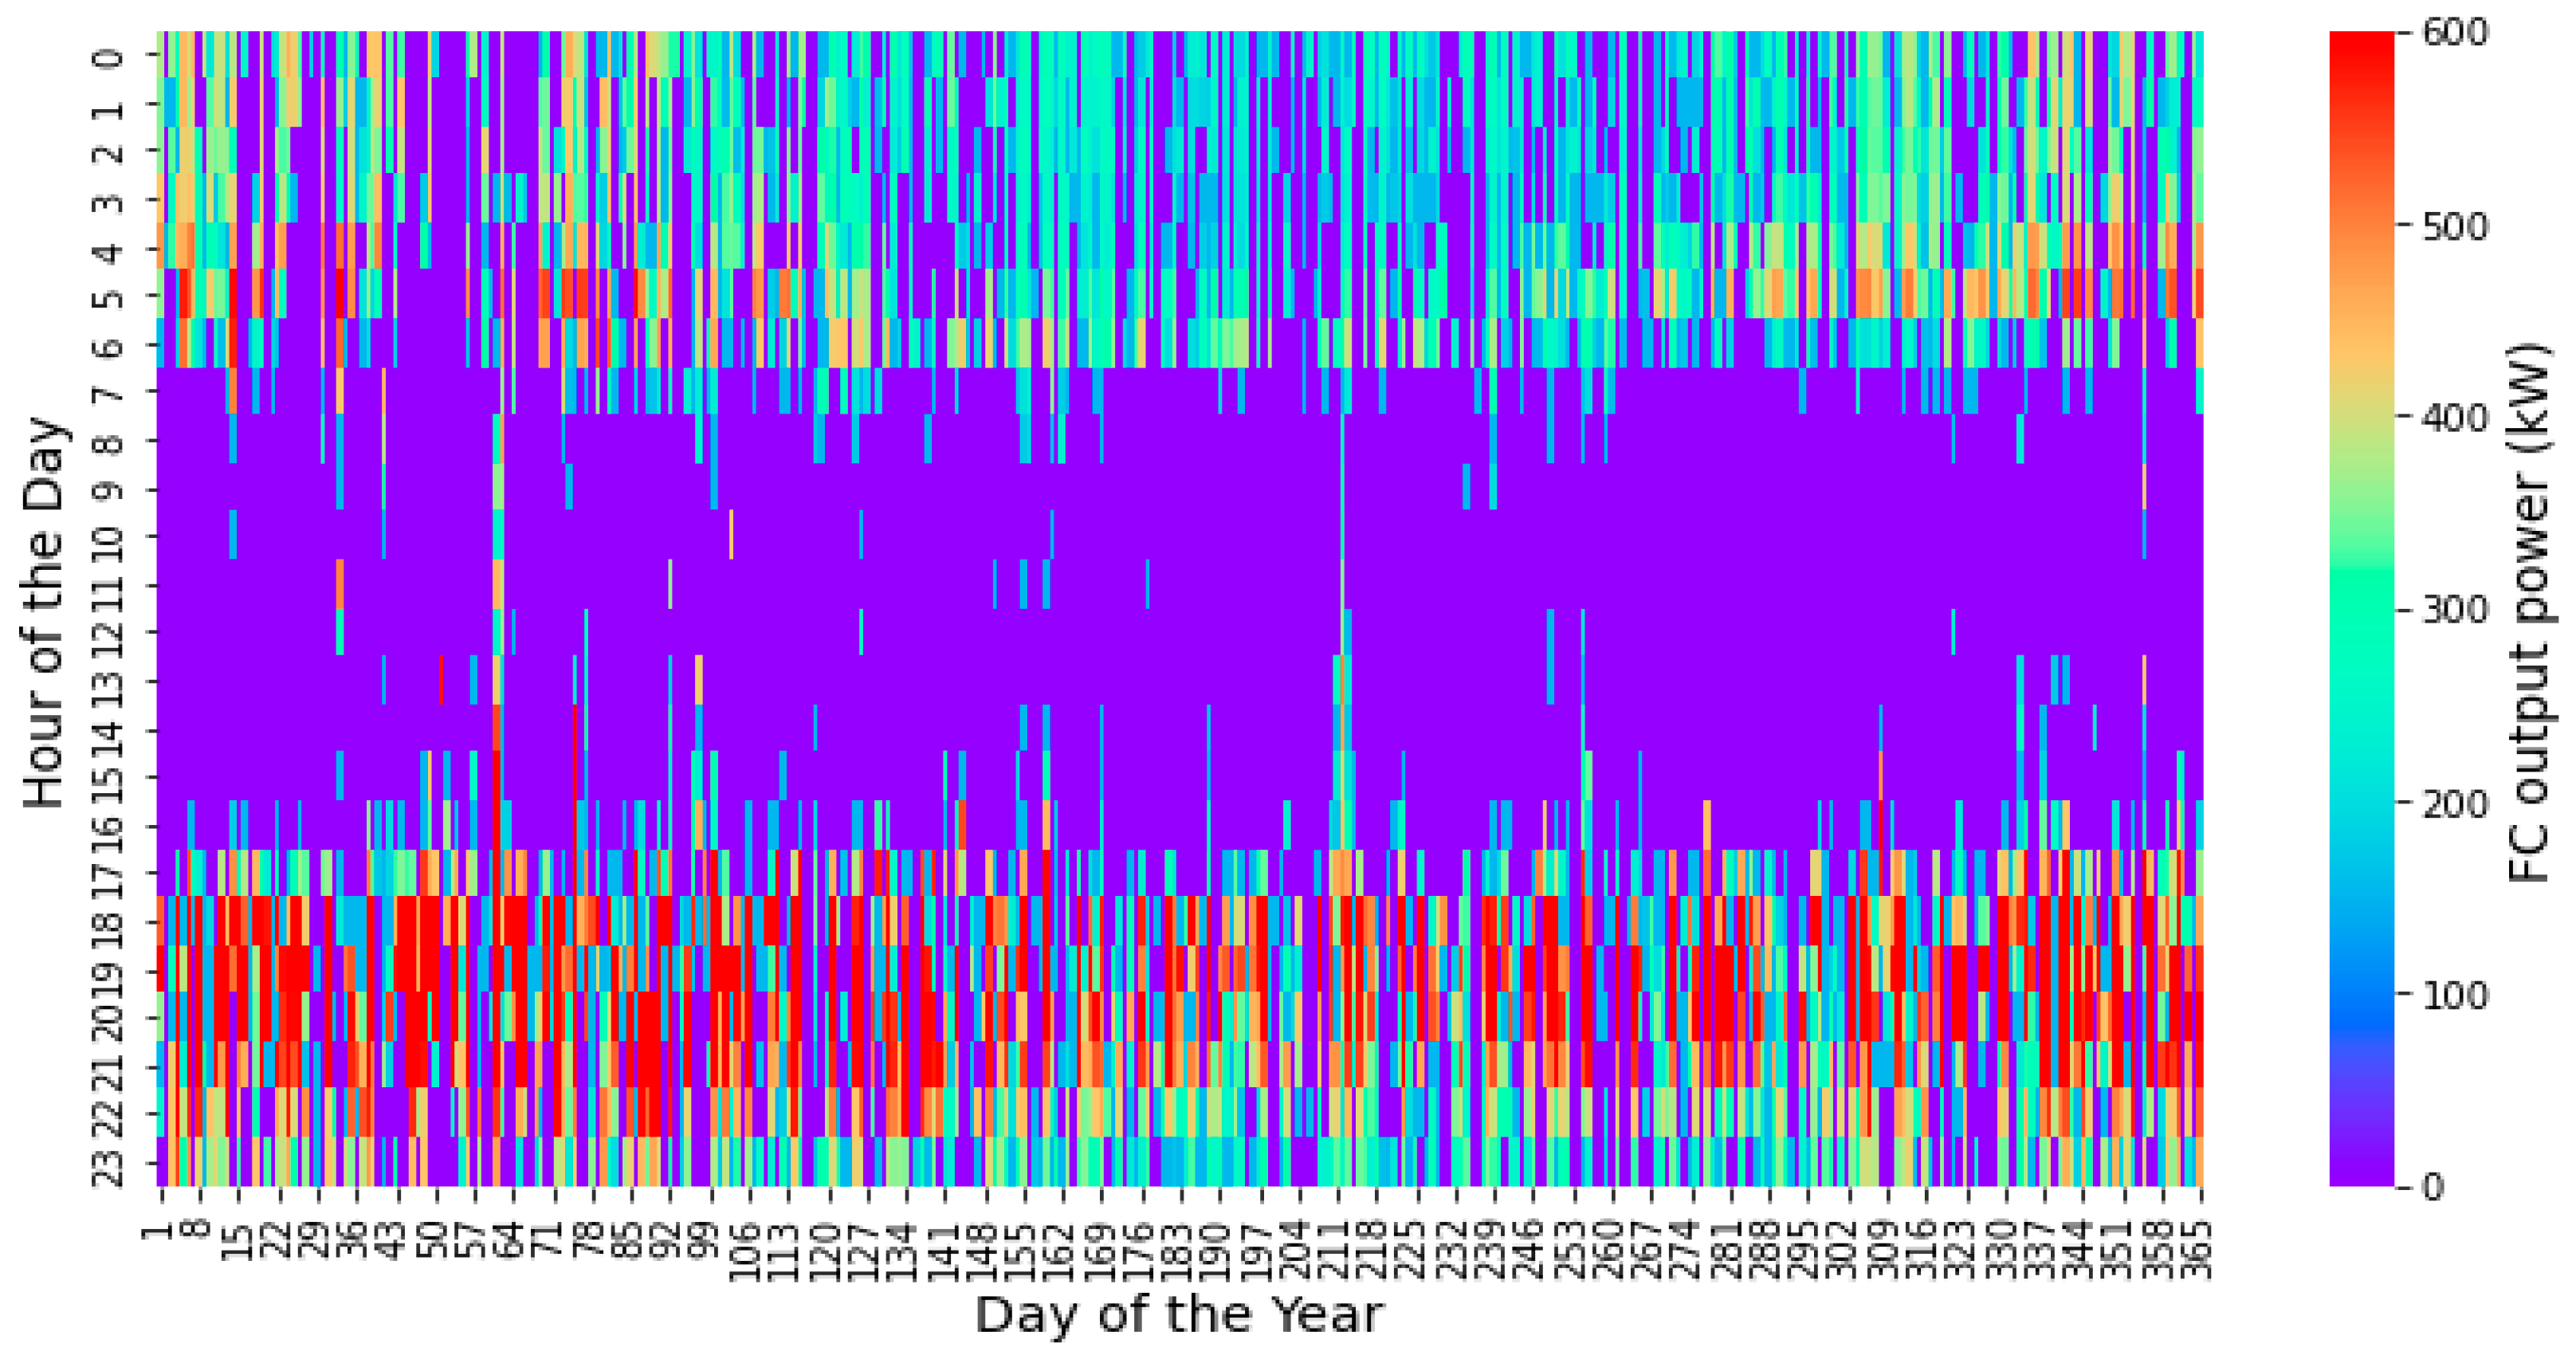
  • FC offered the major backup supply, indicating the promising role of hydrogen energy in maintaining reliability in hybrid systems;
  • Sensitivity analysis shows that a lower biodiesel price impacts more the optimal system cost and cost of energy compared to an increased price. Furthermore, the optimal system reliability is ensured up to a 24% increase of load, at a negligible capacity shortage of below 1%.
The outcome of this research demonstrates the feasibility of a cleaner energy system based on photovoltaic, wind, hydrogen, and bioenergy for remote locations. The carbon emissions reduction achieved by this system, combined with the adoption of electric vehicles, can support strategic decision-making in energy projects and is highly supportive of the Australian and global net-zero targets. While the prospect is appealing, the formulation of an environmentally friendly energy supply policy in remote regions of Australia can assist in efficient energy project planning and implementation. Furthermore, a lack of technological knowledge and skills can hinder the efficient implementation of such technology-intensive energy projects. In this regard, Government initiatives in the development of skilled manpower through training/workshops at national and international levels can be helpful in knowledge building and sharing. Moreover, particular attention should be exercised on active community engagement to implement a smooth energy transition.
While the research output is conducive to energy researchers and policymakers, further research highlighting the use of various battery types (lead acid, Powersafe SBS batteries, etc.) can extend backup power options in the system with informed knowledge. Moreover, the applicability of this research could be expanded by examining the energy system models at varied weather conditions (e.g., wind speed, solar radiation, etc.). Such an effort can be insightful regarding the feasibility of the proposed system in dissimilar climate regions while stretching the research benefits. Interestingly, the addition of a hydrogen load in the system can provide opportunities to facilitate fuel cell vehicles and can be explored in future research.

Supplementary Materials

The following supporting information can be downloaded at: https://www.mdpi.com/article/10.3390/cleantechnol7020036/s1, Table S1. Monthly mean daily global solar exposure (MJ/m2): Bureau of Meteorology solar data used for HOMER solar data validation. Table S2. HOMER load data used for load data validation. Table S3. ERGON Energy data used for load data validation.

Author Contributions

Conceptualization, R.Y., M.N.N., and F.R.; methodology, R.Y. and M.N.N.; software, R.Y.; validation, R.Y.; formal analysis, R.Y.; investigation, R.Y.; data curation, R.Y.; writing—original draft preparation, R.Y.; writing—review and editing, R.Y., M.N.N., F.R., and M.A.H.; visualization, R.Y.; supervision, M.N.N. All authors have read and agreed to the published version of the manuscript.

Funding

This research received no external funding.

Data Availability Statement

Data are contained within the article.

Conflicts of Interest

The authors declare no conflicts of interest.

Abbreviations

The following abbreviations are used in this manuscript:
RERenewable energy
GHGGreenhouse gas
HRESHybrid renewable energy system
UNUnited Nation
EVElectric vehicle
ESSEnergy storage system
NRELNational Renewable Energy Laboratory
PVPhotovoltaic
FCFuel cell
HOMERHybrid optimization and model for multiple energy resources
NPCNet present cost
COECost of energy
O&MOperational and maintenance
COHCost of hydrogen
TESThermal energy storage
GHIGlobal horizontal irradiance
LFLoad following
CCCycle charging
WTWind turbine
BDGBiodiesel generator
DGDiesel generator
BESSBattery energy storage system
HTHydrogen tank
BOMBureau of Meteorology
PCCPearson correlation co-efficient
SCCSpearman correlation co-efficient

References

  1. IRENA. Climate Change and Renewable Energy: National Policies and the Role of Communities, Cities and Regions (Report to the G20 Climate Sustainability Working Group (CSWG)); International Renewable Energy Agency: Abu Dhabi, United Arab Emirates, 2019; Available online: https://www.irena.org/-/media/Files/IRENA/Agency/Publication/2019/Jun/IRENA_G20_climate_sustainability_2019.pdf (accessed on 3 August 2024).
  2. Brinsmead, T.S.; Verikios, G.; Cook, S.; Green, D.; Khandoker, T.; Kember, O.; Reedman, L.; Rodriguez, S.; Whitten, S. Pathways to net zero emissions—An Australian perspective on rapid decarbonisation. 2023. Available online: https://publications.csiro.au/publications/publication/PIcsiro:EP2023-0741 (accessed on 6 April 2025).
  3. The Australian Renewable Energy Agency. Off Grid. Available online: https://arena.gov.au/renewable-energy/off-grid/ (accessed on 29 July 2024).
  4. Department of Climate Change, Energy, the Environment and Water. Australian Energy Update 2023. 2023. Available online: https://www.energy.gov.au/publications/australian-energy-update-2023 (accessed on 22 July 2024).
  5. Department of Climate Change, Energy, the Environment and Water. Reducing Transport Emissions. Available online: https://www.dcceew.gov.au/energy/transport#:~:text=In%202022%20our%20transport%20sector,source%20of%20emissions%20by%202030 (accessed on 9 April 2025).
  6. Sedaghat, A.; Kalbasi, R.; Narayanan, R.; Mehdizadeh, A.; Soleimani, S.M.; Malayer, M.A.; Al-Khiami, M.I.; Salem, H.; Hussam, W.K.; Sabati, M. Integrating solar PV systems for energy efficiency in portable cabins: A case study in Kuwait. Sol. Energy 2024, 277, 112715. [Google Scholar] [CrossRef]
  7. International Energy Agency. Global EV Data Explorer. Available online: https://www.iea.org/data-and-statistics/data-tools/global-ev-data-explorer (accessed on 4 April 2025).
  8. Council, E.V. Consumer Attitudes Survey 2021. 2021. Available online: https://electricvehiclecouncil.com.au/wp-content/uploads/2021/10/2021-EVC-carsales-Consumer-attitudes-survey-web.pdf (accessed on 5 April 2025).
  9. Hassan, Q.; Algburi, S.; Sameen, A.Z.; Salman, H.M.; Jaszczur, M. A review of hybrid renewable energy systems: Solar and wind-powered solutions: Challenges, opportunities, and policy implications. Results Eng. 2023, 20, 101621. [Google Scholar] [CrossRef]
  10. Egeland-Eriksen, T.; Hajizadeh, A.; Sartori, S. Hydrogen-based systems for integration of renewable energy in power systems: Achievements and perspectives. Int. J. Hydrogen Energy 2021, 46, 31963–31983. [Google Scholar] [CrossRef]
  11. Yimen, N.; Monkam, L.; Tcheukam-Toko, D.; Musa, B.; Abang, R.; Fombe, L.F.; Abbasoglu, S.; Dagbasi, M. Optimal design and sensitivity analysis of distributed biomass-based hybrid renewable energy systems for rural electrification: Case study of different photovoltaic/wind/battery-integrated options in Babadam, northern Cameroon. IET Renew. Power Gener. 2022, 16, 2939–2956. [Google Scholar] [CrossRef]
  12. Alengebawy, A.; Ghimire, N.; Abdelkhalek, S.T.; Samer, M. Conversion of bioenergy materials to secondary fuels. In Encyclopedia of Renewable Energy, Sustainability and the Environment, Elsevier: Amsterdam, The Netherlands, 1st ed.; 2023; pp. 825–838. [Google Scholar]
  13. Mubaarak, S.; Zhang, D.; Chen, Y.; Liu, J.; Wang, L.; Yuan, R.; Wu, J.; Zhang, Y.; Li, M. Techno-economic analysis of grid-connected pv and fuel cell hybrid system using different pv tracking techniques. Appl. Sci. 2020, 10, 8515. [Google Scholar] [CrossRef]
  14. Dekkiche, M.; Tahri, T.; Denai, M. Techno-economic comparative study of grid-connected PV/reformer/FC hybrid systems with distinct solar tracking systems. Energy Convers. Manag. X 2023, 18, 100360. [Google Scholar] [CrossRef]
  15. Das, H.S.; Tan, C.W.; Yatim, A.H.M.; Lau, K.Y. Feasibility analysis of hybrid photovoltaic/battery/fuel cell energy system for an indigenous residence in East Malaysia. Renew. Sustain. Energy Rev. 2017, 76, 1332–1347. [Google Scholar] [CrossRef]
  16. Al-Badi, A.; Al Wahaibi, A.; Ahshan, R.; Malik, A. Techno-economic feasibility of a solar-wind-fuel cell energy system in Duqm, Oman. Energies 2022, 15, 5379. [Google Scholar] [CrossRef]
  17. Garip, M.; Sulukan, E.; Celiktas, M.S. Optimization of a grid-connected hybrid energy system: Techno-economic and environmental assessment. Clean. Energy Syst. 2022, 3, 100042. [Google Scholar] [CrossRef]
  18. Sawle, Y.; Jain, S.; Babu, S.; Nair, A.R.; Khan, B. Prefeasibility economic and sensitivity assessment of hybrid renewable energy system. IEEE Access 2021, 9, 28260–28271. [Google Scholar] [CrossRef]
  19. Dash, R.L.; Mohanty, B.; Hota, P.K. Energy, economic and environmental (3E) evaluation of a hybrid wind/biodiesel generator/tidal energy system using different energy storage devices for sustainable power supply to an Indian archipelago. Renew. Energy Focus 2023, 44, 357–372. [Google Scholar] [CrossRef]
  20. Izadi, M.; Afsharpanah, F.; Mohadjer, A.; Shobi, M.O.; Ajarostaghi, S.S.M.; Minelli, F. Performance enhancement of a shell-and-coil ice storage enclosure for air conditioning using spiral longitudinal fins: A numerical approach. Heliyon 2025, 11, e42786. [Google Scholar] [CrossRef] [PubMed]
  21. Chennaif, M.; Zahboune, H.; Elhafyani, M.; Zouggar, S. Electric System Cascade Extended Analysis for optimal sizing of an autonomous hybrid CSP/PV/wind system with Battery Energy Storage System and thermal energy storage. Energy 2021, 227, 120444. [Google Scholar] [CrossRef]
  22. Ekren, O.; Canbaz, C.H.; Güvel, Ç.B. Sizing of a solar-wind hybrid electric vehicle charging station by using HOMER software. J. Clean. Prod. 2021, 279, 123615. [Google Scholar] [CrossRef]
  23. Alarrouqi, R.A.; Ellabban, O.; Al-Fagih, L. An assessment of different load demands on photovoltaic plus battery storage system profitability: A case study of Australia. In Proceedings of the 2020 IEEE 29th International Symposium on Industrial Electronics (ISIE), Delft, The Netherlands, 17–19 June 2020; IEEE: Piscataway, NJ, USA, 2020; pp. 1497–1502. [Google Scholar]
  24. Dawood, F.; Shafiullah, G.; Anda, M. Stand-alone microgrid with 100% renewable energy: A case study with hybrid solar PV-battery-hydrogen. Sustainability 2020, 12, 2047. [Google Scholar] [CrossRef]
  25. Al-Hanahi, B.; Wen, J.; Habibi, D.; Aziz, A. Techno-Economic Analysis of Hybrid Hydrogen Fuel-Cell/PV/Wind Turbine/Battery/Diesel Energy System for Rural Coastal Community in Western Australia. In Proceedings of the 2023 International Conference on Sustainable Technology and Engineering (i-COSTE), Nadi, Fiji, 4–6 December 2023; IEEE: Piscataway, NJ, USA, 2023; pp. 1–6. [Google Scholar]
  26. Rahimi, I.; Nikoo, M.R.; Gandomi, A.H. Techno-economic analysis for using hybrid wind and solar energies in Australia. Energy Strategy Rev. 2023, 47, 101092. [Google Scholar] [CrossRef]
  27. Hasan, T.; Emami, K.; Shah, R.; Hassan, N.; Belokoskov, V.; Ly, M. Techno-economic Assessment of a Hydrogen-based Islanded Microgrid in North-east. Energy Rep. 2023, 9, 3380–3396. [Google Scholar] [CrossRef]
  28. Ellabban, O.; Alassi, A. Optimal hybrid microgrid sizing framework for the mining industry with three case studies from Australia. IET Renew. Power Gener. 2021, 15, 409–423. [Google Scholar] [CrossRef]
  29. Kharel, S.; Shabani, B. Hydrogen as a Long-Term Large-Scale Energy Storage Solution to Support Renewables. Energies 2018, 11, 2825. [Google Scholar] [CrossRef]
  30. Shezan, S.K.A.; Das, N.; Mahmudul, H. Techno-economic Analysis of a Smart-grid Hybrid Renewable Energy System for Brisbane of Australia. Energy Procedia 2017, 110, 340–345. [Google Scholar] [CrossRef]
  31. Shafiullah, G.M. Hybrid renewable energy integration (HREI) system for subtropical climate in Central Queensland, Australia. Renew. Energy 2016, 96, 1034–1053. [Google Scholar] [CrossRef]
  32. Aziz, A.S.; Tajuddin, M.F.N.; Hussain, M.K.; Adzman, M.R.; Ghazali, N.H.; Ramli, M.A.; Zidane, T.E.K. A new optimization strategy for wind/diesel/battery hybrid energy system. Energy 2022, 239, 122458. [Google Scholar] [CrossRef]
  33. Aziz, A.S.; Tajuddin, M.F.N.; Zidane, T.E.K.; Su, C.-L.; Alrubaie, A.J.K.; Alwazzan, M.J. Techno-economic and environmental evaluation of PV/diesel/battery hybrid energy system using improved dispatch strategy. Energy Rep. 2022, 8, 6794–6814. [Google Scholar] [CrossRef]
  34. Queensland Government. What Are Biofuels? How We Make and Use Biofuels in Queensland. Available online: https://www.statedevelopment.qld.gov.au/news/what-are-biofuels-how-we-make-and-use-biofuels-in-queensland (accessed on 25 May 2024).
  35. Queensland Government. Queensland’s Zero Emission Vehicle Strategy 2022–2032. 2022. Available online: https://www.publications.qld.gov.au/ckan-publications-attachments-prod/resources/cc180075-23bb-499f-8ac2-d1704973feca/zev-strategy.pdf?ETag=2194a593a5798b4a949ddac821181e55 (accessed on 7 April 2025).
  36. HOMER Help Manual. Available online: https://www.homerenergy.com/pdf/HOMER2_2.8_HelpManual.pdf (accessed on 15 July 2024).
  37. Abdin, Z.; Mérida, W. Hybrid energy systems for off-grid power supply and hydrogen production based on renewable energy: A techno-economic analysis. Energy Convers. Manag. 2019, 196, 1068–1079. [Google Scholar] [CrossRef]
  38. Yadav, S.; Kumar, P.; Kumar, A. Techno-economic assessment of hybrid renewable energy system with multi energy storage system using HOMER. Energy 2024, 297, 131231. [Google Scholar] [CrossRef]
  39. EARTHCHECK. Technical Appendix 1—Sustainability Assessment. 2020. Available online: https://earthcheck.org/wp-content/uploads/2022/08/palm-technical-appendix-1-sustainability-assessment-and-risk-assessment.pdf (accessed on 9 April 2025).
  40. Dwyer, S.; Dargaville, R.; Nagrath, K.; Thorpe, A.; Milton, A.; James, B.; McGrath, B.; Hargroves, C.; Kuch, D.; Meegahapola, L.; et al. N1 Opportunity Assessment: Electric Vehicles and the Grid; RACE for 2030; CRC: Sydney, Australia, 2021; Available online: http://hdl.handle.net/10453/151846 (accessed on 10 April 2025).
  41. Chen, W.; Yang, S.; Lai, J.H.K. Carbon offset potential of rooftop photovoltaic systems in China. Sol. Energy 2024, 274, 112557. [Google Scholar] [CrossRef]
  42. Khosravani, A.; Safaei, E.; Reynolds, M.; Kelly, K.E.; Powell, K.M. Challenges of reaching high renewable fractions in hybrid renewable energy systems. Energy Rep. 2023, 9, 1000–1017. [Google Scholar] [CrossRef]
  43. Yasmin, R.; Amin, B.M.R.; Shah, R.; Barton, A. A survey of commercial and industrial demand response flexibility with energy storage systems and renewable energy. Sustainability 2024, 16, 731. [Google Scholar] [CrossRef]
  44. Okundamiya, M. Size optimization of a hybrid photovoltaic/fuel cell grid connected power system including hydrogen storage. Int. J. Hydrogen Energy 2021, 46, 30539–30546. [Google Scholar] [CrossRef]
  45. Fontalvo, V.M.; Nelson, G.J.; Pupo-Roncallo, O.; Sanjuan, M.E.; Gómez, H.A. A techno-economic assessment for fuel cells hybrid systems in stationary applications. Int. J. Sustain. Energy 2023, 42, 889–912. [Google Scholar] [CrossRef]
  46. Ghimire, R.; Niroula, S.; Pandey, B.; Subedi, A.; Thapa, B.S. Techno-economic assessment of fuel cell-based power backup system as an alternative to diesel generators in Nepal: A case study for hospital applications. Int. J. Hydrogen Energy 2024, 56, 289–301. [Google Scholar] [CrossRef]
  47. Rezaei, M.; Dampage, U.; Das, B.K.; Nasif, O.; Borowski, P.F.; Mohamed, M.A. Investigating the impact of economic uncertainty on optimal sizing of grid-independent hybrid renewable energy systems. Processes 2021, 9, 1468. [Google Scholar] [CrossRef]
  48. Ecotechbiodiesel. The Power to Answer Some of Our Planet’s Most Important Questions. Available online: https://www.ecotechbiodiesel.com/biodiesel (accessed on 12 January 2025).
  49. Belboul, Z.; Toual, B.; Kouzou, A.; Mokrani, L.; Bensalem, A.; Kennel, R.; Abdelrahem, M. Multiobjective optimization of a hybrid PV/Wind/Battery/Diesel generator system integrated in microgrid: A case study in Djelfa, Algeria. Energies 2022, 15, 3579. [Google Scholar] [CrossRef]
  50. Al-Orabi, A.M.; Osman, M.G.; Sedhom, B.E. Evaluation of green hydrogen production using solar, wind, and hybrid technologies under various technical and financial scenarios for multi-sites in Egypt. Int. J. Hydrogen Energy 2023, 48, 38535–38556. [Google Scholar] [CrossRef]
  51. Mansir, I.B.; Okonkwo, P.C.; Farouk, N. Techno-economic optimization of a photovoltaic-wind energy-based hydrogen production system: A case study of different cities of Saudi Arabia. Energy Environ. 2024. [Google Scholar] [CrossRef]
  52. Bhatt, A.; Ongsakul, W. Optimal techno-economic feasibility study of net-zero carbon emission microgrid integrating second-life battery energy storage system. Energy Convers. Manag. 2022, 266, 115825. [Google Scholar] [CrossRef]
  53. Powell, J.W.; Welsh, J.M.; Freebairn, J. The economics of integrating alternative energy: A farm case study at Emerald, Queensland. Aust. Farm Bus. Manag. J. 2019, 16, 1–16. [Google Scholar]
  54. Abusaq, M.; Zohdy, M.A. Optimizing Renewable Energy Integration through Innovative Hybrid Microgrid Design: A Case Study of Najran Secondary Industrial Institute in Saudi Arabia. Clean Technol. 2024, 6, 397–417. [Google Scholar] [CrossRef]
  55. Lambert, T.; Gilman, P.; Lilienthal, P. Micropower system modeling with HOMER. Integr. Altern. Sources Energy 2006, 1, 379–385. [Google Scholar]
  56. Uwineza, L.; Kim, H.-G.; Kleissl, J.; Kim, C.K. Technical control and optimal dispatch strategy for a hybrid energy system. Energies 2022, 15, 2744. [Google Scholar] [CrossRef]
  57. Oxford Economics Australia. Cost of Capital Survey 2023: Report Produced for the Australian Energy Market Operator. 2023. Available online: https://aemo.com.au/-/media/files/major-publications/isp/2023/iasr-supporting-material/cost-of-capital-survey-2023-for-aemo---oxford-economics---final-report.pdf?la=en (accessed on 14 May 2024).
  58. Australian Bureau of Statistics. Consumer Price Index, Australia. Available online: https://www.abs.gov.au/statistics/economy/price-indexes-and-inflation/consumer-price-index-australia/jun-quarter-2024 (accessed on 14 May 2024).
  59. Turkdogan, S. Design and optimization of a solely renewable based hybrid energy system for residential electrical load and fuel cell electric vehicle. Eng. Sci. Technol. Int. J. 2021, 24, 397–404. [Google Scholar] [CrossRef]
  60. Rahmat, M.A.A.; Hamid, A.S.A.; Lu, Y.; Ishak, M.A.A.; Suheel, S.Z.; Fazlizan, A.; Ibrahim, A. An analysis of renewable energy technology integration investments in Malaysia using HOMER pro. Sustainability 2022, 14, 13684. [Google Scholar] [CrossRef]
  61. U.S. Department of Energy. Biodiesel Basics. 2011. Available online: https://www.nrel.gov/docs/fy11osti/47504.pdf (accessed on 29 July 2024).
  62. Zhao, X.; Hu, H.; Yuan, H.; Chu, X. How does adoption of electric vehicles reduce carbon emissions? Evidence from China. Heliyon 2023, 9, e20296. [Google Scholar] [CrossRef] [PubMed]
  63. Ullah, Z.; Elkadeem, M.; Kotb, K.M.; Taha, I.B.; Wang, S. Multi-criteria decision-making model for optimal planning of on/off grid hybrid solar, wind, hydro, biomass clean electricity supply. Renew. Energy 2021, 179, 885–910. [Google Scholar] [CrossRef]
  64. Abdin, Z.; Al Khafaf, N.; McGrath, B. Feasibility of hydrogen hybrid energy systems for sustainable on-and off-grid integration: An Australian REZs case study. Int. J. Hydrogen Energy 2024, 57, 1197–1207. [Google Scholar] [CrossRef]
  65. Bahramara, S.; Moghaddam, M.P.; Haghifam, M. Optimal planning of hybrid renewable energy systems using HOMER: A review. Renew. Sustain. Energy Rev. 2016, 62, 609–620. [Google Scholar] [CrossRef]
  66. Han, X. On Statistical Measures for Data Quality Evaluation. J. Geogr. Inf. Syst. 2020, 12, 178–187. [Google Scholar] [CrossRef]
  67. Berman, J.J. (Ed.) Chapter 4—Understanding Your Data. In Data Simplification; Morgan Kaufmann: Boston, MA, USA, 2016; pp. 135–187. [Google Scholar]
  68. Flygare, C.; Wallberg, A.; Jonasson, E.; Castellucci, V.; Waters, R. Correlation as a method to assess electricity users’ contributions to grid peak loads: A case study. Energy 2024, 288, 129805. [Google Scholar] [CrossRef]
  69. Kumar, P.K.; Araki, T.; Rajan, J.; Laird, J.R.; Nicolaides, A.; Suri, J.S. State-of-the-art review on automated lumen and adventitial border delineation and its measurements in carotid ultrasound. Comput. Methods Programs Biomed. 2018, 163, 155–168. [Google Scholar] [CrossRef]
Figure 1. Fuel-wise electricity generation in Australia.
Cleantechnol 07 00036 g001
Figure 2. Global EV sales share in 2023.
Cleantechnol 07 00036 g002
Figure 3. Consumers’ energy use preferences for EV charging in Australia.
Cleantechnol 07 00036 g003
Figure 4. Summary of the study methodology.
Cleantechnol 07 00036 g004
Figure 5. System configurations (a) PV/BESS/DG system (b) PV/BESS/ FC/BDG/DG system (c) PV/BESS/WT/FC/BDG/DG system (d) PV/BESS/WT/FC/BDG system.
Cleantechnol 07 00036 g005
Figure 6. Geographical location of Palm Island.
Cleantechnol 07 00036 g006
Figure 7. Hourly load profile during January.
Cleantechnol 07 00036 g007
Figure 8. Average EV load profile.
Cleantechnol 07 00036 g008
Figure 9. Meteorological data for (a) solar, (b) temperature, (c) wind speed.
Cleantechnol 07 00036 g009
Figure 10. Economic comparison of the hybrid systems.
Cleantechnol 07 00036 g010
Figure 11. Cost comparison of the system components in the hybrid systems.
Cleantechnol 07 00036 g011
Figure 12. Load supply operation in PV/BESS/WT/FC/BDG system.
Cleantechnol 07 00036 g012
Figure 13. Annual PV power generation.
Cleantechnol 07 00036 g013
Figure 14. Annual WT power generation.
Cleantechnol 07 00036 g014
Figure 15. Yearly power consumed by the electrolyzer.
Cleantechnol 07 00036 g015
Figure 16. Daily hydrogen production by the electrolyzer.
Cleantechnol 07 00036 g016
Figure 17. Monthly hydrogen consumption by FC in a year.
Cleantechnol 07 00036 g017
Figure 18. Hydrogen fuel-based electricity production by FC.
Cleantechnol 07 00036 g018
Figure 19. Effect of load variation on the optimal system.
Cleantechnol 07 00036 g019
Figure 20. HOMER and Ergon Energy data trends.
Cleantechnol 07 00036 g020
Figure 21. Correlation between the two datasets.
Cleantechnol 07 00036 g021
Figure 22. Similar data patterns offered by HOMER solar data and BOM solar data.
Cleantechnol 07 00036 g022
Figure 23. Correlation between HOMER and BOM solar data.
Cleantechnol 07 00036 g023
Table 1. Summary of different hybrid energy system-based research for Australia.
Major System Components System TypeMajor Financial MetricsMethodsLocations
PV, WT, Hydrogen FC, Battery, and DG [25]Off-gridCOE, NPCHOMERWestern Australia
PV, WT, Battery, and DG [26] COE, NPC, Operating costHOMERWestern, South, South-East and Eastern Australia
PV, WT, Hydrogen FC, Battery, and DG [27]Off-gridCOE, NPC, COHHOMERNorth-East Australia
PV, Battery, and DG [28]Off-grid; Grid-connectedNPCHOMERWestern and Southern Australia, Queensland
PV, Battery [23]Grid-connectedNPC, ROI, IRRHOMERNew South Wales
PV, WT, Battery, and Hydrogen FC [29]Off-gridCOEHOMERSouth Australia
PV/Wind/Battery/Diesel [30]Off-gridCOE, NPCHOMERQueensland
PV/Wind/Battery [31]Grid-connectedCOE, NPCHOMER; Statistical analysisQueensland
Table 2. Outline of the hybrid systems examined in this study.
Nomenclature ConfigurationsDescription
System APV/BESS/DGThis system simulates the existing condition of the island. It comprises a DG and a PV coupled with a BESS to offer only 20% RE integration, as shown in Figure 5a.
System BPV/BESS/FC/BDG/DGIn this system, a hydrogen energy system and a biodiesel generator are added to increase RE share which is shown in Figure 5b.
System CPV/BESS/WT/FC/BDG/DGWind energy is introduced, allowing more RE integration and providing WT as the other major source of energy apart from PV, as presented in Figure 5c.
System DPV/BESS/WT/FC/BDGThis system, presented in Figure 5d, offers all-renewable components, excluding the conventional energy source (DG) to supply clean energy and is the proposed system of this study.
Table 3. Cost summary of the system components.
System Components Capital Cost (AUD) 1Replacement Cost (AUD)O&M Cost (AUD)References
PV930/kW -14/kW/year[50]
WT471,429-5657/year[51]
Fuel cell857/kW714/kW0.01/kW/op. hour[50]
Electrolyzer737/kW371/kW16/kW/year[50]
Hydrogen tank286/kW-14/kW/year[50]
Li-ion Battery78,50078,5001400/year[52]
Biodiesel generator714/kW357/kW0.04/kW/op. hour[19]
Diesel generator314/kW286/kW0.04/kW/op. hour[32]
Converter300/kW300/kW -[53]
1 Some of the cost amounts are mentioned in USD in sources and are converted to AUD, considering 1 AUD = 0.7 USD for this study.
Table 4. Comparative technical analysis of the different hybrid systems.
ParametersSystem ASystem BSystem CSystem D
Excess electricity (kWh/year)174,2502,983,7191,432,5911,563,573
Unmet electric load (%)0000.045
Capacity shortage (%)0000.095
Renewable fraction (%)20.288.895.696.4
Table 5. Comparative economic analysis of the different hybrid systems.
ParametersSystem ASystem BSystem CSystem D
NPC (AUD in millions)27.514.19.799.46
COE (AUD)0.5740.2720.1890.183
Operating cost (AUD in millions)2.270.480.250.24
Initial capital cost (AUD in millions)1.138.426.826.61
Table 6. Comparison of the environmental performance of the hybrid systems.
Emissions (kg/year)System ASystem BSystem CSystem D
Carbon dioxide2,359,99740,80414,8450
Carbon monoxide14,876424220641920
Unburned hydrocarbons64917283.877.7
Particulate matter90.217.58.457.68
Sulfur dioxide577999.936.40
Nitrogen oxides13,975560246154
Table 7. Effect of biodiesel price variation on the optimal system.
Biodiesel Price (AUD/L)NPC (AUD)COE (AUD)BDG Energy Generation (kWh)
1.369.270.179160.401
1.709.460.183160.406
2.049.640.186148.19
Disclaimer/Publisher’s Note: The statements, opinions and data contained in all publications are solely those of the individual author(s) and contributor(s) and not of MDPI and/or the editor(s). MDPI and/or the editor(s) disclaim responsibility for any injury to people or property resulting from any ideas, methods, instructions or products referred to in the content.

