Abstract
This study investigates the size effect on the Seebeck coefficient (SC) in cement composites incorporating silicon carbide (SiC). Two specimen shapes, cubic (50 × 50 × 50 mm3) and beam (40 × 40 × 160 mm3), were analyzed with varying SiC substitution ratios (0%, 50%, and 100%) for fine aggregates. Thermal and electrical conductivities were measured to assess their influence on the SC. The results showed that a higher SiC content increased porosity, which reduced mechanical strength but significantly improved thermal and electrical conductivities. Thermal conductivity increased from 1.88 W/mK (0% substitution) to 11.89 W/mK (100% substitution), while electrical conductivity showed an improvement from 0.0056 S/m to 0.065 S/m. Cubic specimens exhibited higher SC values compared to beam specimens, with a maximum SC of 1374 μV/K at 100% SiC substitution, attributed to shorter thermal diffusion distances. The findings suggest that optimizing member size and SiC content can significantly improve the thermoelectric performance of cement composites, potentially enhancing energy efficiency in construction applications.
1. Introduction
Energy efficiency is the most important issue in the world because of global warming. Every year, humanity is witnessing an abnormal climate risk that becomes more severe [1]. Glacial areas in polar regions have been continuously shrinking every year [2], and the ocean temperature is rising annually as well [3]. This is one of the most urgent issues facing humanity. Many researchers are actively working on ways to reduce carbon emissions or overcome global warming. Among the efforts of overcoming global warming/carbon neutrality, the construction field is working as well. In particular, Lee et al. [4] claimed that the cement industry has a responsibility to reduce carbon emissions. The cement industry has primarily attempted to reduce carbon emissions by minimizing cement usage and incorporating by-products such as slag [5,6], silica fume [7], and fly ash [8]. The use of by-products this field has already been studied for nearly 100 years; therefore, data are already abundant. For this reason, cementitious materials researchers have studied the global climate issue in different ways.
The purpose of the use of cement and cementitious materials is to construct buildings and structures. In other words, cement composite structures are widely used around the world. Cement composite structures inevitably consume energy [9,10,11]. However, due to the poor thermal properties of conventional cement composites, unexpectedly large amounts of energy are consumed to control the air temperature inside the structure. Thus, civil and architectural researchers have tried to enhance the energy efficiency of concrete buildings and structures. The most highlighted sector is the utilization of phase-change materials (PCMs). PCMs undergo phase transitions when they reach their melting/freezing points. During the phase change, the heat flow is captured by the melting/freezing state of PCMs; therefore, the heating and cooling efficiency of concrete buildings and structures is improved [12,13]. There are many studies of using PCMs in cement composites. The most famous methodology is PCM encapsulation. Shi et al. [14] performed an experiment measuring the indoor temperature of concrete mock-up structures incorporated in macro-scale encapsulated PCMs. Nano-scale PCM encapsulation is challenging, while macro-scale encapsulation is relatively easier. However, the most important parts are the kind of PCMs and their thermal properties. For PCMs in real-life temperature ranges, paraffin wax is often used [15,16,17]. Among the various types of paraffin wax with different melting/freezing points, low thermal conductivity (TC) and high latent heat capacity are the most beneficial properties for indoor temperature control in concrete structures. This advantage of using PCMs was confirmed in the study of Shi et al. [14]. In a similar way, Al-Yasiri et al. [18] measured the time lags of PCM macro-capsule-containing concrete blocks. In this study, the time lags were increased by the increment of the PCM-containing ratio in the concrete blocks. The increase in time lags means that the indoor temperature of concrete buildings/structures is absolutely lower than the outside. In addition, it is proof that less electrical energy is needed to maintain a more comfortable internal temperature than using conventional concrete blocks [18]. The encapsulation of PCMs is a useful technique. In addition to encapsulation, there is an impregnation method in the other useful applications of PCMs. Usually, the impregnation method is applied to porous matters like by-product aggregates or lightweight aggregates. For example, Kim et al. [19] impregnated paraffin wax into a slag by-product aggregate that had a porous matrix. The slag aggregate had sufficient strength to be used as an aggregate. In addition, due to the porous property, the impregnation was successfully performed, and the indoor temperature of the concrete mock-up structure with the impregnated energy storage aggregate showed approximately 3 °C reductions compared to the ordinary cement concrete mock-up structure. Similarly, Ates et al. [20] impregnated two kinds of parafols (melting points were 28 °C and 35 °C) as PCMs into cork granules. Ates et al. [20] compared these two kinds of developed organic energy storage aggregates, and it was found that parafol, which has a melting point at 35 °C, showed the best performance regarding energy storage. Likewise, using PCMs can derive improved energy efficiency in concrete structures; however, most cases of using PCMs have a significant drawback. As observed in the introduced cases, the mechanical properties of cement composites significantly deteriorate, making them unsuitable for structural applications. To overcome this critical drawback, there is another energy efficiency improvement effort.
There is a field that is being studied with the aim of direct electric power production in cement composites. The methodology is the utilization of the Seebeck effect (SE). The principle of the SE mechanism is simple: when a member is exposed to a temperature gradient—one side hot and the other cool—electrons inside the member move from the hot side to the cool side. Thermoelectric (TE) power generation is commonly found in automotive exhaust systems [21], spacecraft systems [22], wearable devices [23], and more. Although the principle of the TE mechanism is simple, the efficiency of electrical power generation is high [22,23]. For this reason, systems that are closely related to human life usually adopt the TE method. The TE principle can be applied to cement composites as well. Although the difficulty is high, electrical voltage generation has been confirmed. Ghahari et al. [24] used raw ZnO nano-powders and aluminum-doped ZnO nano-powders. The maximum dosage of these two powders was 1% cement weight. The Seebeck coefficient (SC) measurement results showed that metal oxide powders helped to enhance the SC, and the doped powders showed a higher SC than the specimens with raw ZnO [24]. There are also many studies using metal oxides such as MnO2 [25] and Fe2O3 [26], not only ZnO. Using metal oxides has demonstrated an improvement in the SC, indicating the potential for electrical energy generation from cement composites. In addition, the application of carbon-based materials such as carbon nanotubes (CNTs) should be discussed. This is because carbon-based materials dramatically improve the electrical conductivity (EC) of cement composites. Wei et al. [27] used carbon fibers (CFs) to improve the SC. The CFs were not treated or doped but used as raw fibers. As a result, the maximum value of the SC was 22.07 μV/K with a 1% cement weight dosage [27]. In another example, Wei et al. [28] applied 15% cement weight CNTs, and the results measured at a 55.28 μV/K SC value. Compared to the study of Wei et al. [27], improvement in the SC has been be found. However, this increase in the SC may not be considered a practical improvement given the high material costs and dosage requirements. On the other hand, a 1% doped CNT application showed a meaningful improvement value of 58 μV/K at 28 days of curing [29]. The main issue was the insufficient SC values, except for MnO2 applications, with the biggest challenge being the limitations on the volume fraction of the conductive materials. It is well known that exceeding a 5% volume fraction of graphite brought a dramatic mechanical performance decrease [30]. In addition, CNTs or CFs are normally applied at a less than 2% volume fraction because those are considered fibers [30]. However, one case overcame the volume fraction limits through using conductive materials as fine aggregates [31]. Park et al. [31] used silicon carbide (SiC), and the fine aggregate was substituted by SiC at proportions of 25, 50, 75, and 100%. Typically, the fine aggregate occupies 65 to 70% of the volume fraction in mortar members [32]; therefore, SiC takes at least 65% of the volume fraction when SiC is fully substituted for the fine aggregate in mortar specimens [31]. As a result of the substitution effect, the SC values were 637.5 μV/K at a 25% substitution of SiC and 1374 μV/K at a 100% substitution [31]. With this huge improvement in the SC, energy production using cement composites seems achievable.
Another issue is the variation in specimen sizes across the reviewed studies. Some studies used cubic specimens, while others used beam-shaped specimens, and their dimensions varied significantly. To effectively generate electrical power, it is essential to understand the size effect of the specimens. However, in the field of TE cement composites, it remains unclear whether smaller or larger specimens are more advantageous. Therefore, the size effect should be thoroughly investigated.
In this study, two kinds of specimens of cubic and beam were prepared to investigate the size effect in the SC of cement composites. In addition, the fine aggregate was substituted with SiC at proportions of 0, 50, and 100%, and TE experiments were performed using the cubic and beam specimens to check the exact affection of the member size. Through the SC value, it was determined whether the smaller member size or larger member size was more efficient.
2. Materials and Experimental Programs
2.1. Materials
To produce the specimens, ordinary Portland cement (OPC) meeting the conditions of ASTM C150 [33] was used. This class of cement is used widely and can be found easily in any cement composite studies. Table 1 presents the properties of the OPC. Most TE-related studies also use this type of OPC, and the results have shown that OPC is enough to manifest the TE performance [23,29,31].

Table 1.
Properties of OPC.
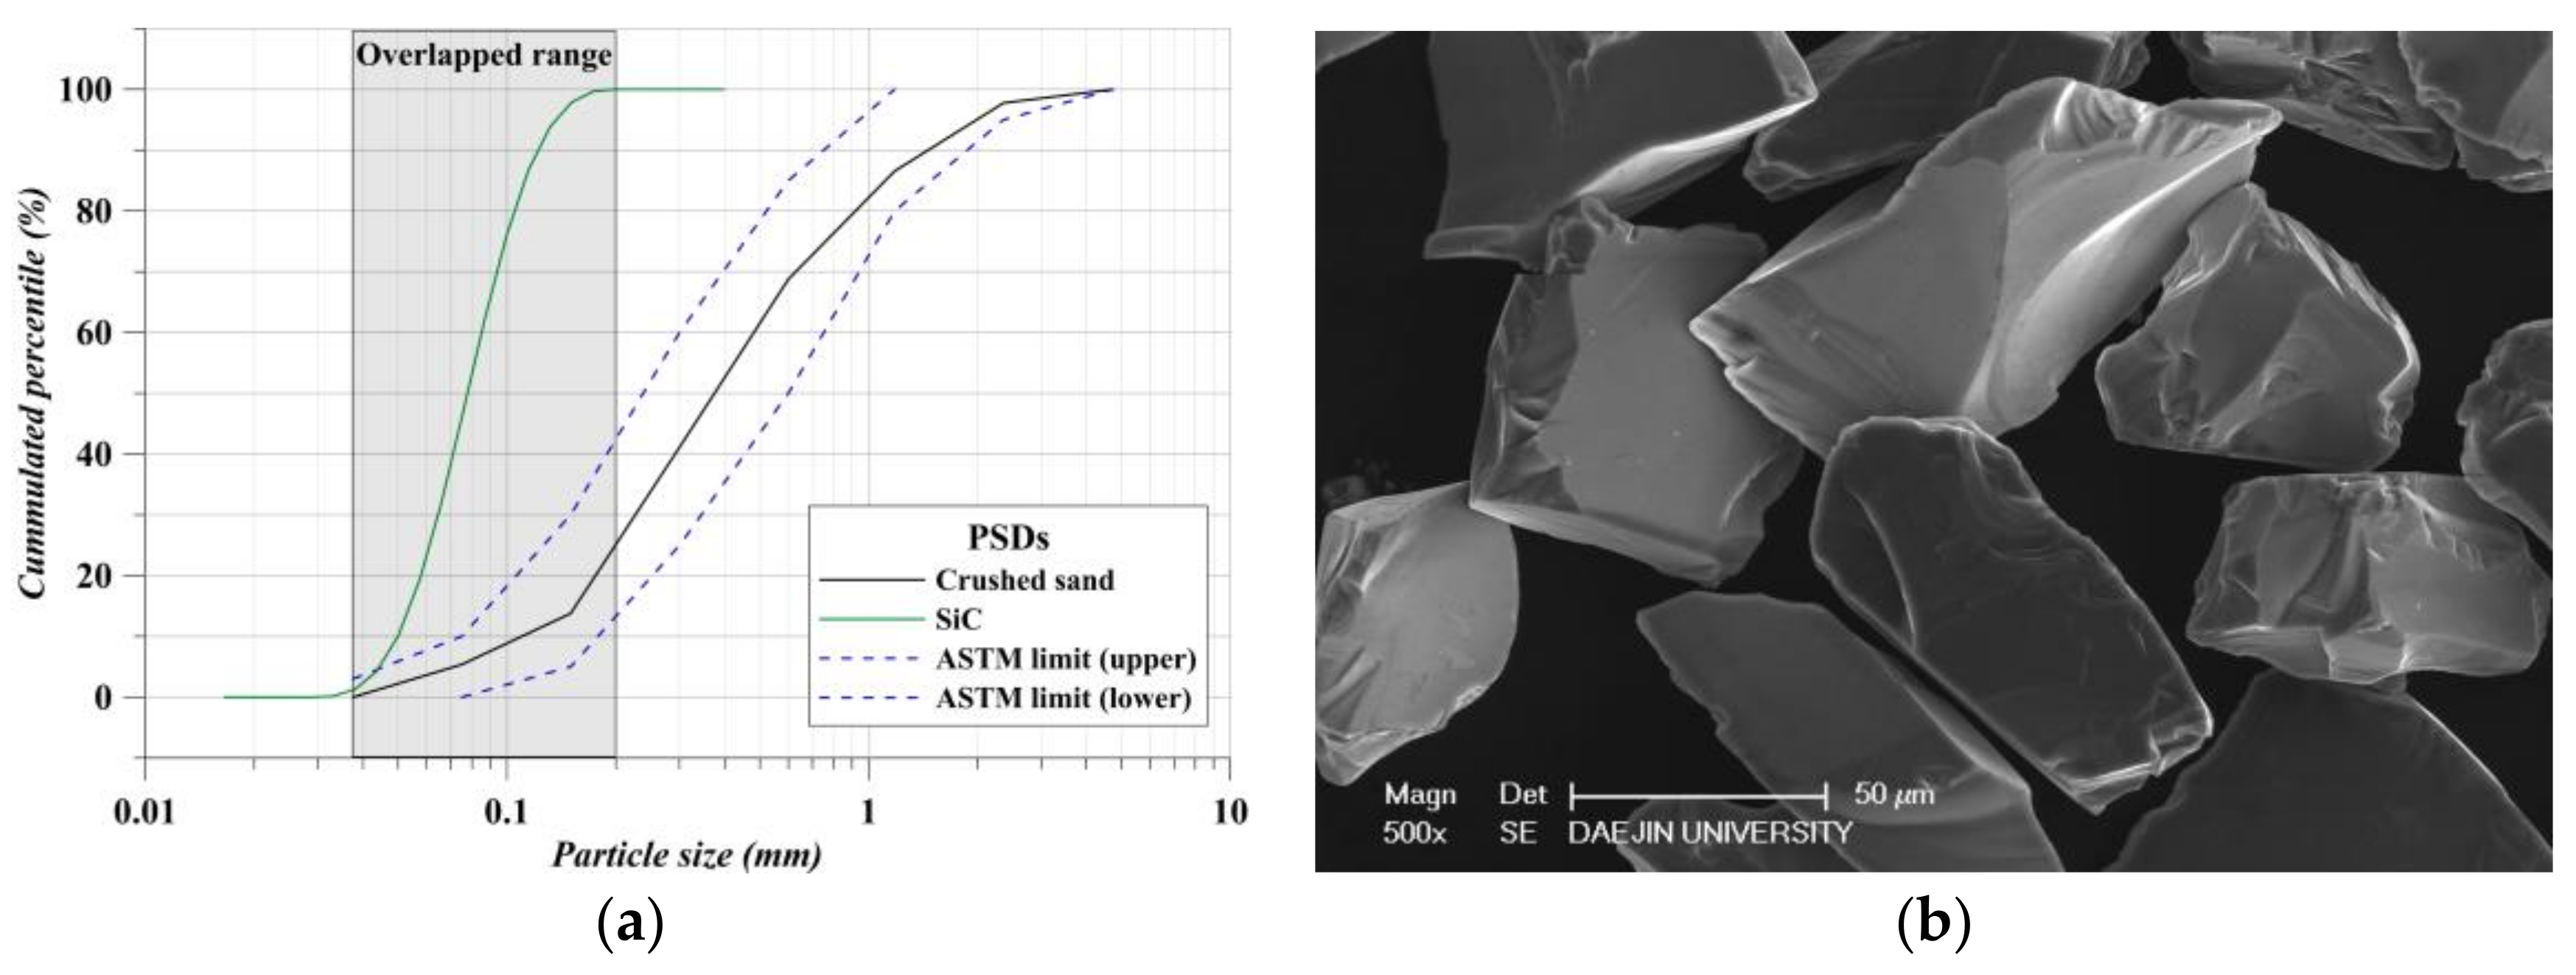
The specimen type of this study was mortar that contained cement, water, and a fine aggregate. The fine aggregate was crushed sand. The maximum size of the fine aggregate was 4.75 mm because the crushed sand was sieved following the standard of ASTM C33/C33M [34]. The fineness modulus of the fine aggregate was 2.61, the density was 2.70 ton/m3, and the water absorption rate was 3.3%. Basically, the water absorption rate was quite high. However, aggregate shortage is a global issue [35]. Thus, the use of crushed sand was an inevitable choice. The particle size distribution (PSD) of the fine aggregate is presented in Figure 1 [32] and the scanning electronic microscopy (SEM) image of the SiC is also included.
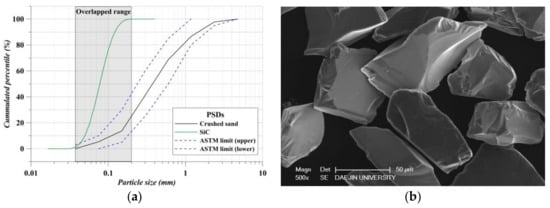
Figure 1.
Properties of aggregates: (a) PSD of aggregates; (b) SEM image of SiC.
As previously mentioned, this study substituted the fine aggregate for SiC. There are many studies that have used SiC as a substitution for a fine aggregate [31,32]. Because SiC has sufficient strength and possible PSD to be used as a fine aggregate, the existing studies used SiC as a fine aggregate. Table 2 includes the properties of SiC [32].
Table 2.
SiC properties.
Additionally, the reason that SiC can be used as a substitution material for fine aggregates is explained in Figure 1. The PSD of SiC was not fully placed in the limits of the ASTM standard of fine aggregates, but there were overlapped particle sizes in the small particle ranges of crushed sand. This trend can be found in the introduced studies; therefore, SiC can be used as a substitutional material for fine aggregates.
2.2. Specimen Preparation
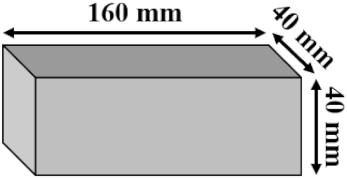
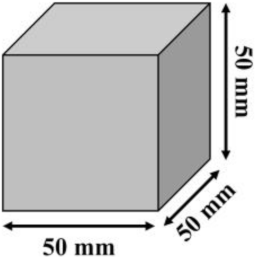
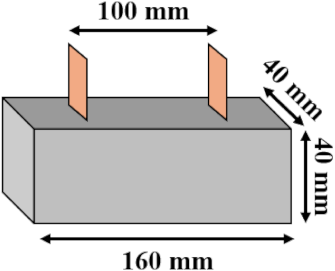
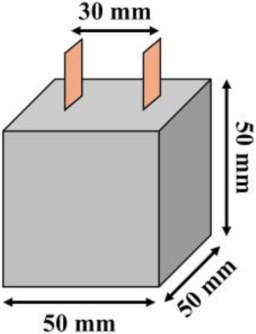
The aim of this study was the investigation of the member size effect in SC values. Thus, two kinds of specimen shapes were adopted—beam shape and cubic shape. The size of the beam specimens was 40 × 40 × 160 mm3 and the size of the cubic specimens was 50 × 50 × 50 mm3. All the specimens were demolded after 1 day of curing. After demolding, the specimens were cured at 20 °C and 60% relative humidity (RH) for 27 days to a total of 28 days. The production of the specimens followed the mixture properties shown in Table 3.
Table 3.
Mixture properties (ratio).
According to the specimen names in the mixture properties, B means beam, C means cubic, and S means SiC. In addition, the numbers such as S0 and S100 indicate the substitution ratios; for example, S50 means that SiC was substituted for the fine aggregate at a 50% ratio. Following Table 3, the specimens were castes, and the details of the specimens are indicated in Table 4.
Table 4.
Details of specimens.
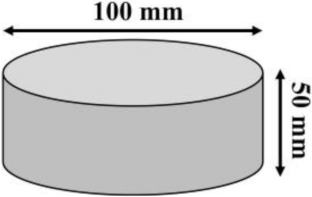
In Table 4, there are two orange-colored parts in each SC specimen. Those are the 30 × 50 × 0.5 mm3 copper plates used to measure the data from the multimeter, and the distance between each of them is indicated in Table 4. In special cases like measuring the thermal conductivity and porosity, the disc shape specimen was adopted. The shape of the disc specimens followed that of prior studies [31,36]. The measurement details are introduced in the following sections.
2.3. Measurement of Thermal Conductivity and Electrical Conductivity
To evaluate the natural thermal and electrical conductivities, all the specimens were fully dried at 80 °C for 72 h. Conductivity properties are the essential factors in SC values. Thermal conductivity (TC) directly influences the TE mechanism. The SC measures the generated voltage by a temperature difference on opposite sides of the specimens. In addition, the TC property is able to indicate the summation of electronic thermal conductivity and phonon thermal conductivity like Equation (1).
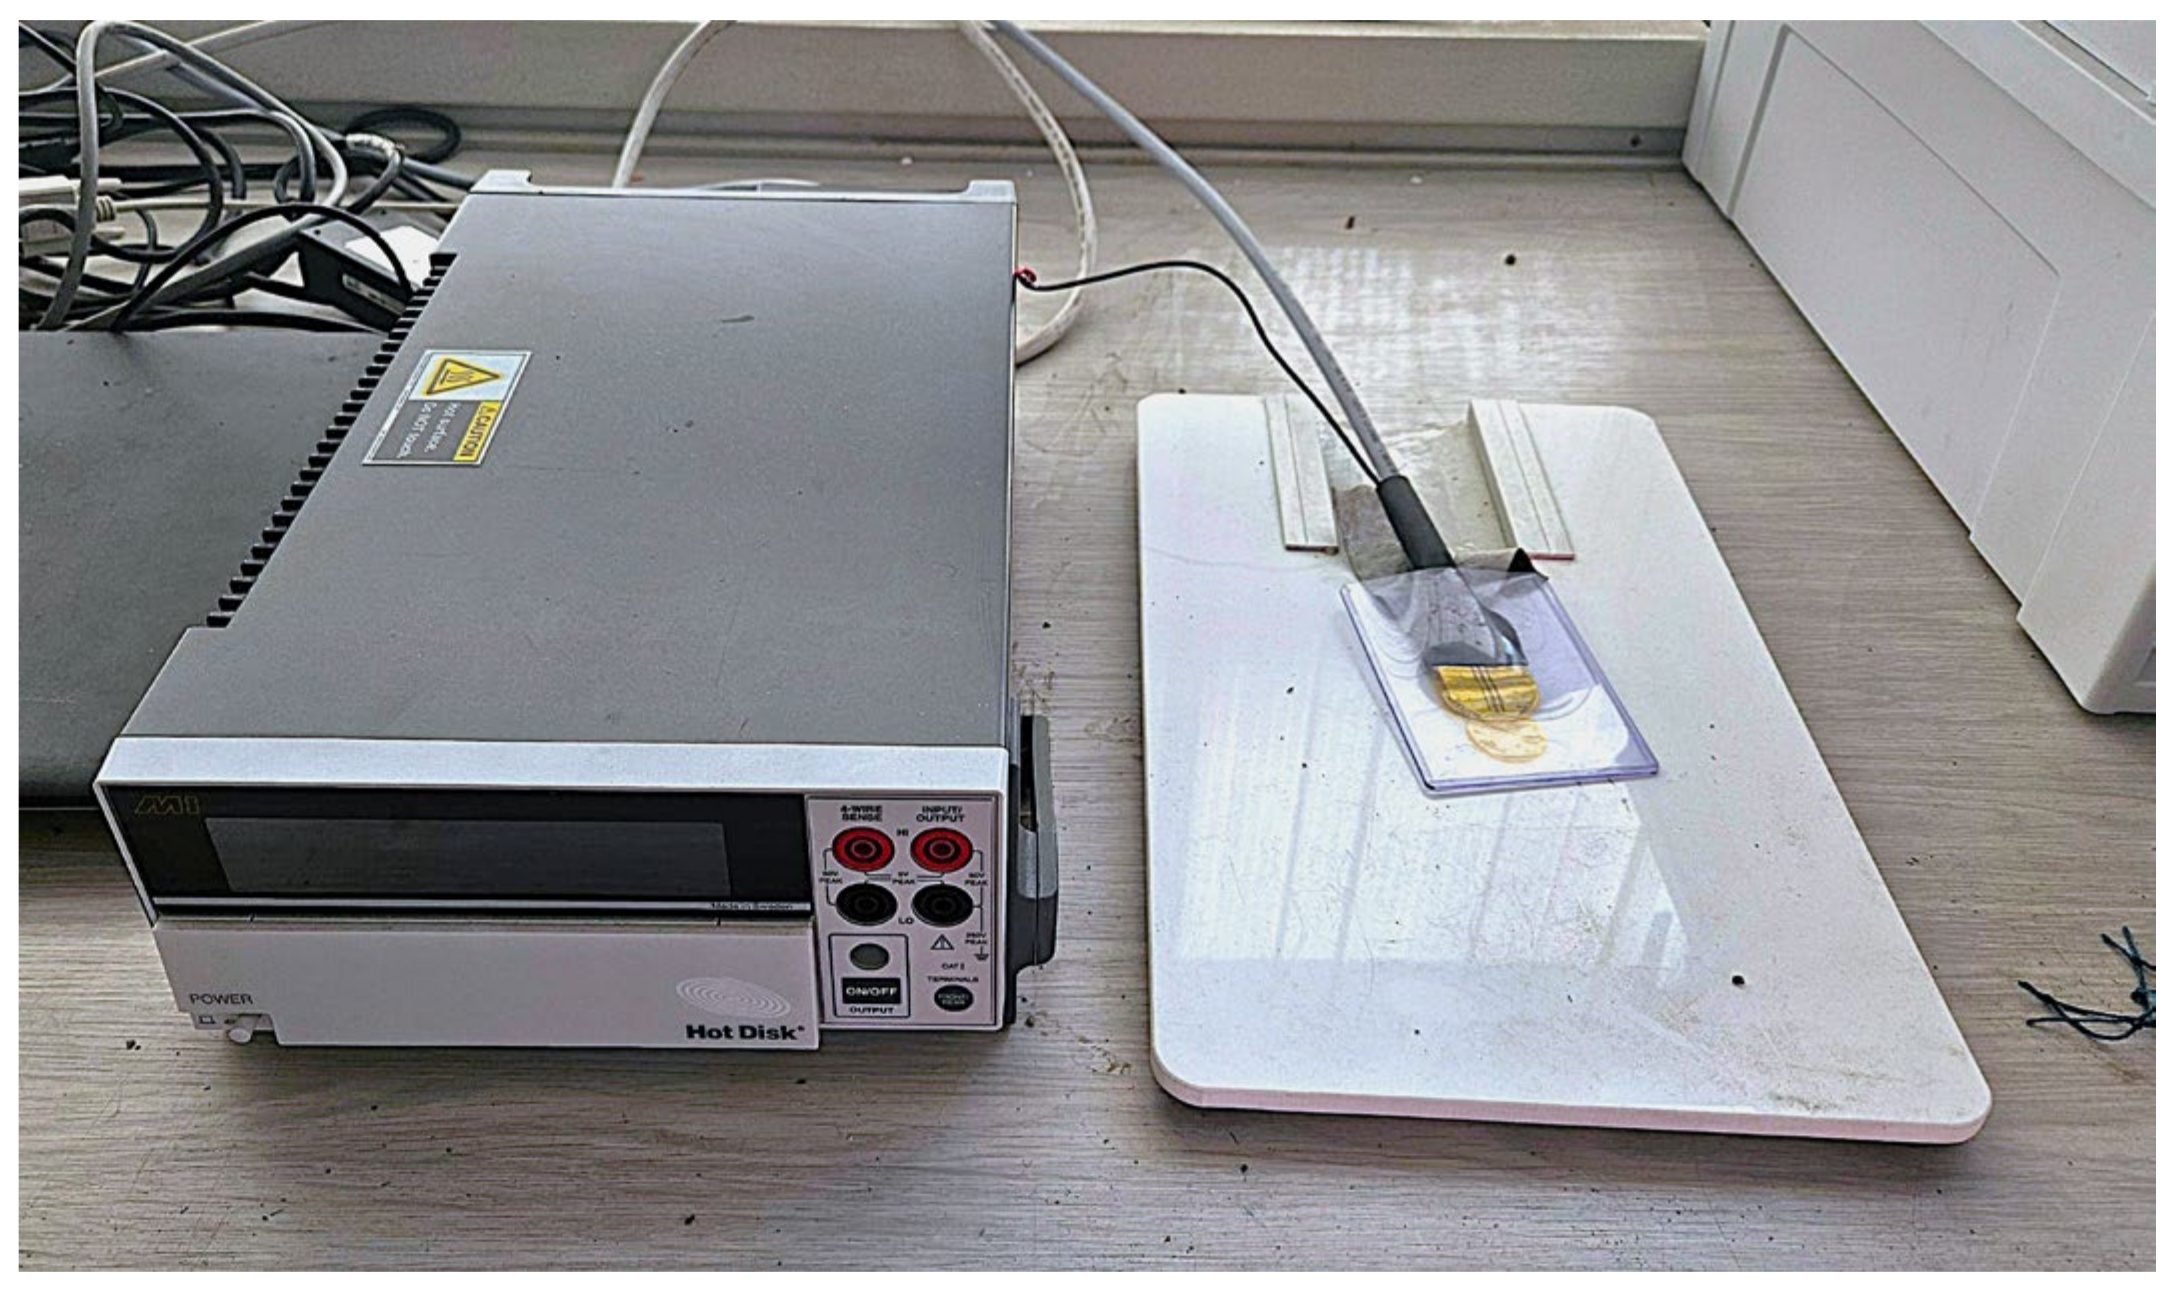
where is the TC (W/mK), is the electronic thermal conductivity (W/mK), and is the phonon thermal conductivity. Phonon means heat transfer by atomic vibration energy, and electronic means heat transfer by electron moving [37]. Hence, TC has a positive relationship with electrical properties according to Equation (1). When the principle and methodologies of this study are successfully developed, this technology can be applied to the Peltier system using cement composites, and one of the important factors is TC. Figure 2 is the testing machine of TC (ISO22007-2 M1, Hot Dist Corporation, Gothenburg, Sweden).
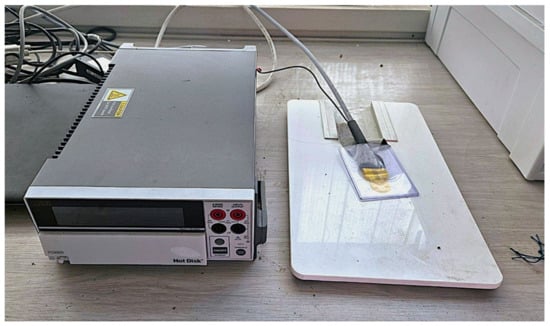
Figure 2.
Thermal conductivity measurement machine.
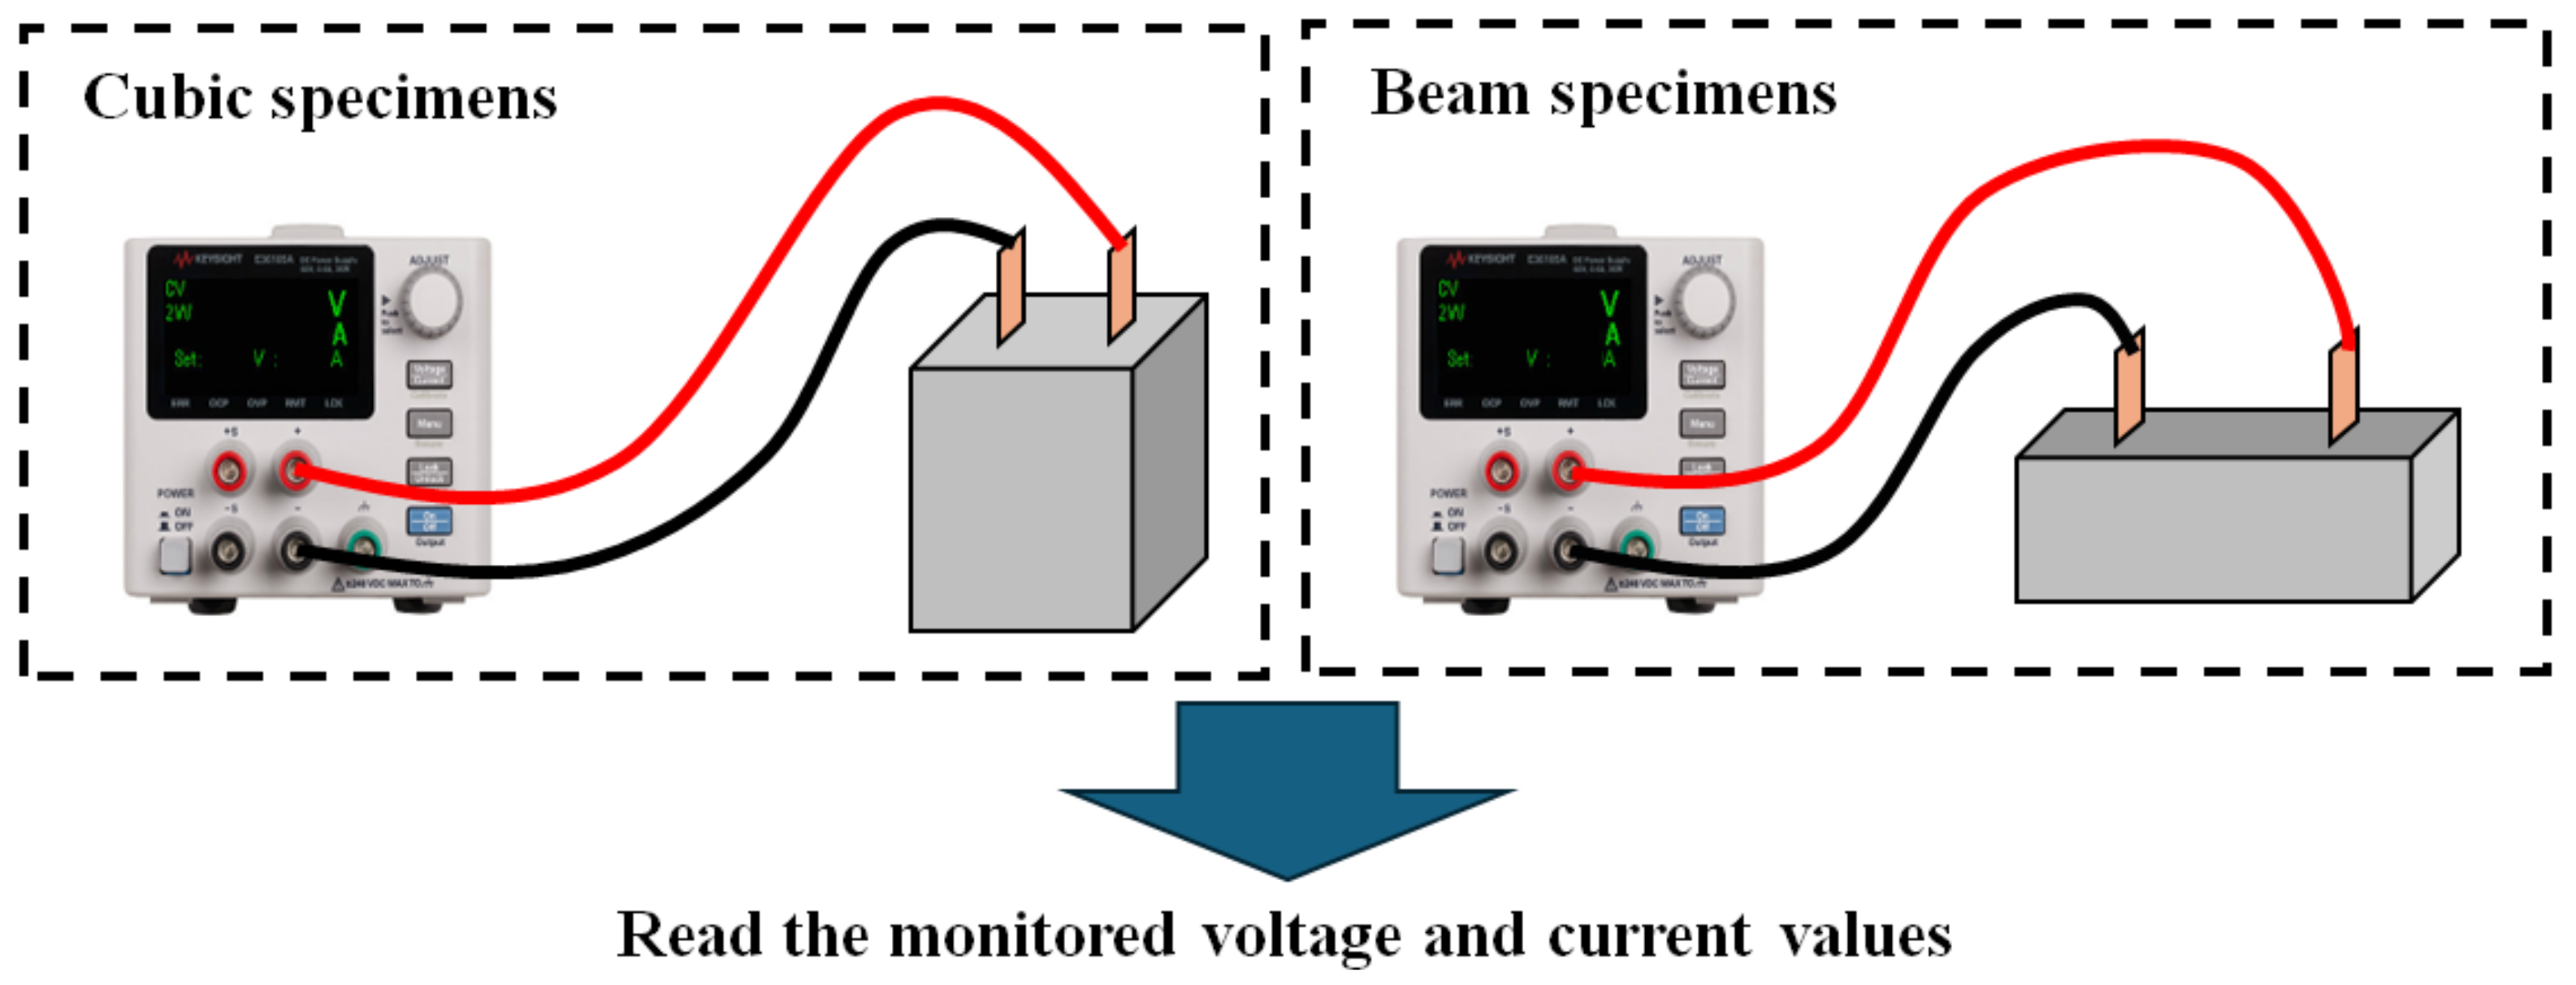
To measure the electrical conductivity (EC), the specimens were connected to a DC supplier like that shown in Figure 3. The voltage and current values were read from the DC supplier, and the EC value was calculated by Equation (2).
where is the electrical conductivity (S/m), represents the distance of electrodes (mm), is the surface area of the electrode (mm2), and represents the electrical resistance of the specimens calculated by Ohm’s law of R = V/I (V is the voltage and I is the current (A)).

Figure 3.
Measurement of the electrical conductivity of the specimens.
2.4. Mechanical Properties
Two factors were measured: one was the compressive strength following ASTM C109 using cubic specimens [38] and one was the flexural strength following ASTM C348 using beam specimens [39]. The mechanical strengths were measured at 3, 7, and 28 curing days, and were measured using 3 specimens. After measurement, all the test values were averaged. For the compressive strength, a 200-ton capacity universal testing machine (Shimadzu, CCM-200A, Shimadzu Corporation, Tokyo, Japan) was used. For the flexural strength, a 25-ton capacity bending machine (Shimadzu, AG-I 250 KN, Shimadzu Corporation, Tokyo, Japan) was used.
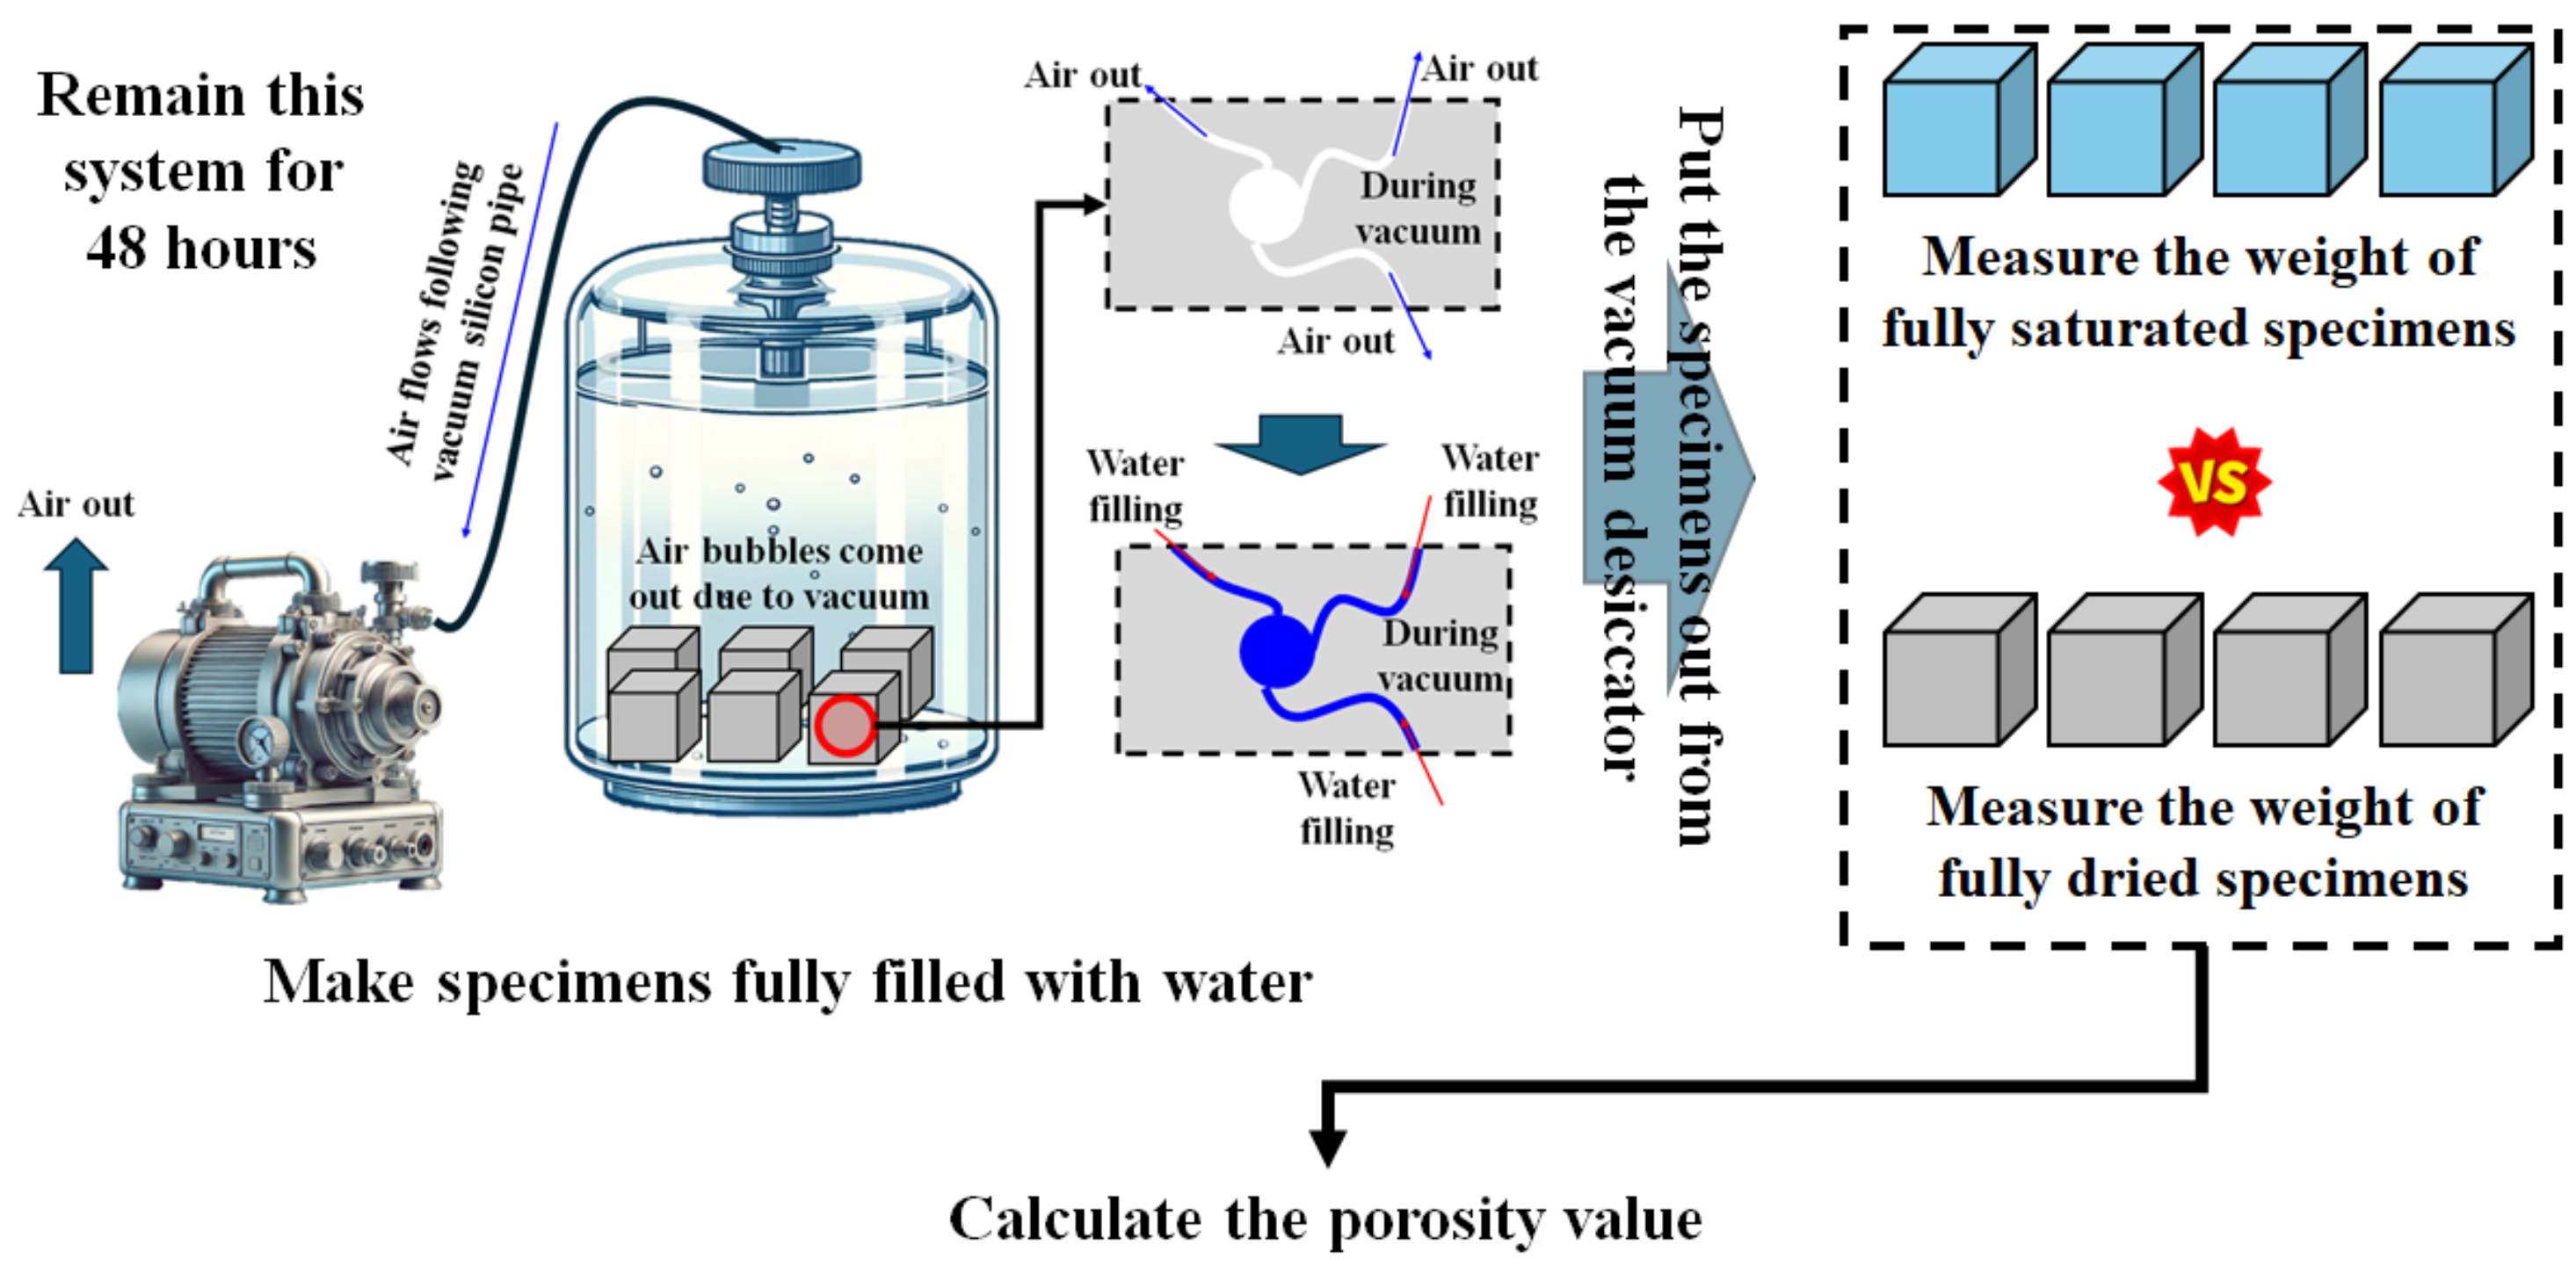
2.5. Porosity
Various methods exist for measuring porosity, including mercury intrusion porosimetry and computed topography. However, obtaining highly detailed quantitative porosity values was not necessary for analyzing the SC effect in the specimens. A specific porosity value was required for each specimen. There are studies that measured the porosity value using a vacuum system [36,40]. The porosity measurement process was similar to the water absorption test; however, the results showed a clear difference between porosity values obtained via the vacuum system and those measured using conventional water absorption methods [36,40]. Under vacuum conditions, water was able to penetrate deep into the cement composites, including extremely narrow pores such as capillary pores. The porosity measurement using a vacuum system is presented in Figure 4.
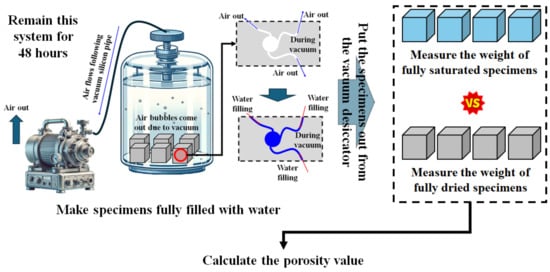
Figure 4.
Scheme of porosity value measurement.
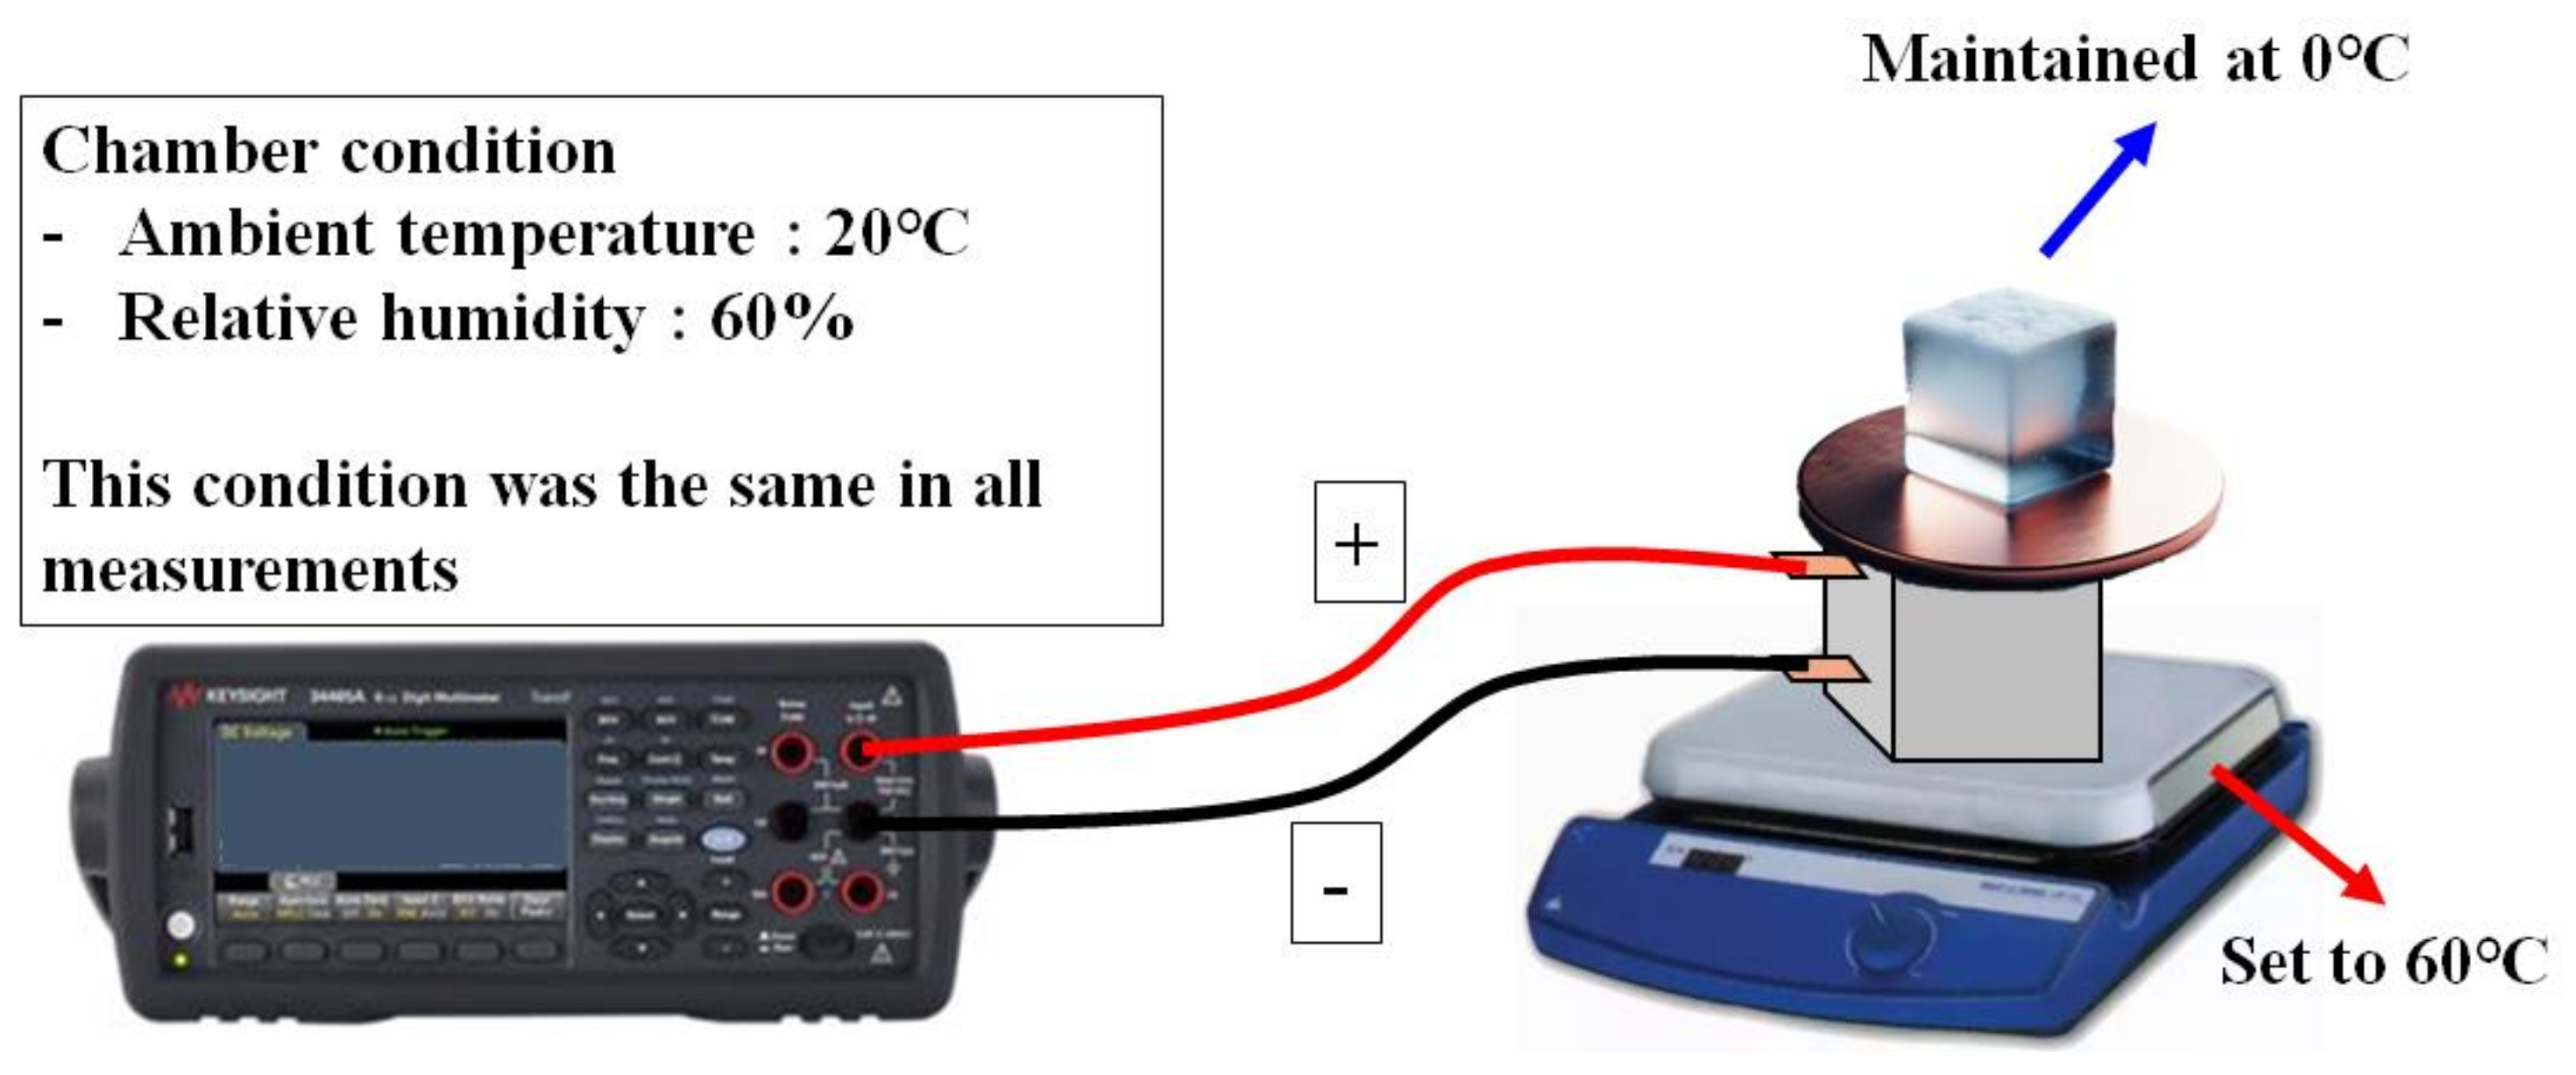
2.6. Thermoelectric Voltage Measurement
To evaluate the TE performance, this study measured the generated voltage by the temperature difference of ΔT (°C) and the SC. The core factor is the voltage value from the specimen because the SC is calculated by the generated voltage following Equation (3).
where is the Seebeck coefficient (μV/K), is the generated voltage value from the specimens (V), and is the temperature difference between the hot plate and the cooling side (K).
Voltage measurements from the specimens were conducted using a multimeter (Keysight 34465A, Maros Corporation, Seoul, Republic of Korea). Data were logged every second, and voltage measurements continued until the voltage reached its peak value. Measurement was terminated at a maximum of 15,000 s to prevent too much data logging. However, when the measurement of the descending range after the maximum peak voltage was measured before 15,000 s, all the data were used. For example, if one sample measurement was terminated at 11,500 s, all data in 11,500 s were used. All the measurements were performed in a warm, humid chamber to maintain the ambient condition, and the ambient conditions were set to 20 °C chamber room temperature and 60% relative humidity. Figure 5 is the scheme of the voltage measurement, and the specimens were fully dried at 80 °C for 72 h. To strictly maintain the temperature difference, the ice on the copper plate regularly changed when the body of ice was changed to water.

Figure 5.
Scheme of TE measurement.
3. Results and Discussion
3.1. Porosity Results
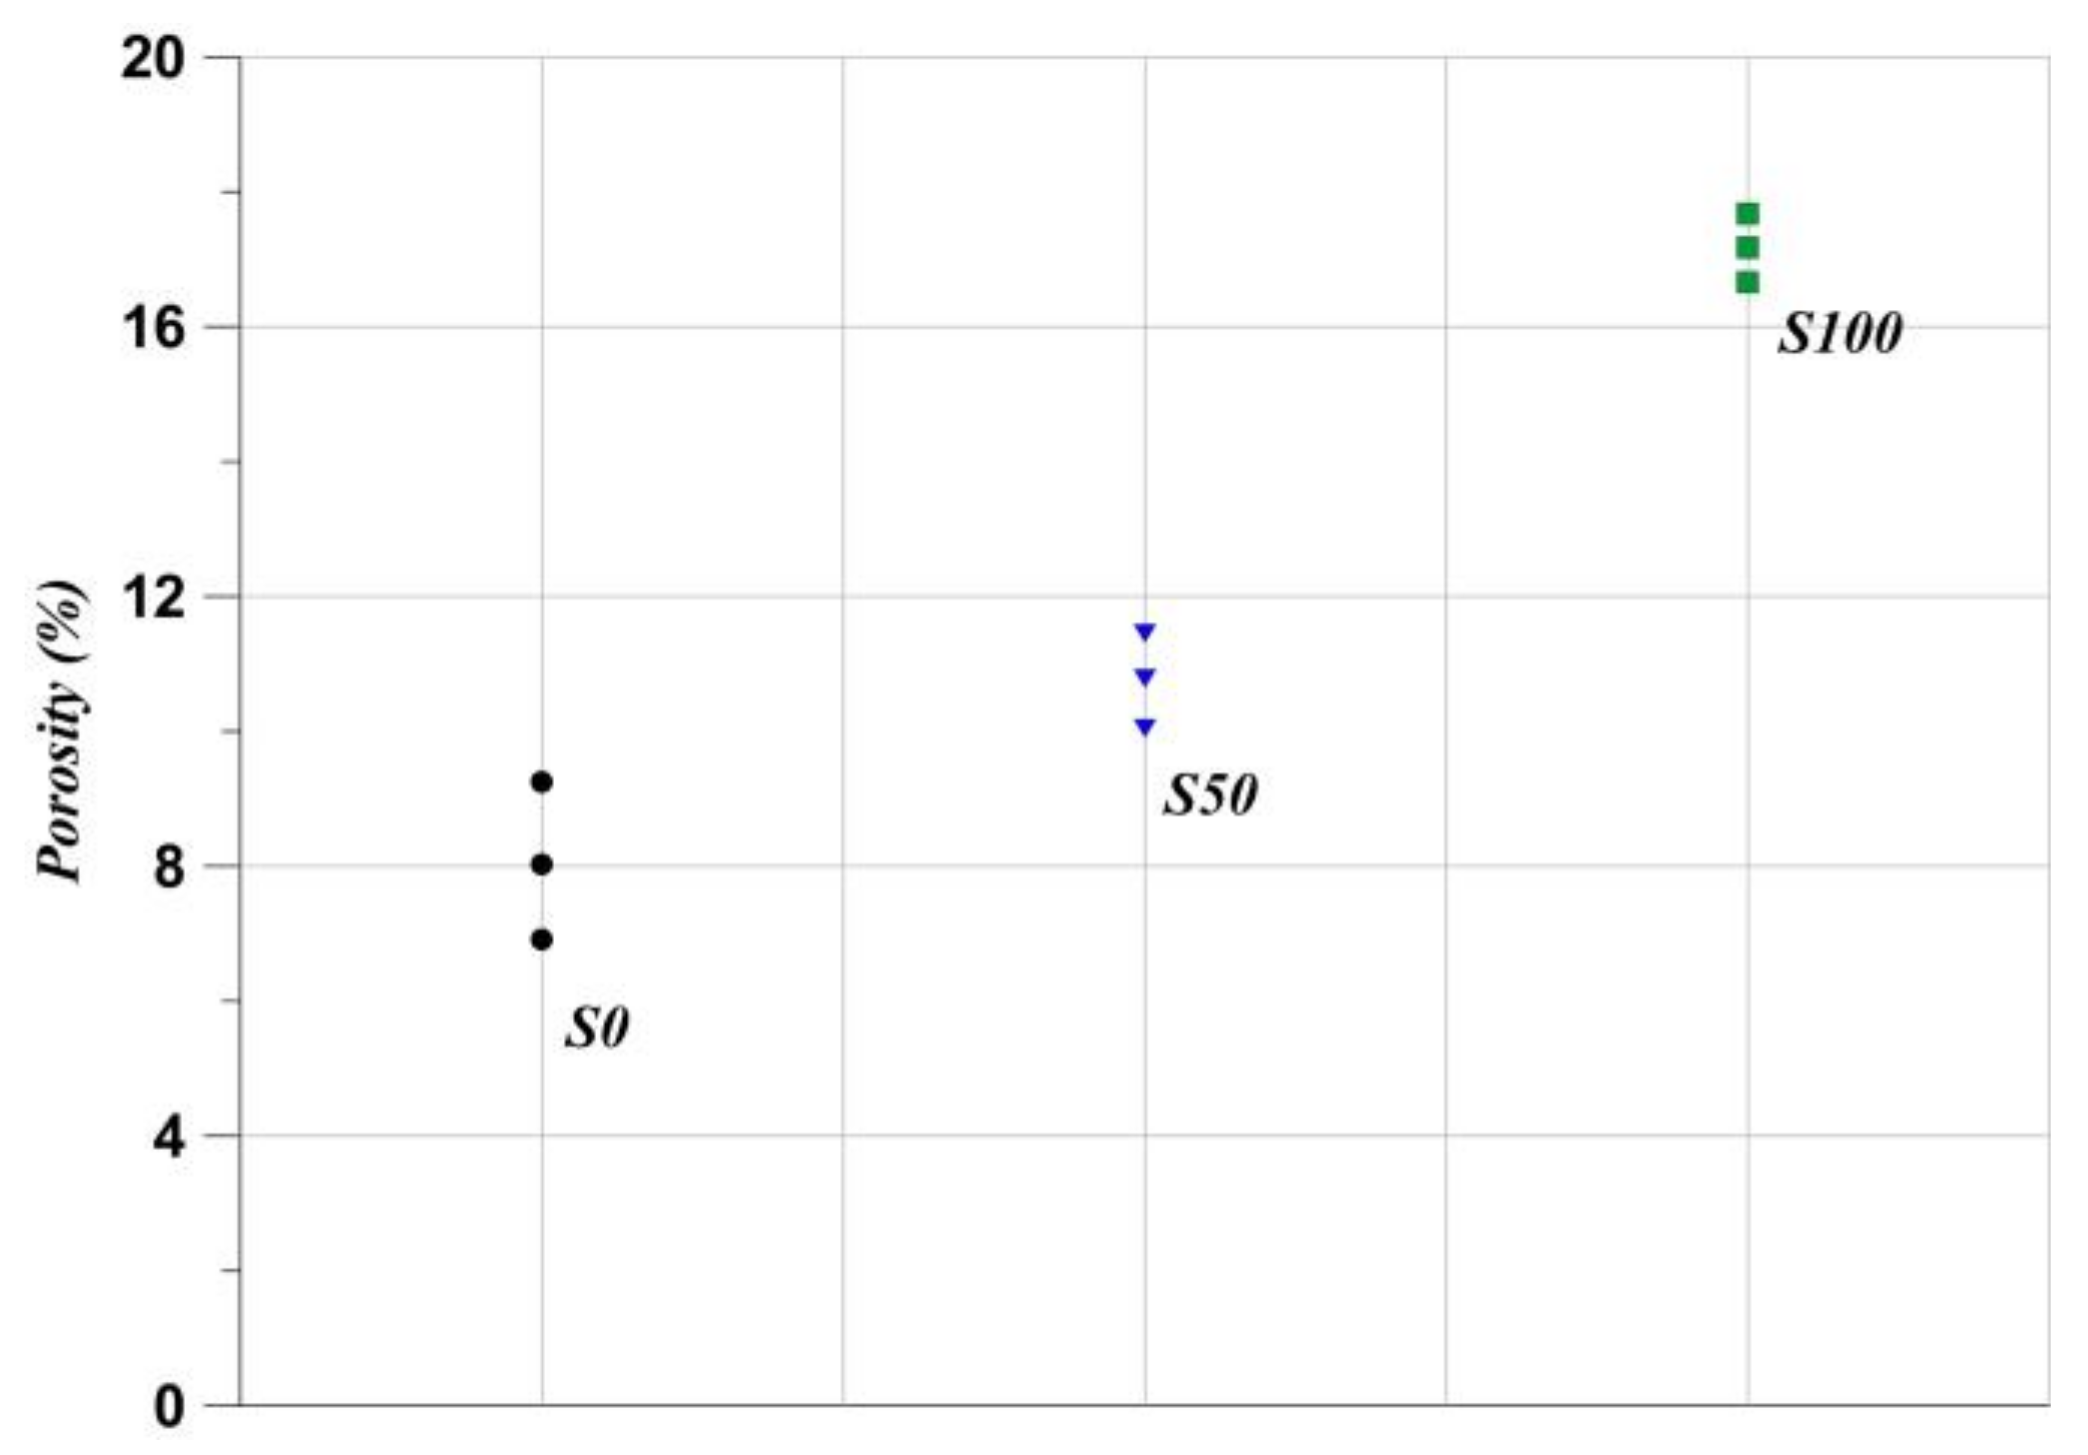
Figure 6 presents the porosity trend according to the SiC substitution ratio. The results show that the S0 specimens appeared in the lowest ranges of the porosity ratio. In addition, the porosity was higher when the substitution ratio was increased. This is because the PSD is disturbed by the substitution ratio [32], and this trend could be found in prior studies [31,36]. Basically, porosity affects TC [32,36] and EC [31,41]. Although conductive materials occupy a high volume fraction, the increase in TC and EC can be limited by porosity. The PSD disturbance is the main reason for the increase in the porosity value [36], as many studies have already demonstrated that a specific reasonable application ratio of fine materials decreased the porosity value [42,43]. Due to the particle size of SiC, the filler effect strongly appears in the matrix of cement composites [44,45,46]. However, using a fine aggregate substitution of SiC higher than 50% disturbs the ideal PSD, as shown in Figure 1a; therefore, S50 and S100 showed larger porosity than S0. The effect of porosity could be found in the mechanical properties.
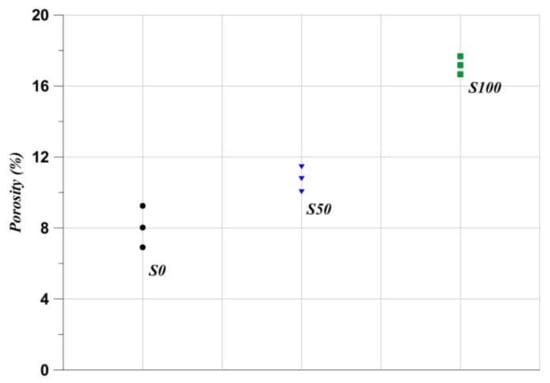
Figure 6.
Porosity results.
3.2. Mechanical Properties Results
Figure 7 represents the compressive strength and flexural strength of the specimens. Both compressive and flexural strength followed the porosity trend, as it is well known that higher porosity reduces strength at the same water–cement ratio [47]. Therefore, the main factor of the decrease in strength of this study could be considered to be the porosity, as shown in Figure 6. Factors affecting strength are determined not only by porosity but also by complex factors such as the materials used and environmental conditions [48]. The environmental condition was the same; therefore, the strength properties were affected by the materials used. The 50% substitution of SiC showed a 10% decrease in compressive strength. This can be analyzed as a result of using the conductive material itself above a certain threshold, although there was also a part due to the PSD disturbance and porosity, as mentioned before [47,49,50]. Similarly, Woo et al. [32] substituted SiC at 30, 50, 70, and 100% for a fine aggregate. The mechanical strength showed that the phenomenon of strength decreased from the 50% substitution, which was the same as in this study. In addition, Park et al. [31] showed similar results at the same substitution ratio. In addition, a significant strength decrease could be observed at 100% substitution, and this trend was also found in prior studies [31,32].
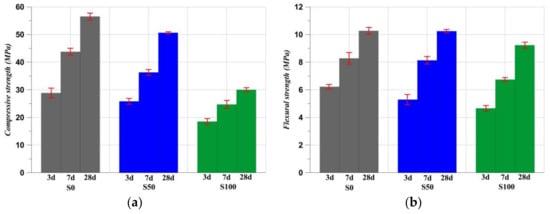
Figure 7.
Mechanical strength results: (a) compressive strength; (b) flexural strength.
Regarding flexural strength, S50 showed almost similar strength to S0. According to the study of Woo et al. [32], the flexural strength of the 50% substituted specimen was higher than that of the non-substituted specimen, despite its lower compressive strength compared to the 0% specimen. In contrast, the study of Park et al. [31] showed the same tendency in flexural strength between the same substitution ratio specimens. In fact, cement composites are a kind of brittle material; therefore, there are several variations in flexural strength. Considering representative studies, these strength results are in the acceptable range.
3.3. Thermal and Electrical Conductivity Results
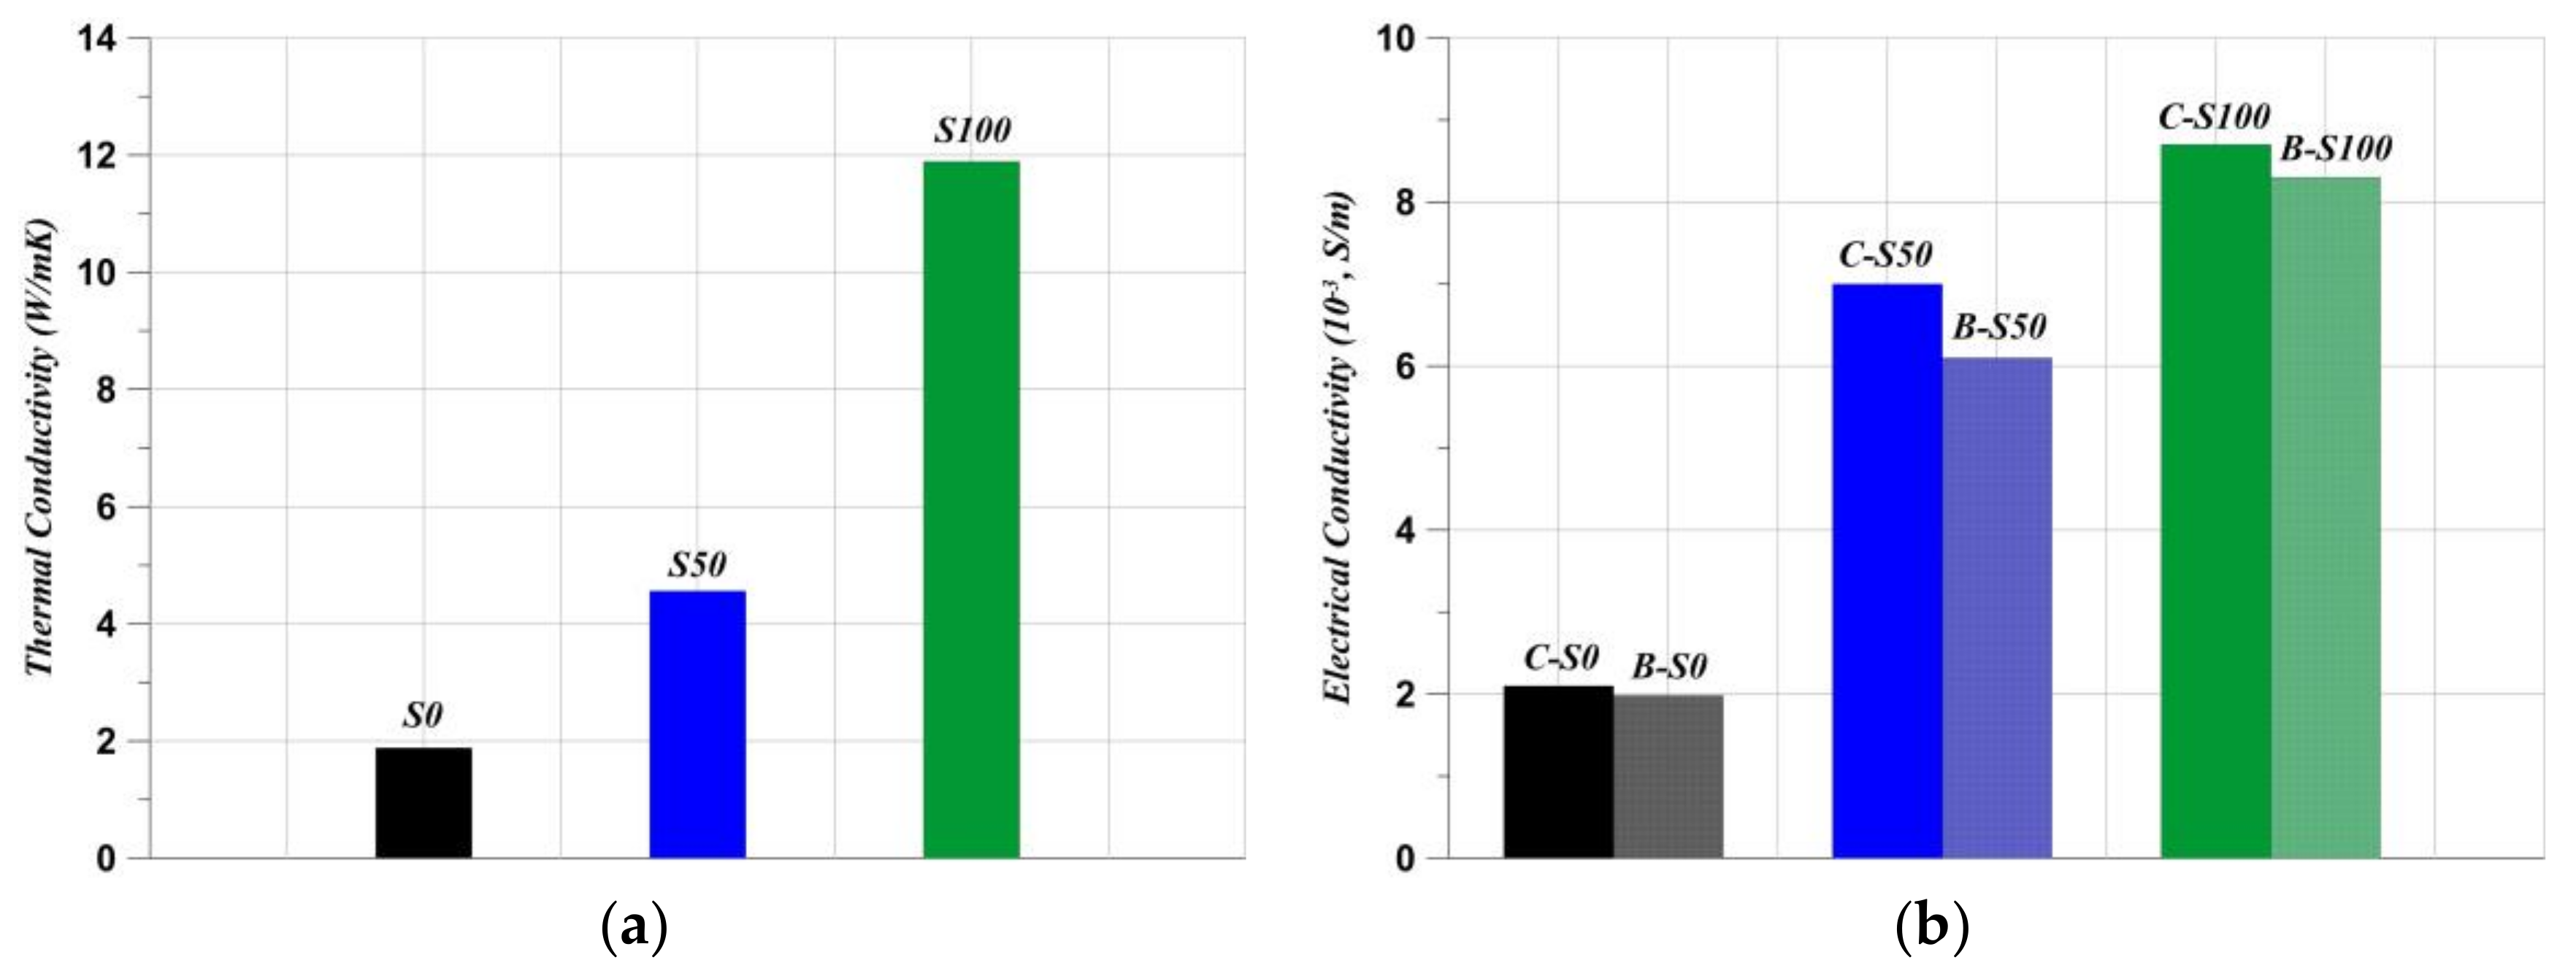
Despite its poor mechanical strength at 100% substitution, the S100 series was investigated due to its thermal and electrical conductivity properties. Figure 8 presents the results of TC and EC. According to Figure 8a, S0 was 1.88 W/mK, S50 was 4.56 W/mK, and S100 was 11.89 W/mK. S100 shows approximately 6.32 times higher TC than S0. The results of Figure 8a were due to the sufficient thermal properties of SiC and were considered to be the maximum value that could be obtained as the volume fraction of SiC increased [44,51,52]. When the conductive material has a higher TC value than SiC itself, the maximum TC threshold will be higher than this study. However, with a value of only 25.5 W/mK TC of SiC itself, the ranges of the maximum TC in the mortar state were 10 to 12 W/mK [36]. On the other hand, the EC values showed a different trend. Compared to the trends of TC and EC of S50 and S100, a large difference in TC could be confirmed. In short, the increment ratio in TC between S50 and S100 was 2.61, but the increment ratio in EC was smaller than TC (cubic case, 1.25; beam case, 1.38). However, in the case of the EC difference of S50 and S100, it was not a large difference compared to the TC trend. In this study, the SC was simply expressed; however, the SC shows a complex relational formula when considered in terms of electrical material characteristics. In practice, the concentration of charge, the amount of charge per carrier, and so on are considered, and SiC exhibits interesting properties. Practically, the SC value shows when the charge carrier property is strong conventionally [37], and these cases were related to the use of carbon materials like CNTs [28,29]. Oppositely, the cases of metal oxide show a high SC value with a low EC value [24,26]. However, SiC has an intermediate property value in these introduced cases of carbon materials and metal oxides [37]. Thus, SiC is beneficial in improving both TC and EC. In particular, the effect of improvement was the best in EC. Due to this reason, the difference between S50 and S100 was not large, as shown in Figure 8b. Another finding regarding EC was that the cubic specimens showed higher EC values than the beam specimens. The results of Figure 8b could be predicted considering Ohm’s law. In addition, Figure 8b suggests that the cubic specimens would show a higher SC value than beam specimens indirectly.
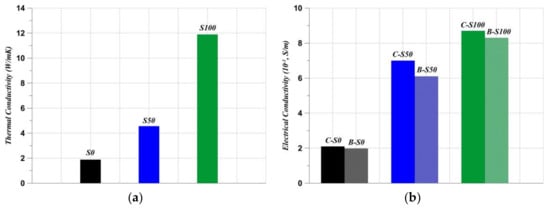
Figure 8.
Conductivity measurement results: (a) thermal conductivity; (b) electrical conductivity.
3.4. Generated Voltages and Seebeck Coefficient Results
Through this TE experiment, the size effect could be confirmed clearly. Figure 9 indicates the results of the TE experiment. According to Figure 9a, the differences in the sizes of the specimens clearly appeared. This is related to the distance of the thermal energies of cold and hot sides. The cubic specimens showed a relatively short thermal distance between the copper plates: the interval of the beam specimen was 100 mm to each copper plate, and the cubic specimen was 30 mm. Fast thermal energies meeting resulted in a rapid increment of thermally generated voltages in C-S50 and C-S100. Compared to the B-S series and C-S series, the beam specimens showed a less sharp gradient in the voltage generation. This phenomenon can be found in prior studies. Wei et al. [53] used the same size of beam specimen as that used in this study, and a slow and gentle increase in the voltage generation was observed. This phenomenon was exactly the same as the trend of the B-S series specimens. On the other hand, Ail et al. [54] used a 15 mm polymer beam specimen, which is a 10 times shorter specimen than that in the study of Wei et al. [53], and a sharp and fast voltage generation could be confirmed. Likewise, the short anode distance made the voltage generate faster and at a higher value. However, a potential drawback was observed. Rapid voltage generation and higher values may enhance the SC, as shown in Figure 9b. However, the maintained duration of the C-S series was shorter than the B-S series. Still, it is not known if the sharp decrease in voltage is negative or not because this system should be expanded in Peltier systems. After applying it in Peltier systems, only a higher SC will be beneficial or it should not be investigated. This study can conclude one thing clearly: the short thermal distance reached resulted in a higher SC value and a higher voltage than the beam specimens.
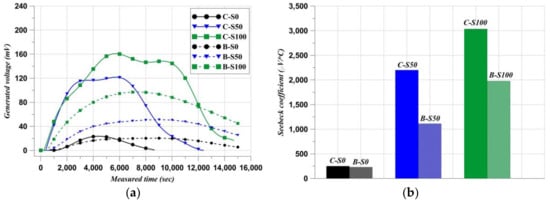
Figure 9.
Thermoelectric results: (a) generated voltages; (b) calculated Seebeck coefficient.
4. Conclusions
This study investigated the effect of member size on SC values through a TE experiment. There was one thing to be studied: whether the higher voltage and rapid slope in the TE experiment would be beneficial or not. This part was discovered while performing this study and is left as an area to be studied in the next step. In addition to the additional findings, meaningful results were found through the experimental results of this study. Therefore, this study can be concluded as follows:
- (1)
- The porosity increased as the substitution ratio of SiC increased. As a result, a high porosity led to a decrease in strength of the specimens. In particular, a significant strength decrease was confirmed in the S100 specimen. In other studies, severe strength decreases such as the decrease observed for S100 were concluded as unusable. However, in this study, it is concluded that S100 needs to be studied further when considering meaningful SC values and high voltage generation.
- (2)
- In the case of TC and EC, the porosity was almost overcome. Due to the beneficial thermal–electrical properties of SiC, the S50 and S100 specimens showed higher conductive values than the S0 specimen. The aggregate substitution of SiC exceeded the limit of the volume fraction; eventually, results showed meaningful values in this study.
- (3)
- Through this TE experiment, the size effect was clearly confirmed, as shown in Figure 9. Specimen size differences significantly affected the thermal energy distances between the cold and hot sides, with the cubic specimens showing rapid voltage increments due to shorter copper plate distances. The beam specimens exhibited a less sharp voltage generation gradient. Shorter specimens showed faster voltage generation, resulting in higher and quicker voltage outputs. However, rapid voltage generation in the C-S series led to a shorter voltage maintenance duration compared to the B-S series. This study concludes that shorter thermal distances result in higher SC values and voltages.
- (4)
- It could be concluded that the energy-harvesting efficiency was higher in the small-dimension specimens than in the large-dimension specimens. In particular, the short distance between the hot and cool sides is the most important factor.
- (5)
- Considering the significantly enhanced thermoelectric properties achieved by optimizing specimen size and SiC substitution, the resulting improvement in SC indicates a direct potential for energy harvesting from temperature gradients in building structures. Practically, applying this technology in renewable energy systems, such as integrating it into thermoelectric-based passive heating and cooling systems, could lead to measurable reductions in building energy consumption. Thus, the demonstrated improvement in thermoelectric efficiency is expected to contribute notably to renewable energy system advancements by enabling more sustainable and energy-efficient built environments.
Author Contributions
B.-H.W.: conceptualization, methodology, funding acquisition, writing—original draft preparation; K.-T.P.: investigation, validation, methodology; K.-S.Y.: formal analysis, resources, visualization; J.-S.K.: supervision, writing—review and editing. All authors have read and agreed to the published version of the manuscript.
Funding
This research was supported by the Basic Science Research Program through the National Research Foundation of Korea (NRF) funded by the Ministry of Education (Grant No. RS-2023-00241417).
Institutional Review Board Statement
Not applicable.
Informed Consent Statement
Not applicable.
Data Availability Statement
The dataset will be made available on request to the authors.
Conflicts of Interest
The authors declare no conflicts of interest.
References
- Forster, P.M.; Smith, C.; Walsh, T.; Lamb, W.F.; Lamboll, R.; Hall, B.; Hauser, M.; Ribes, A.; Rosen, D.; Gillett, N.P.; et al. Indicators of Global Climate Change 2023: Annual Update of Key Indicators of the State of the Climate System and Human Influence. Earth Syst. Sci. Data 2024, 16, 2625–2658. [Google Scholar] [CrossRef]
- Cervelli, A.; Rabaglia, S.; Sioli, M. A New Detector for Glaciers Melting Monitoring through Muon Tomography. Nucl. Instrum. Methods Phys. Res. A 2024, 1064, 169305. [Google Scholar] [CrossRef]
- Cheng, L.; Abraham, J.; Trenberth, K.E.; Boyer, T.; Mann, M.E.; Zhu, J.; Wang, F.; Yu, F.; Locarnini, R.; Fasullo, J.; et al. New Record Ocean Temperatures and Related Climate Indicators in 2023. Adv. Atmos. Sci. 2024, 41, 1068–1082. [Google Scholar] [CrossRef]
- Lee, J.B.; Kim, J.H.; Min, B.G.; Woo, B.H. Performance Assessment of Carbon Dioxide Sequestration in Cement Composites with a Granulation Technique. Materials 2024, 17, 53. [Google Scholar] [CrossRef]
- Eloneva, S.; Teir, S.; Salminen, J.; Fogelholm, C.J.; Zevenhoven, R. Fixation of CO2 by Carbonating Calcium Derived from Blast Furnace Slag. Energy 2008, 33, 1461–1467. [Google Scholar] [CrossRef]
- Song, K.I.; Song, J.K.; Lee, B.Y.; Yang, K.H. Carbonation Characteristics of Alkali-Activated Blast-Furnace Slag Mortar. Adv. Mater. Sci. Eng. 2014, 2014, 326458. [Google Scholar] [CrossRef]
- Park, S.; Yu, J.; Oh, J.E.; Pyo, S. Effect of Silica Fume on the Volume Expansion of Metakaolin-Based Geopolymer Considering the Silicon-to-Aluminum Molar Ratio. Int. J. Concr. Struct. Mater. 2022, 16, 20. [Google Scholar] [CrossRef]
- Nayak, D.K.; Abhilash, P.P.; Singh, R.; Kumar, R.; Kumar, V. Fly Ash for Sustainable Construction: A Review of Fly Ash Concrete and Its Beneficial Use Case Studies. Clean. Mater. 2022, 6, 100143. [Google Scholar] [CrossRef]
- Menassa, C.C.; Kamat, V.R.; Lee, S.; Azar, E.; Feng, C.; Anderson, K. Conceptual Framework to Optimize Building Energy Consumption by Coupling Distributed Energy Simulation and Occupancy Models. J. Comput. Civ. Eng. 2014, 28, 50–62. [Google Scholar] [CrossRef]
- Kim, J.; Naganathan, H.; Moon, S.-Y.; Chong, W.K.O.; Ariaratnam, S.T. Applications of Clustering and Isolation Forest Techniques in Real-Time Building Energy-Consumption Data: Application to LEED Certified Buildings. J. Energy Eng. 2017, 143, 04017052. [Google Scholar] [CrossRef]
- Weigel, B.A. Estimation of Potential Transportation and Building Energy Performance of Commercial Office Site Alternatives. J. Urban Plan. Dev. 2015, 141, 04014016. [Google Scholar] [CrossRef]
- Li, Q.; Ju, Z.; Wang, Z.; Ma, L.; Jiang, W.; Li, D.; Jia, J. Thermal Performance and Economy of PCM Foamed Cement Walls for Buildings in Different Climate Zones. Energy Build. 2022, 277, 112470. [Google Scholar] [CrossRef]
- Abuelnuor, A.A.A.; Omara, A.A.M.; Saqr, K.M.; Elhag, I.H.I. Improving Indoor Thermal Comfort by Using Phase Change Materials: A Review. Int. J. Energy Res. 2018, 42, 2084–2103. [Google Scholar] [CrossRef]
- Shi, X.; Memon, S.A.; Tang, W.; Cui, H.; Xing, F. Experimental Assessment of Position of Macro Encapsulated Phase Change Material in Concrete Walls on Indoor Temperatures and Humidity Levels. Energy Build. 2014, 71, 80–87. [Google Scholar] [CrossRef]
- Frąc, M.; Pichór, W.; Szołdra, P.; Szudek, W. Cement Composites with Expanded Graphite/Paraffin as Storage Heater. Constr. Build. Mater. 2021, 275, 122126. [Google Scholar] [CrossRef]
- Almousa, N.H.; Alotaibi, M.R.; Alsohybani, M.; Radziszewski, D.; AlNoman, S.M.; Alotaibi, B.M.; Khayyat, M.M. Paraffin Wax [As a Phase Changing Material (PCM)] Based Composites Containing Multi-Walled Carbon Nanotubes for Thermal Energy Storage (TES) Development. Crystals 2021, 11, 951. [Google Scholar] [CrossRef]
- Hasanabadi, S.; Sadrameli, S.M.; Soheili, H.; Moharrami, H.; Heyhat, M.M. A Cost-Effective Form-Stable PCM Composite with Modified Paraffin and Expanded Perlite for Thermal Energy Storage in Concrete. J. Therm. Anal. Calorim. 2019, 136, 1201–1216. [Google Scholar] [CrossRef]
- Al-Yasiri, Q.; Szabó, M. Thermal Performance of Concrete Bricks Based Phase Change Material Encapsulated by Various Aluminium Containers: An Experimental Study under Iraqi Hot Climate Conditions. J. Energy Storage 2021, 40, 102710. [Google Scholar] [CrossRef]
- Kim, H.G.; Qudoos, A.; Jeon, I.K.; Woo, B.H.; Ryou, J.S. Assessment of PCM/SiC-Based Composite Aggregate in Concrete: Energy Storage Performance. Constr. Build. Mater. 2020, 258, 119637. [Google Scholar] [CrossRef]
- Ates, F.; Woo, B.H.; Jang, C.; Kim, H.G. Enhancing Cementitious Composites with PCM-Impregnated Cork Granules for Sustainable and Energy-Efficient Building Elements. Constr. Build. Mater. 2024, 416, 135071. [Google Scholar] [CrossRef]
- Wang, Y.P.; Chen, W.; Huang, Y.Y.; Liu, X.; Su, C.Q. Performance Study on a Thermoelectric Generator with Exhaust-Module-Coolant Direct Contact. Energy Rep. 2022, 8, 729–738. [Google Scholar] [CrossRef]
- Ambrosi, R.M.; Williams, H.; Watkinson, E.J.; Barco, A.; Mesalam, R.; Crawford, T.; Bicknell, C.; Samara-Ratna, P.; Vernon, D.; Bannister, N.; et al. European Radioisotope Thermoelectric Generators (RTGs) and Radioisotope Heater Units (RHUs) for Space Science and Exploration. Space Sci. Rev. 2019, 215, 55. [Google Scholar] [CrossRef]
- Yang, S.; Li, Y.; Deng, L.; Tian, S.; Yao, Y.; Yang, F.; Feng, C.; Dai, J.; Wang, P.; Gao, M. Flexible Thermoelectric Generator and Energy Management Electronics Powered by Body Heat. Microsyst. Nanoeng. 2023, 9, 106. [Google Scholar] [CrossRef] [PubMed]
- Ghahari, S.A.; Ghafari, E.; Lu, N. Effect of ZnO Nanoparticles on Thermoelectric Properties of Cement Composite for Waste Heat Harvesting. Constr. Build. Mater. 2017, 146, 755–763. [Google Scholar] [CrossRef]
- Ji, T.; Zhang, X.; Zhang, X.; Zhang, Y.; Li, W. Effect of Manganese Dioxide Nanorods on the Thermoelectric Properties of Cement Composites. ASCE J. Mater. Civ. Eng. 2018, 132, 31–39. [Google Scholar] [CrossRef]
- Wei, J.; Hao, L.; He, G.; Yang, C. Enhanced Thermoelectric Effect of Carbon Fiber Reinforced Cement Composites by Metallic Oxide/Cement Interface. Ceram. Int. 2014, 40, 8261–8263. [Google Scholar] [CrossRef]
- Wei, J.; Nie, Z.; He, G.; Hao, L.; Zhao, L.; Zhang, Q. Energy Harvesting from Solar Irradiation in Cities Using the Thermoelectric Behavior of Carbon Fiber Reinforced Cement Composites. RSC Adv. 2014, 4, 48128–48134. [Google Scholar] [CrossRef]
- Wei, J.; Fan, Y.; Zhao, L.; Xue, F.; Hao, L.; Zhang, Q. Thermoelectric Properties of Carbon Nanotube Reinforced Cement-Based Composites Fabricated by Compression Shear. Ceram. Int. 2018, 44, 5829–5833. [Google Scholar] [CrossRef]
- Tzounis, L.; Liebscher, M.; Fuge, R.; Leonhardt, A.; Mechtcherine, V. P- and n-Type Thermoelectric Cement Composites with CVD Grown p- and n-Doped Carbon Nanotubes: Demonstration of a Structural Thermoelectric Generator. Energy Build. 2019, 191, 151–163. [Google Scholar] [CrossRef]
- Woo, B.-H.; Yoo, D.-H.; Kim, S.-S.; Lee, J.-B.; Ryou, J.-S.; Kim, H.-G. Effects of Thermal Conductive Materials on the Freeze-Thaw Resistance of Concrete. Materials 2021, 14, 4063. [Google Scholar] [CrossRef]
- Park, K.T.; Kim, H.G.; Kim, J.S.; Woo, B.H. Improving the Thermoelectric Performance of Cement Composites by Substituting Fine Aggregate with Silicon Carbide. Constr. Build. Mater. 2024, 416, 135068. [Google Scholar] [CrossRef]
- Woo, B.H.; Jeon, I.K.; Yoo, D.H.; Kim, H.G.; Ryou, J.-S. Ice-Melting Performance Assessment of Cement Composites Using Silicon Carbide as Fine Aggregate. Appl. Therm. Eng. 2021, 194, 117113. [Google Scholar] [CrossRef]
- ASTM C150; Standard Specification for Portland Cement. ASTM International: West Conshohocken, PA, USA, 2017.
- ASTM C33; Standard Specifications for Concrete Aggregates. ASTM International: West Conshohocken, PA, USA, 2003.
- Ioannidou, D.; Meylan, G.; Sonnemann, G.; Habert, G. Is Gravel Becoming Scarce? Evaluating the Local Criticality of Construction Aggregates. Resour. Conserv. Recycl. 2017, 126, 25–33. [Google Scholar] [CrossRef]
- Woo, B.-H.; Yoo, D.-H.; Jeon, I.-K.; Kim, J.-S.; Yoo, K.-S.; Kim, H.G. Estimation of the Thermal Conductivity of Cement Composites Using Bayesian Statistical Approach. Compos. Part B Eng. 2022, 243, 110073. [Google Scholar] [CrossRef]
- Park, K.T. Investigation on the Thermoelectric Energy Harvesting Using Cement Composites Incorporating the Ceramic-Type Carbon Material as Fine Aggregate. Master’s Thesis, Hanyang University, Seoul, Republic of Korea, 2024. [Google Scholar]
- ASTM C109; A Standard Test Method for Compressive Strength of Hydraulic Cement Mortars (Using 2-in. or [50-Mm] Cube Specimens). ASTM International: West Conshohocken, PA, USA, 2002.
- C348; A Standard Test Method for Flexural Strength of Hydraulic-Cement Mortars. American Society for Testing and Materials International: West Conshohocken, PA, USA, 2008.
- Liu, C.; Qian, R.; Liu, Z.; Liu, G.; Zhang, Y. Multi-Scale Modelling of Thermal Conductivity of Phase Change Material/Recycled Cement Paste Incorporated Cement-Based Composite Material. Mater. Des. 2020, 191, 108646. [Google Scholar] [CrossRef]
- Kultayeva, S.; Ha, J.H.; Malik, R.; Kim, Y.W.; Kim, K.J. Effects of Porosity on Electrical and Thermal Conductivities of Porous SiC Ceramics. J. Eur. Ceram. Soc. 2020, 40, 996–1004. [Google Scholar] [CrossRef]
- Jeon, I.K.; Qudoos, A.; Jakhrani, S.H.; Kim, H.G.; Ryou, J.S. Investigation of Sulfuric Acid Attack upon Cement Mortars Containing Silicon Carbide Powder. Powder Technol. 2020, 359, 181–189. [Google Scholar] [CrossRef]
- Kantel, T.; Ślosarczyk, A. Influence of Silicon Carbide and Electrocorundum on the Thermal Resistance of Cement Binders with Granulated Blast-Furnace Slag. Proc. Eng 2017, 172, 497–504. [Google Scholar]
- Yinfei, D.; Wei, H.; Mingxin, D.; Weizheng, L. Using Silicon Carbide to Increase Thermal Conductivity of Cement Composite for Improving Heating Efficiency of Floor Heating System. Constr. Build. Mater. 2022, 325, 126707. [Google Scholar] [CrossRef]
- Mendoza Reales, O.A.; Carisio, P.A.; dos Santos, T.C.; Pearl, W.C.; Toledo Filho, R.D. Effect of Pozzolanic Micro and Nanoparticles as Secondary Fillers in Carbon Nanotubes/Cement Composites. Constr. Build. Mater. 2021, 281, 122603. [Google Scholar] [CrossRef]
- Gupta, S.; Kua, H.W. Carbonaceous Micro-Filler for Cement: Effect of Particle Size and Dosage of Biochar on Fresh and Hardened Properties of Cement Mortar. Sci. Total Environ. 2019, 662, 952–962. [Google Scholar] [CrossRef]
- Chen, X.; Wu, S.; Zhou, J. Influence of Porosity on Compressive and Tensile Strength of Cement Mortar. Constr. Build. Mater. 2013, 40, 869–874. [Google Scholar] [CrossRef]
- Ambroziak, A.; Ziolkowski, P. Concrete Compressive Strength under Changing Environmental Conditions during Placement Processes. Materials 2020, 13, 4577. [Google Scholar] [CrossRef]
- Wu, S.; Moges, K.A.; Vashistha, P.; Pyo, S. Sustainable Cementitious Composites with 30% Porosity and a Compressive Strength of 30 MPa. J. Mater. Res. Technol. 2023, 25, 5494–5505. [Google Scholar] [CrossRef]
- MejiaCruz, Y.; Caicedo, J.M.; Matta, F. Probabilistic Comparative Assessment of Structural Cement Composite Compressive Strength–Porosity Models. J. Struct. Eng. 2024, 150, 04024165. [Google Scholar] [CrossRef]
- Lin, X.; Xu, Q.; Deng, T.; Yang, B.; Chen, L. Improving Thermal Conductivity of Al/SiC Composites by Post-Oxidization of Reaction-Bonded Silicon Carbide Preforms. Sci. Rep. 2024, 14, 16610. [Google Scholar] [CrossRef]
- Román-Manso, B.; Chevillotte, Y.; Osendi, M.I.; Belmonte, M.; Miranzo, P. Thermal Conductivity of Silicon Carbide Composites with Highly Oriented Graphene Nanoplatelets. J. Eur. Ceram. Soc. 2016, 36, 3987–3993. [Google Scholar] [CrossRef]
- Wei, Y.; Cui, Y.; Wang, Y. Ionic Thermoelectric Effect of Pure Cement Paste and Its Temperature Sensing Performance. Constr. Build. Mater. 2023, 364, 129898. [Google Scholar] [CrossRef]
- Ail, U.; Jafari, M.J.; Wang, H.; Ederth, T.; Berggren, M.; Crispin, X. Thermoelectric Properties of Polymeric Mixed Conductors. Adv. Funct. Mater. 2016, 26, 6288–6296. [Google Scholar] [CrossRef]


Disclaimer/Publisher’s Note: The statements, opinions and data contained in all publications are solely those of the individual author(s) and contributor(s) and not of MDPI and/or the editor(s). MDPI and/or the editor(s) disclaim responsibility for any injury to people or property resulting from any ideas, methods, instructions or products referred to in the content. |
© 2025 by the authors. Licensee MDPI, Basel, Switzerland. This article is an open access article distributed under the terms and conditions of the Creative Commons Attribution (CC BY) license (https://creativecommons.org/licenses/by/4.0/).