
Ranking of Independent Small-Scale Electricity Generation Systems


Abstract
1. Introduction
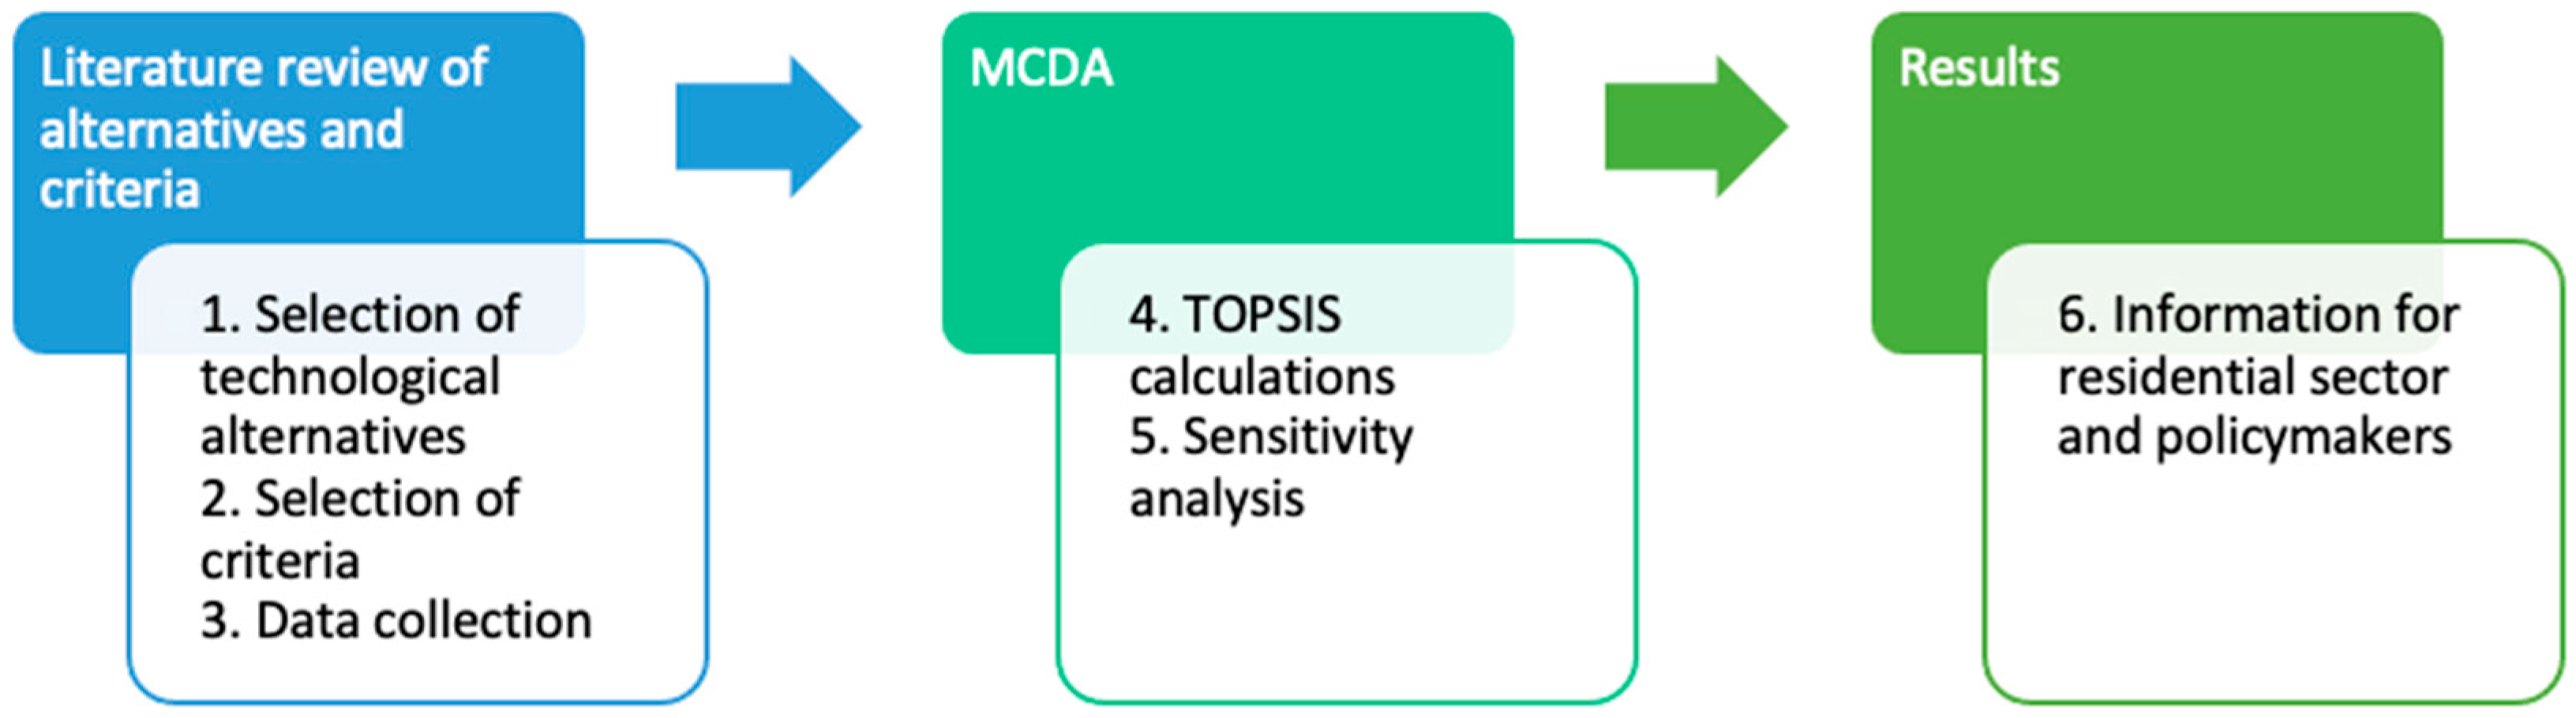
2. Methods
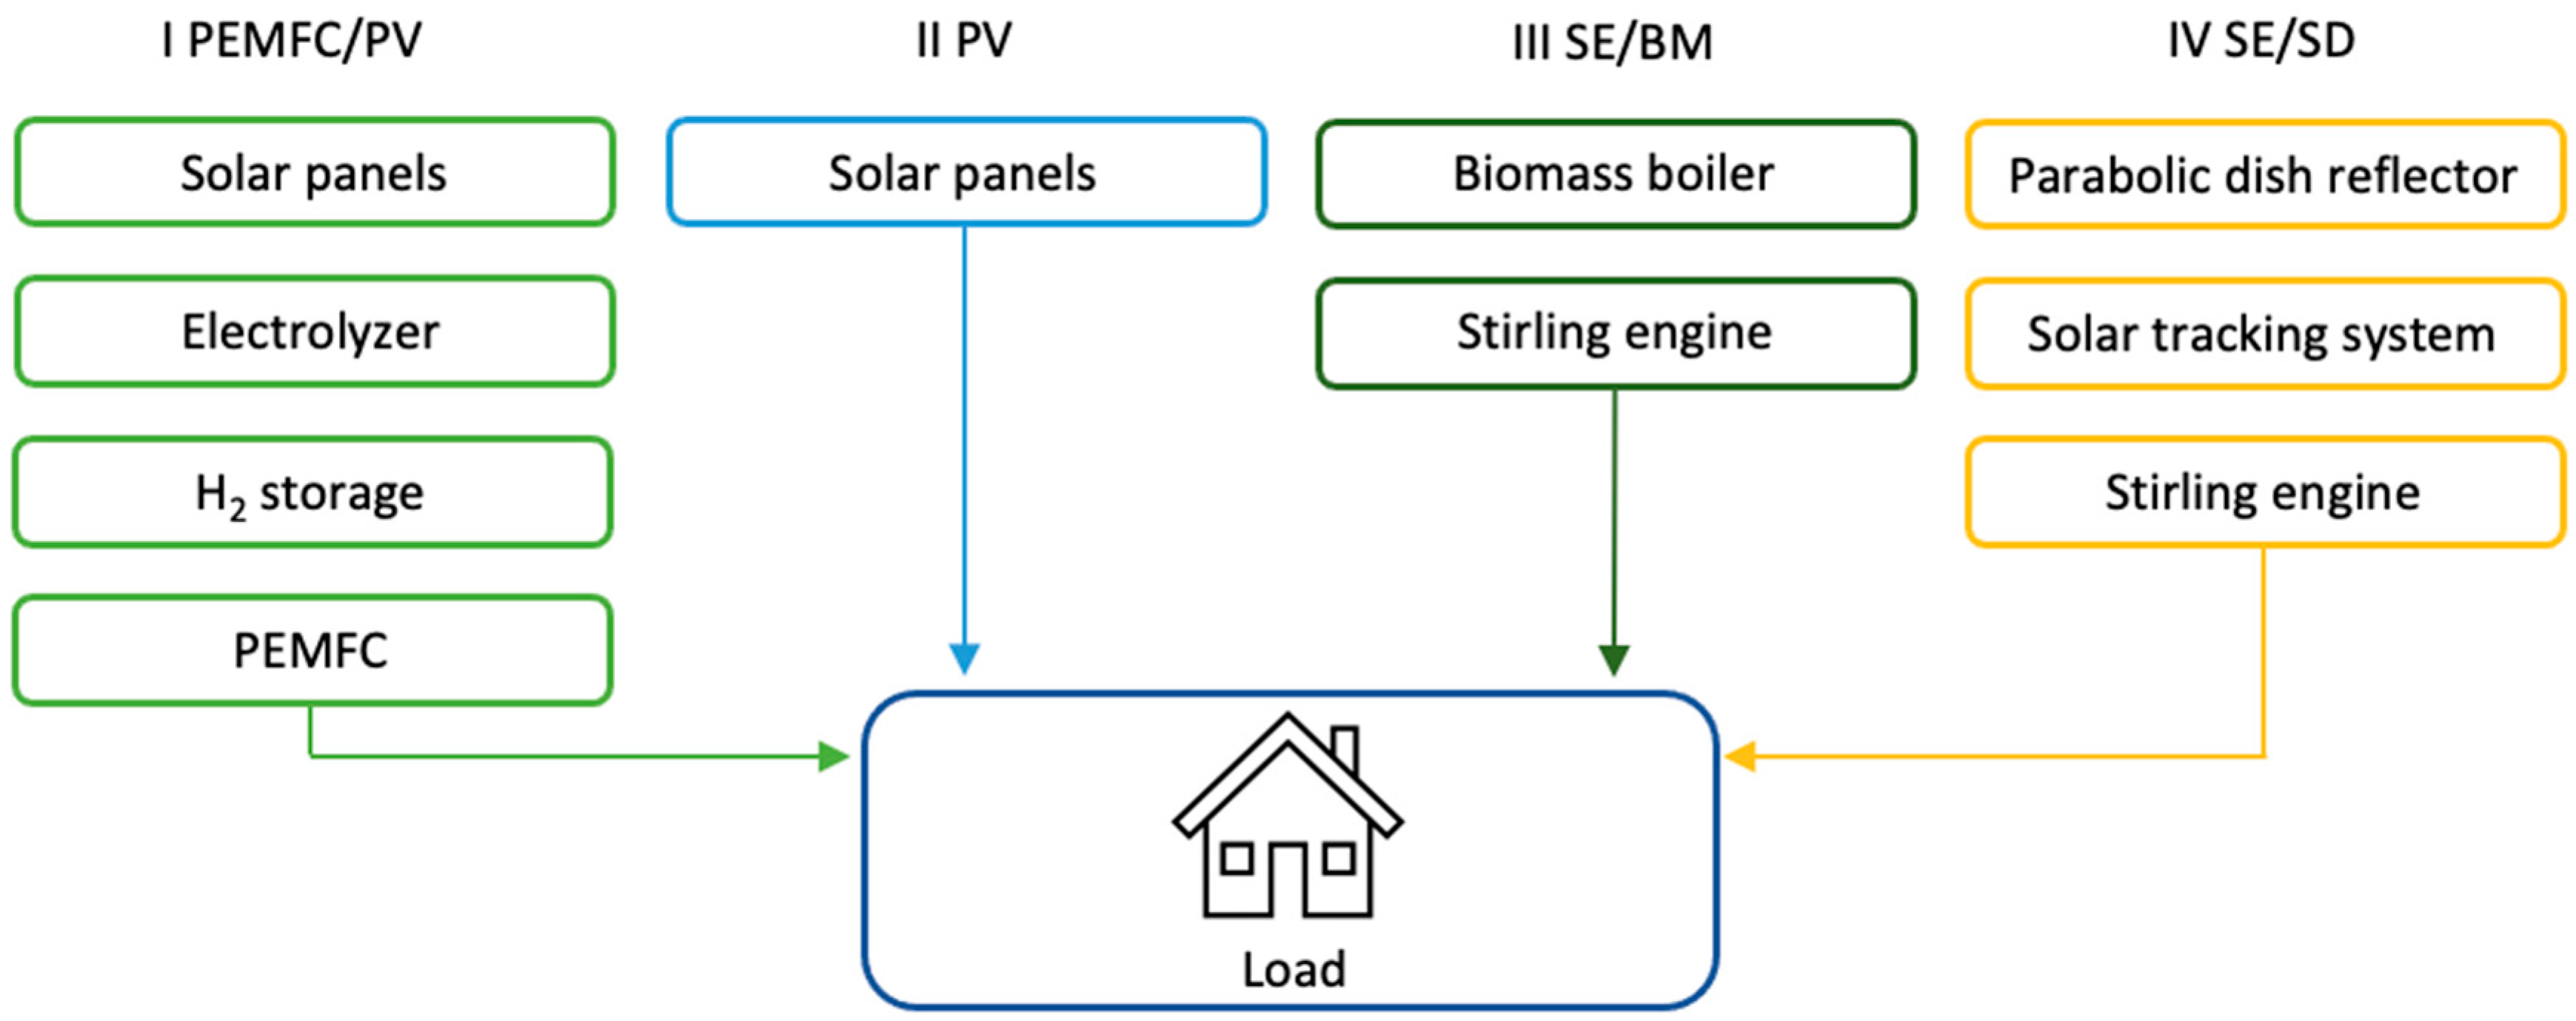
2.1. Literature Review
2.2. Multi-Criteria Decision Analysis
3. Results
3.1. Data Summary
3.1.1. Levelized Cost of Energy
3.1.2. Efficiency and Reliability
3.1.3. Global Warming Potential and Lifetime
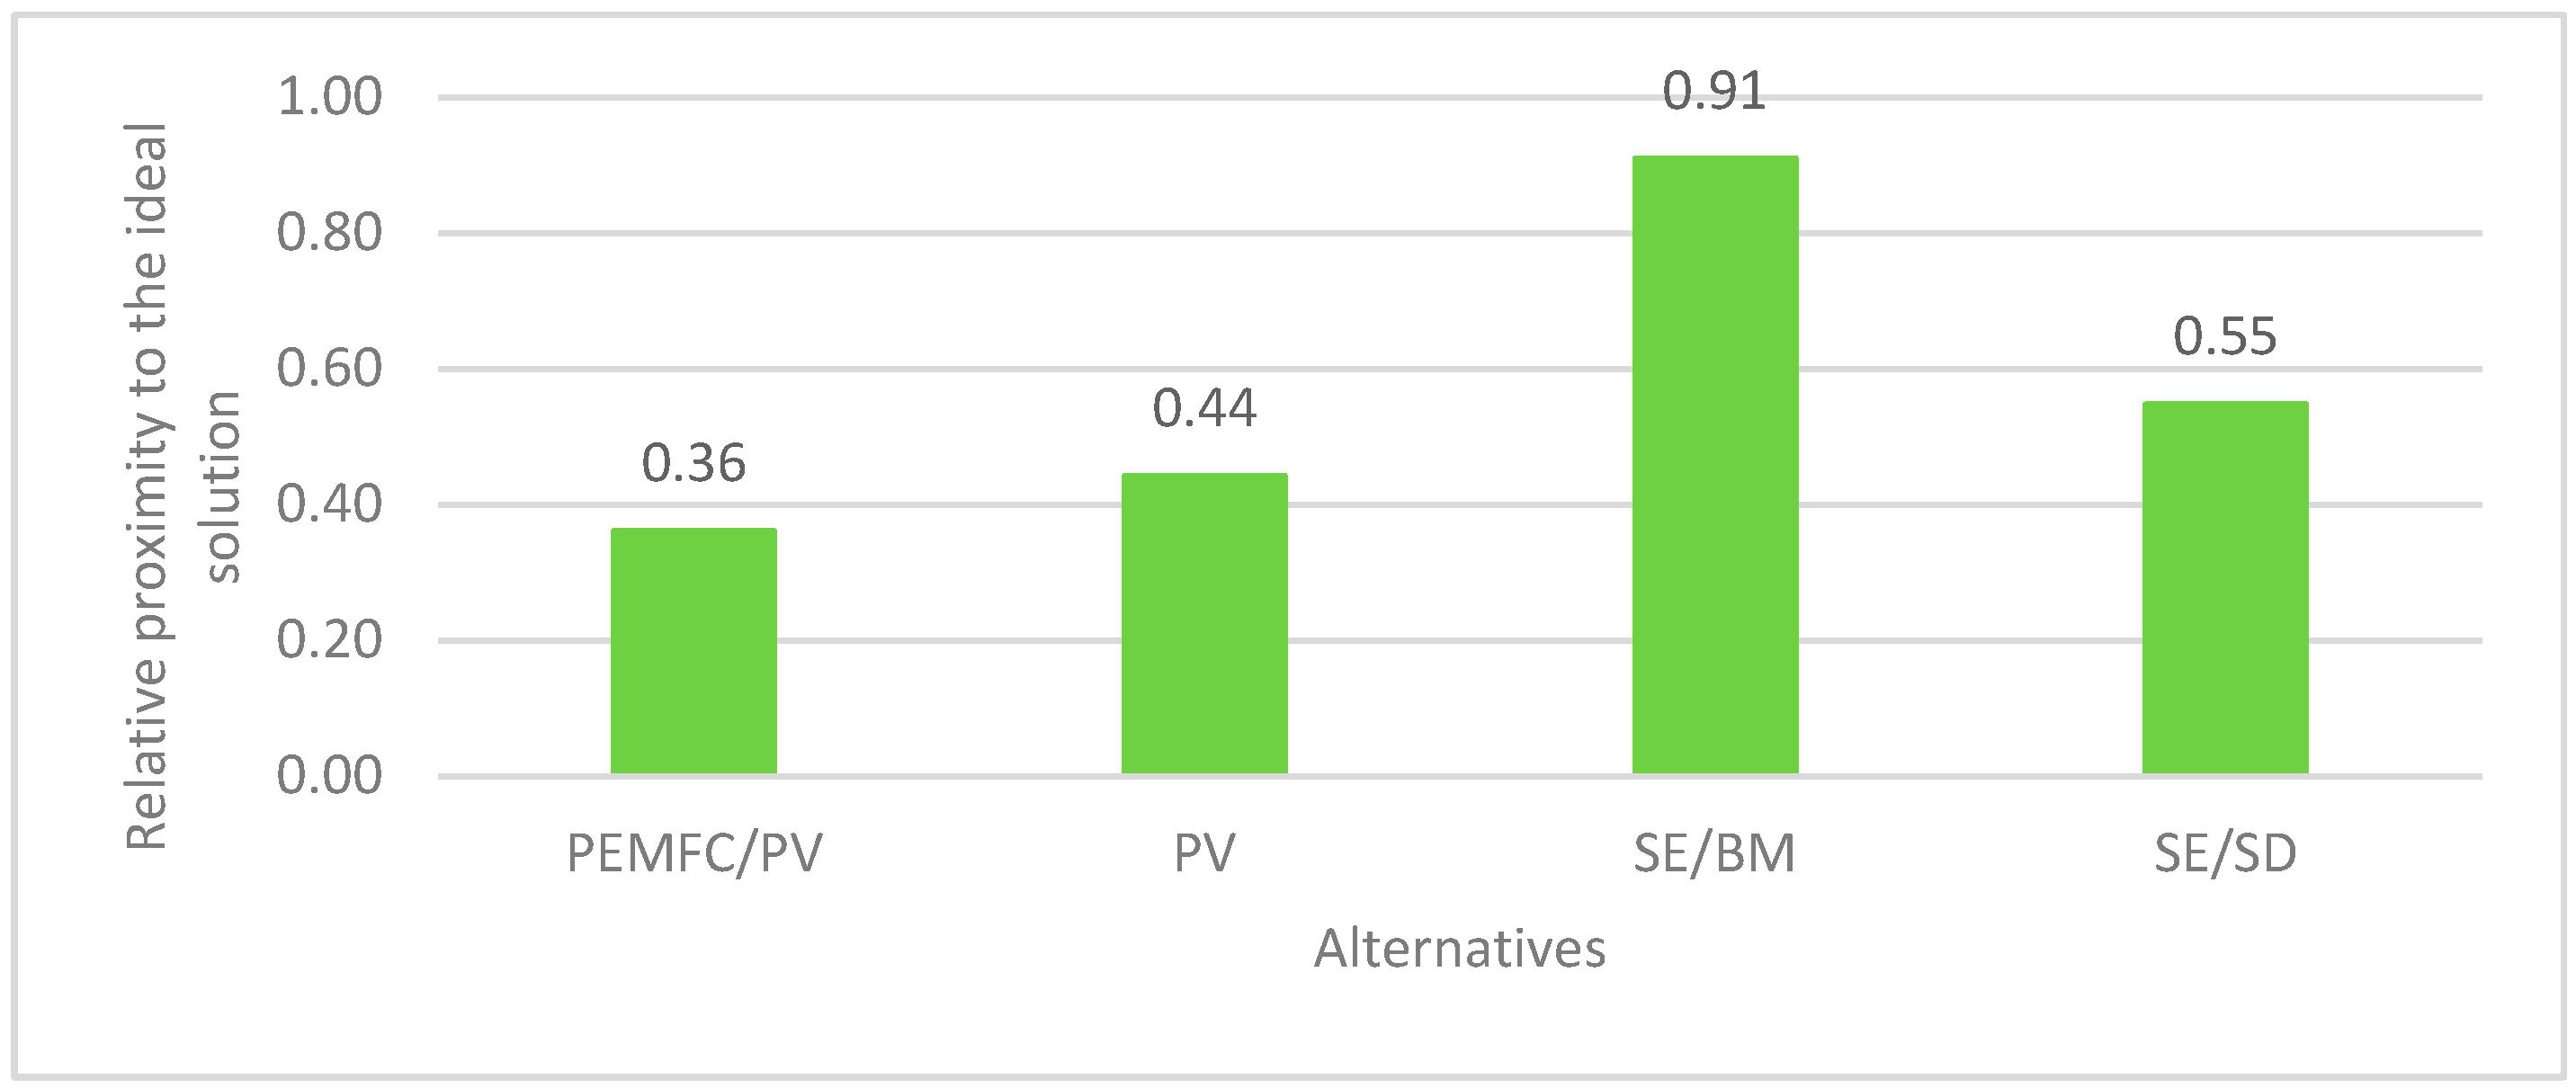
3.2. TOPSIS
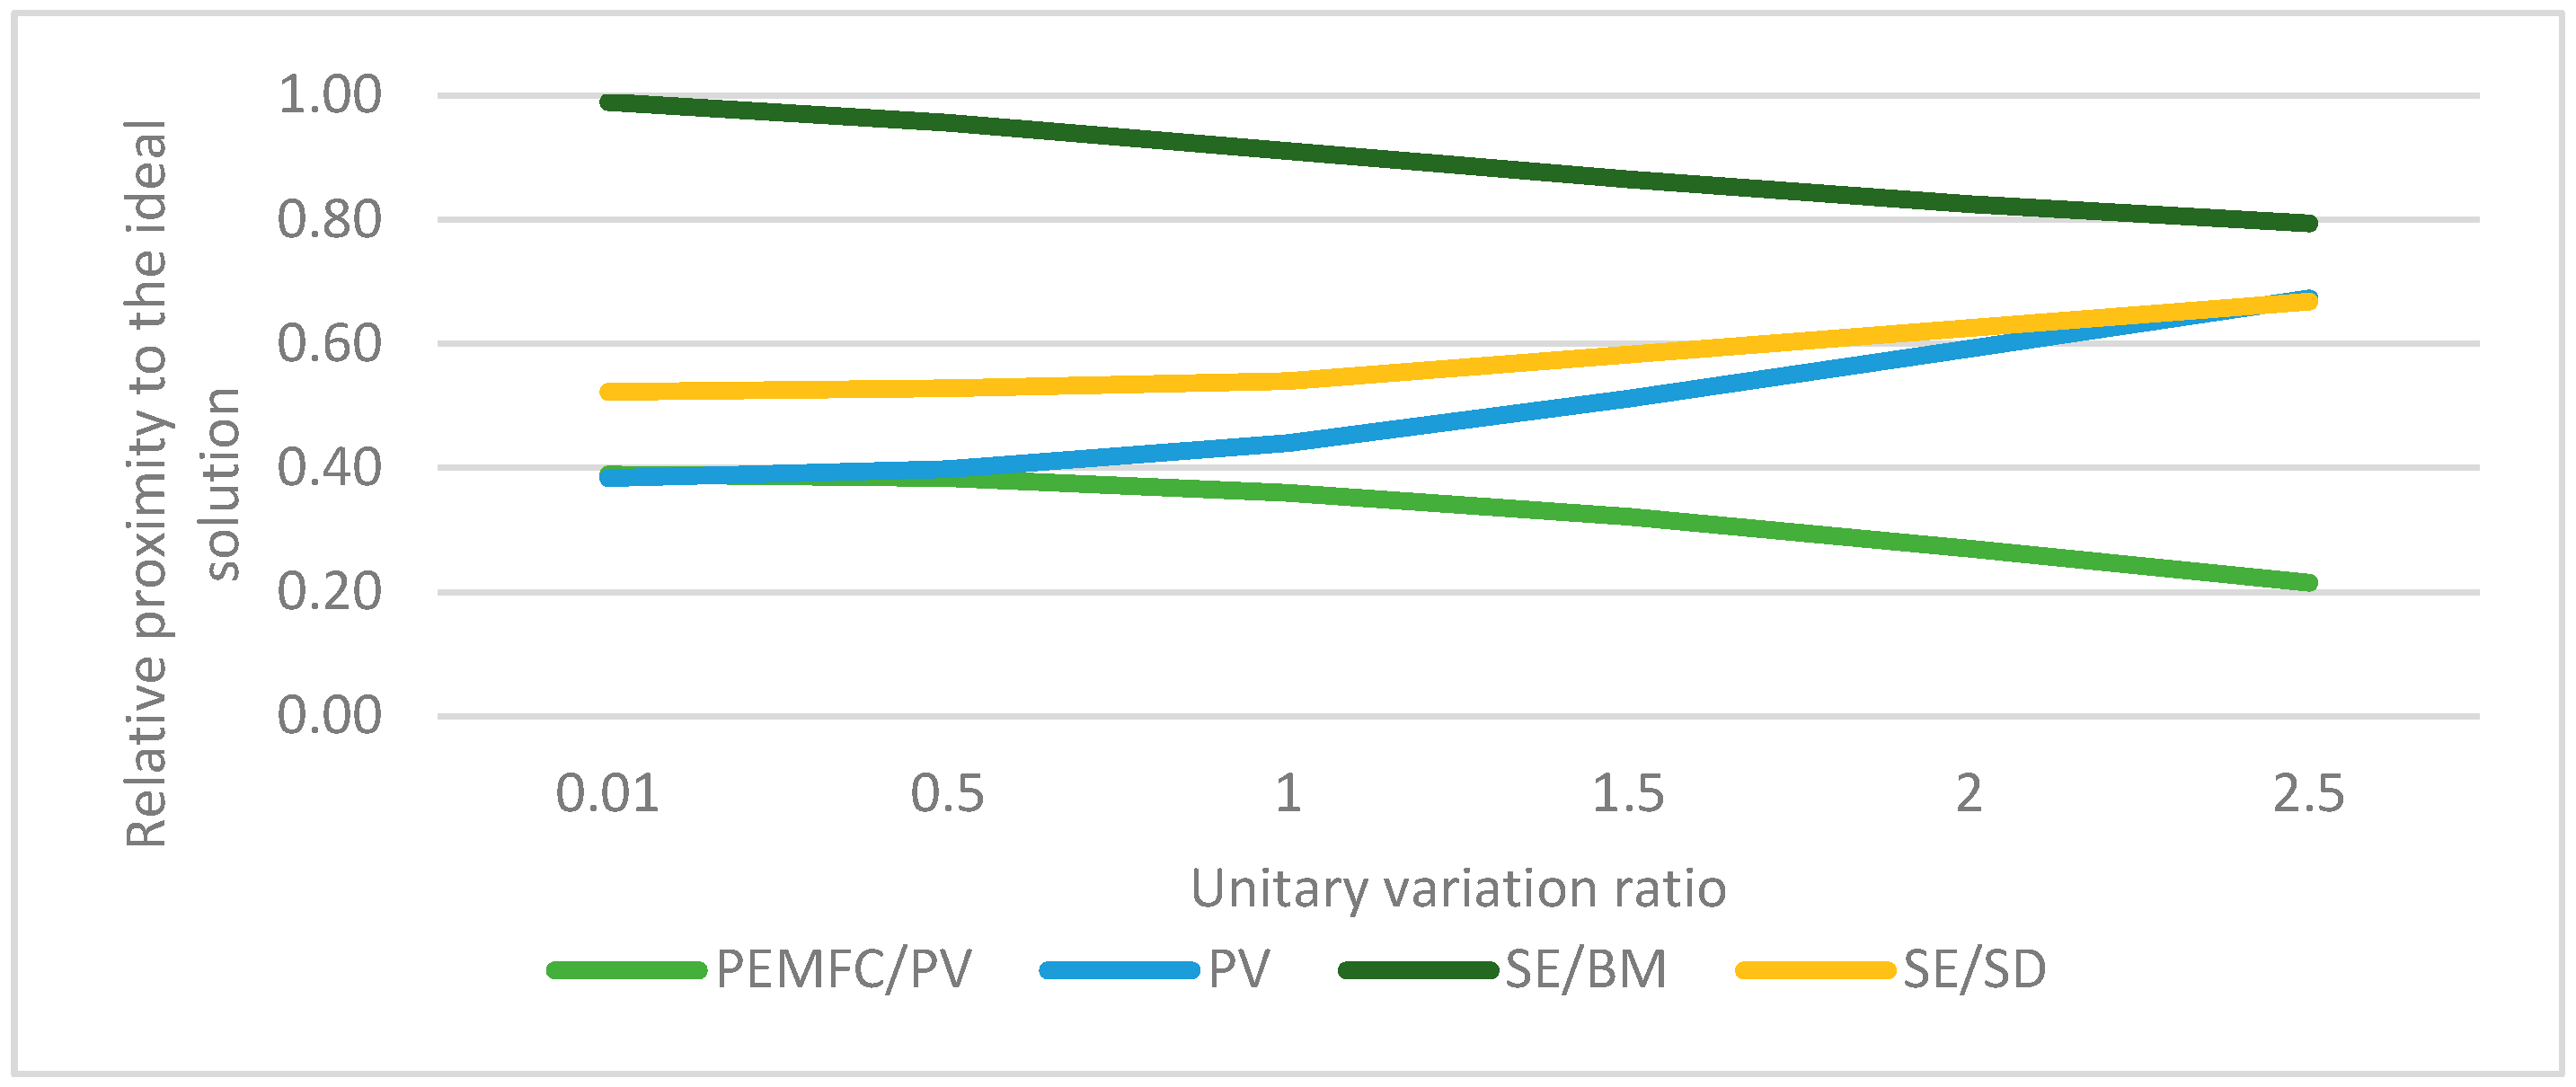
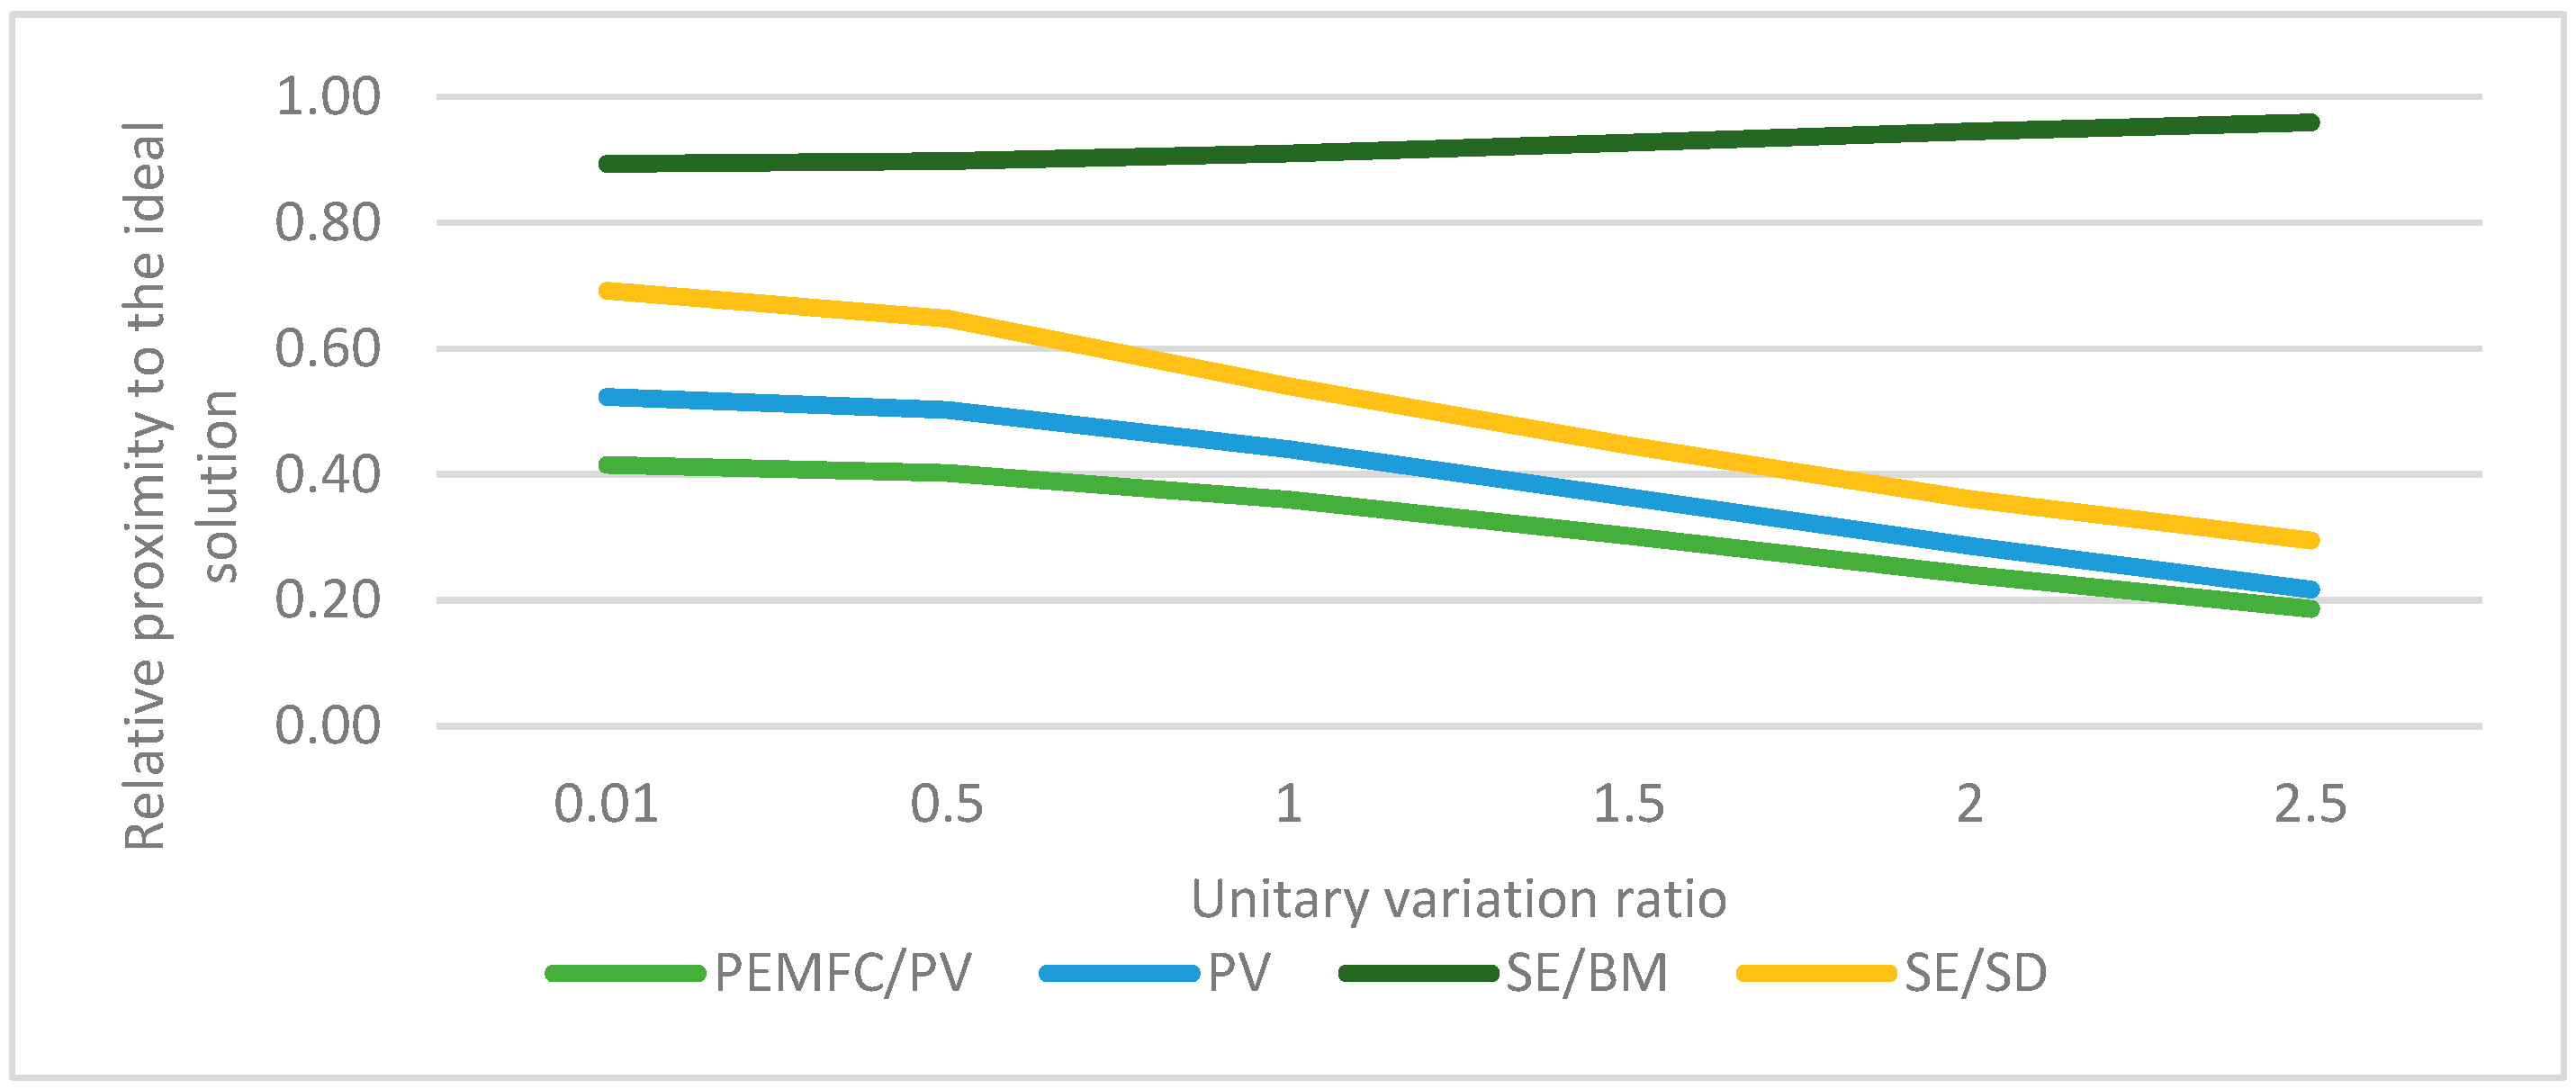
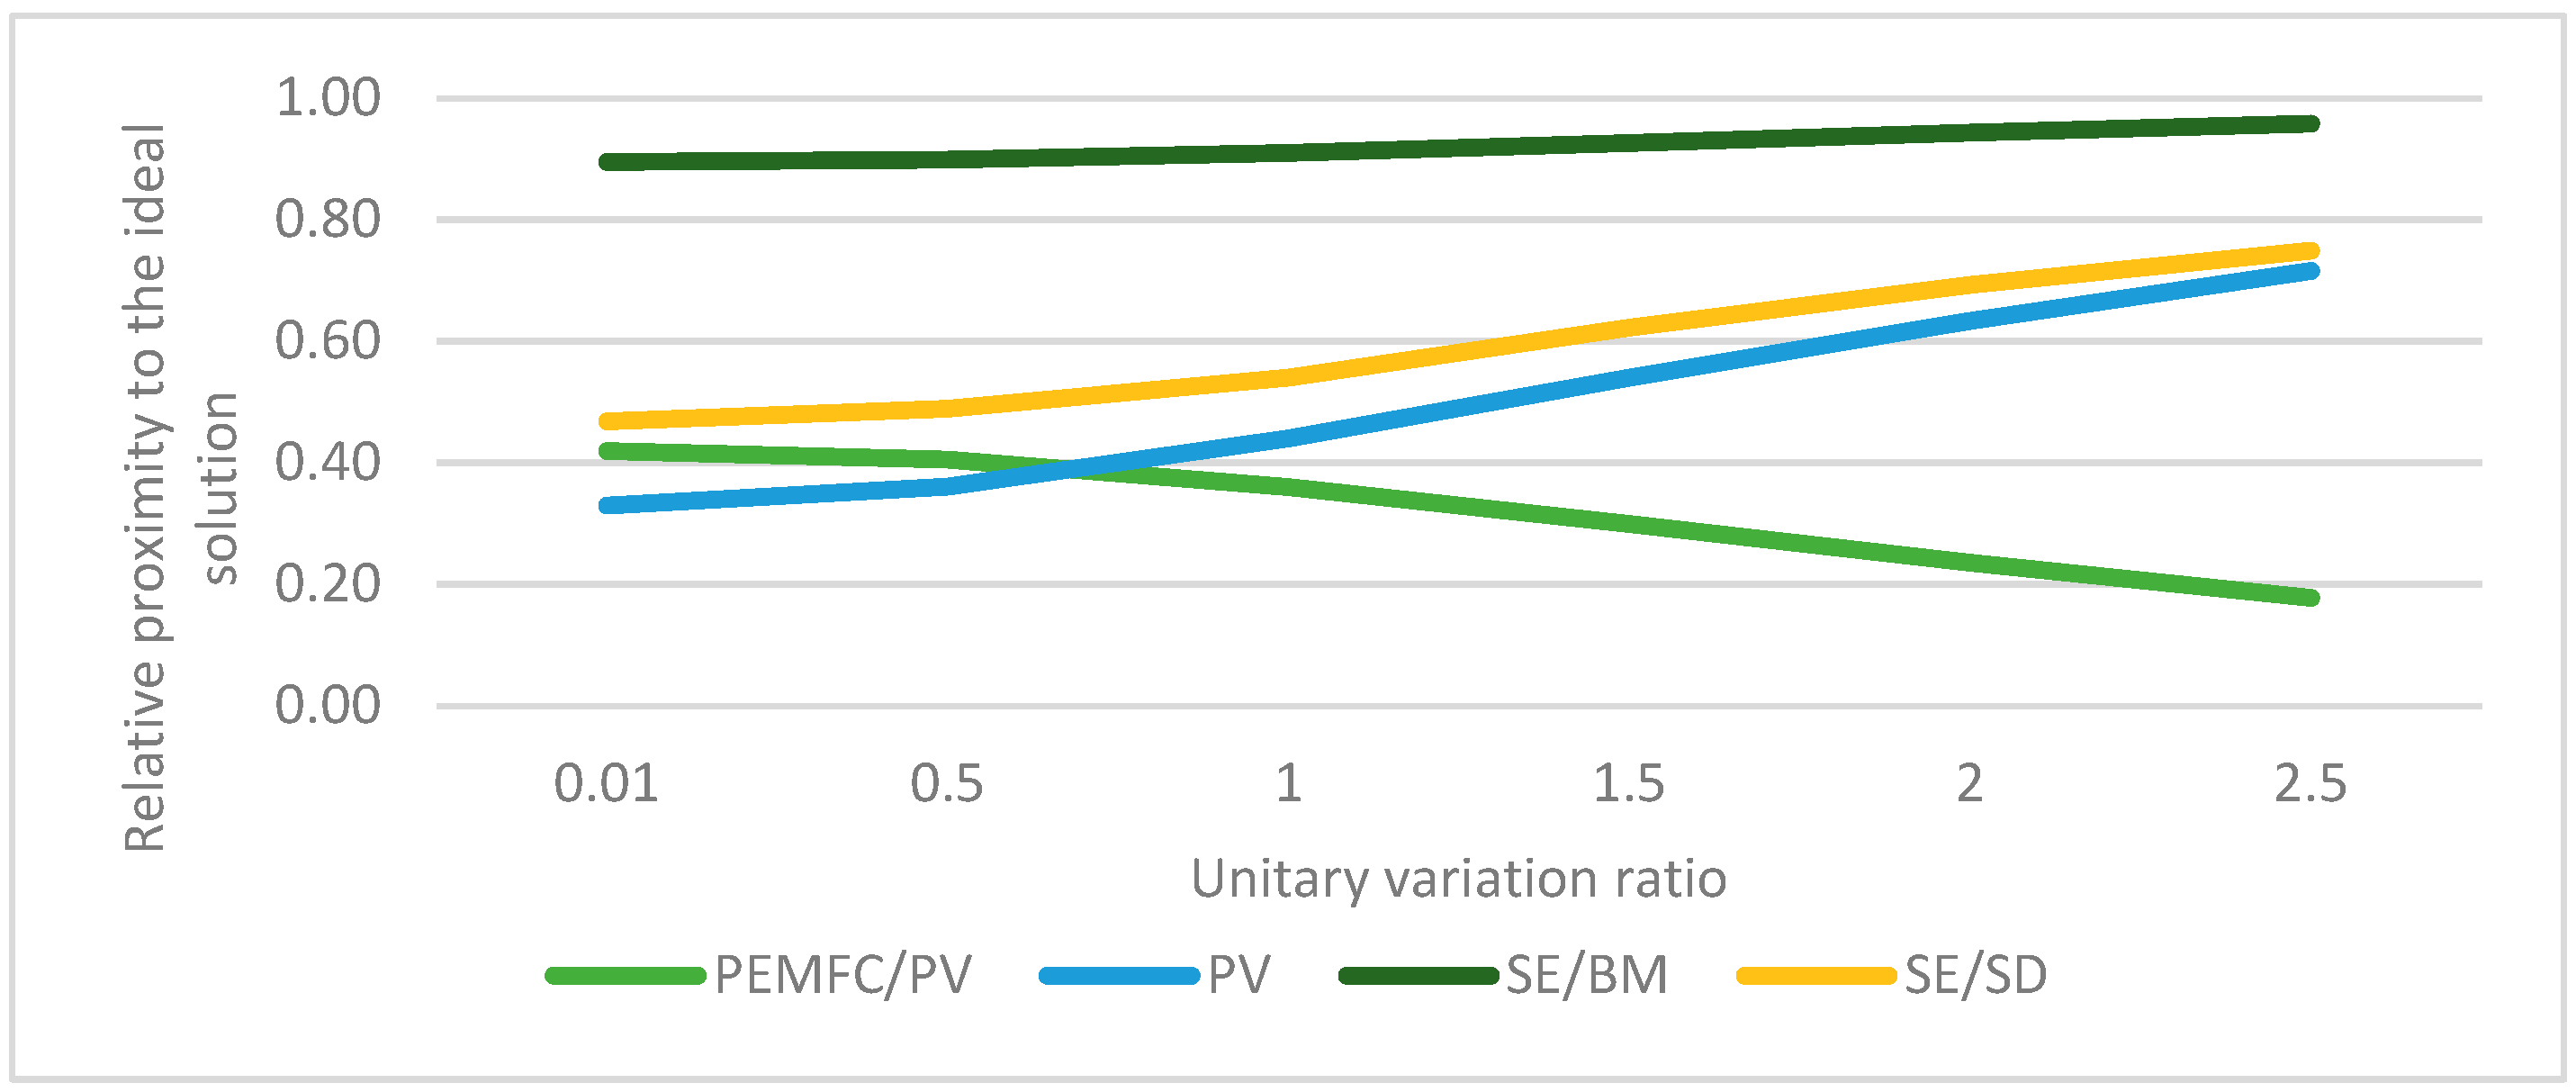
3.3. Sensitivity Analysis
4. Discussion
5. Conclusions
Author Contributions
Funding
Institutional Review Board Statement
Informed Consent Statement
Data Availability Statement
Conflicts of Interest
Nomenclature
| Abbreviations | Meaning |
| EU | European Union |
| GHG | greenhouse gas |
| GWP | global warming potential |
| LCA | life cycle analysis |
| LCOE | levelized cost of energy |
| MCDA | Multi-Criteria Decision Analysis |
| PEMFC | proton exchange membrane fuel cells |
| PEMFC/PV | proton exchange membrane fuel cell with photovoltaic panels |
| PV | photovoltaic panels |
| SE/BM | biomass-fueled Stirling engine |
| SE/SD | solar dish Stirling engine |
| TOPSIS | technique of order preference similarity to the ideal solution |
References
- Clean Energy for All Europeans. 2019. Available online: https://data.europa.eu/doi/10.2833/9937 (accessed on 16 October 2023).
- Knosala, K.; Kotzur, L.; Röben, F.T.C.; Stenzel, P.; Blum, L.; Robinius, M.; Stolten, D. Hybrid Hydrogen Home Storage for Decentralized Energy Autonomy. Int. J. Hydrogen Energy 2021, 46, 21748–21763. [Google Scholar] [CrossRef]
- Marocco, P.; Ferrero, D.; Lanzini, A.; Santarelli, M. The Role of Hydrogen in the Optimal Design of Off-Grid Hybrid Renewable Energy Systems. J. Energy Storage 2022, 46, 103893. [Google Scholar] [CrossRef]
- López-Castrillón, W.; Sepúlveda, H.H.; Mattar, C. Off-Grid Hybrid Electrical Generation Systems in Remote Communities: Trends and Characteristics in Sustainability Solutions. Sustainability 2021, 13, 5856. [Google Scholar] [CrossRef]
- Nižetić, S.; Tolj, I.; Papadopoulos, A.M. Hybrid Energy Fuel Cell Based System for Household Applications in a Mediterranean Climate. Energy Convers. Manag. 2015, 105, 1037–1045. [Google Scholar] [CrossRef]
- Ahmadi, L.; Kannangara, M.; Bensebaa, F. Cost-Effectiveness of Small Scale Biomass Supply Chain and Bioenergy Production Systems in Carbon Credit Markets: A Life Cycle Perspective. Sustain. Energy Technol. Assess. 2020, 37, 100627. [Google Scholar] [CrossRef]
- Ferreira, A.C.; Silva, J.; Teixeira, S.; Teixeira, J.C.; Nebra, S.A. Assessment of the Stirling Engine Performance Comparing Two Renewable Energy Sources: Solar Energy and Biomass. Renew. Energy 2020, 154, 581–597. [Google Scholar] [CrossRef]
- Budak, Y.; Devrim, Y. Comparative Study of PV/PEM Fuel Cell Hybrid Energy System Based on Methanol and Water Electrolysis. Energy Convers. Manag. 2019, 179, 46–57. [Google Scholar] [CrossRef]
- Khan, M.A.; Gohari Darabkhani, H. Technoeconomic Analysis and Risk Assessment of Deploying Micro-Combined Heat and Power (M-Chp) Systems for Domestic Applications. SSRN J. 2022. [Google Scholar] [CrossRef]
- Streimikiene, D.; Baležentis, T. Multi-Criteria Assessment of Small Scale CHP Technologies in Buildings. Renew. Sustain. Energy Rev. 2013, 26, 183–189. [Google Scholar] [CrossRef]
- Abdelkareem, M.A.; Elsaid, K.; Wilberforce, T.; Kamil, M.; Sayed, E.T.; Olabi, A. Environmental Aspects of Fuel Cells: A Review. Sci. Total Environ. 2021, 752, 141803. [Google Scholar] [CrossRef]
- Zhu, S.; Yu, G.; Liang, K.; Dai, W.; Luo, E. A Review of Stirling-Engine-Based Combined Heat and Power Technology. Appl. Energy 2021, 294, 116965. [Google Scholar] [CrossRef]
- Salih, S.A.; Aljashaami, B.A.; Alwan, N.T.; Shcheklein, S.E.; Velkin, V.I.; Ali, O. Factors Affecting the Thermodynamic Performance of the Stirling Engines: A Review Study. IREME 2022, 16, 529–539. [Google Scholar] [CrossRef]
- Khezri, R.; Mahmoudi, A.; Aki, H. Optimal Planning of Solar Photovoltaic and Battery Storage Systems for Grid-Connected Residential Sector: Review, Challenges and New Perspectives. Renew. Sustain. Energy Rev. 2022, 153, 111763. [Google Scholar] [CrossRef]
- Stropnik, R.; Mlakar, N.; Lotrič, A.; Sekavčnik, M.; Mori, M. The Influence of Degradation Effects in Proton Exchange Membrane Fuel Cells on Life Cycle Assessment Modelling and Environmental Impact Indicators. Int. J. Hydrogen Energy 2022, 47, 24223–24241. [Google Scholar] [CrossRef]
- Abuelyamen, A.; Ben-Mansour, R. Energy Efficiency Comparison of Stirling Engine Types (α, β, and γ) Using Detailed CFD Modeling. Int. J. Therm. Sci. 2018, 132, 411–442. [Google Scholar] [CrossRef]
- Aldersey-Williams, J.; Rubert, T. Levelised Cost of Energy—A Theoretical Justification and Critical Assessment. Energy Policy 2019, 124, 169–179. [Google Scholar] [CrossRef]
- Zlaugotne, B.; Zihare, L.; Balode, L.; Kalnbalkite, A.; Khabdullin, A.; Blumberga, D. Multi-Criteria Decision Analysis Methods Comparison. Environ. Clim. Technol. 2020, 24, 454–471. [Google Scholar] [CrossRef]
- Teirumnieka, E.; Patel, N.; Laktuka, K.; Dolge, K.; Veidenbergs, I.; Blumberga, D. Sustainability dilemma of hemp utilization for energy production. Energy Nexus 2023, 11, 100213. [Google Scholar] [CrossRef]
- Final Report Cost of Energy (LCOE): Energy Costs, Taxes and the Impact of Government Interventions on Investments. 2020. Available online: https://energy.ec.europa.eu/system/files/2020-10/final_report_levelised_costs_0.pdf (accessed on 16 October 2023).
- Ceylan, C.; Devrim, Y. Design and Simulation of the PV/PEM Fuel Cell Based Hybrid Energy System Using MATLAB/Simulink for Greenhouse Application. Int. J. Hydrogen Energy 2021, 46, 22092–22106. [Google Scholar] [CrossRef]
- Future of Solar Photovoltaic: Deployment, Investment, Technology, Grid Integration and Socio-Economic Aspects. 2019. Available online: https://www.irena.org/-/media/Files/IRENA/Agency/Publication/2019/Nov/IRENA_Future_of_Solar_PV_2019.pdf (accessed on 16 October 2023).
- Zhang, J.; Ling, B.; He, Y.; Zhu, Y.; Wang, Z. Life Cycle Assessment of Three Types of Hydrogen Production Methods Using Solar Energy. Int. J. Hydrogen Energy 2022, 47, 14158–14168. [Google Scholar] [CrossRef]
- Martinopoulos, G. Are Rooftop Photovoltaic Systems a Sustainable Solution for Europe? A Life Cycle Impact Assessment and Cost Analysis. Appl. Energy 2020, 257, 114035. [Google Scholar] [CrossRef]
- Backes, J.G.; D’Amico, A.; Pauliks, N.; Guarino, S.; Traverso, M.; Lo Brano, V. Life Cycle Sustainability Assessment of a Dish-Stirling Concentrating Solar Power Plant in the Mediterranean Area. Sustain. Energy Technol. Assess. 2021, 47, 101444. [Google Scholar] [CrossRef]
- Nagapurkar, P.; Smith, J.D. Techno-Economic Optimization and Environmental Life Cycle Assessment (LCA) of Microgrids Located in the US Using Genetic Algorithm. Energy Convers. Manag. 2019, 181, 272–291. [Google Scholar] [CrossRef]
- Ghenai, C.; Bettayeb, M. Optimized Design and Control of an off Grid Solar PV/Hydrogen Fuel Cell Power System for Green Buildings. IOP Conf. Ser. Earth Environ. Sci. 2017, 93, 012073. [Google Scholar] [CrossRef]
- Di Micco, S.; Romano, F.; Jannelli, E.; Perna, A.; Minutillo, M. Techno-Economic Analysis of a Multi-Energy System for the Co-Production of Green Hydrogen, Renewable Electricity and Heat. Int. J. Hydrogen Energy 2023, 48, 31457–31467. [Google Scholar] [CrossRef]
- Okundamiya, M.S. Integration of Photovoltaic and Hydrogen Fuel Cell System for Sustainable Energy Harvesting of a University ICT Infrastructure with an Irregular Electric Grid. Energy Convers. Manag. 2021, 250, 114928. [Google Scholar] [CrossRef]
- Praveenkumar, S.; Agyekum, E.B.; Ampah, J.D.; Afrane, S.; Velkin, V.I.; Mehmood, U.; Awosusi, A.A. Techno-Economic Optimization of PV System for Hydrogen Production and Electric Vehicle Charging Stations under Five Different Climatic Conditions in India. Int. J. Hydrogen Energy 2022, 47, 38087–38105. [Google Scholar] [CrossRef]
- Bartolucci, L.; Cordiner, S.; Mulone, V.; Pasquale, S. Fuel Cell Based Hybrid Renewable Energy Systems for Off-Grid Telecom Stations: Data Analysis and System Optimization. Appl. Energy 2019, 252, 113386. [Google Scholar] [CrossRef]
- Entezari, A.; Manizadeh, A.; Ahmadi, R. Energetical, Exergetical and Economical Optimization Analysis of Combined Power Generation System of Gas Turbine and Stirling Engine. Energy Convers. Manag. 2018, 159, 189–203. [Google Scholar] [CrossRef]
- Larchet, K.; Guédez, R.; Topel, M.; Gustavsson, L.; Machirant, A.; Hedlund, M.-L.; Laumert, B. Enhancing Economic Competiveness of Dish Stirling Technology through Production Volume and Localization: Case Study for Morocco. AIP Conf. Proc. 2017, 1850, 050002. [Google Scholar] [CrossRef]
- Shboul, B.; AL-Arfi, I.; Michailos, S.; Ingham, D.; AL-Zoubi, O.H.; Ma, L.; Hughes, K.; Pourkashanian, M. Design and Techno-Economic Assessment of a New Hybrid System of a Solar Dish Stirling Engine Instegrated with a Horizontal Axis Wind Turbine for Microgrid Power Generation. Energy Convers. Manag. 2021, 245, 114587. [Google Scholar] [CrossRef]
- Pawananont, K.; Leephakpreeda, T. Feasibility Analysis of Power Generation from Landfill Gas by Using Internal Combustion Engine, Organic Rankine Cycle and Stirling Engine of Pilot Experiments in Thailand. Energy Procedia 2017, 138, 575–579. [Google Scholar] [CrossRef]


| Criteria Category | Criteria | Ideal Value |
|---|---|---|
| Economic aspect | LCOE—levelized cost of energy of the system (€/kWh) | – |
| Technical aspect | Efficiency—electrical efficiency of the system (%) | + |
| Reliability—full-load working hours of the system (h/year) | + | |
| Environmental aspect | GWP—global warming potential of the system (kgCO2eq/kWh) | – |
| Lifetime—technical lifetime of the technology (years) | + |
Disclaimer/Publisher’s Note: The statements, opinions and data contained in all publications are solely those of the individual author(s) and contributor(s) and not of MDPI and/or the editor(s). MDPI and/or the editor(s) disclaim responsibility for any injury to people or property resulting from any ideas, methods, instructions or products referred to in the content. |
© 2024 by the authors. Licensee MDPI, Basel, Switzerland. This article is an open access article distributed under the terms and conditions of the Creative Commons Attribution (CC BY) license (https://creativecommons.org/licenses/by/4.0/).
Share and Cite
Kramens, J.; Valtere, M.; Krigers, G.; Kirsanovs, V.; Blumberga, D. Ranking of Independent Small-Scale Electricity Generation Systems. Clean Technol. 2024, 6, 140-151. https://doi.org/10.3390/cleantechnol6010009
Kramens J, Valtere M, Krigers G, Kirsanovs V, Blumberga D. Ranking of Independent Small-Scale Electricity Generation Systems. Clean Technologies. 2024; 6(1):140-151. https://doi.org/10.3390/cleantechnol6010009
Chicago/Turabian StyleKramens, Janis, Megija Valtere, Guntars Krigers, Vladimirs Kirsanovs, and Dagnija Blumberga. 2024. "Ranking of Independent Small-Scale Electricity Generation Systems" Clean Technologies 6, no. 1: 140-151. https://doi.org/10.3390/cleantechnol6010009
APA StyleKramens, J., Valtere, M., Krigers, G., Kirsanovs, V., & Blumberga, D. (2024). Ranking of Independent Small-Scale Electricity Generation Systems. Clean Technologies, 6(1), 140-151. https://doi.org/10.3390/cleantechnol6010009