Abstract
EV development is being prioritized in order to attain the target of net zero emissions by 2050. Electric vehicles have the potential to decrease greenhouse gas (GHG) emissions, which contribute to global warming. The driving range of electric vehicles is a significant limitation that prevents people from using them generally. This paper proposes a comprehensive model for calculating the amount of energy needed to charge EVs for a scheduled trip. The model contains anticipated consumption energy for the whole trip as well as contingency energy to account for unpredictable conditions. The model is simple to apply to various types of electric vehicles and produces results with sufficient precision. A number of driving tests with different road characteristics and weather conditions were implemented to evaluate the success of the proposed method. The findings could help the users feel more confidence when driving EVs, promote the usage of EVs, and advocate for the increased use of green and renewable energy sources.
1. Introduction
Electric vehicles (EV) have emerged as a promising form of sustainable transportation and pollution lowering [1]. The electrified transportation using electric energy storage systems, electric machines, and power electronic converters are improving their technologies at a rapid pace to provide much higher efficiencies. Therefore, the increased use of battery electric vehicles can provide many benefits that include potential independence from oil, reduction of vehicle emissions, and vehicle-to-grid (V2G) technology. Following the prediction from the Lawrence Berkeley National Laboratory (California, USA), the number of electric vehicles will be 6.1 million in 2025 and increase to 19 million vehicles in 2030. The price of an electric vehicle battery will reduce to $62/kWh in 2030 [2], as shown in Figure 1.
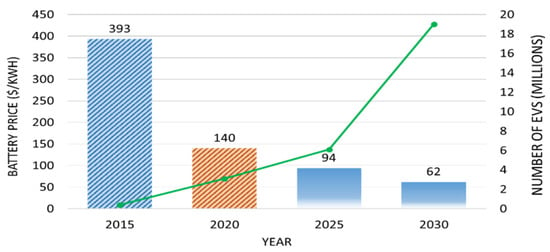
Figure 1.
Battery prices and number of EVs prediction until 2030 [2].
However, people are still hesitant to adopt electric vehicles due to their restricted driving range and long charging time [3]. Vehicle characteristics, driving behaviors, traffic state, road topography and weather conditions may all impact electric vehicle energy consumption, resulting in a reduction in driving range and an increase in charging time. In [4], the authors investigate over 100 million records of real-world taxi routes in different weather conditions to develop a model for estimating the total energy consumption for any time interval. The model showed that the car driving on different routes and weather conditions will have different energy consumption. During the summer, energy use is at its lowest because of the dry weather. Due to the weather being wet and the need to warm the vehicle, EV’s energy consumption increases throughout the winter. In [5], the study develops an energy consumption estimation algorithm for a large scale EV fleet. The articles emphasized that an inaccurate estimation model may limit the overall performance of a fleet management system.
Various studies have been implemented to investigate and build the model to estimate the energy consumption for an electric vehicle with high accuracy. An estimation algorithm is proposed in the paper considering impacting factors such as driving behavior, weather, travel routes, etc. [6]. The author also presented an online model to adjust the energy consumption prediction based on the current conditions. The accuracy of the model is 95%. Another model has been presented in article [7] to obtain an accurate energy consumption estimation based on positive kinetic energy and negative kinetic energy. The model has been tested using real-world traffic conditions to evaluate the model’s application. The other related research can be found in papers [8,9,10,11,12]. The model comparisons are shown in the Table 1.

Table 1.
EV’s energy consumption estimation algorithm comparison from the literature.
The research mentioned above only concentrates on accurately calculating energy consumption and lack a model to calculate the amount of energy required to charge electric vehicles prior the departure time. Additionally, they have not accounted for the energy used by EV’s air conditioners and backup energy for uncertain situations. While methods for measuring energy consumption for electric vehicles are quite accurate, errors can always arise such as traffic jams, roads with many traffic lights, bad weather conditions while traveling, etc. Smart charging technologies are being developed to manage the charging of electric vehicles in order to lower the charging costs and support grid services, which is in line with the rapid speed of change in science and technology [15,16,17,18]. Determining the amount of energy required to charge electric vehicles in advance to support planned trips is a crucial step in planning an EV charging schedule to guarantee a safe trip for users.
This paper proposes a comprehensive model to calculate the amount of energy required to charge electric vehicles for a scheduled trip. The model not only calculates the required energy consumption for the trip, but it also includes contingency energy to compensate for uncertain situations such as traffic, bad weather, AC usage, and so on. The idea of the research is to propose a simplified method that can be easily applied for different kinds of electric vehicles while providing a result within the acceptable precision. The obtained results could help the users feel more confidence while using the EVs, encourage the use of electric vehicles, and promote for the expanded use of green energy sources. The main contribution of this paper are:
- (1)
- Propose a comprehensive model to calculate the amount of energy required to charge electric vehicles prior the departure time.
- (2)
- Applied the proposed method to evaluate the energy consumption of electric vehicles in different road characteristics and weather conditions.
The paper includes four sections: Section 2 reviews the main factors which are impacting mostly on EV’s energy consumption. Section 3 present the detail of the EV’s SOC estimation model. Section 4 will show the application of the proposed model on different road conditions and compares the estimation results with recorded information. Finally, the conclusion is presented in Section 5.
2. Main Factors Impacting EV’s Energy Consumption
To provide a high accuracy estimation model, the primary factors influencing the EV’s energy consumption must be carefully selected. Aside from the vehicle specifications that impacts the most, the energy consumption of the EV varies significantly as a result of various factors such as driving style, road characteristics, traffic, which can be represented by the energy consumption of the driving power, power brake, and power steering, and weather conditions, which can be represented by the energy consumption of the air conditioner [19,20]. Several studies have been conducted based on the construction of the electric vehicle to determine the elements that affect the energy consumption of the EVs. The authors of [21] estimated the energy consumption of an EV using a simple binary model and then identified the main parameters affecting the EV’s energy consumption. The main factors are vehicle specifications, driver behavior, road characteristics, air conditioner (AC) and weather conditions. An investigation from Idaho National Laboratory also agreed that the main factors are vehicle specification and AC. The other components only have little affect [22]. Based on the investigation from the literature, the factors that affect EV’s energy consumption are demonstrated in Figure 2.
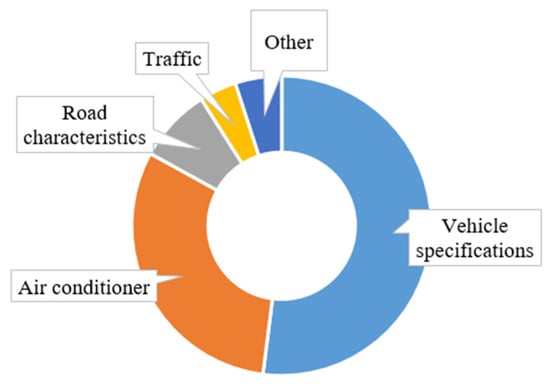
Figure 2.
Factors contribution into the energy consumption [17,18,19,20].
As the energy usage depends on specifications of EV and driving conditions, there is no article that mentions exactly how much each factor contributes to the energy consumption of electric vehicle. Based on the evaluation results mentioned above, it can be seen that there are two main factors that impact on the EV energy usage estimation: AC usage and vehicle specifications. The other factors that have minor impacts will be combined to form one factor: Power losses.
3. A Comprehensive Model for Estimating EV Battery’s SOC for Pre-Defined Trip
As pointed out previously, all prior research has focused only on energy consumption without taking into account a complete model that provided information on how much energy the car required to be charged prior to a scheduled trip. In this paper, a comprehensive model for estimating EV SOC for a pre-defined trip will be implemented. The estimation process is carried out using Python programing language and implemented in two steps, as shown in Figure 3.
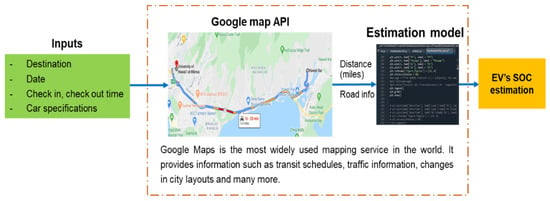
Figure 3.
Three-step EV’s SOC estimation for a pre-identified trip process.
- Step 1: Collect trip information using Google map API.
- Step 2: Estimate the electric vehicle’s energy consumption based on the pre-identified trip information.
- Step 3: Estimate the essential EV battery’s Stage of Charge (SOC) which is required to make the trip.
3.1. Step 1—Collect Trip Information Using Google Map
Google Map is a digital map service provided by the Google Corporation. Google map is widely used and getting increasingly popular in our daily lives. Users may simply search for address, look for directions, and determine the distance between locations using Google Maps [23]. In this paper, based on the destination of the pre-scheduled trip, Google Maps was utilized to calculate the distance of the trip and identify road specifications for the estimation program, as shown in Figure 4.
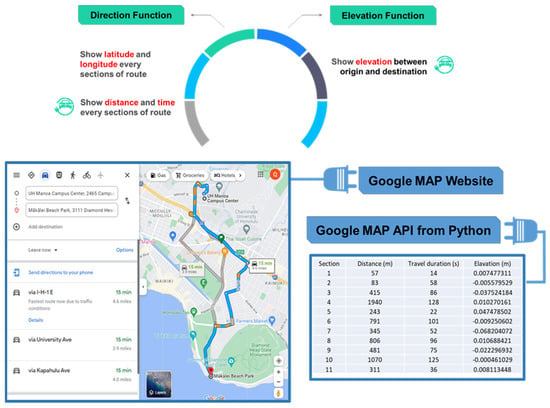
Figure 4.
Trip information provided by Google Maps.
Normally, the energy consumption can be predicted using the averge travel distance and averge route elevation. However, each different road segment will have a different elevation and speed limit. If the car is traveling downhill, it will need to use the break to slow down, so the travel time will be longer. If the car is traveling uphill, the car will need to consume more energy to accelerate the vehicle. In the residential area, the speed limit is 25 mL/h, so the EV’s energy consumption is also different compared to traveling in the highway [24,25,26]. Through the Google Maps, each EV’s travel route are divided into small sections based on street information and travel directions. The model will collect information of these sections and do energy estimation for each sections to increase the accuracy of the estimated model. The sections information can be obtained by using the following commands, as shown in Figure 5 [27]:

Figure 5.
Commands to get sections information of the route in Python.
The data in each section includes distance, travel duration and elavation. The estimating program will calculate energy consumption of each section then accumulate them up to get the most accurate results. There are two python functions created to get information from Google map platforms: Direction function and Elevation function. The direction function will use the coordinates of the departure and destination to get the travel distance and travel duration for every sections of the route. The elavation function is used to obtain the elevation between the departure and destination. The direction and elavation information can be obtained by using the following commands, as shown in Figure 6 [27]:
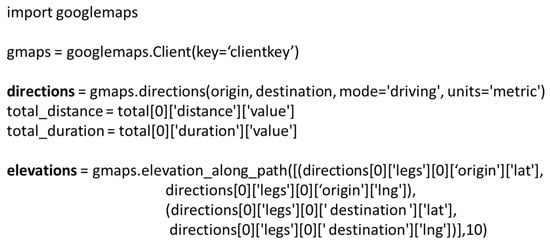
Figure 6.
Direction and elevation commands in Python.
3.2. Step 2—Estimate the Electric Vehicle’s Energy Consumption
The energy consumption (EEVconsumption) is estimated using the estimation energy consumption model in article [6,7], as shown in the following equation:
where Edriving is energy consumption from driving the car (Wh). EA/C is the energy consumption from air conditioner (Wh); Elosses is other energy losses estimated as 5% (Wh).
EEVconsumption = Edriving + EA/C + Elosses
According to the papers, the energy consumption prediction model is 95% accurate. However, the authors did not specify how reliable the results were when driving with air conditioning. The energy consumed by the air conditioning unit is the most challenging factor to predict. This factor is highly dependent on uncontrollable parameters such as the ambient temperature, the temperature inside the vehicle when it is first started, and the number of passengers inside the car, etc.
In [28], it demonstrated that the air conditioner energy consumption could account up to 30–35% EV’s energy consumption and the energy losses eat up to 2–5%. Therefore, total energy consumption for EV can be shown in the following equation:
where α is the energy consumption coefficient, which is in the range from 1.30 to 1.65 depending on the user’s driving experience and depends on the vehicle specifications.
EEVconsumption = α × Edriving
The driving energy consumption (Edriving) model can be estimated using four terms of force in the following equation:
where Froll is rolling resistance force (N). Fdrag is aerodynamic drag force (N). Fhill is hill climbing force (N); Facceleration is acceleration force (N). is velocity (); and is the travel duration (s).
The equation can be rewritten as follow:
where is vehicle mass (); is gravitational force (); is rolling resistance coefficient; is hill angle (°); is density of the air (); is drag coefficient; is frontal area of electric vehicle (); is velocity (); is inertia of the wheel (); is tyre radius (); is inertia of motor (); is gear ratio; and is acceleration ().
It should be noted that the kinetic energy during braking will be converted back to electricity and storage to the battery when the EV is decelerating or downhill running. In this case, the driving range of the EVs can be extended up to 10%. It means that the energy consumption will reduce or might be negative [29]. However, it is also noted that these benefits are not quite as significant as expected as a result of the power conversion processes’ inefficiencies [30]. Due to the contribution of this conversion energy being minor, the proposed model will set the negative estimation SOC change during braking to zero.
3.3. Step 3—Estimate the Electric Vehicle’s Battery S
The SOC estimation for the EV’s scheduled trip is determined by dividing the estimated energy consumption of the EV for the trip by the EV’s battery capacity. The formulation is presented simply in the following equation:
SOCcontingency is the additional SOC that is proposed to cover uncertainty situations. This parameter is determined based on user’s driving experience and vehicle specification. It can equal 20–40% of the current estimated SOC for the trip.
4. Applications
To assess the effectiveness of the proposed model, thirteen various driving tests with different road conditions were implemented using Nissan Leaf 2019. The predicted SOC for each trip was calculated using two different estimation models:
- The estimation model in paper [6].
- The proposed model in this paper.
The results were then compared with the actual SOC changes during the trip to make sure that the result would cover uncertainty situations (traffic, hot temperature, road conditions, etc.) that could happen during the trip. Car specifications are described in Table 2.

Table 2.
Nissan Leaf 2019 specification.
Test 1: Driving test in Oahu island, Hawaii from University of Hawaii at Manoa (21.297673, −57.820036) to Tantalus Lookout (21.314080, −157.822237). The vehicle’s energy consumption is significantly influenced by the elevation of the route due to the high slope of this road and the need to constantly accelerate to reach the peak. The travel route of the EV is shown in Figure 7.
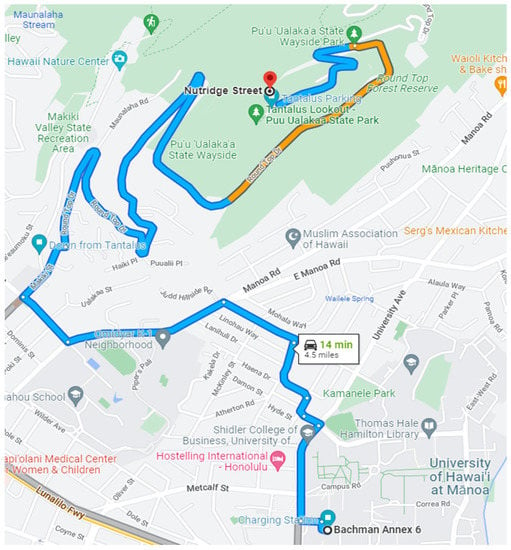
Figure 7.
Route from University of Hawaii at Manoa to Tantalus Lookout on Google Map.
Based on the extracted information from Google map, the route is divided into 12 sections. Each section will have an estimated distance, travel duration and elevation. The method that road sections are typically divided depends on the types of roadways, such as rail, footpath, local road, highway road, etc. The division of these routes has no specific limit and is done by Google Maps by gathering actual data and additional modifications from Google Maps users [31]. Using the estimation model in Section 3, the SOC change for each section is estimated as shown in Table 3.

Table 3.
SOC estimation in each route’s section.
The positive SOC in most sections indicates that the EV is consuming energy. On a steep hill that requires breaking to manage the speed, the EV will recover energy back to the battery, that is why the SOC estimation is negative in Section 9. The estimated SOC from the model in [6] is 9.06% and the estimated SOC of the proposed model is 11.33%. This estimation result is compared to the recorded data from test driving and shown in Table 4.

Table 4.
The comparison of the estimated data with the recorded data.
It can be seen that, there is an error between estimation with recorded data. However, the estimated SOC of the proposed model has covered the actual energy consumption for the trip. With the result from the model in [6], the EV may not have enough energy for the trip if something goes wrong. Therefore, the proposed model is pretty accurate.
To prove the effectiveness of the model, 12 other trips were implemented. The recorded data for each trip included:
- R1: Ambiance temperature (F)
- R2: A/C temperature (F)
- R3: Distance (m)
- R4: Duration (min)
- R5: Average Speed (m/s)
- R6: Number of Passengers
The detail of the recored data is shown in Table 5.

Table 5.
Recorded data of 12 driving tests.
The final estimated results of travel distances, travel times and SOC changes for the trip are shown in Figure 8.
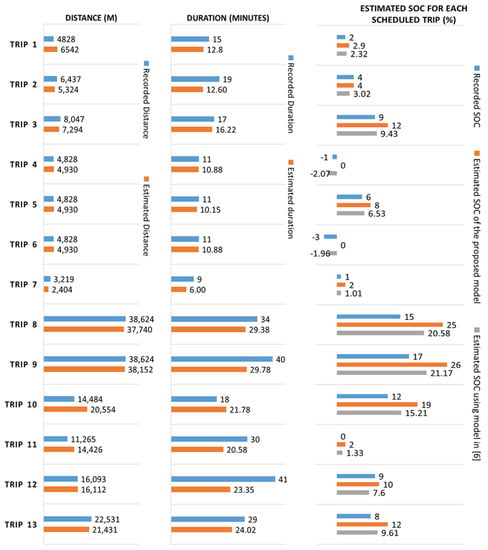
Figure 8.
Comparison of the travel distances, travel times and SOC change for trips under test.
In order to evaluate the estimated data retrieved from Google Map API, the recorded distances and travel durations are compared to the Google Map data estimation by using the following mean absolute percentage error (MAPE) function [32]:
where m is the number of tested cases. Erecorded_i is the recorded values of the i-th test. Eestimated is the estimated values of the i-th test.
Figure 3 shows that the predicted distance for trips based on data provided by Google Maps is quite accurate. The MAPE of distance estimation is 13.25%. However, depending on traffic conditions and driving behaviors, the travel time of each trip may differ from the prediction. The MAPE of travel duration estimation is higher, at 22.65%. As the estimation does not account for uncertainty changes in reality, the target of the proposed model is to cover energy consumption for the whole trip with an acceptable level of redundancy to save user’s charging expenses. Instead of charging full the battery at a high price time, the user can choose to charge enough for the trip and charge more later at a lower price time. The estimated SOC change for each trip will be evaluated based on the number of times the estimation results are matched or higher than the recorded data. The comparison results are shown in Table 6.

Table 6.
SOC estimation for the trip comparison.
From Table 6, it can be seen that the proposed model can estimate enough energy for 10 out of 12 trips, only two trips number two and number seven have incorrect estimation. Meanwhile, the estimation model in [6] can only estimate enough energy for 9 out of 12 trips. It also can be observed that the incorrect results only happen with very short trip which is too low for the addition energy to cover. The error is also minor, so it is not a major issue. For long trips, all the estimated energy can cover well the demand. This demonstrates that the proposed model is fairly efficient and reliable.
5. Conclusions
The paper proposed a complete model to estimate the SOC change for the trip, another definition of energy consumption requirement for a pre-determined trip. By reviewing the state of the art current literature, there are two main factors impacting on the energy consumption of an electric vehicle, air conditioner usage and EV specifications. After comparing the retrieved results from proposed model with the recorded driving data, it can be seen that the proposed model provides a good estimation with approximately 83% accuracy to cover the energy consumption for the trip, including the uncertainty conditions that could happen while traveling. The model is efficient, reliable, and can be easily applied for the smart charging control system to estimate the essential energy for the trip without over charging the battery and to save the overcharging expenses for drivers.
For further work, the author will continuously improve the model to provide better results. The expanded applications on different roads and weather conditions will be implemented to prove the efficiency of the proposed model.
Author Contributions
Conceptualization, Q.T.T. and L.R.; methodology, Q.T.T.; software, Q.T.T., C.V., K.T. and K.N.; validation, Q.T.T.; formal analysis, Q.T.T., C.V., K.T. and K.N.; writing—original draft preparation, Q.T.T.; writing—review and editing, Q.T.T.; visualization, Q.T.T.; supervision, L.R.; project administration, L.R. All authors have read and agreed to the published version of the manuscript.
Funding
This research received no external funding.
Institutional Review Board Statement
Not applicable.
Informed Consent Statement
Not applicable.
Data Availability Statement
Not applicable.
Conflicts of Interest
The authors declare no conflict of interest.
Abbreviations
| SOC | State of charge |
| GHG | GreenHouse Gas |
| EV | Electric vehicle |
| V2G | vehicle-to-grid |
| API | Application Programming Interface |
| AC | Air conditioner |
| MAPE | Mean absolute percentage Error |
| EEVconsumption | The energy consumption |
| Edriving | energy consumption from driving the car |
| EA/C | the energy consumption from air conditioner |
| Elosses | other energy losses |
| Edriving | The driving energy consumption |
| Froll | rolling resistance force |
| Fdrag | aerodynamic drag force |
| Fhill | hill climbing force |
| Facceleration | acceleration force |
| velocity | |
| he travel duration | |
| vehicle mass | |
| gravitational force | |
| rolling resistance coefficient | |
| hill angle | |
| density of the air | |
| drag coefficient | |
| frontal area of electric vehicle | |
| inertia of the wheel | |
| tyre radius | |
| inertia of motor | |
| gear ratio | |
| acceleration |
References
- Richter, J.L. A circular economy approach is needed for electric vehicles. Nat. Electron. 2022, 5, 5–7. [Google Scholar] [CrossRef]
- Rauwald, B.E.C. Costly Electric Vehicles Confront a Harsh Coronavirus Reality. 2020. Available online: https://www.bloomberg.com/news/articles/2020-05-26/can-vw-s-and-tesla-s-electric-vehicle-goals-survive-coronavirus?leadSource=uverify%20wall (accessed on 20 November 2022).
- Sanguesa, J.A.; Torres-Sanz, V.; Garrido, P.; Martinez, F.J.; Marquez-Barja, J.M. A Review on Electric Vehicles: Technologies and Challenges. Smart Cities 2021, 4, 372–404. [Google Scholar] [CrossRef]
- Miraftabzadeh, S.M.; Longo, M.; Foiadelli, F. Estimation Model of Total Energy Consumptions of Electrical Vehicles under Different Driving Conditions. Energies 2021, 14, 854. [Google Scholar] [CrossRef]
- Fotouhi, A.; Shateri, N.; Laila, D.S.; Auger, D.J. Electric vehicle energy consumption estimation for a fleet management system. Int. J. Sustain. Transp. 2021, 15, 40–54. [Google Scholar] [CrossRef]
- Wang, J.; Besselink, I.; Nijmeijer, H. Battery electric vehicle energy consumption prediction for a trip based on route information. Proc. Inst. Mech. Eng. Part D J. Automob. Eng. 2017, 232, 1528–1542. [Google Scholar] [CrossRef]
- Qi, X.; Wu, G.; Boriboonsomsin, K.; Barth, M.J. Data-driven decomposition analysis and estimation of link-level electric vehicle energy consumption under real-world traffic conditions. Transp. Res. Part D Transp. Environ. 2018, 64, 36–52. [Google Scholar] [CrossRef]
- Croce, A.I.; Musolino, G.; Rindone, C.; Vitetta, A. Energy consumption of electric vehicles: Models’ estimation using big data (FCD). Transp. Res. Procedia 2020, 47, 211–218. [Google Scholar] [CrossRef]
- Ullah, I.; Liu, K.; Yamamoto, T.; Zahid, M.; Jamal, A. Electric vehicle energy consumption prediction using stacked generalization: An ensemble learning approach. Int. J. Green Energy 2021, 18, 896–909. [Google Scholar] [CrossRef]
- Hulagu, S.; Celikoglu, H.B. Electric Vehicle Location Routing Problem With Vehicle Motion Dynamics-Based Energy Consumption and Recovery. IEEE Trans. Intell. Transp. Syst. 2022, 23, 10275–10286. [Google Scholar] [CrossRef]
- Sanguesa, J.A.; Garrido, P.; Martinez, F.J.; Marquez-Barja, J.M. Analyzing the Impact of Roadmap and Vehicle Features on Electric Vehicles Energy Consumption. IEEE Access 2021, 9, 61475–61488. [Google Scholar] [CrossRef]
- Madhusudhanan, A.K.; Na, X. Effect of a traffic speed based cruise control on an electric vehicle’ s performance and an energy consumption model of an electric vehicle. IEEE/CAA J. Autom. Sin. 2020, 7, 386–394. [Google Scholar] [CrossRef]
- Yao, E.; Yang, Z.; Song, Y.; Zuo, T. Comparison of Electric Vehicle’s Energy Consumption Factors for Different Road Types. Discret. Dyn. Nat. Soc. 2013, 2013, 328757. [Google Scholar] [CrossRef]
- Wang, J.; Besselink, I.; Nijmeijer, H. Electric Vehicle Energy Consumption Modelling and Prediction Based on Road Information. World Electr. Veh. J. 2015, 7, 447–458. [Google Scholar] [CrossRef]
- El-Bayeh, C.Z.; Alzaareer, K.; Aldaoudeyeh, A.-M.I.; Brahmi, B.; Zellagui, M. Charging and Discharging Strategies of Electric Vehicles: A Survey. World Electr. Veh. J. 2021, 12, 11. [Google Scholar] [CrossRef]
- Qu, Z.; Song, J.; Liu, Y.; Lv, H.; Hu, K.; Sun, J.; Li, M.; Liu, W.; Cui, M.; Wang, W. Optimization Model of EV Charging and Discharging Price Considering Vehicle Owner Response and Power Grid Cost. J. Electr. Eng. Technol. 2019, 14, 2251–2261. [Google Scholar] [CrossRef]
- Das, R.; Wang, Y.; Busawon, K.; Putrus, G.; Neaimeh, M. Real-time multi-objective optimisation for electric vehicle charging management. J. Clean. Prod. 2021, 292, 126066. [Google Scholar] [CrossRef]
- Jin, H.; Lee, S.; Nengroo, S.H.; Har, D. Development of Charging/Discharging Scheduling Algorithm for Economical and Energy-Efficient Operation of Multi-EV Charging Station. Appl. Sci. 2022, 12, 4786. [Google Scholar] [CrossRef]
- Petersen, P.; Sax, E. A Fully Automated Methodology for the Selection and Extraction of Energy-Relevant Features for the Energy Consumption of Battery Electric Vehicles. SN Comput. Sci. 2022, 3, 1–13. [Google Scholar] [CrossRef]
- Smuts, M.; Scholtz, B.; Wesson, J. A Critical Review of Factors Influencing the Remaining Driving Range of Electric Vehicles. In Proceedings of the 2017 1st International Conference on Next Generation Computing Applications (NextComp), Moka, Mauritius, 19–21 July 2017. [Google Scholar]
- Li, W.; Stanula, P.; Egede, P.; Kara, S.; Herrmann, C. Determining the Main Factors Influencing the Energy Consumption of Electric Vehicles in the Usage Phase. Procedia CIRP 2016, 48, 352–357. [Google Scholar] [CrossRef]
- EV Auxiliary Systems Impacts. 2019. Available online: https://avt.inl.gov/sites/default/files/pdf/fsev/auxiliary.pdf (accessed on 20 November 2022).
- Plantin, J.-C. Digital Traces in Context|Google Maps as Cartographic Infrastructure: From Participatory Mapmaking to Database Maintenance. Int. J. Commun. 2018, 12. [Google Scholar]
- Qi, X.; Zhang, Y. Data-Driven Macroscopic Energy Consumption Estimation for Electric Vehicles with Different Information Availability. In Proceedings of the 2016 International Conference on Computational Science and Computational Intelligence (CSCI), Las Vegas, NV, USA, 15–17 December 2016; pp. 1214–1219. [Google Scholar]
- Braun, A.; Rid, W. Energy consumption of an electric and an internal combustion passenger car. A comparative case study from real world data on the Erfurt circuit in Germany. Transp. Res. Procedia 2017, 27, 468–475. [Google Scholar] [CrossRef]
- Yi, Z.; Bauer, P.H. Sensitivity analysis of environmental factors for electric vehicles energy consumption. In Proceedings of the 2015 IEEE Vehicle Power and Propulsion Conference (VPPC), Montreal, QC, Canada, 19–22 October 2015; pp. 1–6. [Google Scholar]
- Getting Directions through the Directions API. Available online: https://developers.google.com/maps/documentation/directions/get-directions (accessed on 20 November 2022).
- Maljković, M.; Stamenković, D.; Blagojevic, I.; Popovic, V. The Analysis of Available Data on Energy Efficiency of Electric Vehicles to be Used for Eco-Driving Project Development. Sci. Technol. 2019, 18, 504–508. [Google Scholar] [CrossRef]
- Chau, K.T. 21—Pure electric vehicles. In Alternative Fuels and Advanced Vehicle Technologies for Improved Environmental Performance; Folkson, R., Ed.; Woodhead Publishing: Somerset, UK, 2014; pp. 655–684. [Google Scholar]
- Hartley, J.A.A.; McLellan, R.G.; Richmond, J.; Day, A.J.; Campean, I.F. Regenerative braking system evaluation on a full electric vehicle. In Innovations in Fuel Economy and Sustainable Road Transport; Woodhead Publishing: Somerset, UK, 2011; pp. 73–86. [Google Scholar]
- Google Map Platform. Available online: https://developers.google.com/maps/documentation/gaming-/reference/unity/class/google-/maps/feature/segment-metadata (accessed on 20 November 2022).
- Zhang, R.; Yao, E. Electric vehicles’ energy consumption estimation with real driving condition data. Transp. Res. Part D Transp. Environ. 2015, 41, 177–187. [Google Scholar] [CrossRef]
Disclaimer/Publisher’s Note: The statements, opinions and data contained in all publications are solely those of the individual author(s) and contributor(s) and not of MDPI and/or the editor(s). MDPI and/or the editor(s) disclaim responsibility for any injury to people or property resulting from any ideas, methods, instructions or products referred to in the content. |
© 2022 by the authors. Licensee MDPI, Basel, Switzerland. This article is an open access article distributed under the terms and conditions of the Creative Commons Attribution (CC BY) license (https://creativecommons.org/licenses/by/4.0/).