Article

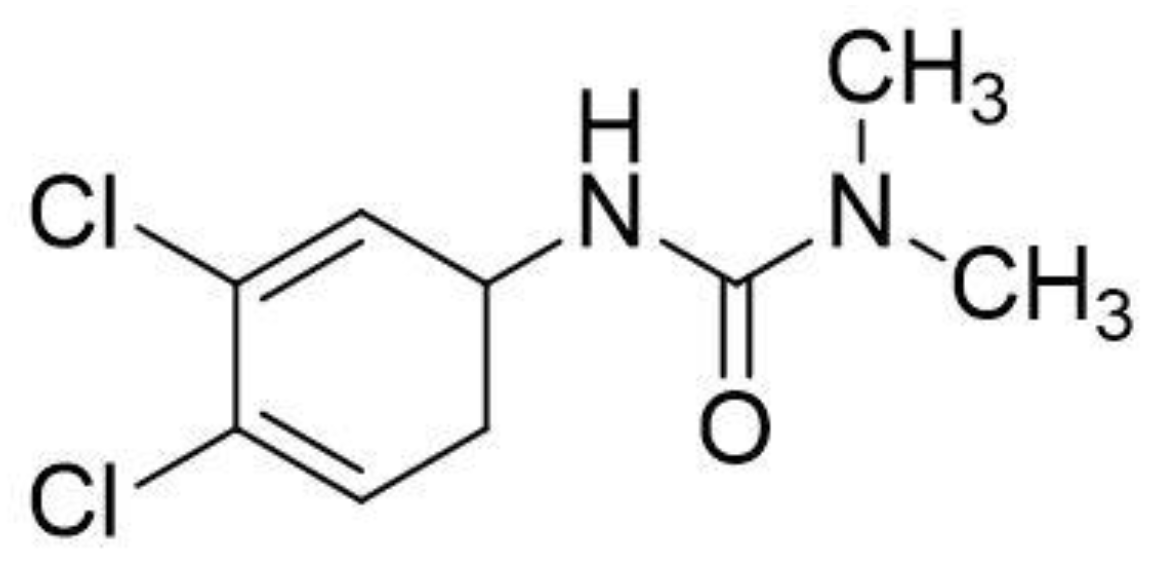
Thermal- and MnO2-Activated Peroxydisulfate for Diuron Removal from Water

1
Department of Engineering, University of Campania Luigi Vanvitelli, 81031 Aversa, Italy
2
Department of Biosciences and Territory, University of Molise, 86090 Pesche, Italy
3
Department of Environmental, Biological and Pharmaceutical Sciences and Technologies, University of Campania Luigi Vanvitelli, 81100 Caserta, Italy
4
Environmental Technologies, University Spin off of University of Campania Luigi Vanvitelli, 81100 Caserta, Italy
*
Author to whom correspondence should be addressed.
Clean Technol. 2022, 4(4), 1071-1087; https://doi.org/10.3390/cleantechnol4040065
Submission received: 14 September 2022 / Revised: 10 October 2022 / Accepted: 17 October 2022 / Published: 19 October 2022
(This article belongs to the Special Issue Advanced Oxidation Processes for Environmental Remediation)

Abstract

:
In this work, a peroxydisulfate (PDS)-based advanced oxidation process was used for removing diuron from water. The effect of heat and MnO2 as PDS activators was explored. It was found that diuron degradation obeyed zero-order kinetics in the presence of heat-activated PDS. The relative contribution of MnO2 to the diuron degradation decreased with the increasing temperature. At the highest temperature investigated, T = 55 °C, complete diuron removal was achieved in less than 75 min. A kinetic model for describing the rate of diuron degradation was proposed and successfully applied to the experimental data.

1. Introduction

In recent years, removing toxic pollutants from impacted water has become a worldwide priority [1]. Among the emerging contaminants, herbicides are a class of compounds widely detected in various water bodies and used as selective inhibitors of plant growth in both agriculture applications and urban utility management [2,3,4]. Diuron [N-(3,4-dichlorophenyl)-N, N-dimethylurea] (see Figure 1) is a broad-spectrum phenyl urea herbicide widely used worldwide as an antifouling agent which can inhibit photosystem II and even lead to the photodestruction of pigments [5]. This compound is chemically stable and persistent in the environment, with a half-life that varies depending on the degradation route [6,7]. According to the contaminant candidate list 3 of the USEPA 2009 and the priority substance list in European Parliament Directive 2013/39/EU, diuron is classified as a carcinogenic and genotoxic compound for human beings, possibly causing kidney illness, anemia, and potential endocrine disorders.
The development of effective methods to remove diuron from water is gaining interest from the scientific community since its contamination of water bodies is currently a serious issue. Conventional treatments, such as biological processes, are generally ineffective and not recommended for removing phenyl urea herbicides from aqueous media [8,9]. The remediation of water contaminated by diuron can be accomplished through different methods including adsorption [10,11,12], coagulation [13], nanofiltration [14], and reverse osmosis [15]. However, each treatment technique has advantages and drawbacks in terms of capital and operational costs, efficiency, user friendliness, pre-treatment requirements, environmental implications, production of sludge, and possible generation of toxic by-products.
Among the alternative methods, advanced oxidation processes (AOPs) are being widely investigated to remove diuron and other organic contaminants from water [16,17,18,19]. AOPs leverage the in situ generation of highly reactive oxidizing species (ROS), including hydroxyl radicals (OH), sulfate radicals (SO4•−), and ozone (O3), which can chemically attack and destroy organic pollutants in solution [20,21]. Recently, sulfate radicals have gained rising attention as adequate oxidants in the chemical oxidation of organics due to their unique properties [22]. SO4•− has good stability in water, is low-cost, has a longer lifetime in solution than other oxidizing species, and is non-selective towards organic compounds [23,24], attacking both saturated and unsaturated bonds [25,26]. Moreover, SO4•− has proven to be very reactive with target compounds under a wide range of pH, between 2.0 and 8.0. In general, SO4•− can be generated by the activation of two main precursors, namely peroxymonosulfate (PMS, HSO5) and peroxydisulfate (PDS, S2O82−) [27]. The generation of SO4•− from PMS and PDS occurs via O-O bond cleavage, a process which requires an activator agent. PMS has a shorter O-O (1.453 Å) bond than PDS (1.497 Å), resulting in a higher bond energy (213 kJ mol−1 vs. 140 kJ mol−1). Consequently, PDS may be more readily broken down (by a catalyst) to generate SO4 [28,29,30]. Moreover, PMS is less stable than PDS and may decompose to SO52− [29]. Notably, PDS cannot directly oxidize organics, but as mentioned above, it requires an activator agent to produce sulfate radicals. Various energy-based and electron transfer-based methods are employed for PDS activation, such as light and UV radiation [31,32], transition metal-based catalysts [33,34,35], alkali [36], and organic acids [37]. Among them, heat activation is a solid and efficient method to activate PDS due to its high SO4 formation rate and simple reaction process. In recent years, many studies have widely reported on herbicides’ degradation (including diuron, simazine, thiamethoxam, and atrazine) using the thermal-activated PDS process [38,39,40,41]. The main drawback of thermal activation is its high energy demand. For this reason, the use of appropriate catalysts in combination with heat has recently attracted the attention of researchers for PDS activation, allowing to operate at lower temperatures and thus reducing the energy costs [42].
Among the different catalysts, MnO2 is promising owing to its efficiency and low environmental impact [43]. MnO2 [44,45] and PDS [38] alone have been investigated in the past for the oxidative removal of diuron from water. However, to our knowledge, very little is known about the combined effect of heat, MnO2, and PDS on diuron’s reactivity.
Based on the above considerations, the aim of the present study was to explore the degradation of diuron in water by MnO2− and heat-activated persulfate. Diuron reactivity was monitored via HPLC and the oxidation efficiency was evaluated by TOC analysis. A kinetic model was proposed to explain the observed rate of diuron degradation.

2. Materials and Methods

2.1. Reagents

All chemicals, including diuron and MnO2, were purchased from Sigma-Aldrich (St. Louis, MO, USA).

2.2. MnO2 Analysis

Milli-Q water dispersions of MnO2 (0.6, 1.2, 1.8, and 2.4 g L−1) were prepared and placed in an ultrasonic water bath (Ultrasons P-Selecta, Barcelona, Spain) for 1 min. Afterwards, dynamic light scattering (DLS) and electrophoretic mobility measurements were carried out to determine the average hydrodynamic diameter, the polydispersity index (PDI), and the ζ-potential values of the samples using a Malvern UK Zetasizer-Nano ZS90 commercial instrument operating with a 4 mW He-Ne laser at a wavelength of 633 nm. The average size and the PDI values were estimated with a fixed detector angle of 90° by cumulant analysis of the autocorrelation function. ζ-potential values were obtained by determining the electrophoretic mobility of the aggregates via laser Doppler velocimetry. The detection angle was 17°. All measurements were performed at 25 °C and in triplicate.
The specific surface area (SSA) of MnO2 was determined using the methylene blue (MB) adsorption method [46]. In brief, ten milliliters of MB aqueous solution (concentration range 3–50 μM) was added to 1 mg of MnO2 in polypropylene vessels (to avoid glass container adsorption) and agitated at 30 rpm and 25 °C until the attainment of the adsorption equilibrium. Afterwards, the samples were centrifuged at 3000 rpm for 10 min and analyzed spectrophotometrically at 665 nm for MB concentration determination. The amount of MB adsorbed at equilibrium per mass of MnO2, q M B , e (mol g−1), was evaluated using the following expression:
q M B , e = C M B , 0 C M B , e m V
where C M B , 0 and C M B , e are the concentrations of MB before contact with the adsorbent and at equilibrium (mol L−1), respectively, and m and V represent the mass of MnO2 (g) and the volume of the liquid phase (L), respectively.
The SSA (expressed in mol g−1) was obtained with the following equation:
S S A = q M B , m a x N A
where q M B , m a x is the maximum adsorption capacity of MnO2 for MB, N A is the Avogadro number, and A is the surface area occupied per molecule of MB (130 Å2).

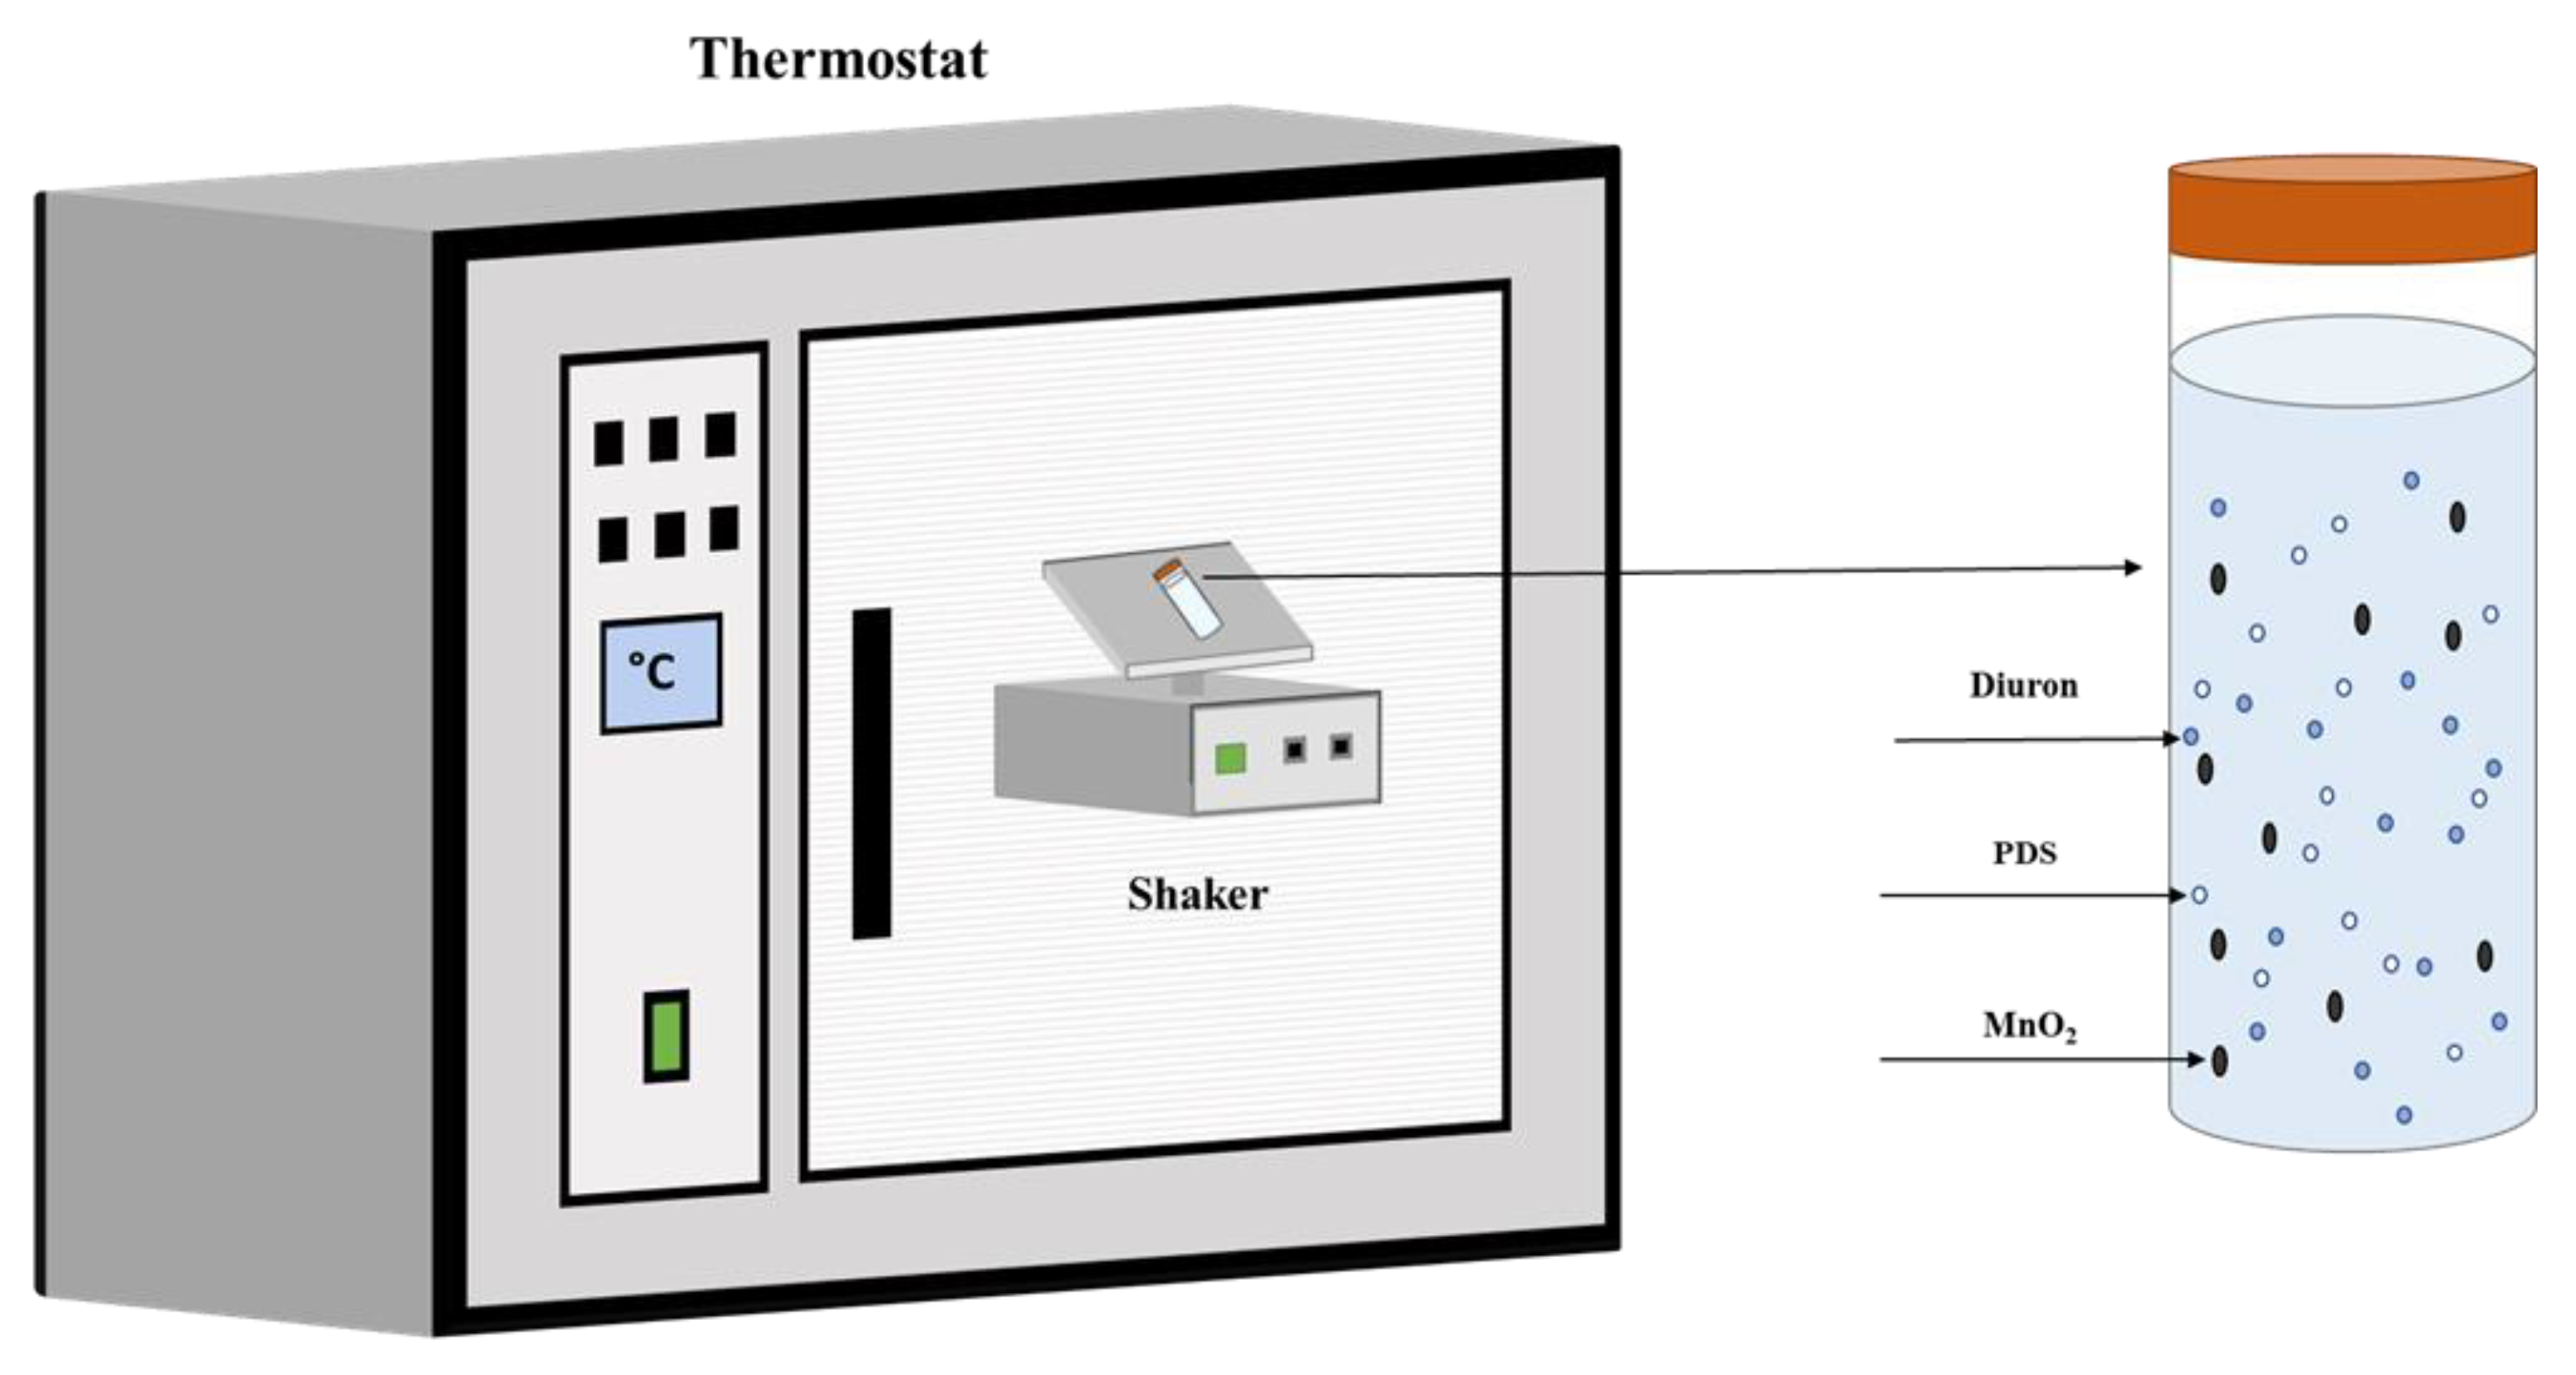
2.3. Diuron Degradation Experiments

Diuron degradation experiments were conducted using the batch method (see Figure 2).
Ten milliliters of Milli-Q water containing 67 μM diuron was contacted with 45 mg of PDS and/or 24 mg of MnO2. The samples were then placed on a shaker at 30 rpm agitation speed and thermostated at 30, 37, 45, and 55 °C. At selected reaction times, a small aliquot of supernatant was collected and analyzed by HPLC-UV using a Waters instrument consisting of a 515 pump system and a 2487 dual-λ detector. Diuron was eluted on a C18 reverse-phase column, and its concentration was monitored at 248 nm with a 64% CH3CN/36% H2O isocratic method and a flow rate of 1 mL min−1.
The residual total organic carbon (TOC) was determined at the end of the experiments using a TOC meter analyzer (3S Analyzers, Avegno (GE), Italy) equipped with a non-dispersive infrared detector for CO2 counting.

3. Results and Discussion

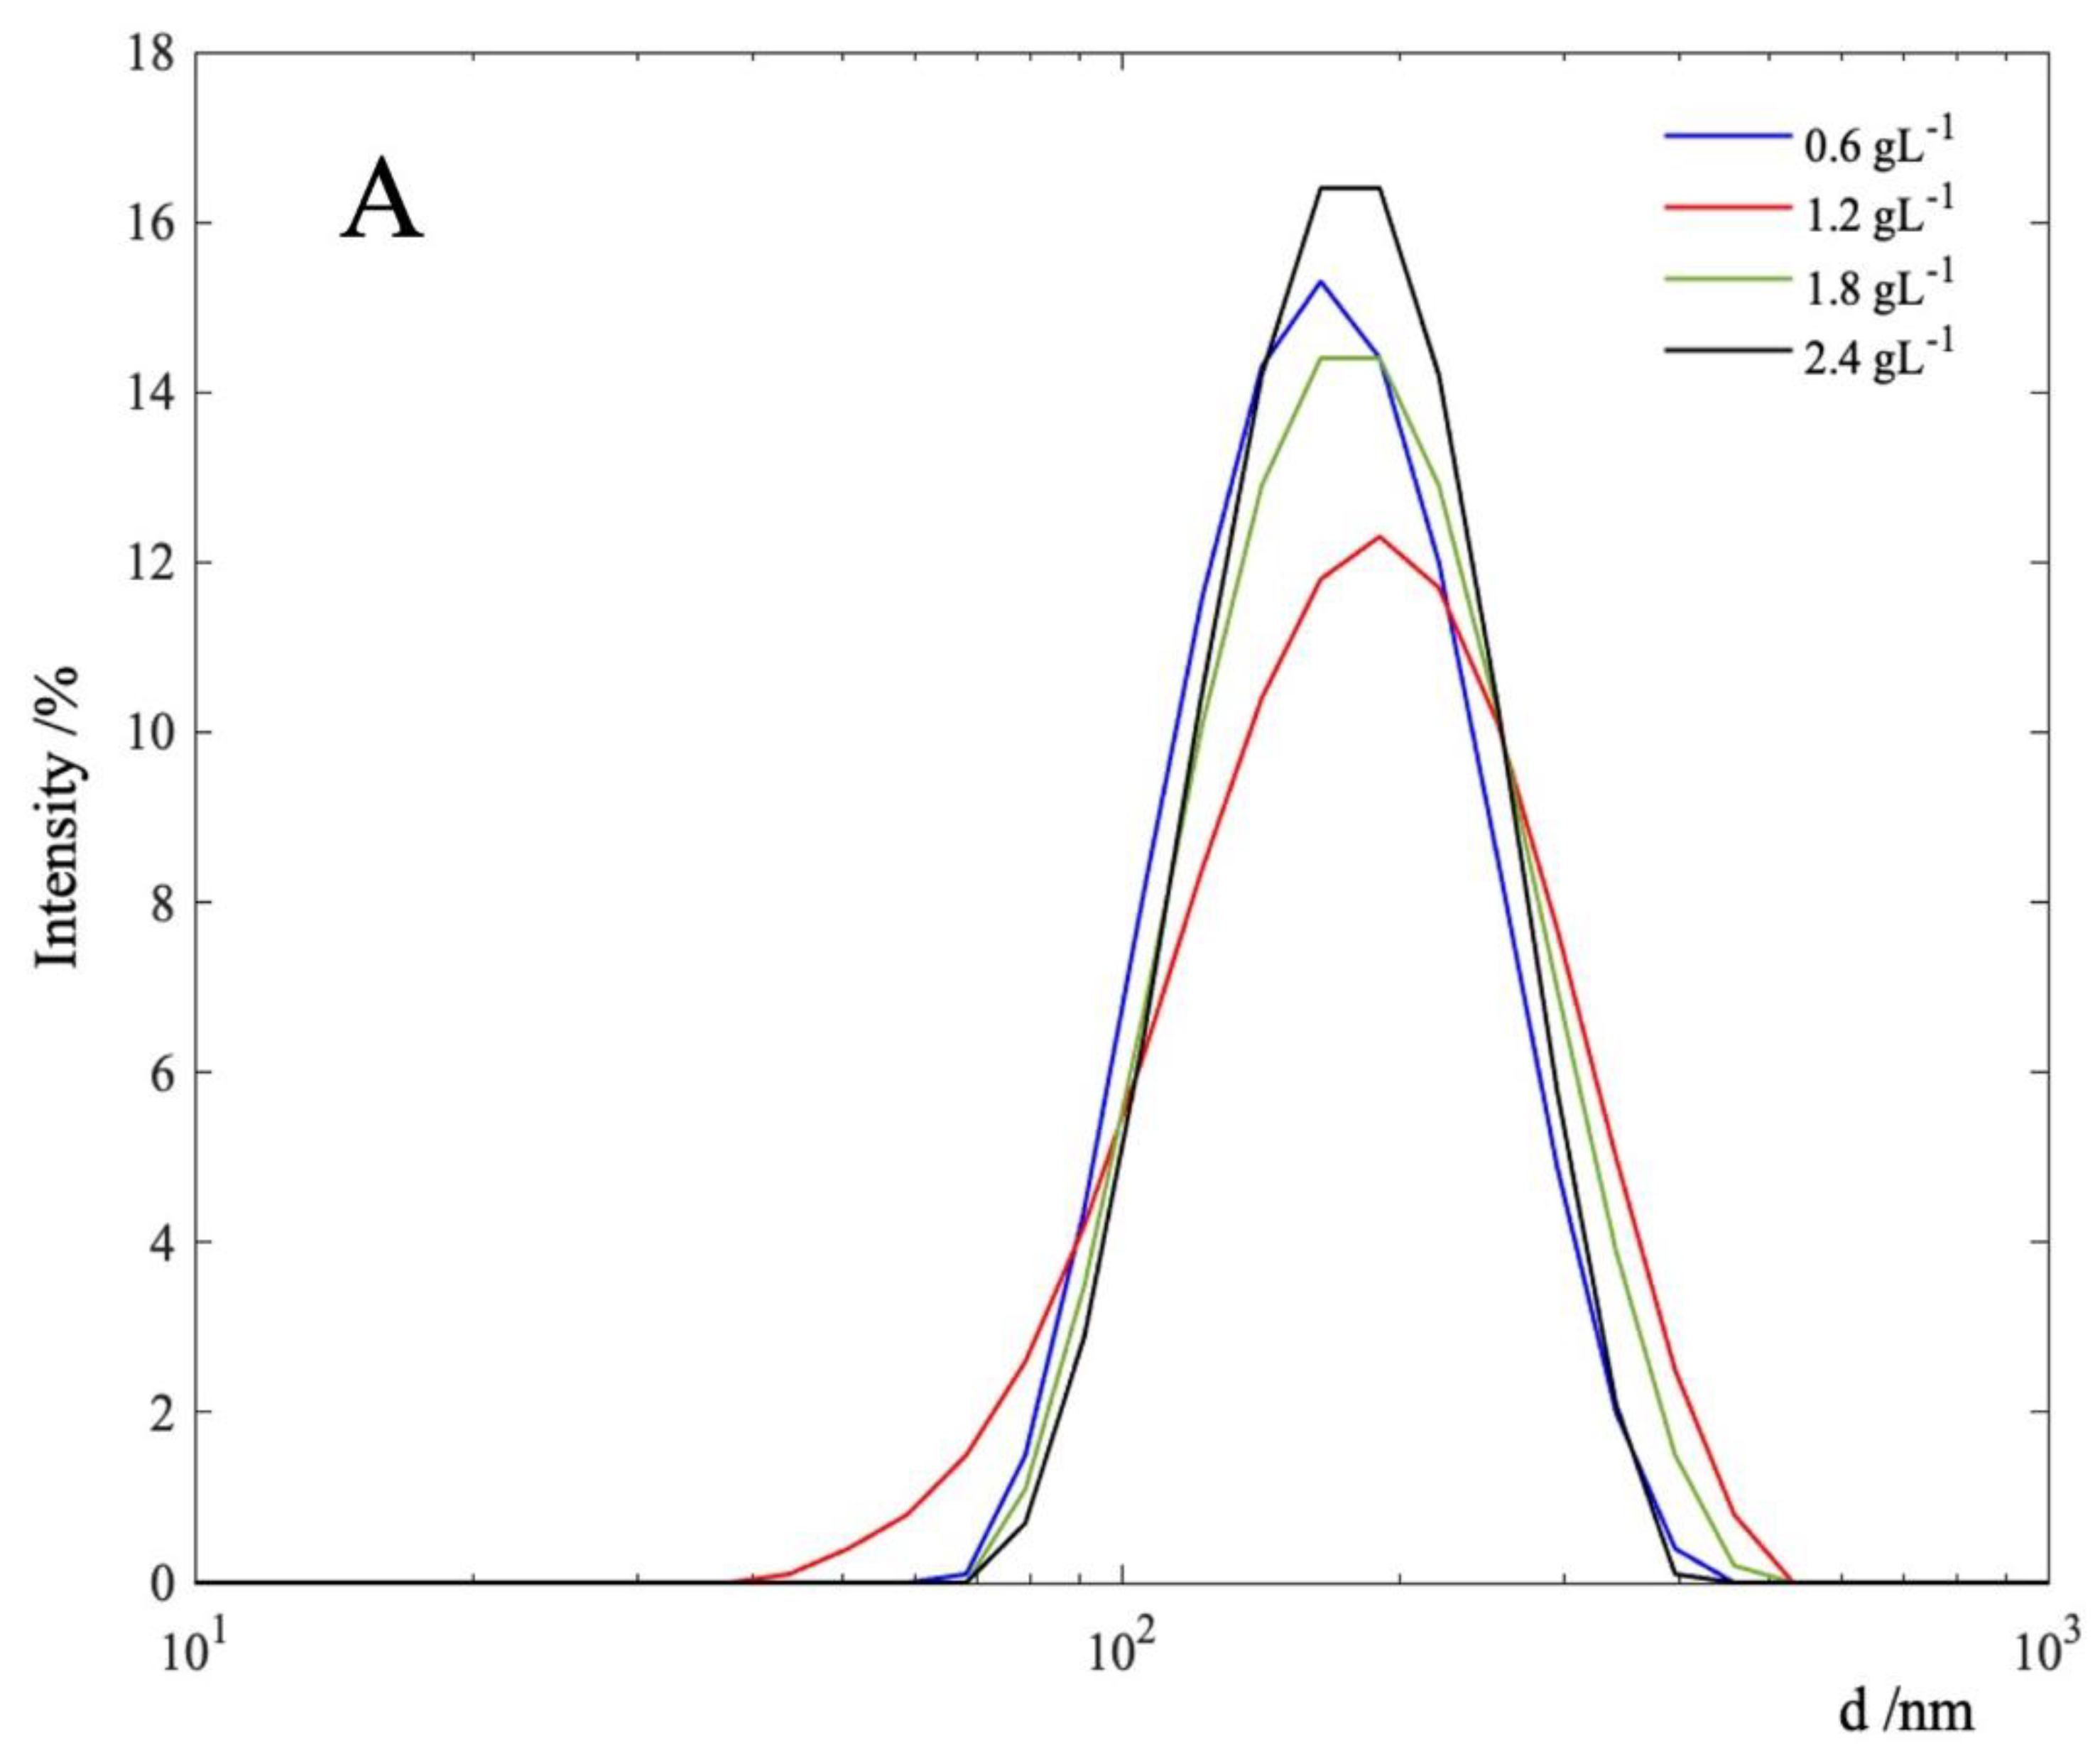
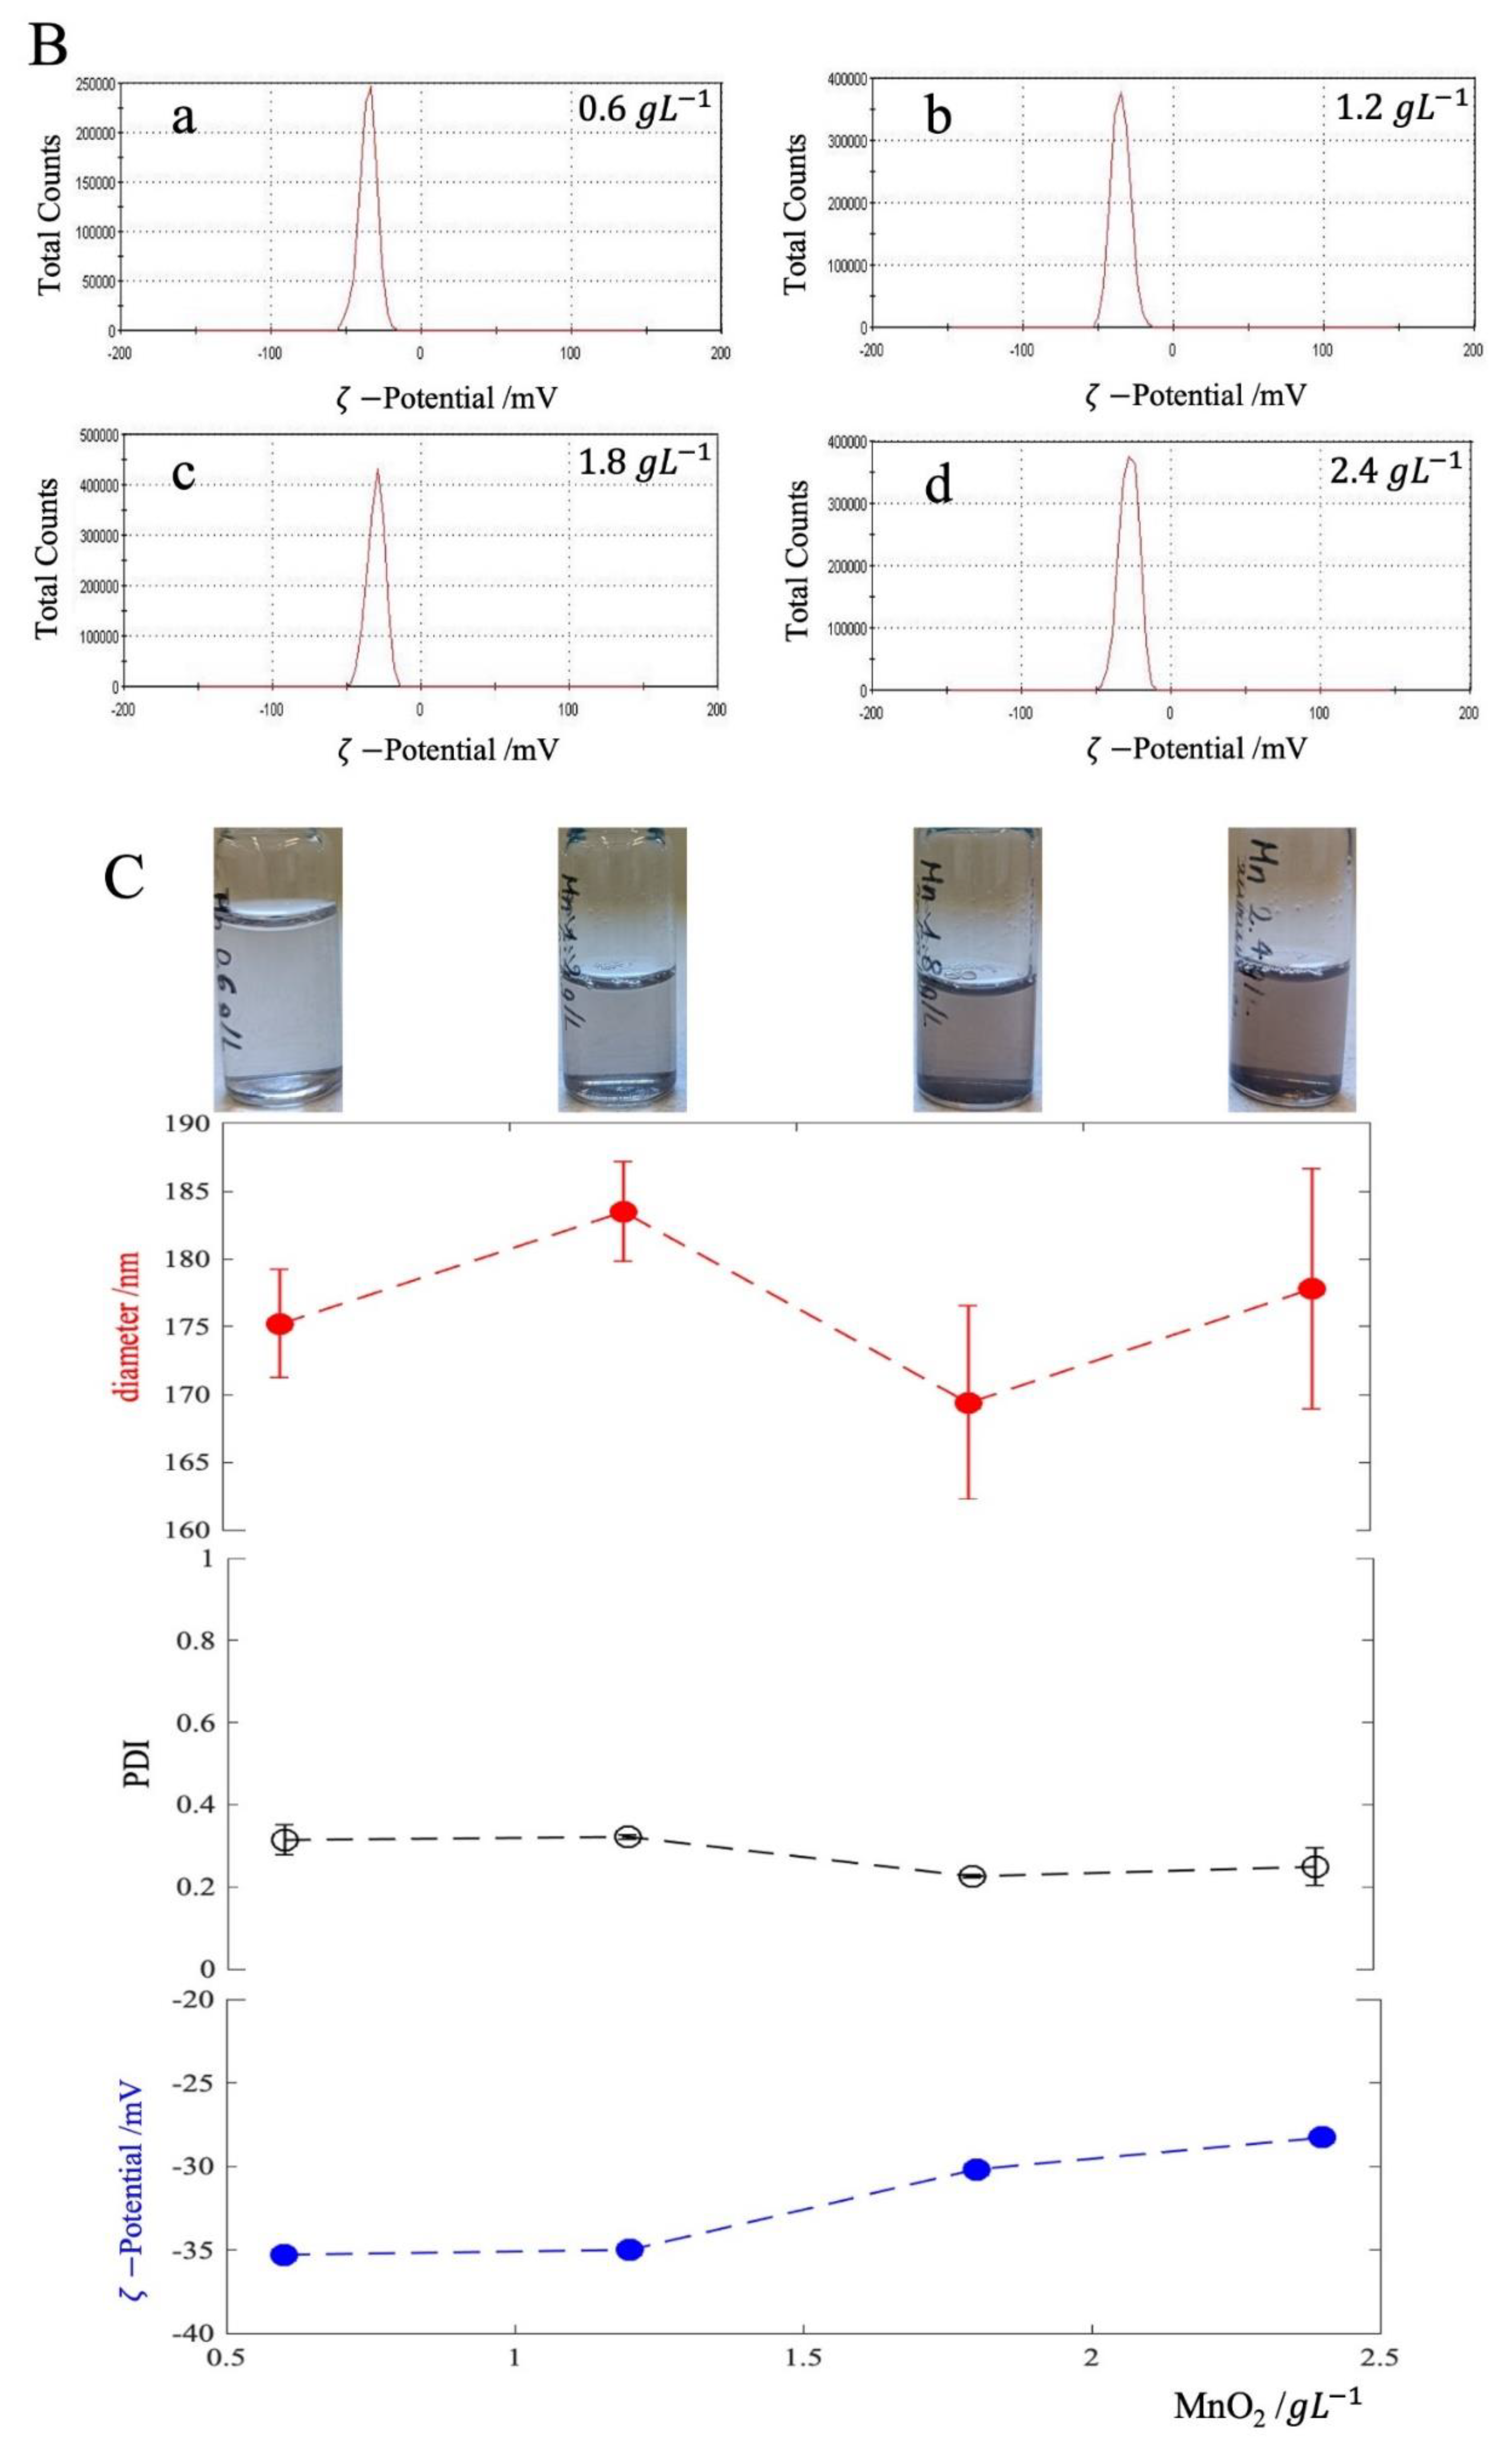
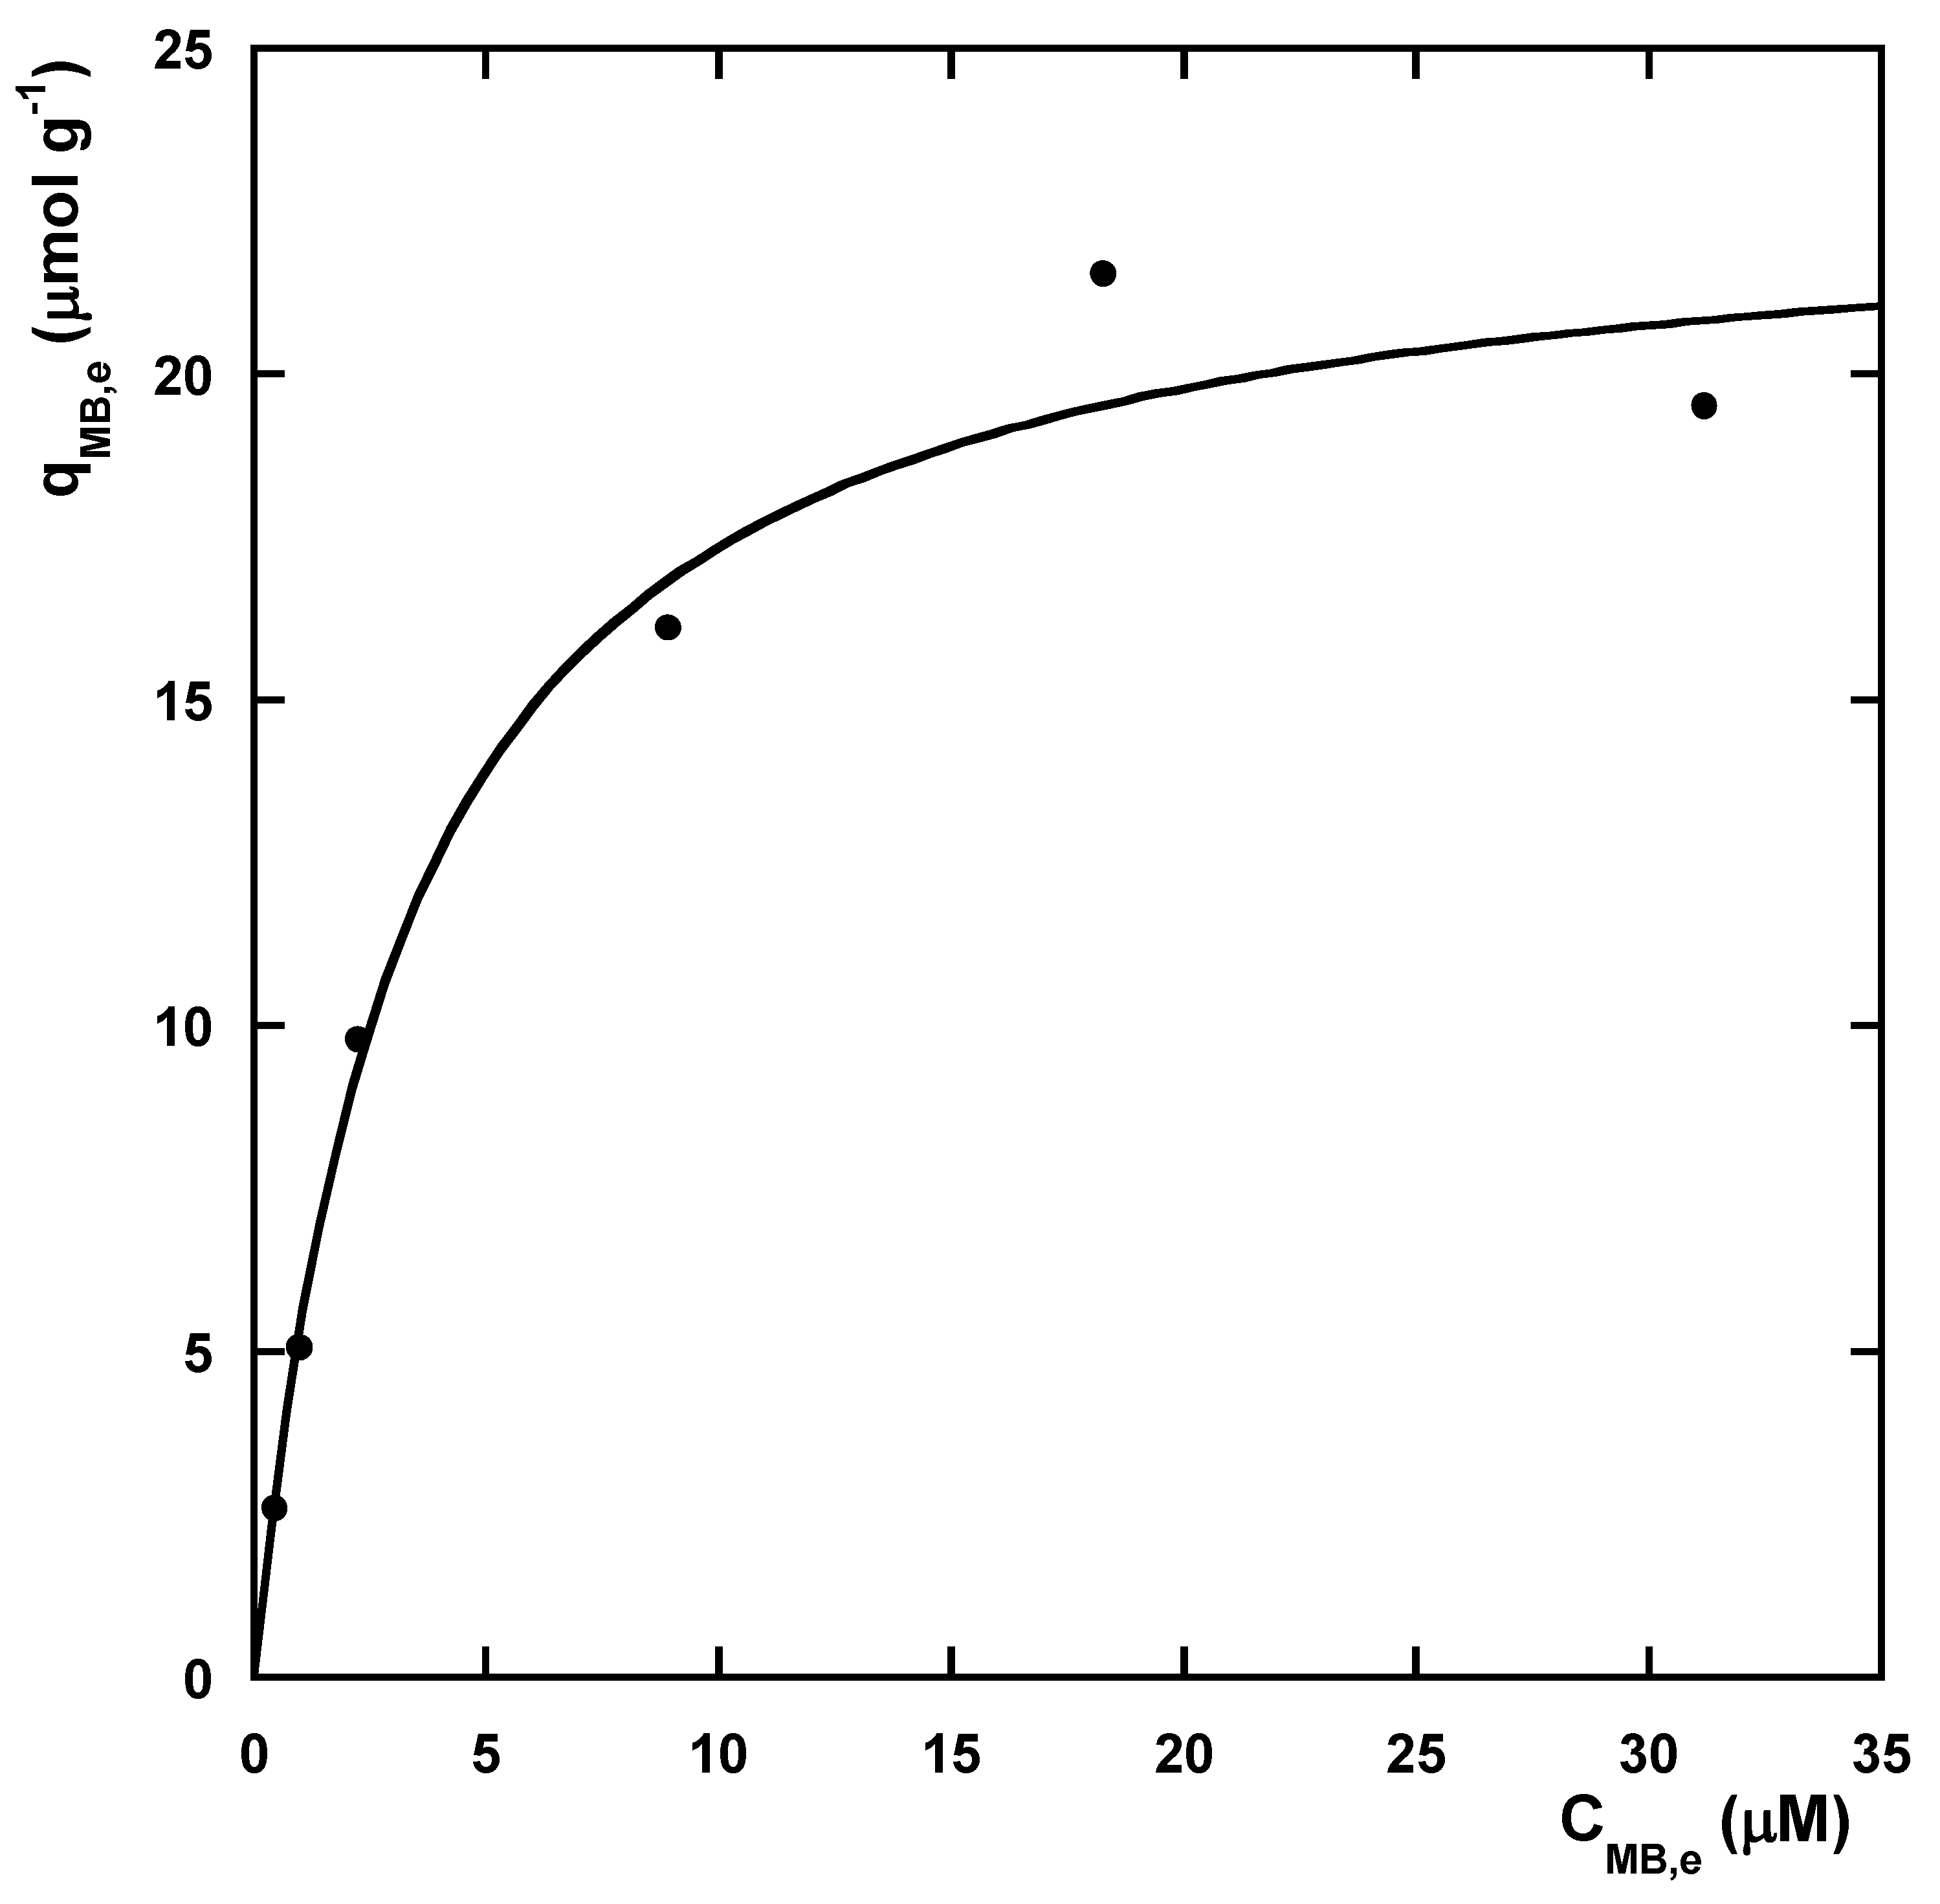
3.1. MnO2 Characterization

The results of the size distribution and ζ-potential measurements of MnO2 samples are displayed in Figure 3. As can be seen, the average hydrodynamic diameter, the PDI, and the surface charge for MnO2 (0.6 g L−1) turned out to be 175.2 ± 4.0 nm, 0.314 ± 0.037, and −35.3 mV, respectively. The size distribution and the PDI of MnO2 did not vary appreciably with MnO2 dosage, whereas the surface charge increased only slightly with increasing the metal oxide content. These results suggest that MnO2 is stable and does not aggregate in solution.
The MB adsorption isotherm onto MnO2 is shown in Figure 4. In order to obtain information on the maximum adsorption capacity of MnO2 for MB ( q M B , m a x ), the data in the figure were modeled by using the Langmuir model [47]:
q M B , e = q M B , m a x K L C M B , e 1 + K L C M B , e
where K L represents the Langmuir equilibrium constant. The obtained q M B , m a x value was 23 ± 1 μmol g−1. As a result, the specific surface area (SSA) of MnO2 turned out to be 18 ± 1 m2 g−1.

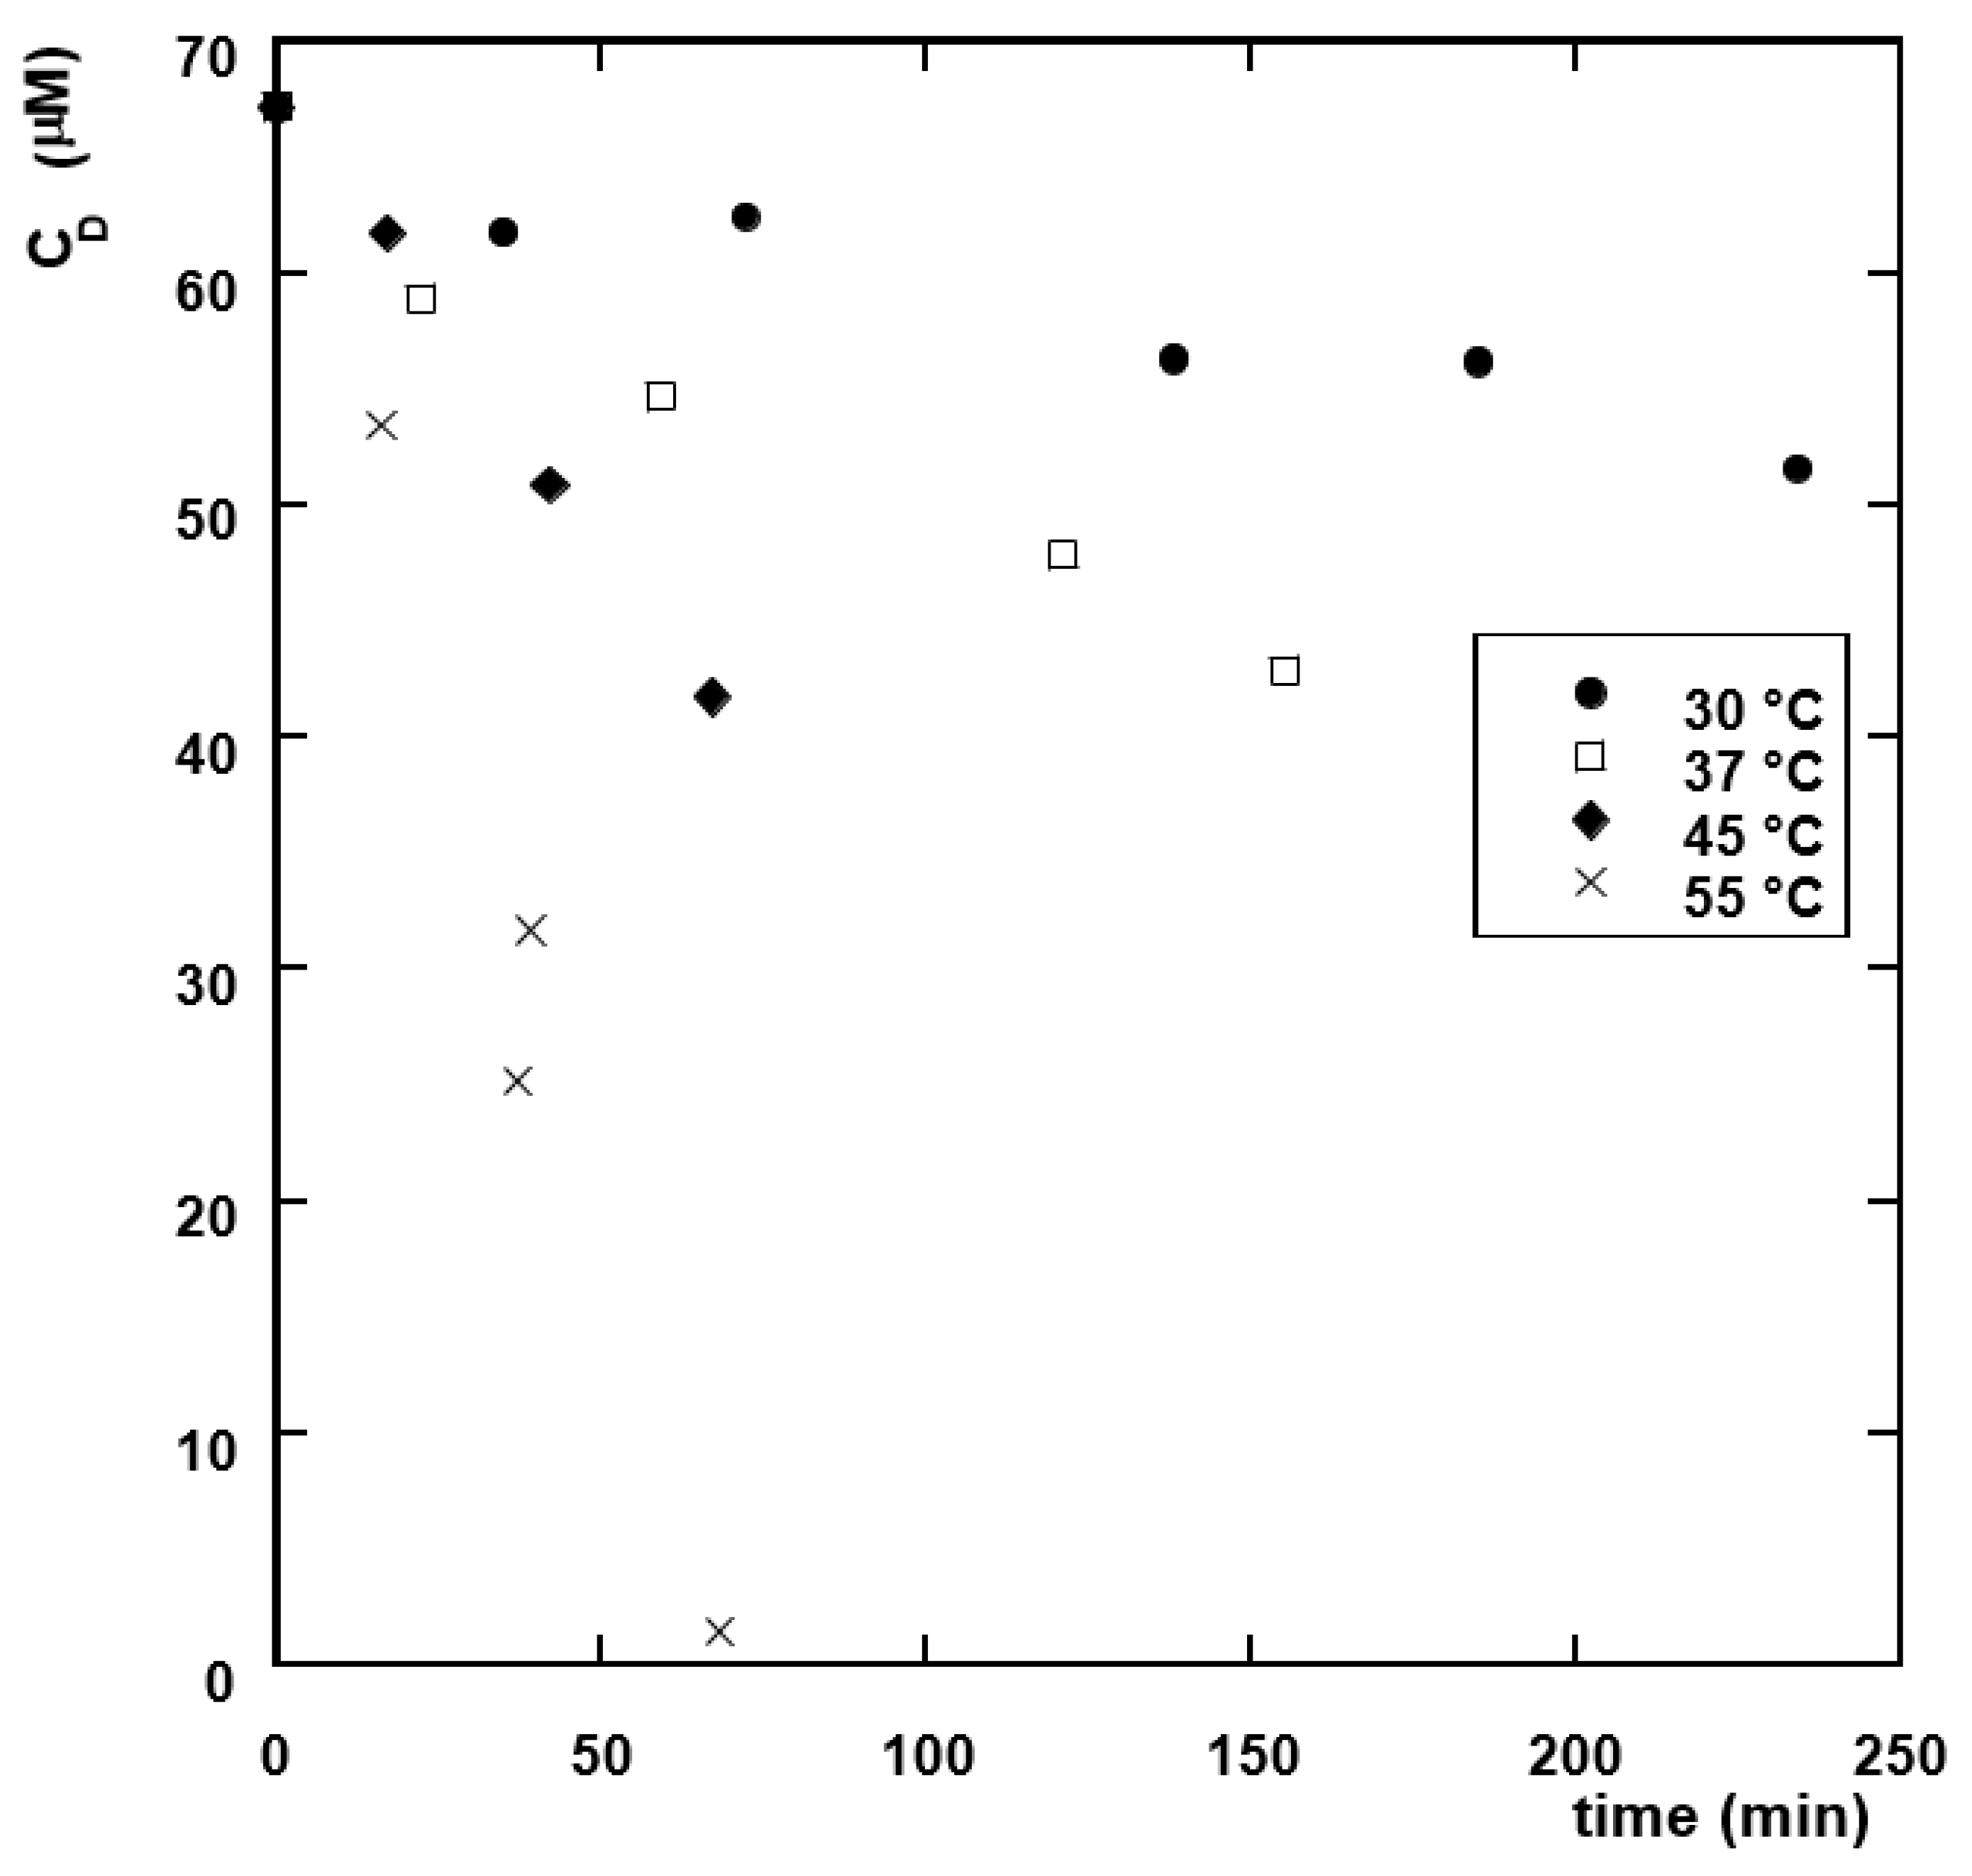
3.2. Diuron Degradation Kinetics

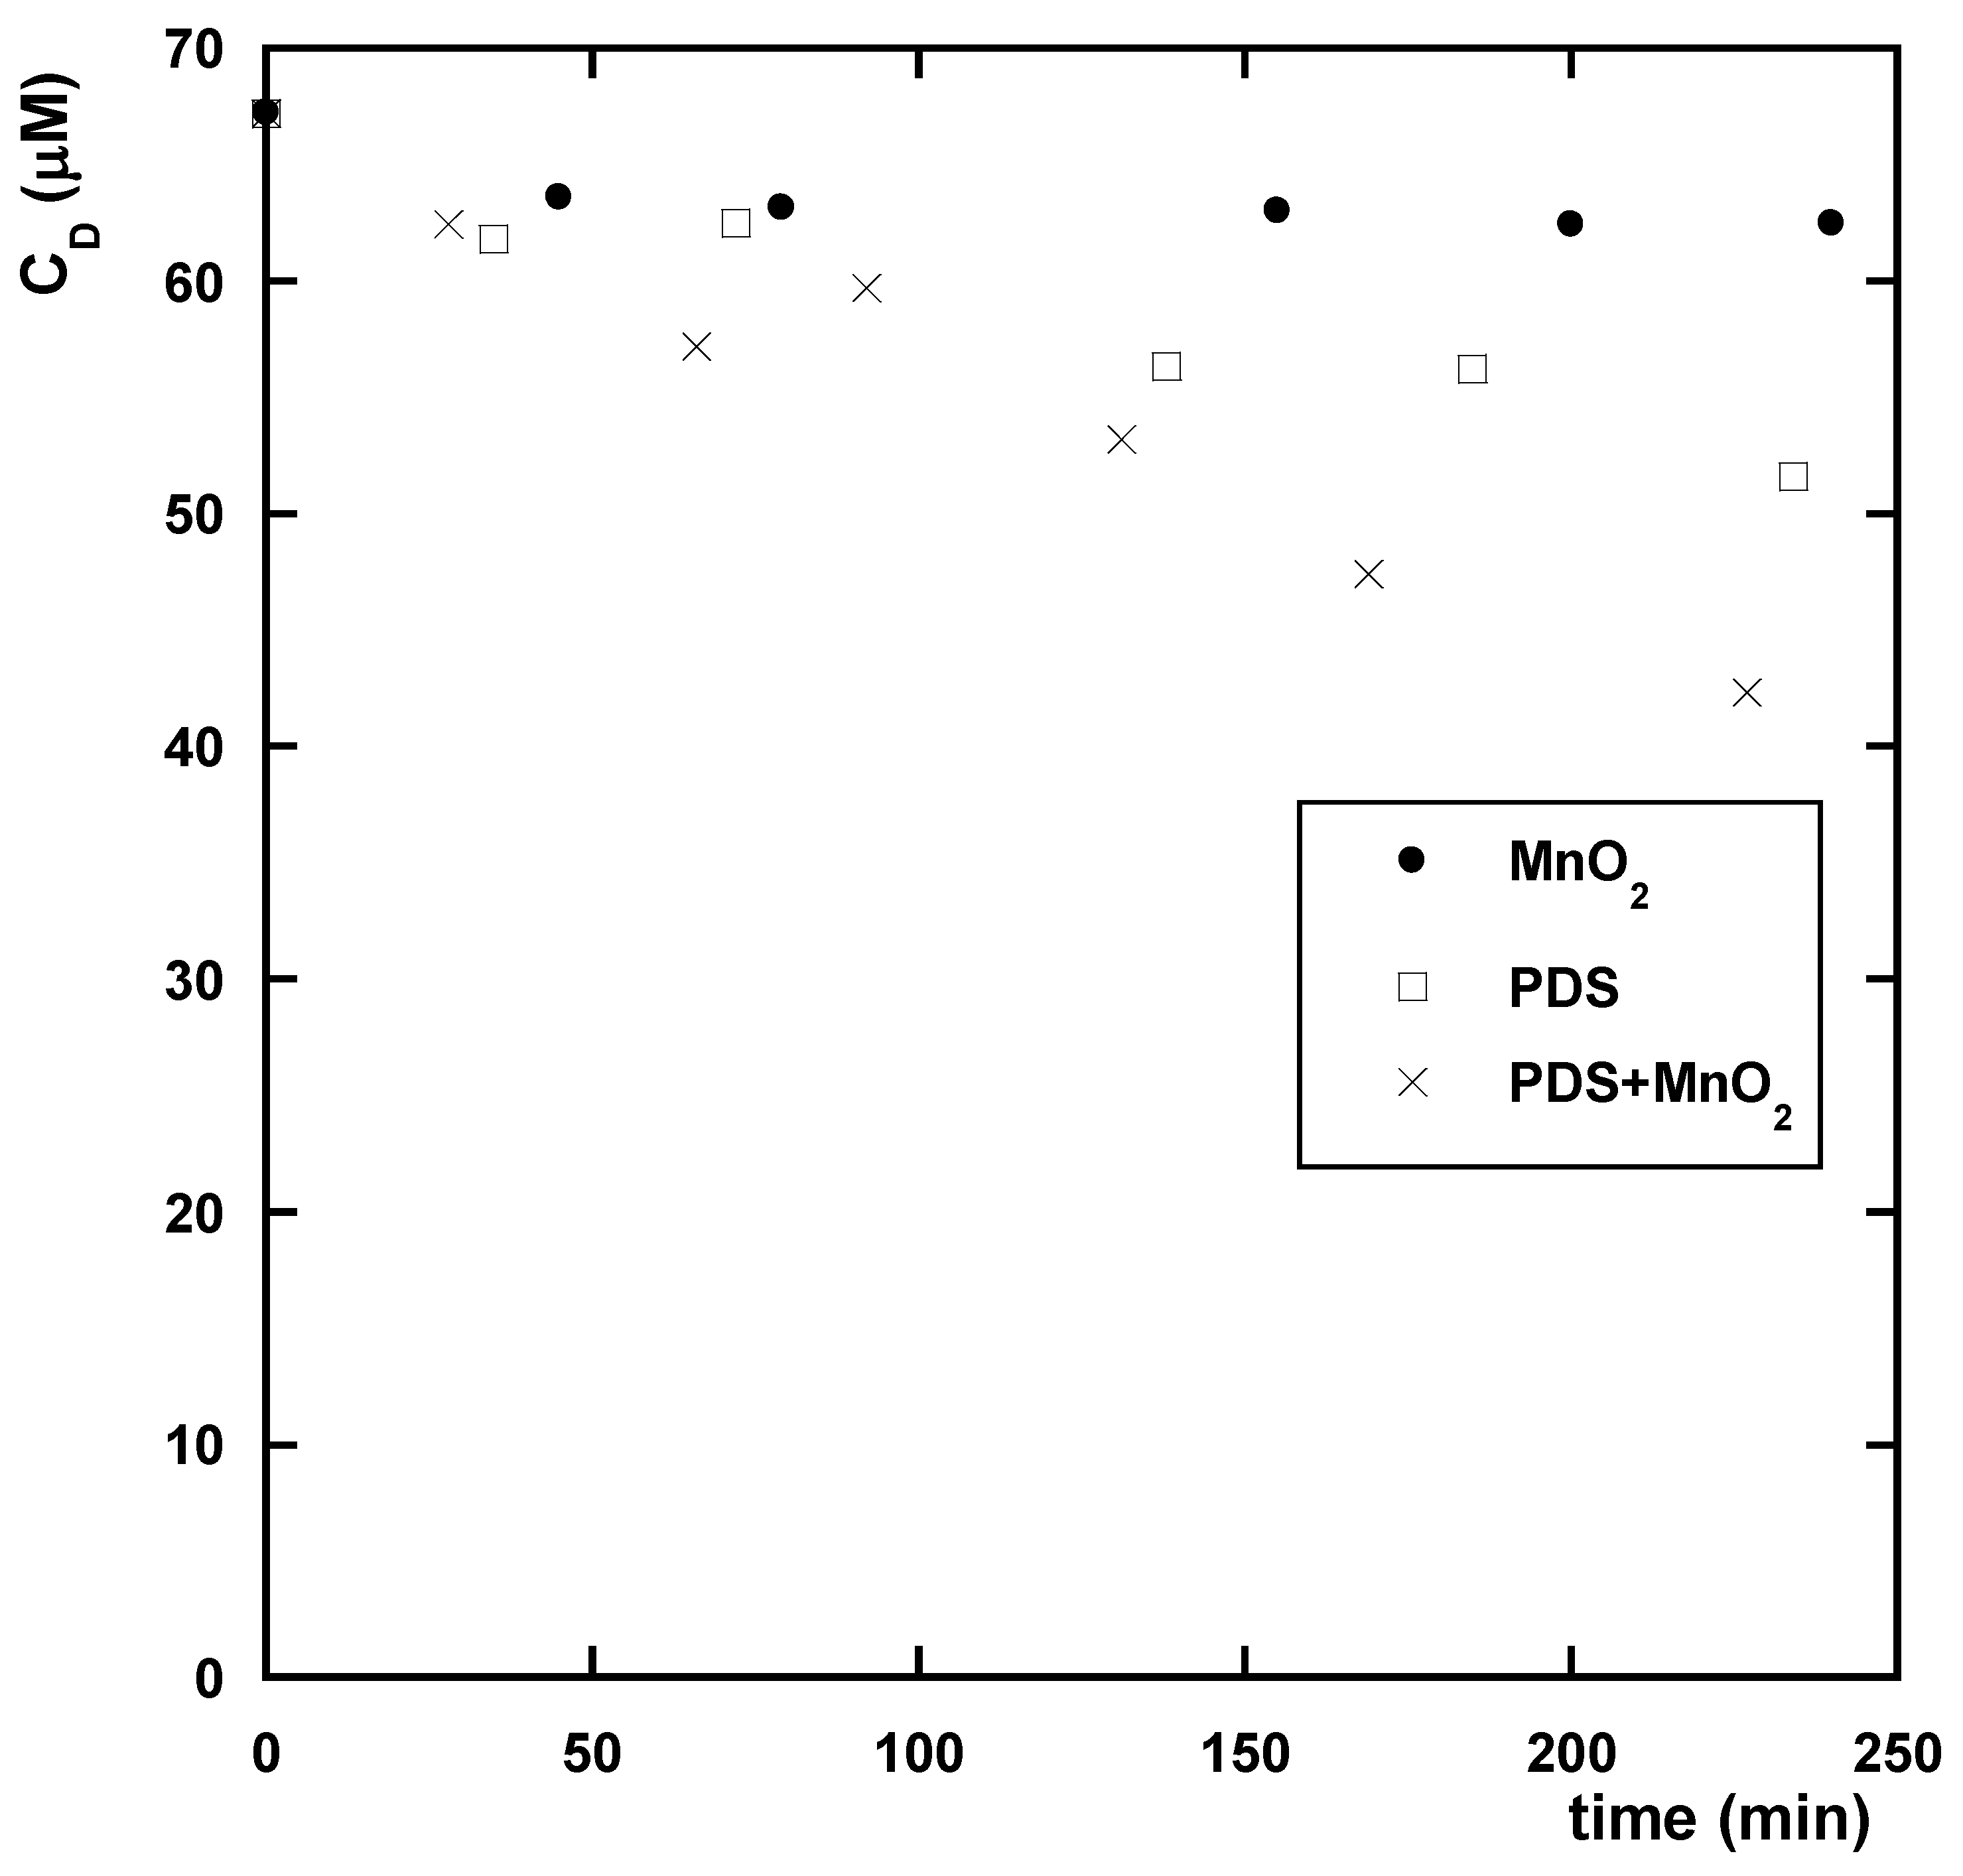
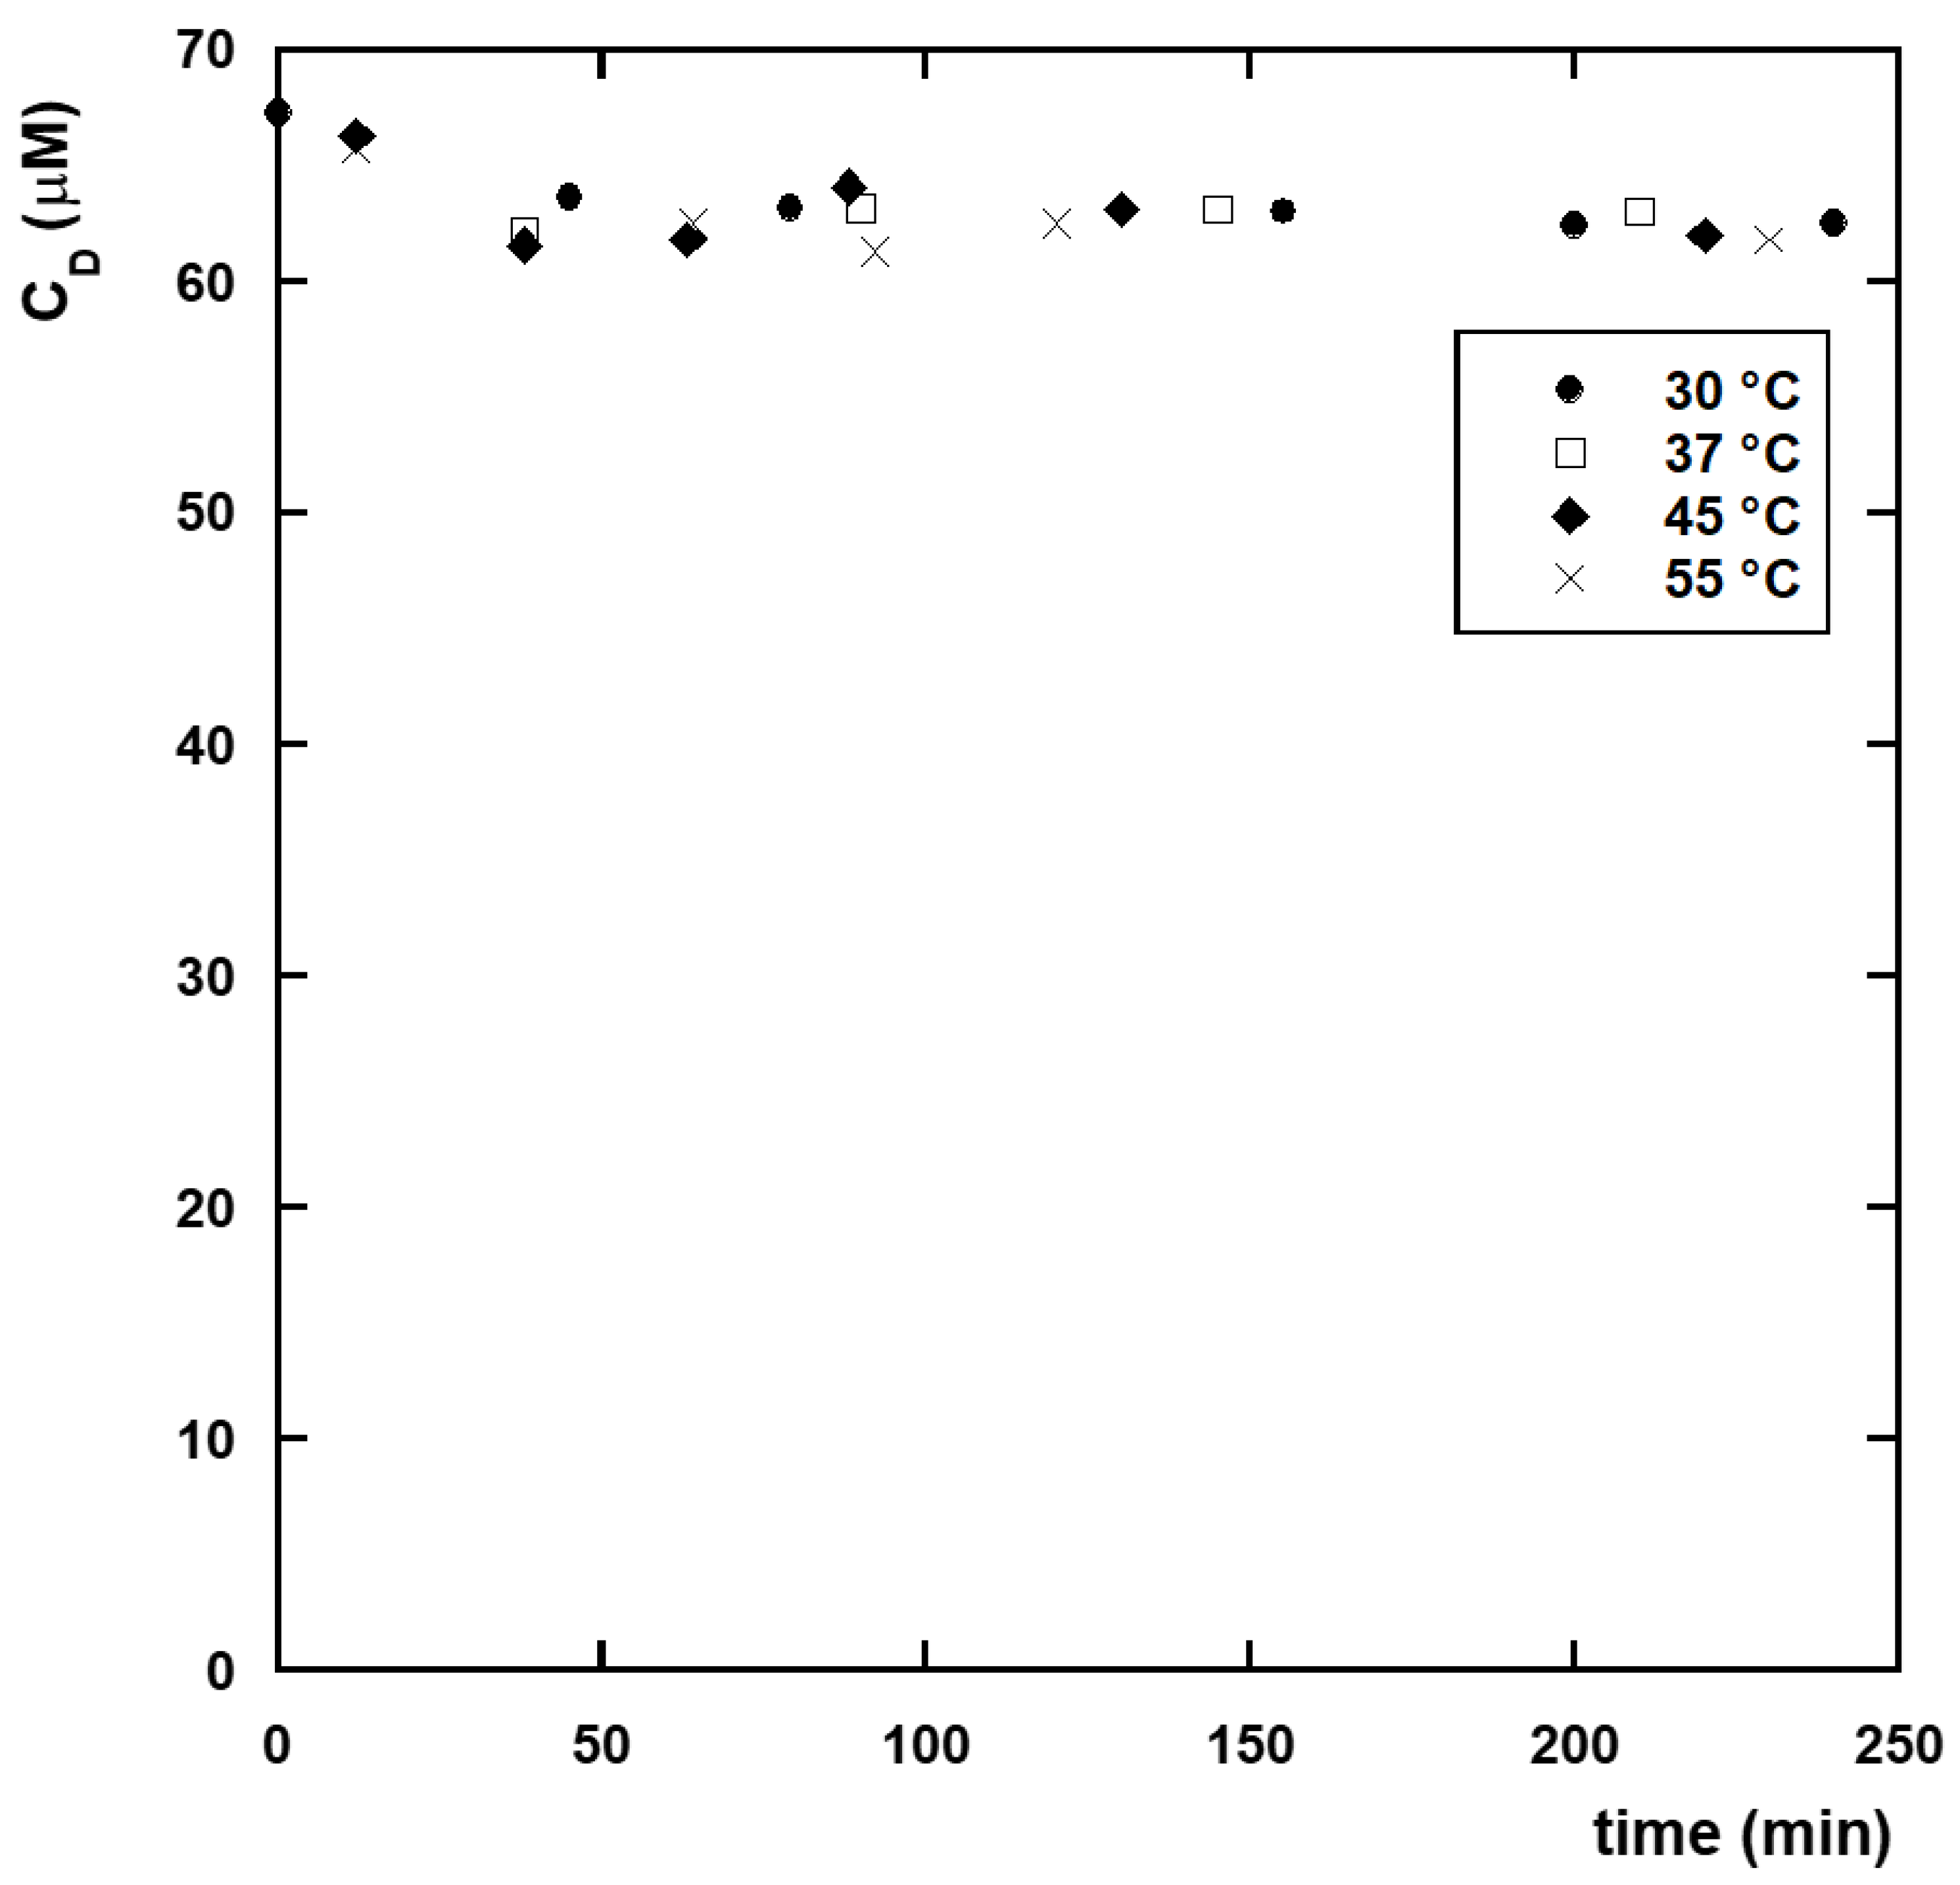
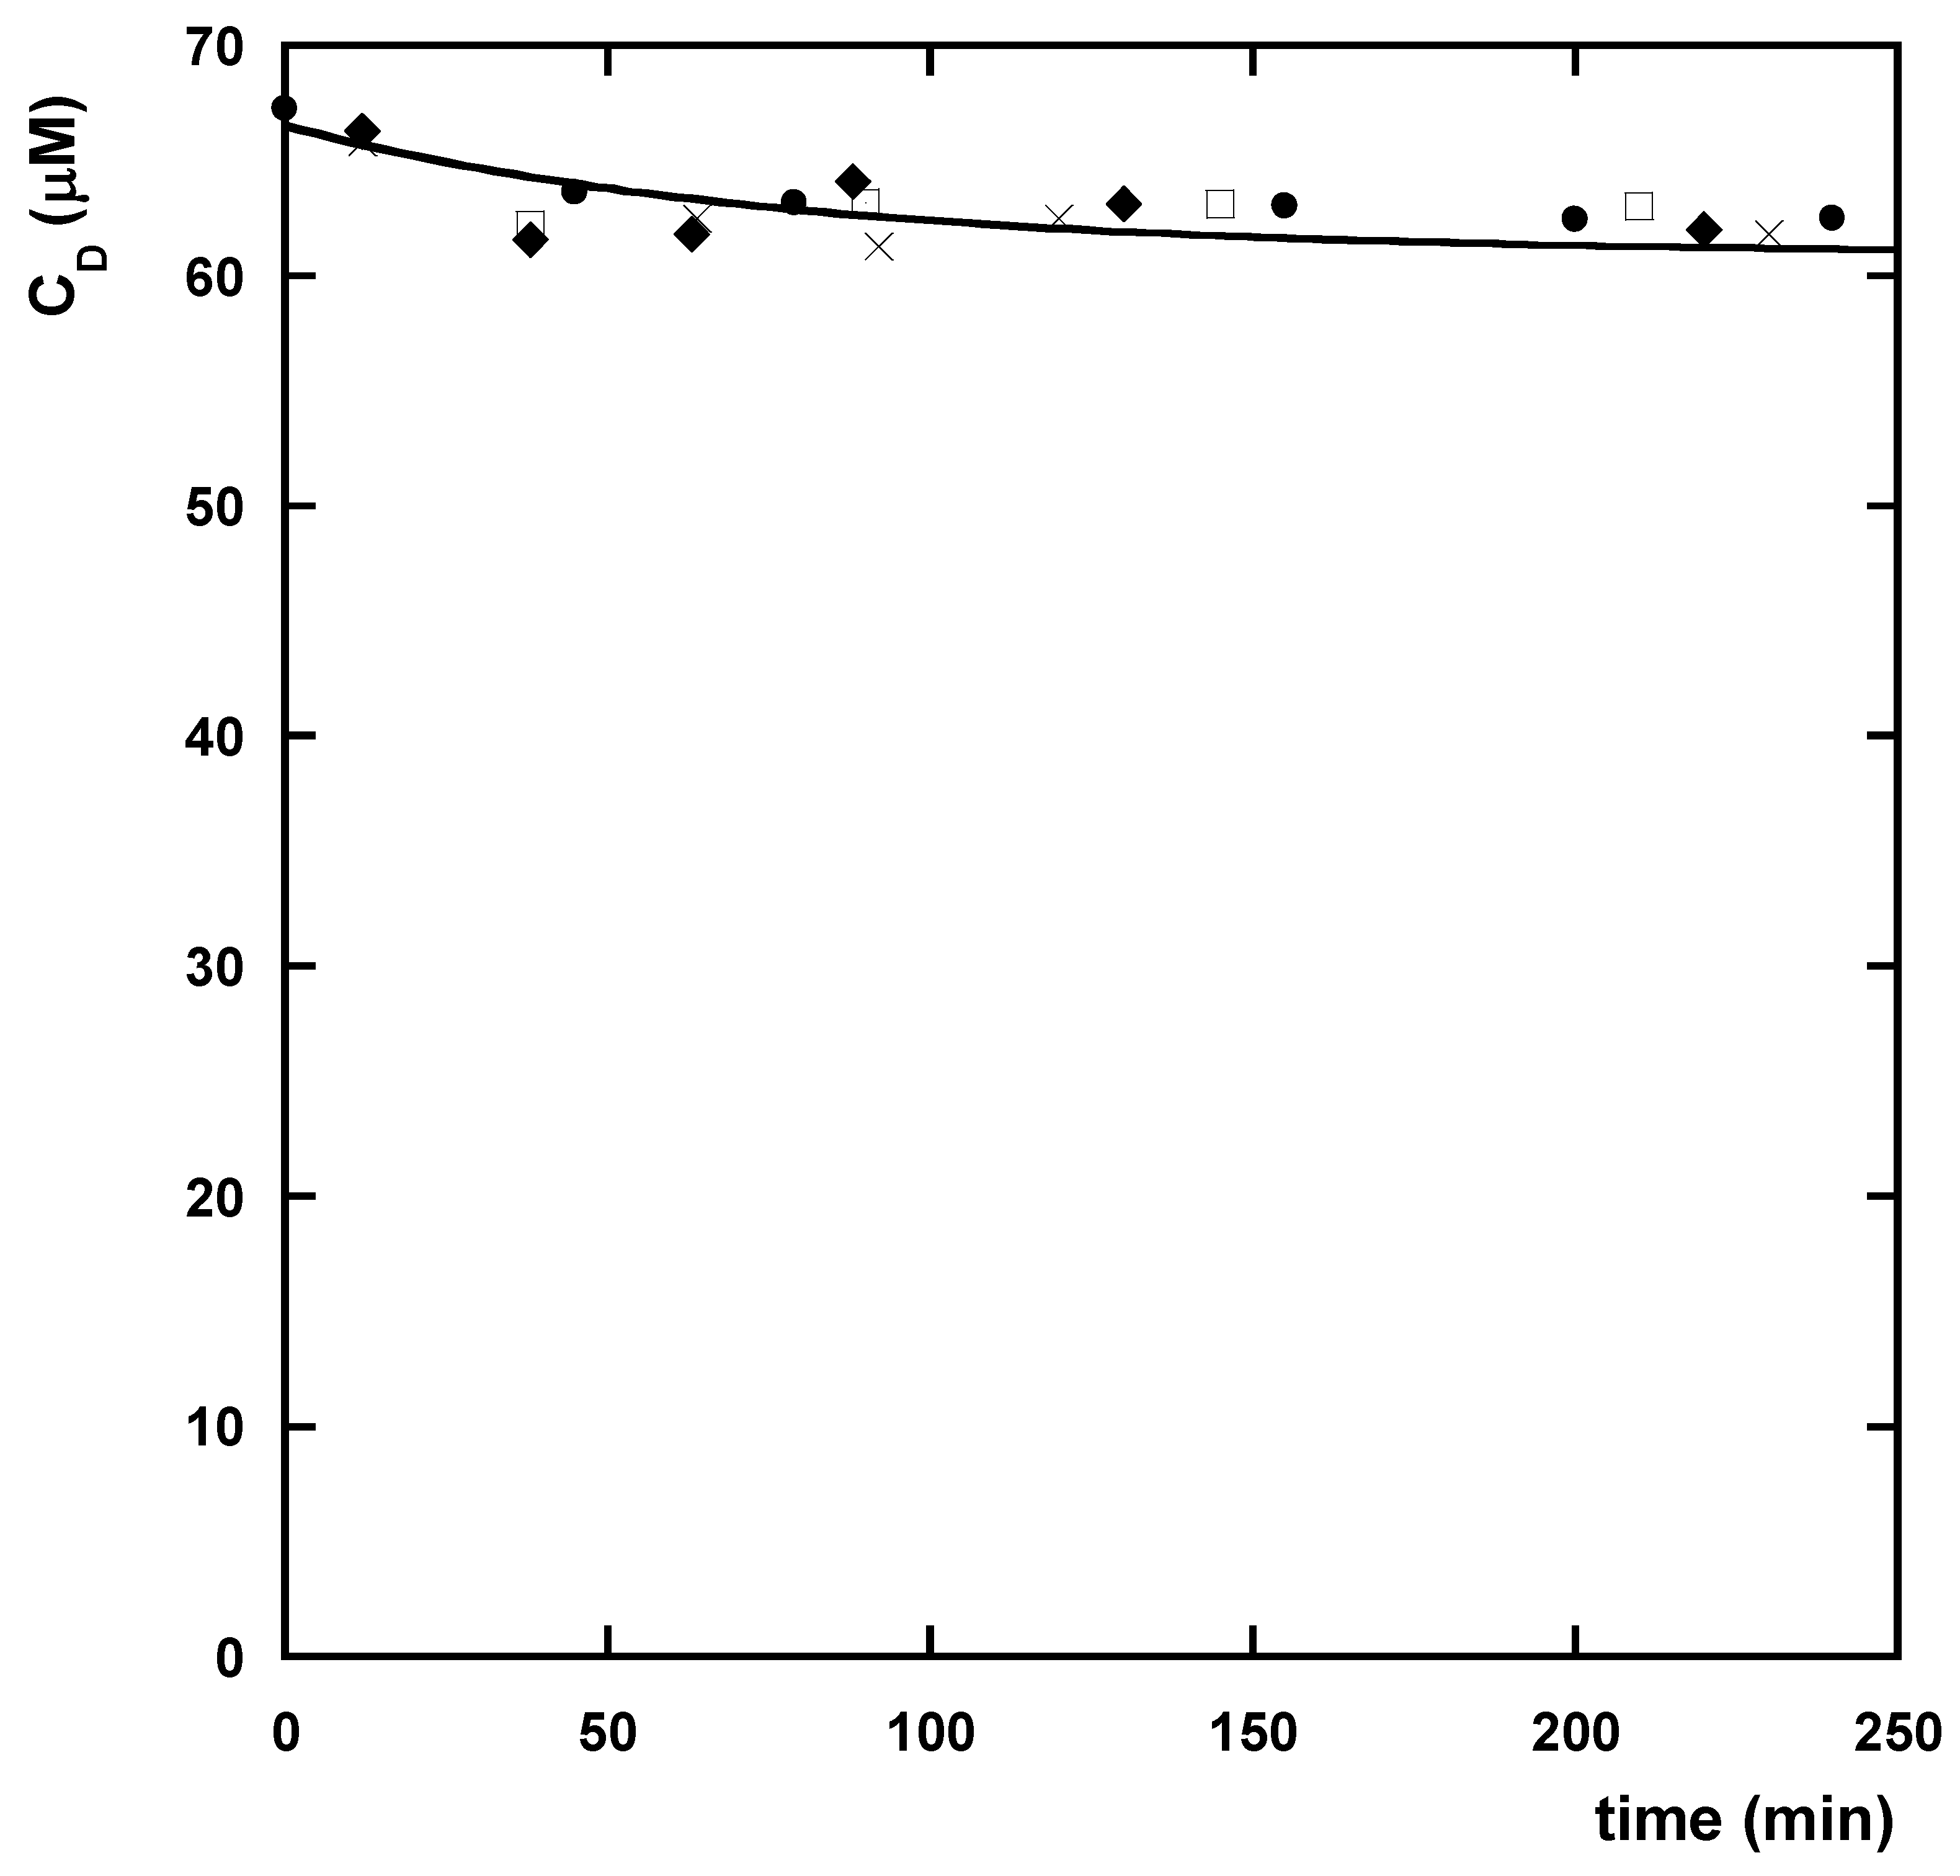
3.2.1. Effect of the Presence of MnO2

Figure 5 shows the effect of MnO2 on the diuron degradation kinetics at different temperatures. Control experiments without MnO2 and PDS revealed that diuron was stable in solution at all the temperatures investigated (data not shown). Conversely, in the presence of MnO2, a moderate decrease in the diuron liquid phase concentration was observed. Interestingly, the effect of the temperature was negligible, and all the kinetic profiles approached the same limit value in about 50 min. In addition, the reacted diuron did not undergo mineralization since the organic carbon content at the end of the experiments was, within the experimental errors, the same as that of the initial reaction time, as determined by TOC analysis. The low reactivity of diuron found in the present work contrasts with the results of Jing et al. [45], according to which MnO2, in similar experimental conditions, promoted an almost complete degradation of diuron in less than 250 min.

3.2.2. Effect of the Presence of PDS

Figure 6 shows the effect of the presence of PDS on the diuron degradation kinetics. The diuron concentration apparently decreased by following a linear trend. A significant effect of temperature on the diuron degradation rate was observed. At the highest temperature investigated, T = 55 °C, complete diuron degradation, with a mineralization degree of ≈83% (TOC analysis), was achieved in less than 75 min. The residual organic content in the reacted mixture might be ascribed to the presence of oxidation intermediates such as 2-chloro-4-(((((3,4-dichlorophenyl)amino)oxy)(dimethylamino)methyl)amino)phenol, 2-((((3-chloro-4-hydroxyphenyl) amino)(((3,4-dichlorophenyl)amino)oxy)methyl)(methyl)amino)acetic acid, and 2,2′-((((3-chloro-4-hydroxyphenyl)amino)(((3,4-dichlorophenyl)amino)oxy)methyl)azanediyl)diacetic acid [38].

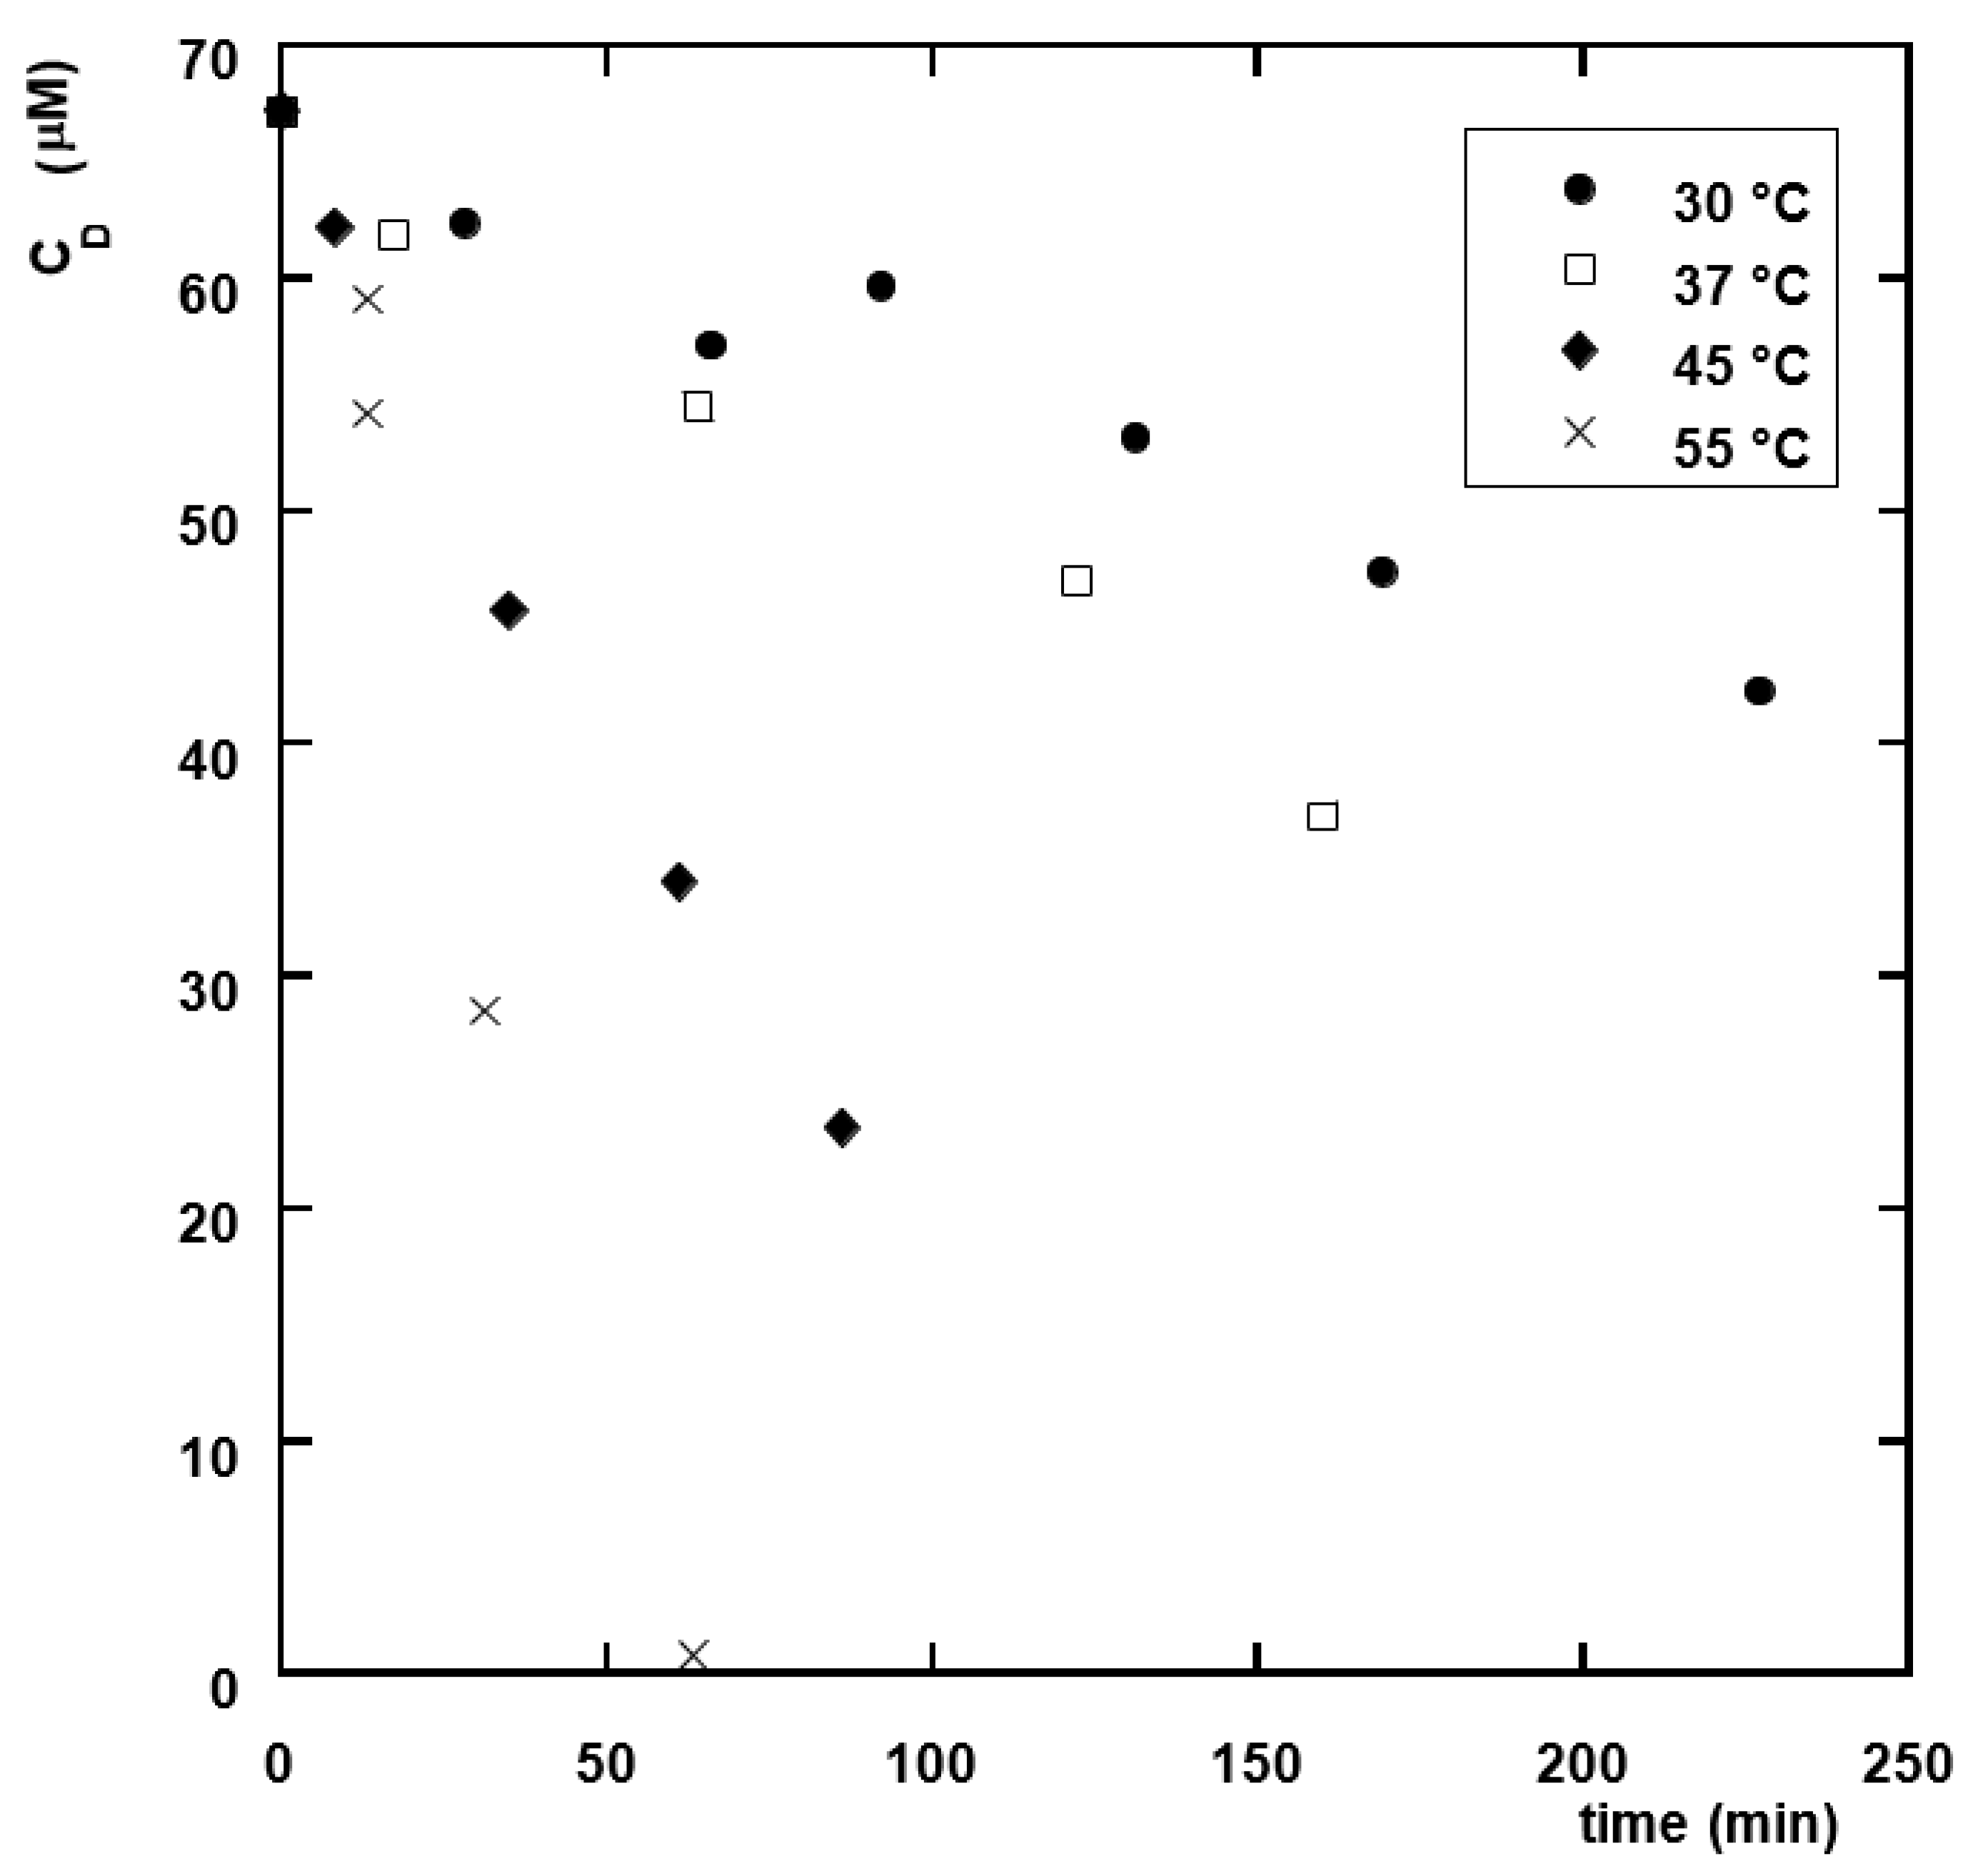
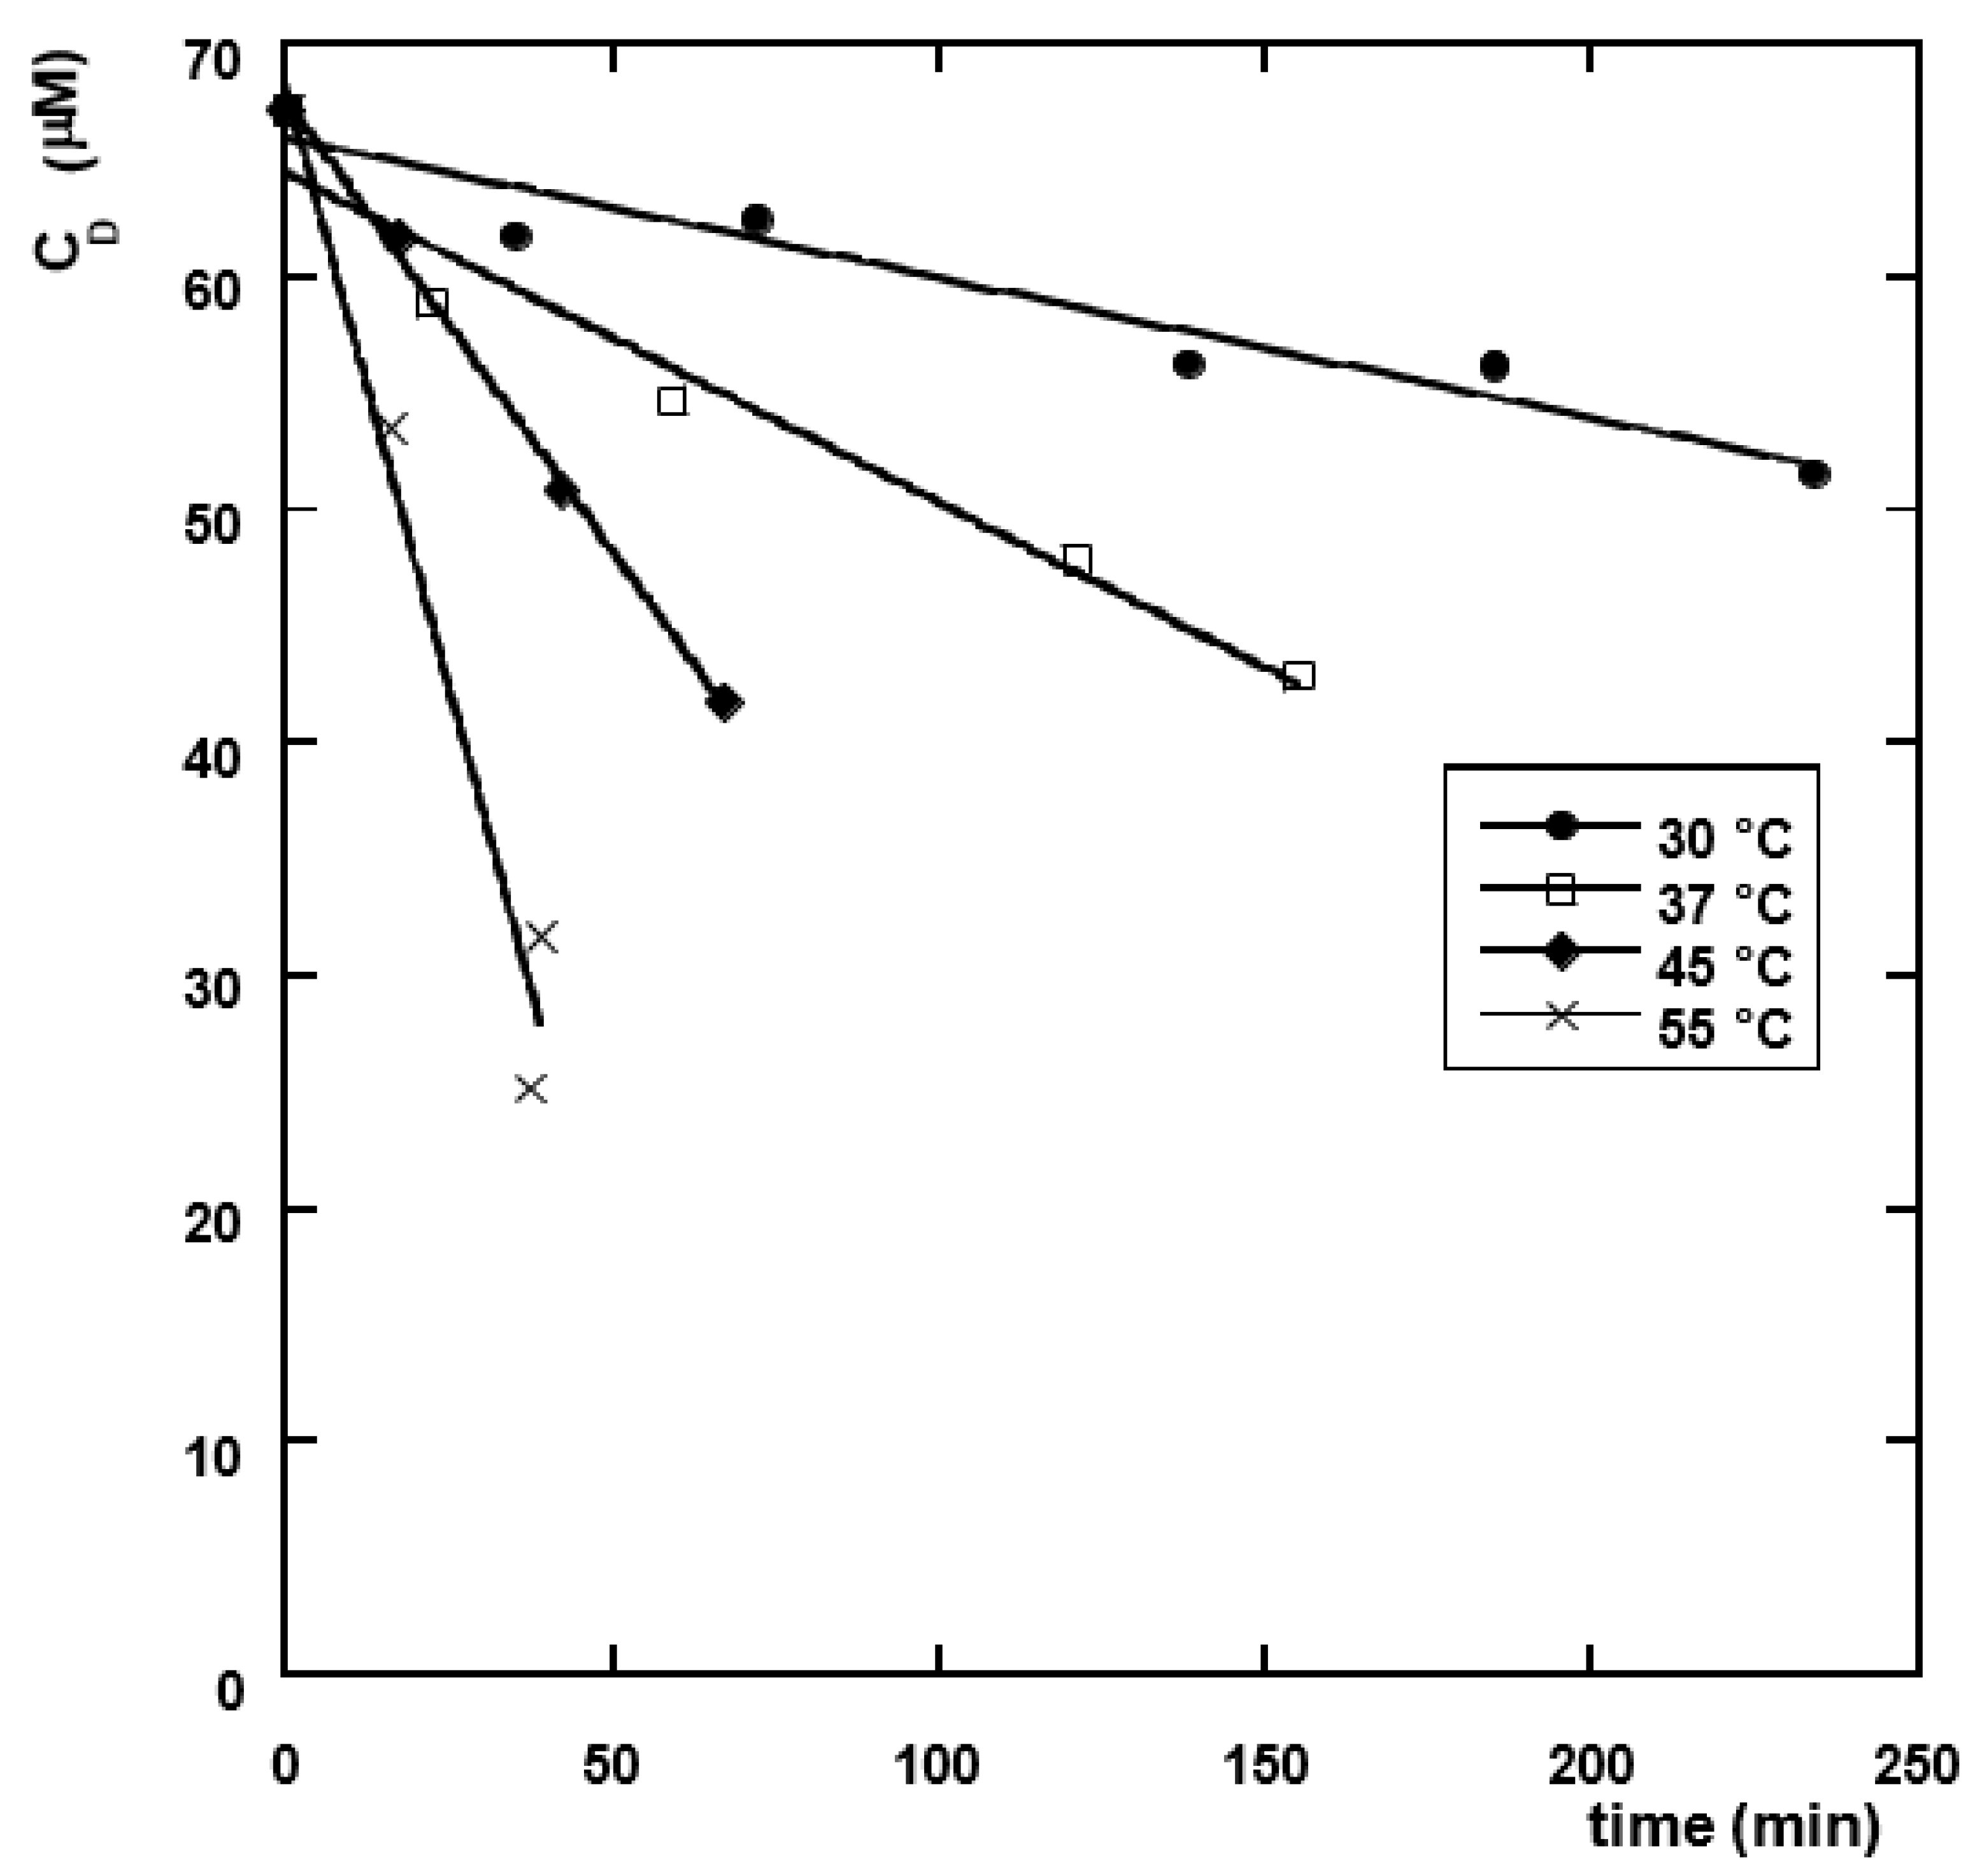
3.2.3. Effect of the Co-Presence of MnO2 and PDS

The diuron degradation kinetics in the co-presence of MnO2 and PDS at various temperatures are reported in Figure 7. For comparison purposes, Figure 8 shows the diuron degradation kinetics at 30 °C in the co-presence of MnO2 and PDS and in the presence of MnO2 and PDS alone. A significant effect of the co-presence of MnO2 and PDS on diuron degradation was observed at the lowest temperature (T = 30 °C), whereas at higher temperatures, the effect was almost negligible. In line with the latter result, the mineralization degree in the PDS+MnO2 samples at the end of the experiments at 55 °C was virtually the same (83%) as that of the samples containing PDS only.

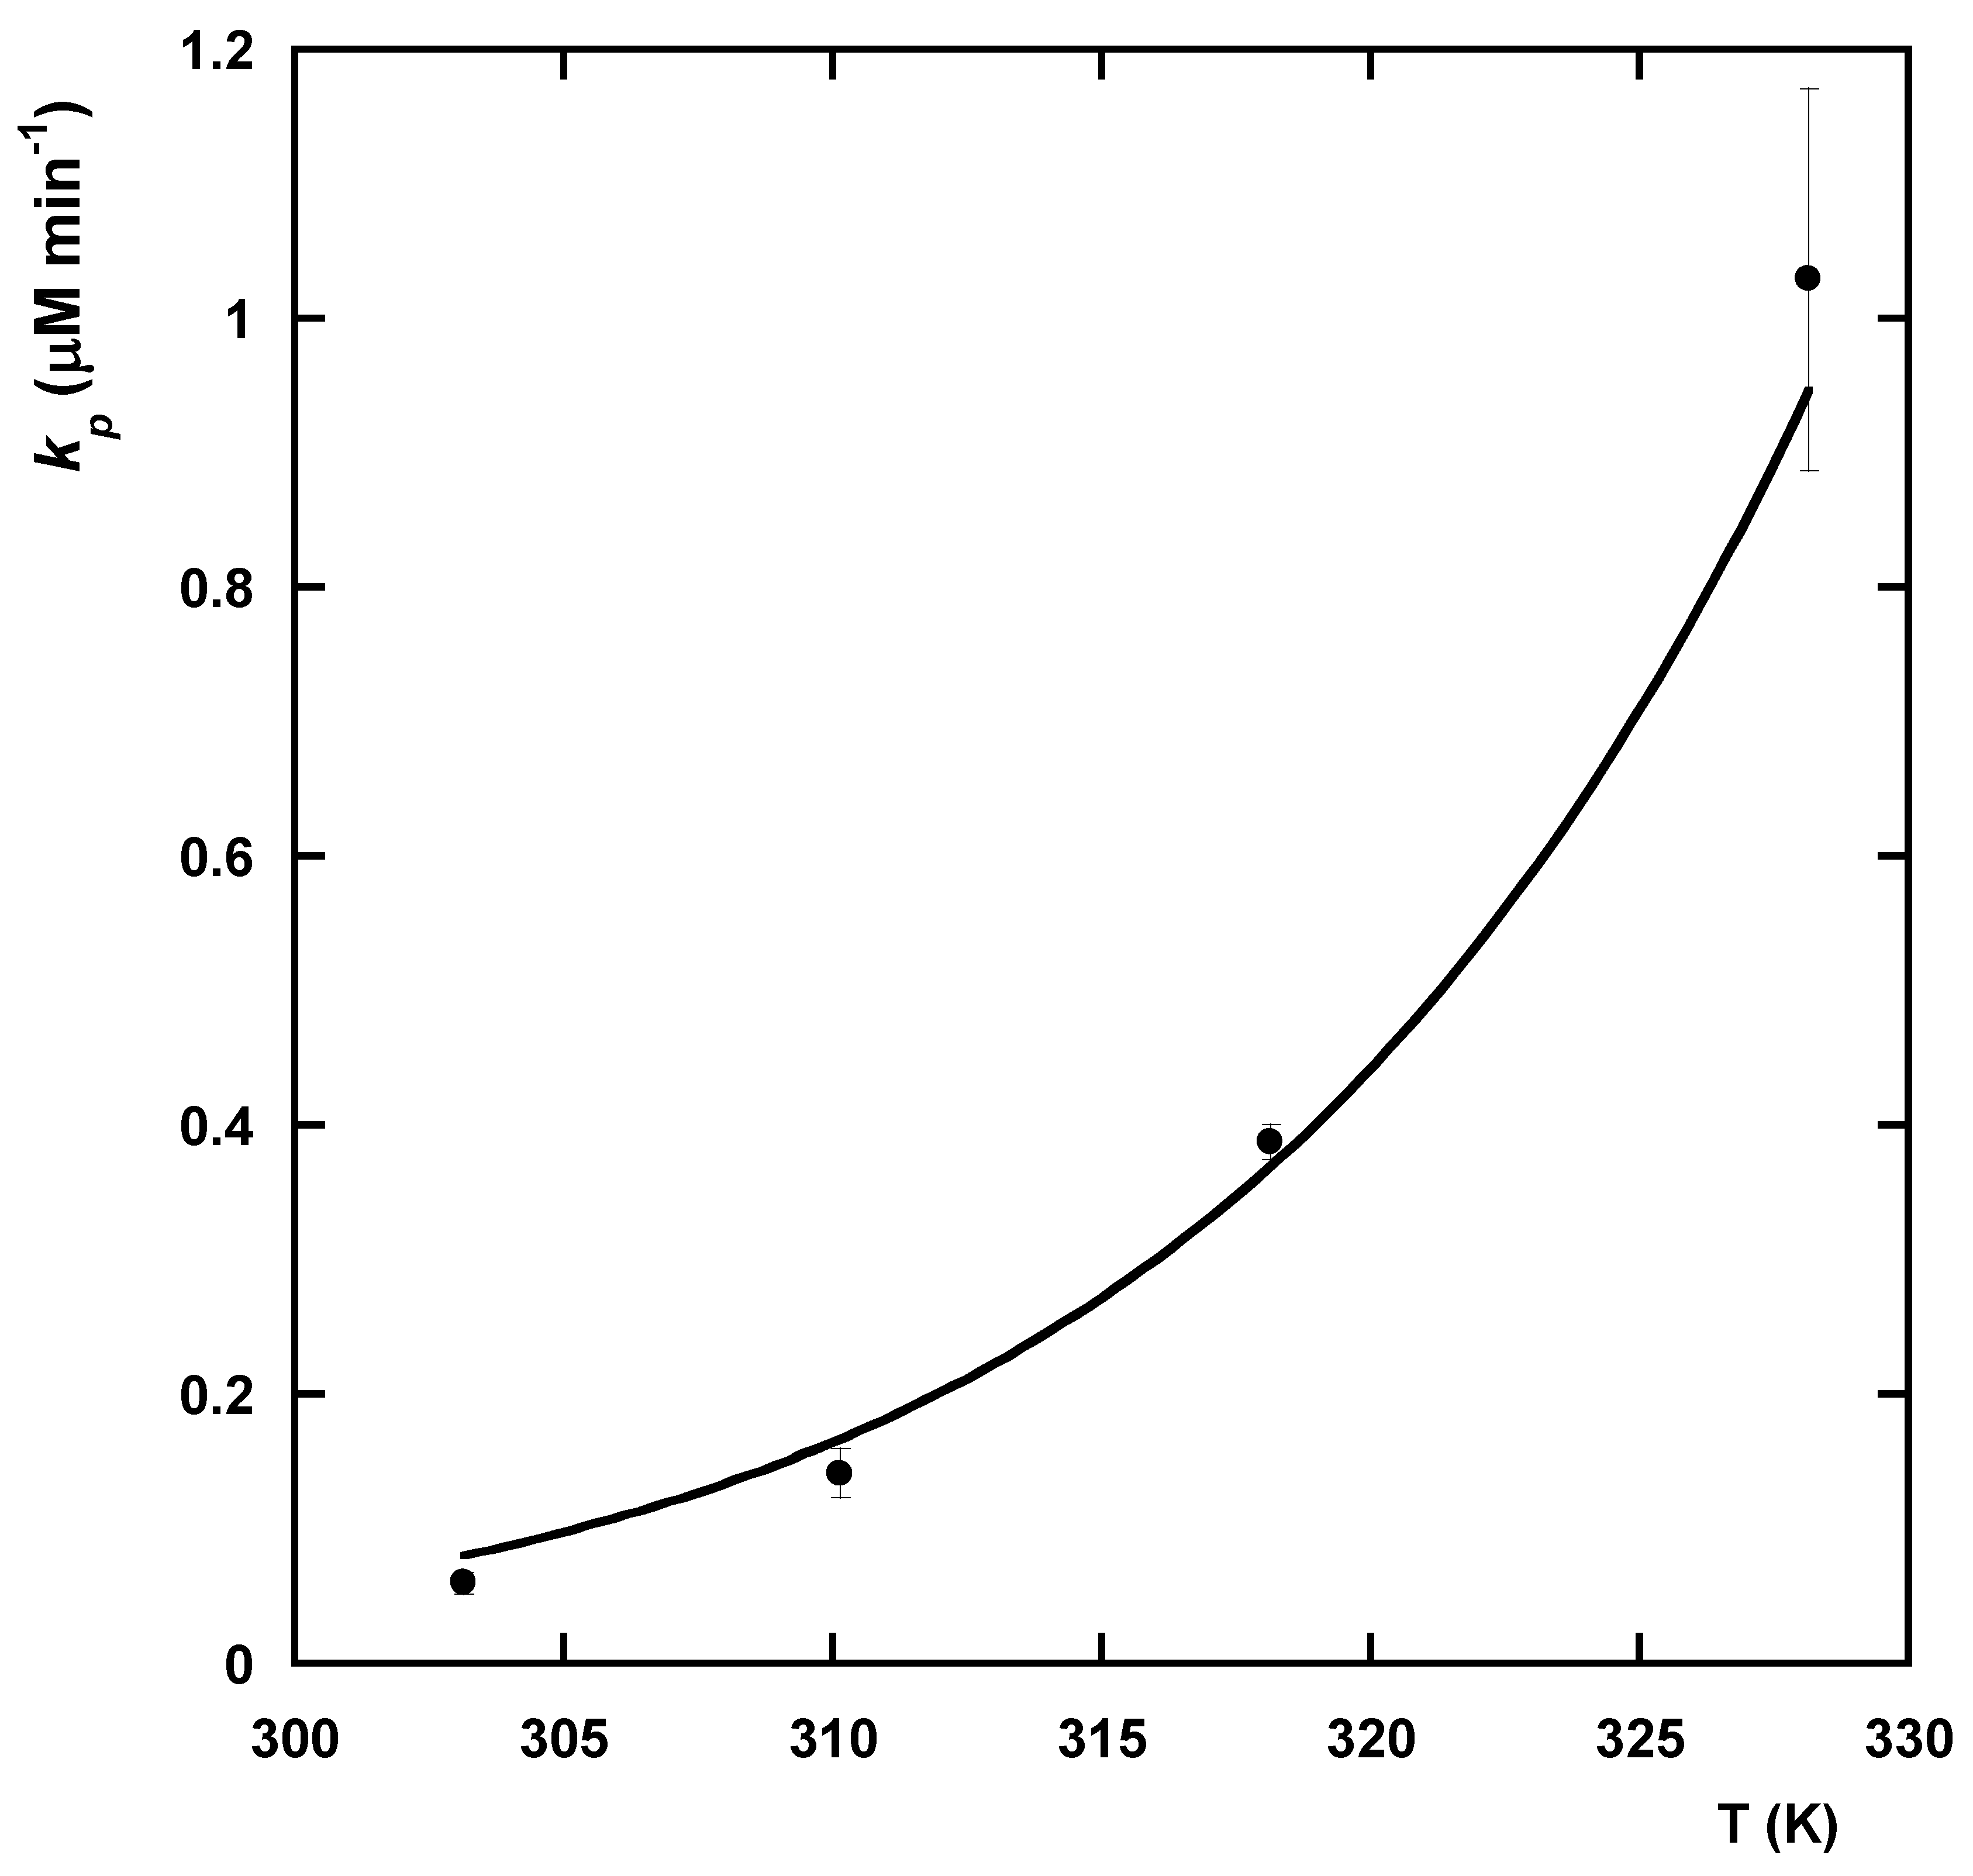
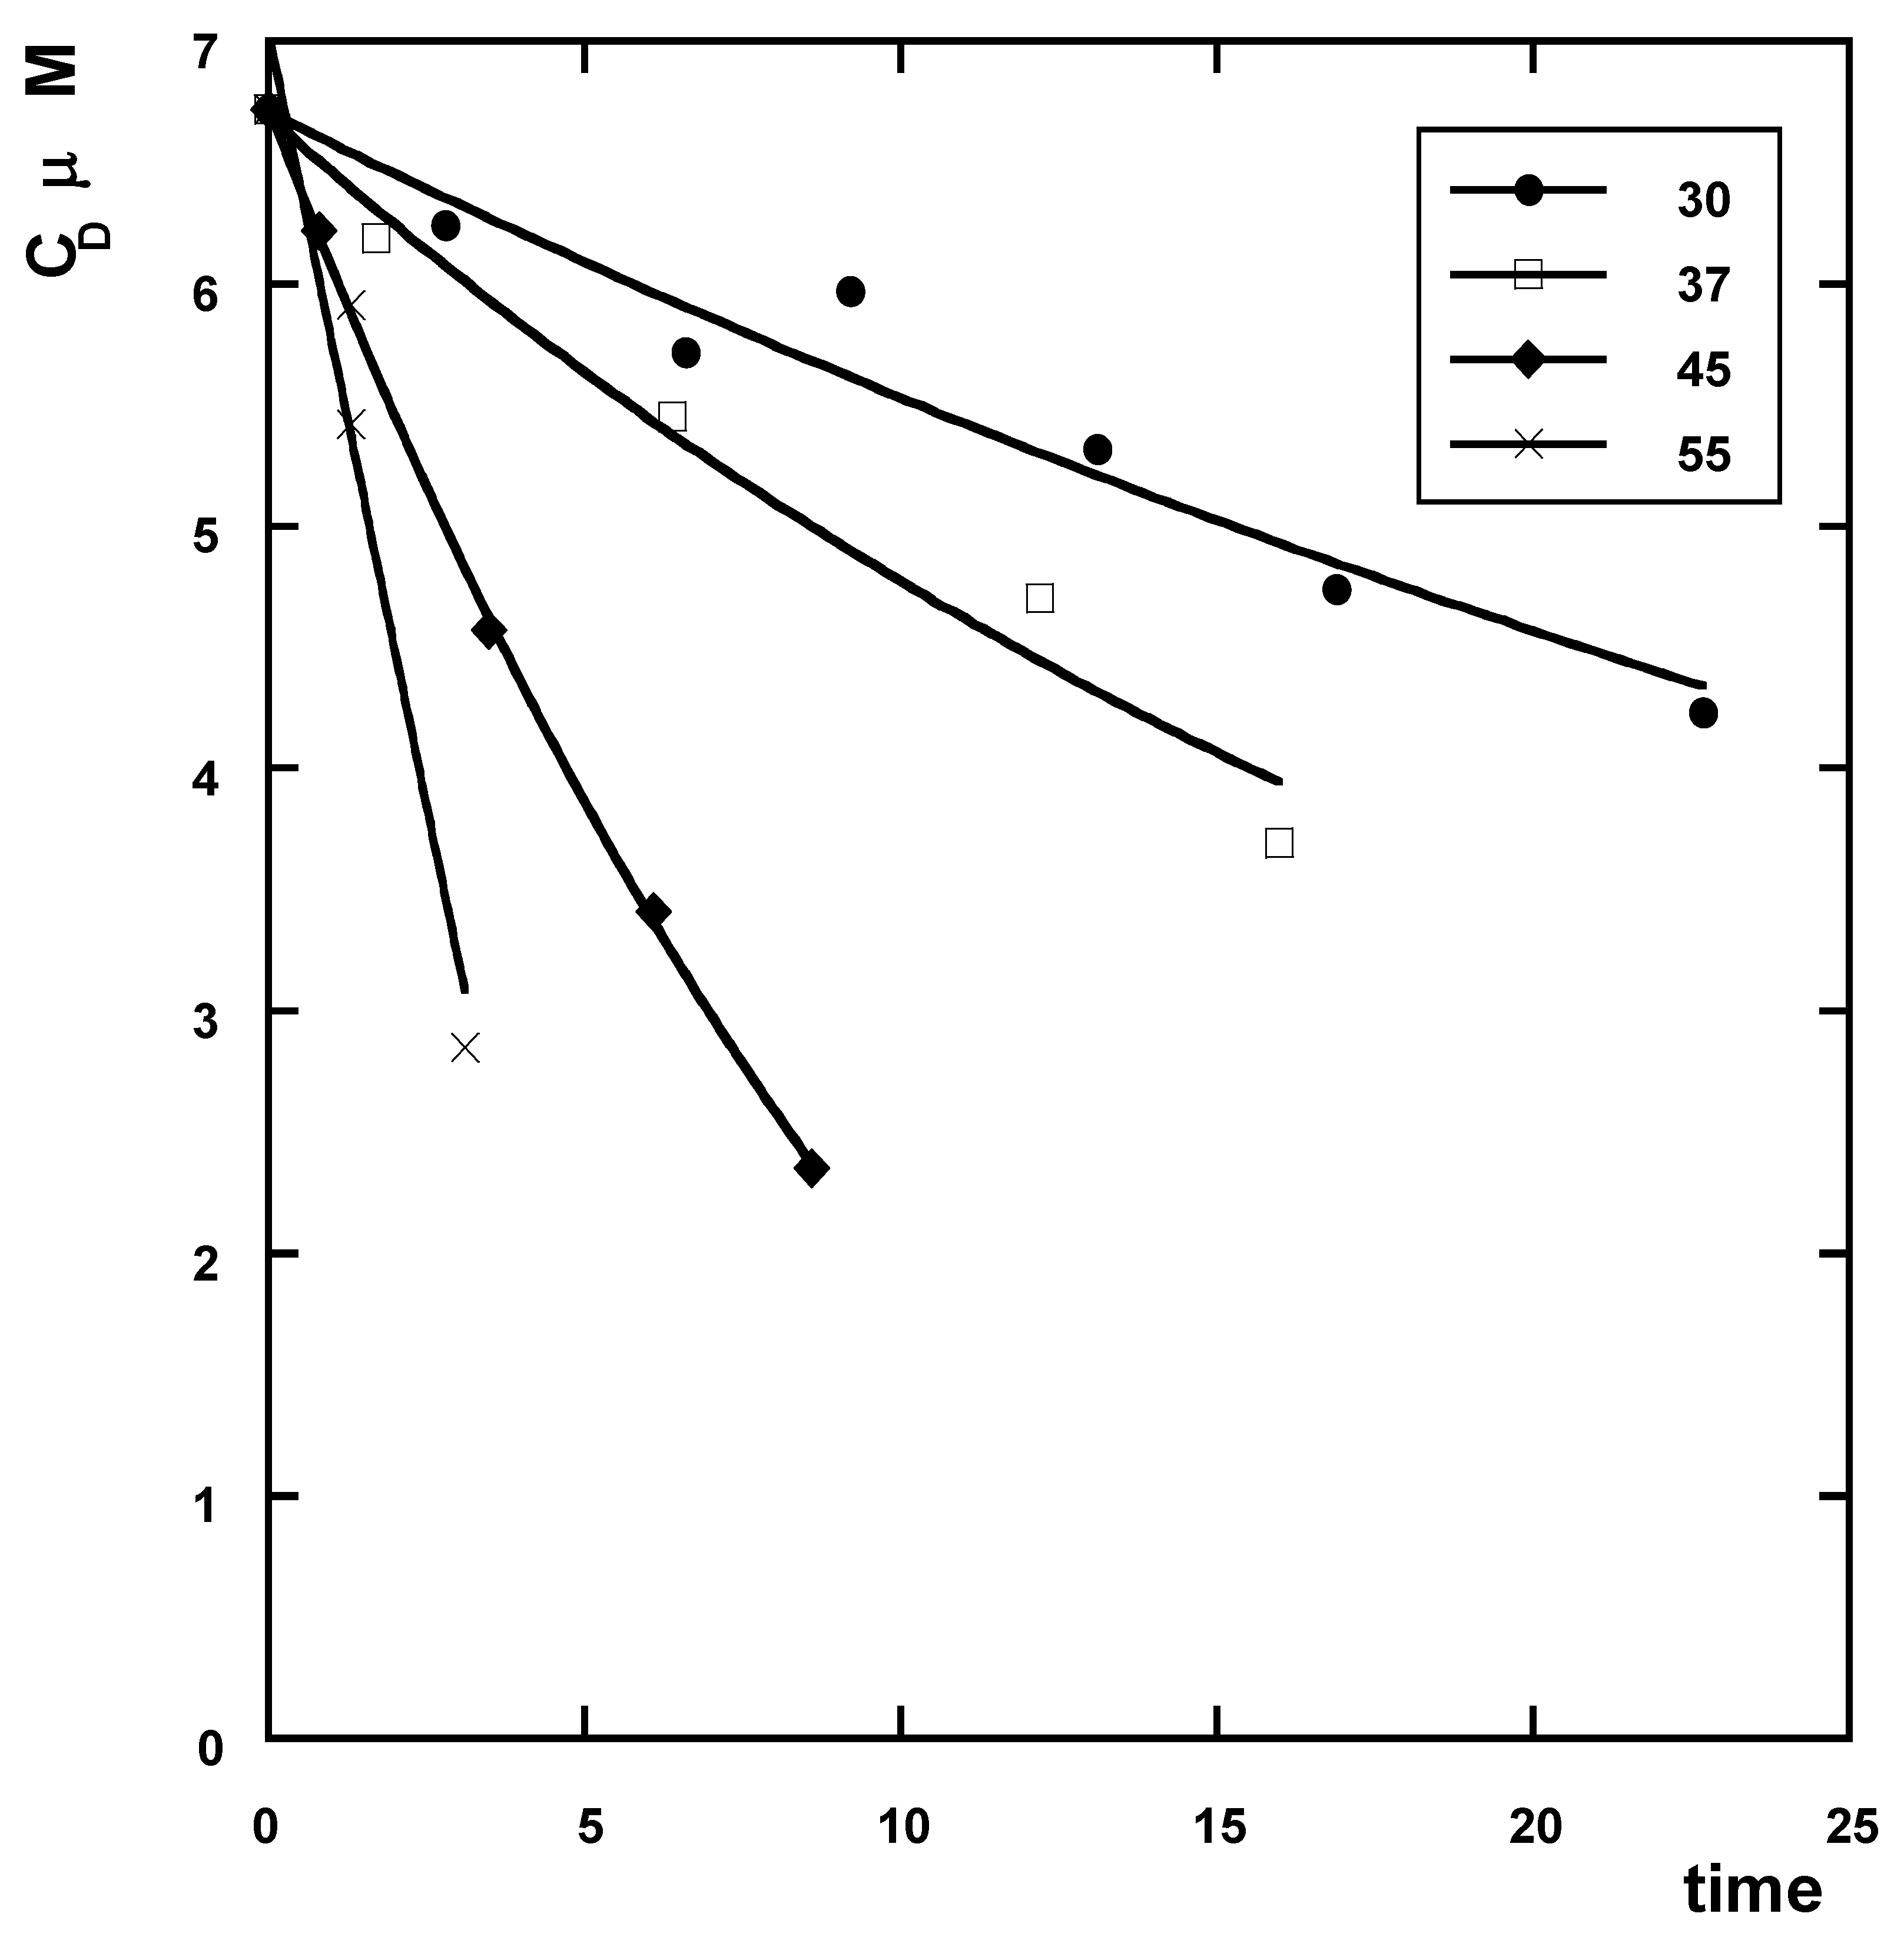
3.2.4. Kinetic Modeling

As has been shown in Figure 6, the diuron concentration linearly decreased over time, thus suggesting that the reaction obeys zero-order kinetics. This result is in contrast with the findings of Tan et al. [38], who claimed that diuron decomposition exhibited pseudo-first-order kinetics. Zero-order kinetics behavior can be explained by considering that the active radicals generated by heat activation of PDS have a very short life and that their concentration in steady state is very low, resulting in a constant consumption of diuron over time [48].
Based on the above considerations, the rate ( v P ) of diuron degradation mediated by heat-activated PDS can be expressed as follows:
v P = d C D d t = k P
where k P is the kinetic rate constant. By integrating Equation (4), we obtain the following:
C D = k P t + C D , 0
Figure 9 and Table 1 show the results of the application of Equation (5) to the kinetic data of diuron degradation by heat-activated PDS. As can be seen, Equation (5) adequately describes the kinetic data trend. The estimated values of k P were used in the Arrhenius equation (Equation (6)) to determine the activation energy ( E a ) of the process by using a non-linear weighted least squares method [49]:
k P = A e E a R T
where A (μM min−1) is the pre-exponential Arrhenius constant and T (K) is the absolute temperature.
The results of the application of the Arrhenius law are displayed in Figure 10.
The calculated E a turned out to be 82 ± 5 kJ mol−1. This value is approximatively half of the value obtained by Tan et al. in their work [38].
In the presence of MnO2, the rate of diuron degradation was expected to be negatively affected by pore diffusion inside the metal oxide domain [50]. For this reason, kinetic models accounting for the diffusion phenomenon [47,51] were preliminary tested on the experimental data. The results (data not shown) revealed that the effect of diffusion on the degradation rate was negligible, thus suggesting that surface reaction might play a leading role in the oxidation kinetics. Based on the above considerations, the rate of diuron degradation in the presence of MnO2 ( v M ) can be assumed to be proportional to the concentration of diuron in the solution ( C D ) and of MnO2 ( C M n O 2 ):
v M = d C D d t = k M C D C M n O 2
where k M is the kinetic rate constant in the presence of MnO2.
As stated before, only a very small decrease in C D was observed during the reaction (see Figure 5), which allows us to reasonably assume v M to be independent of the diuron concentration (i.e., C D C D , 0 ). Under this assumption, Equation (7) reduces to pseudo-first-order kinetics in C M n O 2 :
v M = d C D d t = k M C D , 0 C M n O 2
where C D , 0 is the initial diuron concentration in the liquid phase.
Moreover, C M n O 2 corresponds to the amount of diuron that can be oxidized per unit of liquid volume, that is:
C M n O 2 = C D C D , f
where C D , f is the final diuron concentration in the solution. It follows that Equation (7) can be re-written as follows:
v M = d C D d t = k M C D , 0 ( C D C D , f )
Integration of Equation (10) into the boundary conditions t = 0 , C D = C D , 0 and t = t , C D = C D yields the following:
C D = ( C D , 0 C D , f ) e k M C D , 0 t + C D , f
Equation (11) was used to fit the kinetics of diuron degradation in the presence of MnO2, and the results are shown in Figure 11 and Table 1. The kinetic rate constant, k M , and the maximum oxidation capacity of MnO2, C D , f , resulted equal to (7.9 ± 3.9) × 10−4 μM−1 min−1 and 62.4 ± 0.5 μM, respectively.
When both PDS and MnO2 are present in the reactant system, the two compounds act synergistically to oxidize diuron. The large excess of PDS (PDS/diuron molar ratio ≅ 250) reasonably induces an almost instantaneous full regeneration of the oxidation capability of MnO2 during the process [52] (i.e., ( C D C D , f ) ( C D , 0 C D , f ) ), and parallelly, MnO2 acts as a catalyst for PDS activation [52]:
M n ( I V ) + S 2 O 8 2 M n ( I I I ) + S 2 O 8
S 2 O 8 2 + M n ( I I I ) M n ( I V ) + S O 4 + S O 4 2
Under these experimental conditions, the oxidation rate of diuron ( v T o t ) can be obtained by summing up the reaction rate corresponding to each diuron degradation route:
v T o t = v M + v P = d C D d t = k M C D ( C D , 0 C D , f ) k P
where v P and k P represent the reaction rate and the kinetic rate constant of diuron degradation, respectively, promoted by both heat- and MnO2-activated PDS. After integration of Equation (14), we finally obtain the following:
C D = ( C D , 0 β ) e k M ( C D , 0 C D , f ) t + β
β = k P k M ( C D , 0 C D , f )
Figure 12 and Table 1 show the results of the diuron kinetic data modeling in the co-presence of MnO2 and PDS by using Equation (15).
As can be seen from Table 1, the estimated value of k P at 30 °C was statistically higher than that of k P obtained with heat-activated PDS. This indicates that MnO2 has an important catalytic role in PDS activation, at least at 30 °C. The presence of MnO2 at 30 °C determined a decrease in the predicted diuron half-life from 560 min (PDS alone) to 320 min (PDS + MnO2). On the contrary, at the higher temperatures investigated, the effect of the presence of MnO2 was much less significant, suggesting that in such experimental conditions, the activation of PDS by heat is the only effective source of diuron degradation.

3.3. Diuron Degradation Mechanism

The exact mechanism through which diuron is oxidized by MnO2 remains unclear [44]. It can be considered that under acidic conditions (as in the case of the present study, pH ≈ 4), MnO2 promotes the formation of hydroxyl radicals which are likely responsible for the diuron degradation [44]. According to Jiang et al. [45], the reaction might proceed through the formation of diuron radicals, followed by dechlorination or hydroxylation and C-N bond cleavage.
Tan et al. [38] proposed that in the presence of PDS, both sulfate and hydroxyl radicals play a role in diuron degradation. The formation of two intermediates, namely 3-(3-chhoro-4-hydroxyphenyl)-1,1-dimethylurea and 3,4-dichloroaniline, is expected. These compounds react together to form high molecular weight products such as 2-chloro-4-(((((3,4-dichlorophenyl)amino)oxy)(dimethylamino)methyl)amino)phenol, 2-((((3-chloro-4-hydroxyphenyl) ami-no)(((3,4-dichlorophenyl)amino)oxy)methyl)(methyl)amino)acetic acid, and 2,2′-((((3-chloro-4-hydroxyphenyl)amino)(((3,4-dichlorophenyl)amino)oxy)methyl)azanediyl)diacetic acid.
When both MnO2 and PDS are present in the reaction mixture, they act synergistically (according to Equations (12) and (13)) to accelerate the reactions discussed above.

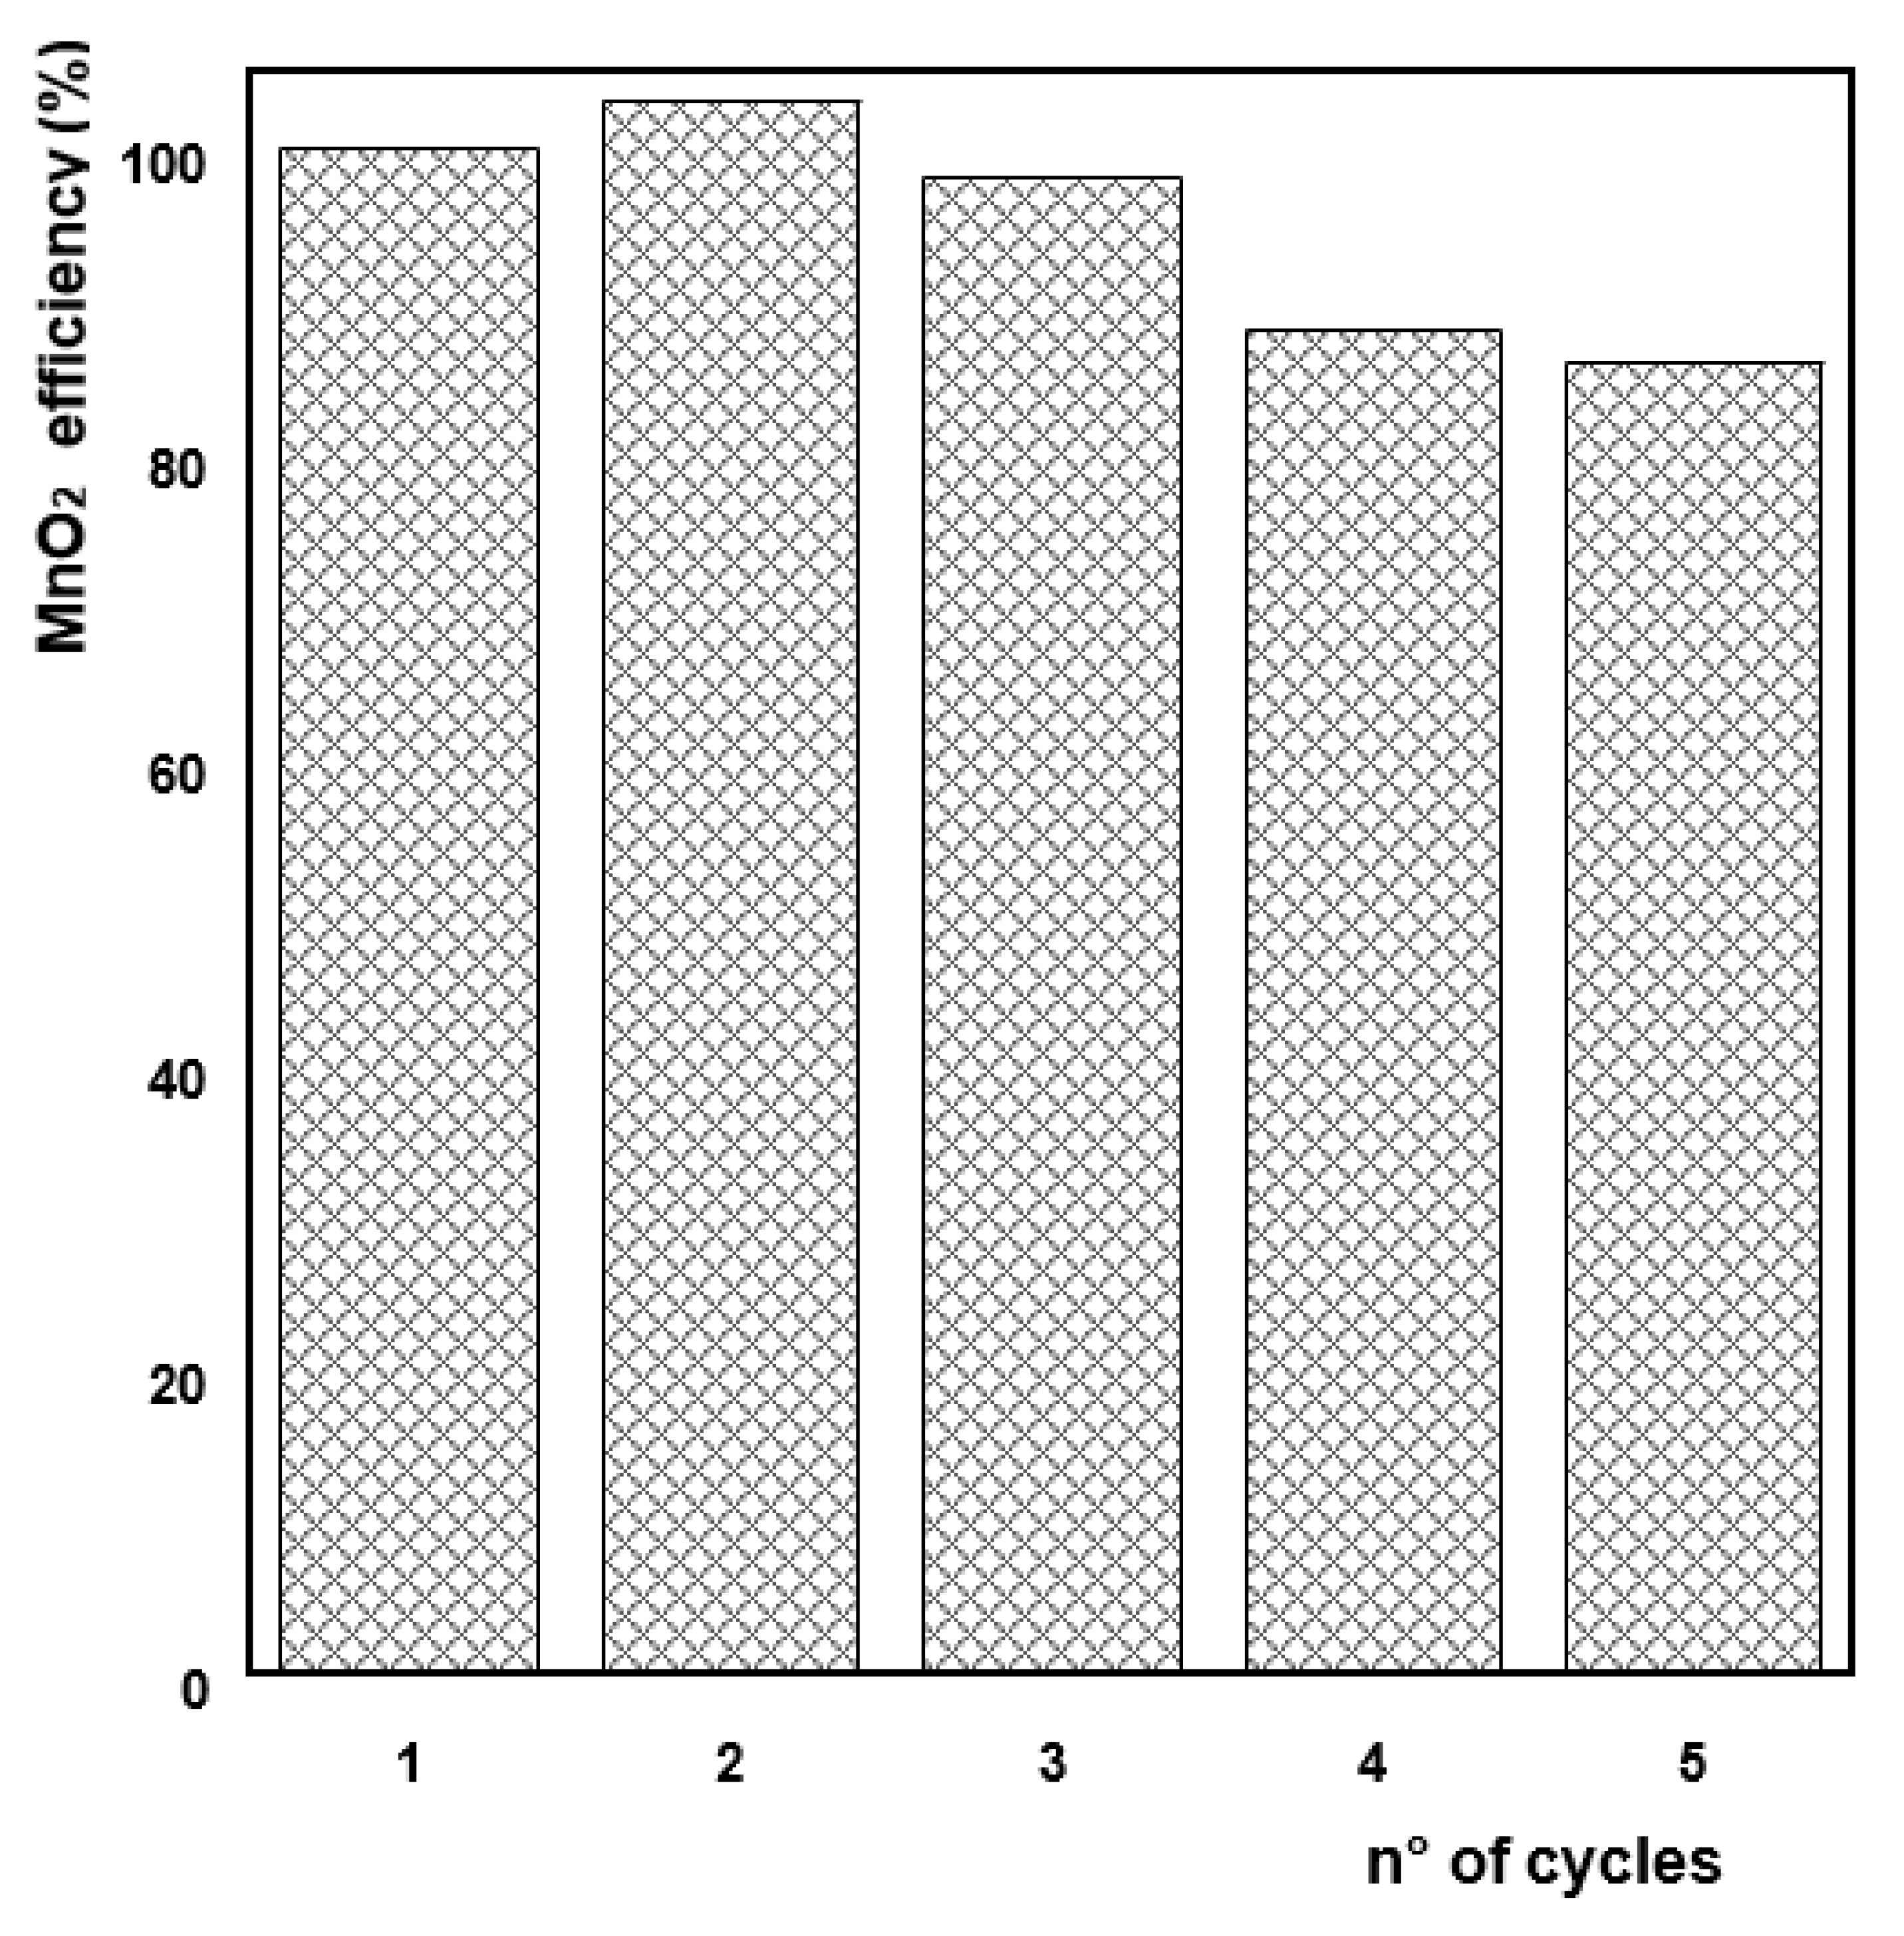
3.4. Reusability of MnO2

To test the reusability of the solid material (MnO2), after the end of the experiments, the samples were allowed to settle for MnO2 recovery. The recovered MnO2 was then used for four further degradation cycles, each time using a fresh PDS–diuron solution. The results of the reusability tests (Figure 13) revealed that MnO2 preserves its activity at least up to the third cycle. The subsequent decrease in the degradation efficiency could be at least partially ascribed to the MnO2 mass loss during the recovery procedure.

3.5. Operational Cost

To assess the applicability of the MnO2-activated-PDS system in industrial scale, we determined the overall operational cost (OOC) of the process, expressed in € per m3 of treated water, by the sum of the electrical energy cost (EC) and the reagents cost (RC) per m3:
O O C = E C + R C
EC is the product of the electrical energy per order (EE/O) figure-of-merit with the electricity price; EE/O represents the electrical energy (kWh) required to degrade 90% of the target compound in 1 m3 of water [53]:
E E / O = P · t V
where P, t, and V are the power consumption (kW), the 90% degradation time (h), and the volume of treated water (m3), respectively.
The performance of the MnO2-activated PDS system for diuron degradation was compared with that of the ultrasound-activated PDS process employed by Lee et al. for ibuprofen removal from water [54]. The diuron OOC was calculated at 30 °C to minimize the electrical energy consumption (P = 300 kW per m3). The dosages of PDS and MnO2 were 4.5 and 24 g L−1, respectively. Moreover, for a more correct comparison of the results, the same values of initial molar concentration (0.024 mM), electrical energy cost (0.1319 USD kWh−1), and PDS cost (1.00 USD kg−1) were used for diuron as reported for ibuprofen [54]. A cost of 3.00 USD kg−1 was estimated for MnO2, which was divided by three to take into account the number of degradation cycles with full MnO2 efficiency. Based on the above considerations, the OOC for diuron degradation by MnO2-activated PDS was found to be 82.5 USD m−3, which is only slightly higher than the cost of ibuprofen degradation by ultrasound-activated PDS [54]. These results coupled with the advantages of ease of use and simple engineering design make the MnO2–PDS system a valid alternative to the ultrasound activation of PDS (and to the other AOPs) for pollution remediation.

4. Conclusions

In this work, the effect of heat and MnO2 for promoting diuron degradation by activated PDS was investigated. It was found that MnO2 alone has a low degradation capacity for diuron, whereas PDS alone exhibits an increasing oxidation efficiency with increasing temperature. Complete removal of diuron was obtained during the first hours at the highest temperature investigated (55 °C) for both the experiments conducted with PDS alone and those in the co-presence of PDS and MnO2. The combined use of PDS and MnO2 has a positive effect on diuron degradation, and this is particularly evident at lower temperatures. The estimated overall cost of the diuron degradation process is of the same order of magnitude of other AOPs, thus rendering PDS–MnO2 an alternative efficient low energy demand system for water decontamination purposes.

Author Contributions

Conceptualization, S.S.; investigation, A.M. and S.S.; data curation, S.S.; writing—original draft preparation, A.F. and S.S.; writing—review and editing, S.S.; supervision, S.S. All authors have read and agreed to the published version of the manuscript.

Funding

This research received no external funding.

Institutional Review Board Statement

Not applicable.

Informed Consent Statement

Not applicable.

Data Availability Statement

Not applicable.

Conflicts of Interest

The authors declare no conflict of interest.

References

  1. Saleh, I.A.; Zouari, N.; Al-Ghouti, M.A. Removal of pesticides from water and wastewater: Chemical, physical and biological treatment approaches. Environ. Technol. Innov. 2020, 19, 101026. [Google Scholar] [CrossRef]
  2. Wang, M.; Lv, J.; Deng, H.; Liu, Q.; Liang, S. Occurrence and Removal of Triazine Herbicides during Wastewater Treatment Processes and Their Environmental Impact on Aquatic Life. Int. J. Environ. Res. Public Health 2022, 19, 4557. [Google Scholar] [CrossRef]
  3. Liu, Y.; Ji, X.; Yang, J.; Tang, W.; Zhu, Y.; Wang, Y.; Zhang, Y.; Zhang, Y.; Duan, J.; Li, W. Degradation of the typical herbicide atrazine by UV/persulfate: Kinetics and mechanisms. Environ. Sci. Pollut. Res. 2022, 29, 43928–43941. [Google Scholar] [CrossRef] [PubMed]
  4. Lai, F.; Tian, F.X.; Xu, B.; Ye, W.K.; Gao, Y.Q.; Chen, C.; Xing, H.B.; Wang, B.; Xie, M.J.; Hu, X.J. A comparative study on the degradation of phenylurea herbicides by UV/persulfate process: Kinetics, mechanisms, energy demand and toxicity evaluation associated with DBPs. Chem. Eng. J. 2022, 428, 132088. [Google Scholar] [CrossRef]
  5. Bhowmick, T.; Sen, G.; Mukherjee, J.; Das, R. Assessing the effect of herbicide diuron on river biofilm: A statistical model. Chemosphere 2021, 282, 131104. [Google Scholar] [CrossRef] [PubMed]
  6. Yu, Y.; Zhou, S.; Bu, L.; Shi, Z.; Zhu, S. Degradation of Diuron by Electrochemically Activated Persulfate. Water Air. Soil Pollut. 2016, 227, 1–9. [Google Scholar] [CrossRef]
  7. Salvestrini, S. Diuron herbicide degradation catalyzed by low molecular weight humic acid-like compounds. Environ. Chem. Lett. 2013, 11, 359–363. [Google Scholar] [CrossRef]
  8. Rodriguez, S.; Santos, A.; Romero, A.; Vicente, F. Kinetic of oxidation and mineralization of priority and emerging pollutants by activated persulfate. Chem. Eng. J. 2012, 213, 225–234. [Google Scholar] [CrossRef]
  9. Brillas, E. Recent development of electrochemical advanced oxidation of herbicides. A review on its application to wastewater treatment and soil remediation. J. Clean. Prod. 2021, 290, 125841. [Google Scholar] [CrossRef]
  10. de Camargo Lima Beluci, N.; Tonial dos Santos, T.R.; Marcuzzo, J.S.; Bergamasco, R. Facile filtration system to remove Diuron in aqueous solutions. J. Hazard. Mater. 2021, 404, 124163. [Google Scholar] [CrossRef]
  11. Qi, H.; Sun, X.; Sun, Z. Porous graphite felt electrode with catalytic defects for enhanced degradation of pollutants by electro-Fenton process. Chem. Eng. J. 2021, 403, 126270. [Google Scholar] [CrossRef]
  12. Salvestrini, S.; Jovanović, J.; Adnadjević, B. Comparison of adsorbent materials for herbicide diuron removal from water. Desalin. Water Treat. 2016, 57, 22868–22877. [Google Scholar] [CrossRef]
  13. Wang, Y.; Shu, L.; Jegatheesan, V.; Gao, B. Coagulation and nano-filtration: A hybrid system for the removal of lower molecular weight organic compounds (LMWOC). Desalination Water Treat. 2012, 11, 23–31. [Google Scholar] [CrossRef]
  14. Wang, Y.; Shu, L.; Jegatheesan, V.; Gao, B. Removal and adsorption of diuron through nanofiltration membrane: The effects of ionic environment and operating pressures. Sep. Purif. Technol. 2010, 74, 236–241. [Google Scholar] [CrossRef]
  15. Fujioka, T.; Kodamatani, H.; Yujue, W.; Yu, K.D.; Wanjaya, E.R.; Yuan, H.; Fang, M.; Snyder, S.A. Assessing the passage of small pesticides through reverse osmosis membranes. J. Memb. Sci. 2020, 595, 117577. [Google Scholar] [CrossRef]
  16. Bumroongsakulsawat, P.; Khongthon, W.; Pavarajarn, V. Degradation of diuron in water by electrochemical advanced oxidation in a microreactor: Effects of anion contamination on degradation and toxicity. J. Environ. Chem. Eng. 2020, 8, 103824. [Google Scholar] [CrossRef]
  17. Zheng, Z.; Deletic, A.; Toe, C.Y.; Amal, R.; Zhang, X.; Pickford, R.; Zhou, S.; Zhang, K. Photo-electrochemical oxidation herbicides removal in stormwater: Degradation mechanism and pathway investigation. J. Hazard. Mater. 2022, 436, 129239. [Google Scholar] [CrossRef]
  18. Salvestrini, S.; Fenti, A.; Chianese, S.; Iovino, P.; Musmarra, D. Electro-Oxidation of Humic Acids Using Platinum Electrodes: An Experimental Approach and Kinetic Modelling. Water 2020, 12, 2250. [Google Scholar] [CrossRef]
  19. Fenti, A.; Jin, Y.; Rhoades, A.J.H.; Dooley, G.P.; Iovino, P.; Salvestrini, S.; Musmarra, D.; Mahendra, S.; Peaslee, G.F.; Blotevogel, J. Performance testing of mesh anodes for in situ electrochemical oxidation of PFAS. Chem. Eng. J. Adv. 2022, 9, 100205. [Google Scholar] [CrossRef]
  20. Sugihartono, V.E.; Mahasti, N.N.N.; Shih, Y.J.; Huang, Y.H. Photo-persulfate oxidation and mineralization of benzoic acid: Kinetics and optimization under UVC irradiation. Chemosphere 2022, 296, 133663. [Google Scholar] [CrossRef]
  21. Cheng, M.; Zeng, G.; Huang, D.; Lai, C.; Xu, P.; Zhang, C.; Liu, Y. Hydroxyl radicals based advanced oxidation processes (AOPs) for remediation of soils contaminated with organic compounds: A review. Chem. Eng. J. 2016, 284, 582–598. [Google Scholar] [CrossRef]
  22. Lee, J.; Von Gunten, U.; Kim, J.H. Persulfate-Based Advanced Oxidation: Critical Assessment of Opportunities and Roadblocks. Environ. Sci. Technol. 2020, 54, 3064–3081. [Google Scholar] [CrossRef] [PubMed]
  23. Zhi, D.; Lin, Y.; Jiang, L.; Zhou, Y.; Huang, A.; Yang, J.; Luo, L. Remediation of persistent organic pollutants in aqueous systems by electrochemical activation of persulfates: A review. J. Environ. Manag. 2020, 260, 110125. [Google Scholar] [CrossRef] [PubMed]
  24. Xu, X.; Zhang, Y.; Zhou, S.; Huang, R.; Huang, S.; Kuang, H.; Zeng, X.; Zhao, S. Activation of persulfate by MnOOH: Degradation of organic compounds by nonradical mechanism. Chemosphere 2021, 272, 129629. [Google Scholar] [CrossRef] [PubMed]
  25. Wang, N.; He, L.; Sun, X.; Li, X.; Li, M. The transformation of Benzophenone-3 in natural waters and AOPs: The roles of reactive oxygen species and potential environmental risks of products. J. Hazard. Mater. 2022, 427, 127941. [Google Scholar] [CrossRef] [PubMed]
  26. Wang, N.; Lv, G.; He, L.; Sun, X. New insight into photodegradation mechanisms, kinetics and health effects of p-nitrophenol by ozonation in polluted water. J. Hazard. Mater. 2021, 403, 123805. [Google Scholar] [CrossRef]
  27. Khan, S.; He, X.; Khan, J.A.; Khan, H.M.; Boccelli, D.L.; Dionysiou, D.D. Kinetics and mechanism of sulfate radical- and hydroxyl radical-induced degradation of highly chlorinated pesticide lindane in UV/peroxymonosulfate system. Chem. Eng. J. 2017, 318, 135–142. [Google Scholar] [CrossRef]
  28. Ren, W.; Nie, G.; Zhou, P.; Zhang, H.; Duan, X.; Wang, S. The Intrinsic Nature of Persulfate Activation and N-Doping in Carbocatalysis. Environ. Sci. Technol. 2020, 54, 6438–6447. [Google Scholar] [CrossRef] [PubMed]
  29. Wang, J.; Wang, S. Activation of persulfate (PS) and peroxymonosulfate (PMS) and application for the degradation of emerging contaminants. Chem. Eng. J. 2018, 334, 1502–1517. [Google Scholar] [CrossRef]
  30. Wacławek, S.; Lutze, H.V.; Grübel, K.; Padil, V.V.T.; Černík, M.; Dionysiou, D.D. Chemistry of persulfates in water and wastewater treatment: A review. Chem. Eng. J. 2017, 330, 44–62. [Google Scholar] [CrossRef]
  31. Tian, D.; Zhou, H.; Zhang, H.; Zhou, P.; You, J.; Yao, G.; Pan, Z.; Liu, Y.; Lai, B. Heterogeneous photocatalyst-driven persulfate activation process under visible light irradiation: From basic catalyst design principles to novel enhancement strategies. Chem. Eng. J. 2022, 428, 131166. [Google Scholar] [CrossRef]
  32. Gabet, A.; Métivier, H.; de Brauer, C.; Mailhot, G.; Brigante, M. Hydrogen peroxide and persulfate activation using UVA-UVB radiation: Degradation of estrogenic compounds and application in sewage treatment plant waters. J. Hazard. Mater. 2021, 405, 124693. [Google Scholar] [CrossRef] [PubMed]
  33. Zheng, X.; Niu, X.; Zhang, D.; Lv, M.; Ye, X.; Ma, J.; Lin, Z.; Fu, M. Metal-based catalysts for persulfate and peroxymonosulfate activation in heterogeneous ways: A review. Chem. Eng. J. 2022, 429, 132323. [Google Scholar] [CrossRef]
  34. Cao, Y.; Yuan, X.; Zhao, Y.; Wang, H. In-situ soil remediation via heterogeneous iron-based catalysts activated persulfate process: A review. Chem. Eng. J. 2022, 431, 133833. [Google Scholar] [CrossRef]
  35. Rajabi, S.; Nasiri, A.; Hashemi, M. Enhanced activation of persulfate by CuCoFe2O4@MC/AC as a novel nanomagnetic heterogeneous catalyst with ultrasonic for metronidazole degradation. Chemosphere 2022, 286, 131872. [Google Scholar] [CrossRef] [PubMed]
  36. Huang, Z.H.; Ji, Z.Y.; Zhao, Y.Y.; Liu, J.; Li, F.; Yuan, J.S. Treatment of wastewater containing 2-methoxyphenol by persulfate with thermal and alkali synergistic activation: Kinetics and mechanism. Chem. Eng. J. 2020, 380, 122411. [Google Scholar] [CrossRef]
  37. Hou, X.; Zhan, G.; Huang, X.; Wang, N.; Ai, Z.; Zhang, L. Persulfate activation induced by ascorbic acid for efficient organic pollutants oxidation. Chem. Eng. J. 2020, 382, 122355. [Google Scholar] [CrossRef]
  38. Tan, C.; Gao, N.; Deng, Y.; An, N.; Deng, J. Heat-activated persulfate oxidation of diuron in water. Chem. Eng. J. 2012, 203, 294–300. [Google Scholar] [CrossRef]
  39. Ren, W.; Huang, X.; Wang, L.; Liu, X.; Zhou, Z.; Wang, Y.; Lin, C.; He, M.; Ouyang, W. Degradation of simazine by heat-activated peroxydisulfate process: A coherent study on kinetics, radicals and models. Chem. Eng. J. 2021, 426, 131876. [Google Scholar] [CrossRef]
  40. Lebik-Elhadi, H.; Frontistis, Z.; Ait-Amar, H.; Madjene, F.; Mantzavinos, D. Degradation of pesticide thiamethoxam by heat–activated and ultrasound–activated persulfate: Effect of key operating parameters and the water matrix. Process Saf. Environ. Prot. 2020, 134, 197–207. [Google Scholar] [CrossRef]
  41. Ji, Y.; Dong, C.; Kong, D.; Lu, J.; Zhou, Q. Heat-activated persulfate oxidation of atrazine: Implications for remediation of groundwater contaminated by herbicides. Chem. Eng. J. 2015, 263, 45–54. [Google Scholar] [CrossRef]
  42. Oh, W.D.; Lim, T.T. Design and application of heterogeneous catalysts as peroxydisulfate activator for organics removal: An overview. Chem. Eng. J. 2019, 358, 110–133. [Google Scholar] [CrossRef]
  43. Wu, P.; Zhao, S.; Jin, X.; Chong, Y.; Li, Y.; Li, A.; Lin, J.; Qiu, Y.; Ye, D. Acid-activated layered δ-MnO2 promotes VOCs combustion. Appl. Surf. Sci. 2022, 574, 151707. [Google Scholar] [CrossRef]
  44. Fang, C.; Gujarati, H.; Osinaga, F.; Hsia, V.; Cheney, M.A.; Kharel, M.K. Optimization of the catalytic activity of manganese dioxide (MnO2) nanoparticles for degradation of environmental pollutants. Res. Chem. Intermed. 2021, 47, 3673–3690. [Google Scholar] [CrossRef]
  45. Jiang, J.; Wang, Z.; Chen, Y.; He, A.; Li, J.; Sheng, G.D. Metal inhibition on the reactivity of manganese dioxide toward organic contaminant oxidation in relation to metal adsorption and ionic potential. Chemosphere 2017, 170, 95–103. [Google Scholar] [CrossRef]
  46. Vanore, P.; Coppola, E.; Iovino, P.; Leone, V.; Salvestrini, S.; Capasso, S. Sorption thermodynamics of organic pollutants onto zeolitic tuff: Isosteric and standard enthalpy. J. Water Chem. Technol. 2017, 39, 228–232. [Google Scholar] [CrossRef]
  47. Salvestrini, S. A modification of the Langmuir rate equation for diffusion-controlled adsorption kinetics. React. Kinet. Mech. Catal. 2019, 128, 571–586. [Google Scholar] [CrossRef]
  48. Lei, Y.J.; Tian, Y.; Fang, C.; Zhan, W.; Duan, L.C.; Zhang, J.; Zuo, W.; Kong, X.W. Insights into the oxidation kinetics and mechanism of diesel hydrocarbons by ultrasound activated persulfate in a soil system. Chem. Eng. J. 2019, 378, 122253. [Google Scholar] [CrossRef]
  49. Salvestrini, S.; Fenti, A.; Chianese, S.; Iovino, P.; Musmarra, D. Diclofenac sorption from synthetic water: Kinetic and thermodynamic analysis. J. Environ. Chem. Eng. 2020, 8, 104105. [Google Scholar] [CrossRef]
  50. Fenti, A.; Salvestrini, S. Analytical solution of the Langmuir-based linear driving force model and its application to the adsorption kinetics of boscalid onto granular activated carbon. React. Kinet. Mech. Catal. 2018, 125, 1–13. [Google Scholar] [CrossRef]
  51. Salvestrini, S.; Canzano, S.; Iovino, P.; Leone, V.; Capasso, S. Modelling the biphasic sorption of simazine, imidacloprid, and boscalid in water/soil systems. J. Environ. Sci. Health Part B Pestic. Food Contam. Agric. Wastes 2014, 49, 578–590. [Google Scholar] [CrossRef] [PubMed]
  52. Zhou, T.; Du, J.; Wang, Z.; Xiao, G.; Luo, L.; Faheem, M.; Ling, H.; Bao, J. Degradation of sulfamethoxazole by MnO2/heat-activated persulfate: Kinetics, synergistic effect and reaction mechanism. Chem. Eng. J. Adv. 2022, 9, 100200. [Google Scholar] [CrossRef]
  53. Bolton, J.R.; Bircher, K.G.; Tumas, W.; Tolman, C.A. Figures-of-Merit for the Technical Development and Application of Advanced Oxidation Processes. J. Adv. Oxid. Technol. 1996, 1, 13–17. [Google Scholar] [CrossRef]
  54. Lee, Y.; Lee, S.; Cui, M.; Ren, Y.; Park, B.; Ma, J.; Han, Z.; Khim, J. Activation of peroxodisulfate and peroxymonosulfate by ultrasound with different frequencies: Impact on ibuprofen removal efficient, cost estimation and energy analysis. Chem. Eng. J. 2021, 413, 127487. [Google Scholar] [CrossRef]
Figure 1. Diuron chemical structure.
Cleantechnol 04 00065 g001
Figure 2. Diuron experiments apparatus.
Cleantechnol 04 00065 g002
Figure 3. (A) Size distributions and (B) ζ-potential values of MnO2 samples at different concentrations: 0.6 (a), 1.2 (b), 1.8 (c), and 2.4 (d) g L−1. (C) Average hydrodynamic diameter (red full dots), PDI (empty black dots), and ζ-potential values (blue full dots) of MnO2 samples at different MnO2/water dosages.
Cleantechnol 04 00065 g003aCleantechnol 04 00065 g003b
Figure 4. Adsorption isotherm of MB onto MnO2.
Cleantechnol 04 00065 g004
Figure 5. Diuron degradation kinetics profiles in the presence of MnO2 (2.4 g L−1) at different temperatures; initial pH = 4.3.
Cleantechnol 04 00065 g005
Figure 6. Diuron degradation kinetics profiles in the presence of PDS (4.5 g L−1) at different temperatures; initial pH = 3.8.
Cleantechnol 04 00065 g006
Figure 7. Diuron degradation kinetics profiles in the co-presence of MnO2 (2.4 g L−1) and PDS (4.5 g L−1) at different temperatures; initial pH = 3.6.
Cleantechnol 04 00065 g007
Figure 8. Diuron degradation kinetics profiles in the presence of MnO2 (2.4 g L−1), in the presence of PDS (4.5 g L−1), and in their co-presence; T = 30 °C.
Cleantechnol 04 00065 g008
Figure 9. Diuron degradation kinetics profiles in the presence of PDS (4.5 g L−1) at different temperatures modeled by using a zero-order kinetics equation (Equation (5)).
Cleantechnol 04 00065 g009
Figure 10. Arrhenius plot for the diuron degradation kinetics in the presence of heat-activated PDS.
Cleantechnol 04 00065 g010
Figure 11. Diuron degradation kinetics profiles in the presence of MnO2 at different temperatures, modeled by using Equation (11).
Cleantechnol 04 00065 g011
Figure 12. Diuron degradation kinetics profiles in the co-presence of PDS and MnO2 at different temperatures, modeled by using Equation (15).
Cleantechnol 04 00065 g012
Figure 13. MnO2 efficiency (%) in five consecutive cycles.
Cleantechnol 04 00065 g013
Table 1. Kinetic parameters of diuron degradation.
T
(K)
k M
(μM−1 min−1)
k P
(μM min−1)
k P
(μM min−1)
303.15(7.9 ± 3.9) × 10−4(5.98 ± 0.79) × 10−2(7.20 ± 0.17) × 10−2
310.15(7.9 ± 3.9) × 10−4(14.1 ± 1.8) × 10−2(13.6 ± 0.1) × 10−2
318.15(7.9 ± 3.9) × 10−4(38.7 ± 1.3) × 10−2(48.9 ± 12.4) × 10−2
328.15(7.9 ± 3.9) × 10−4(103 ± 14) × 10−2(109 ± 14) × 10−2
Publisher’s Note: MDPI stays neutral with regard to jurisdictional claims in published maps and institutional affiliations.

