
Drying Kinetics of Macroalgae as a Function of Drying Gas Velocity and Material Bulk Density, Including Shrinkage


Abstract
:1. Introduction
2. Experiments
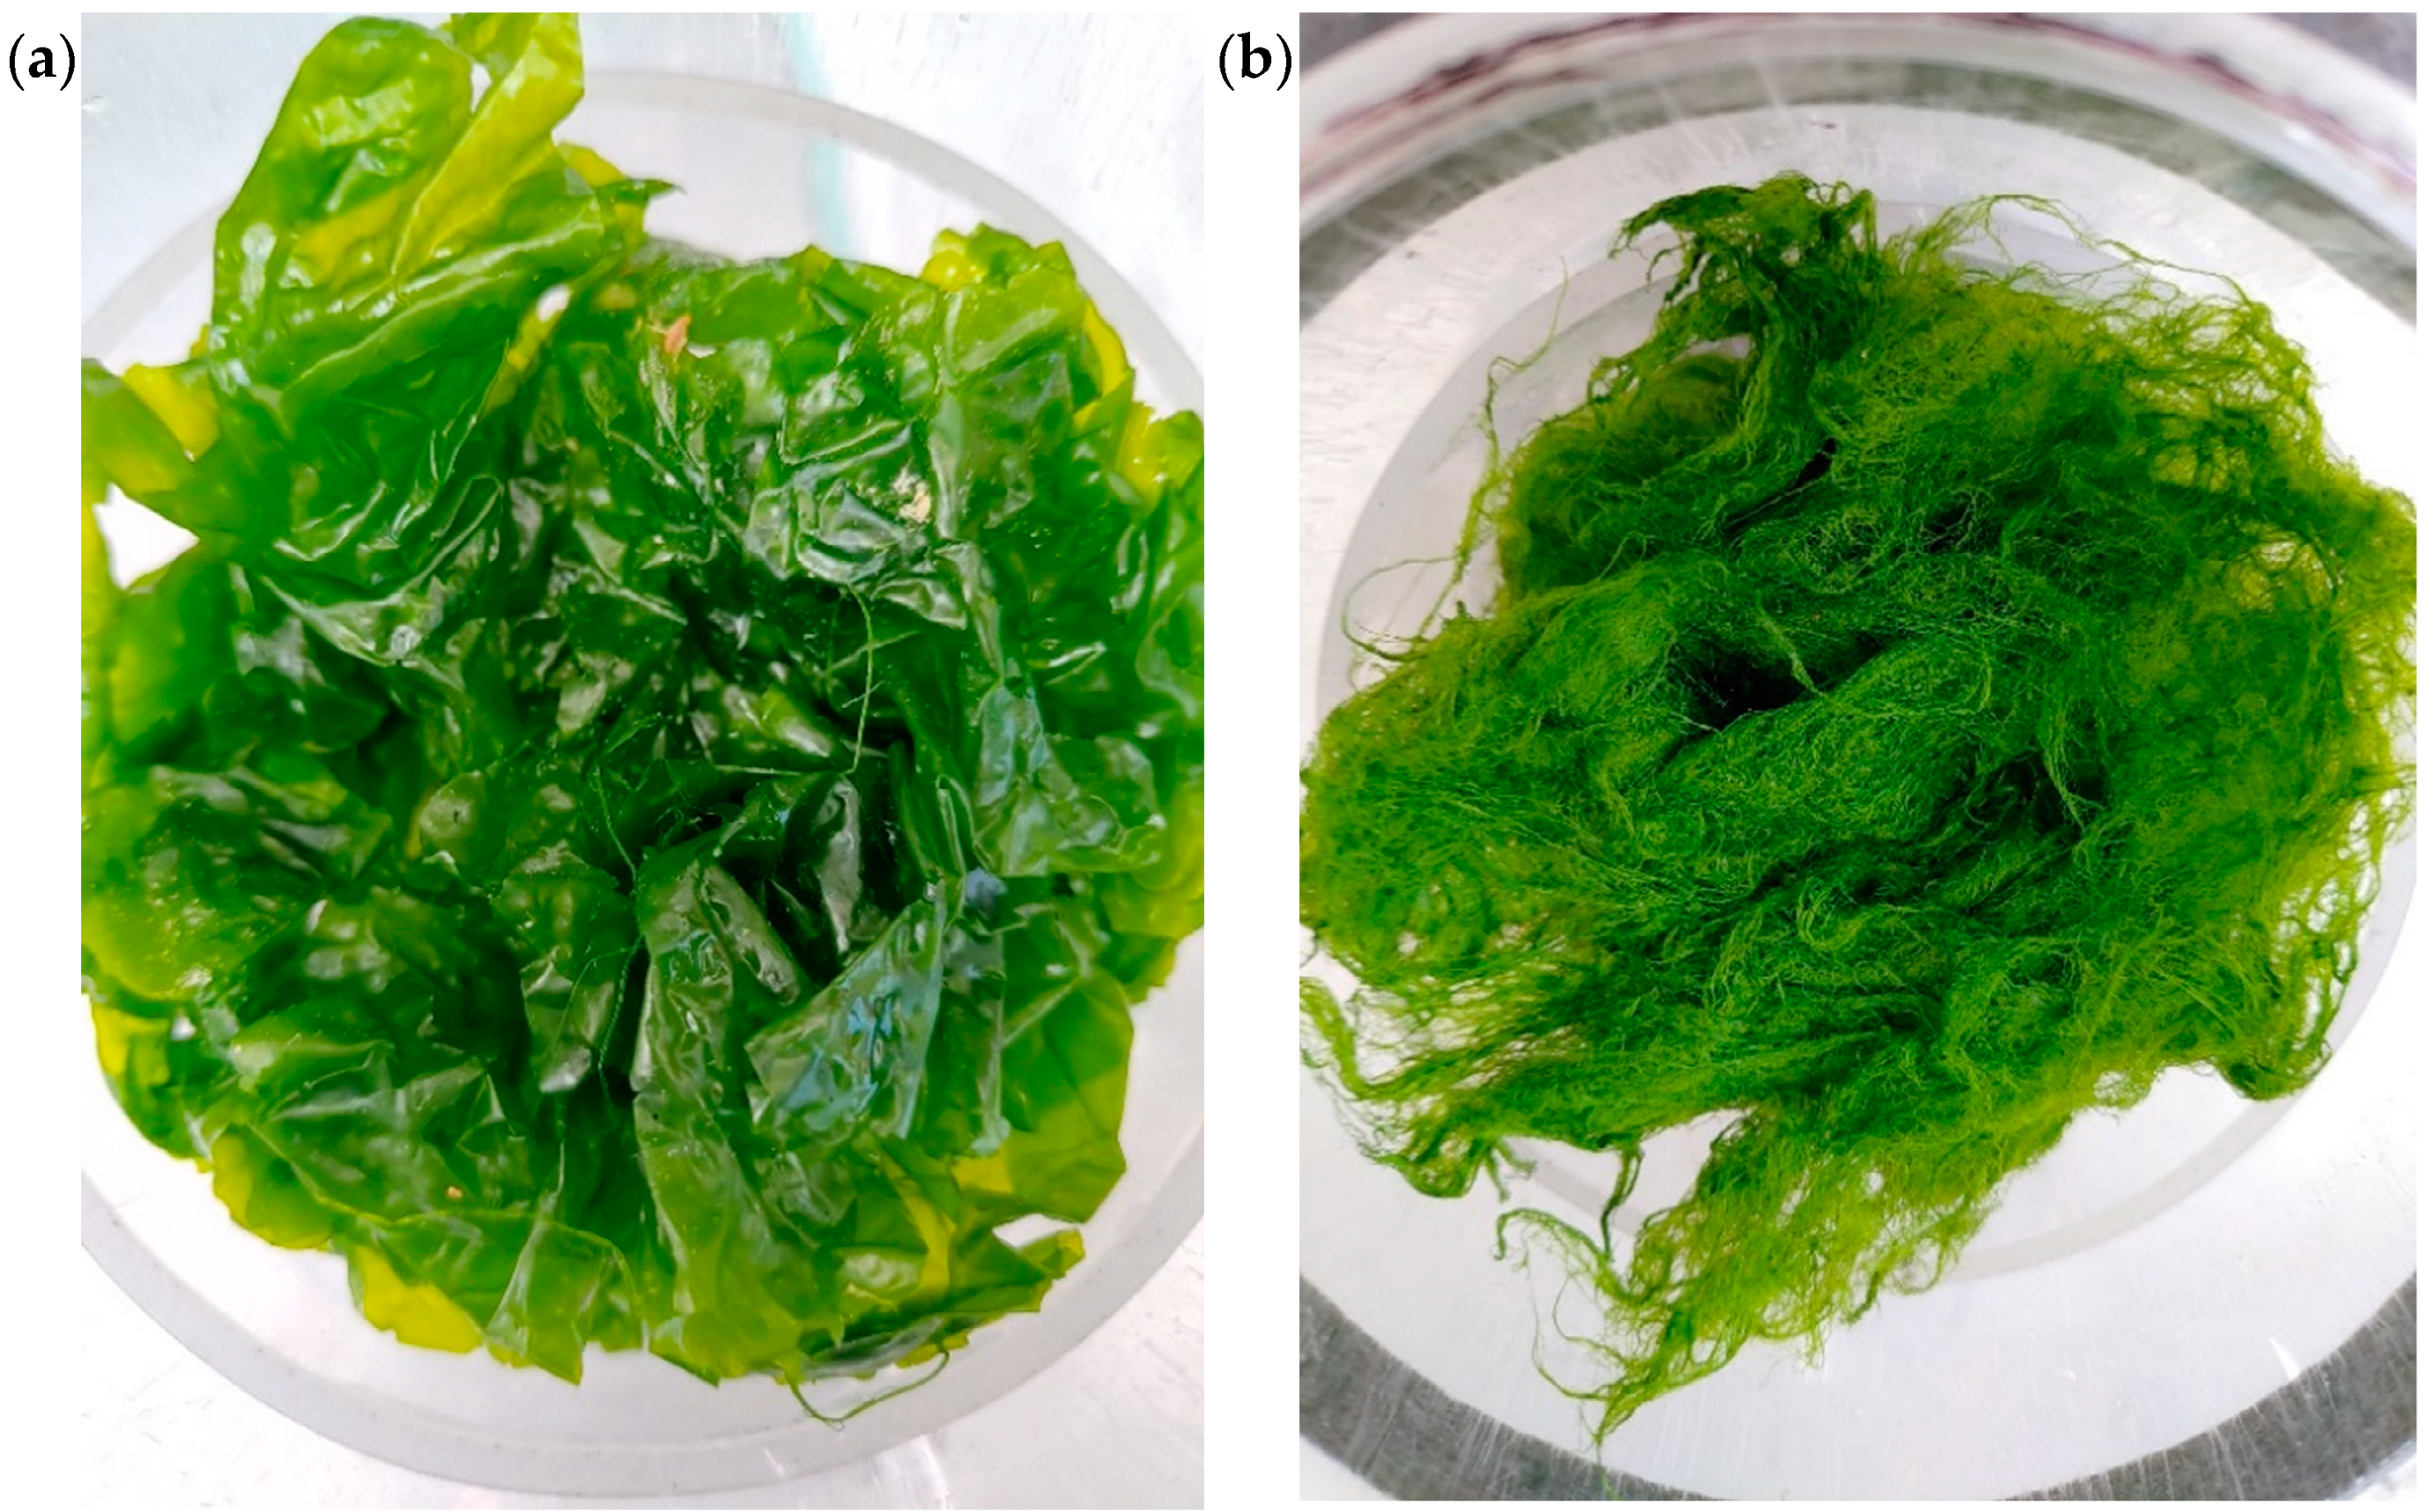
2.1. Materials
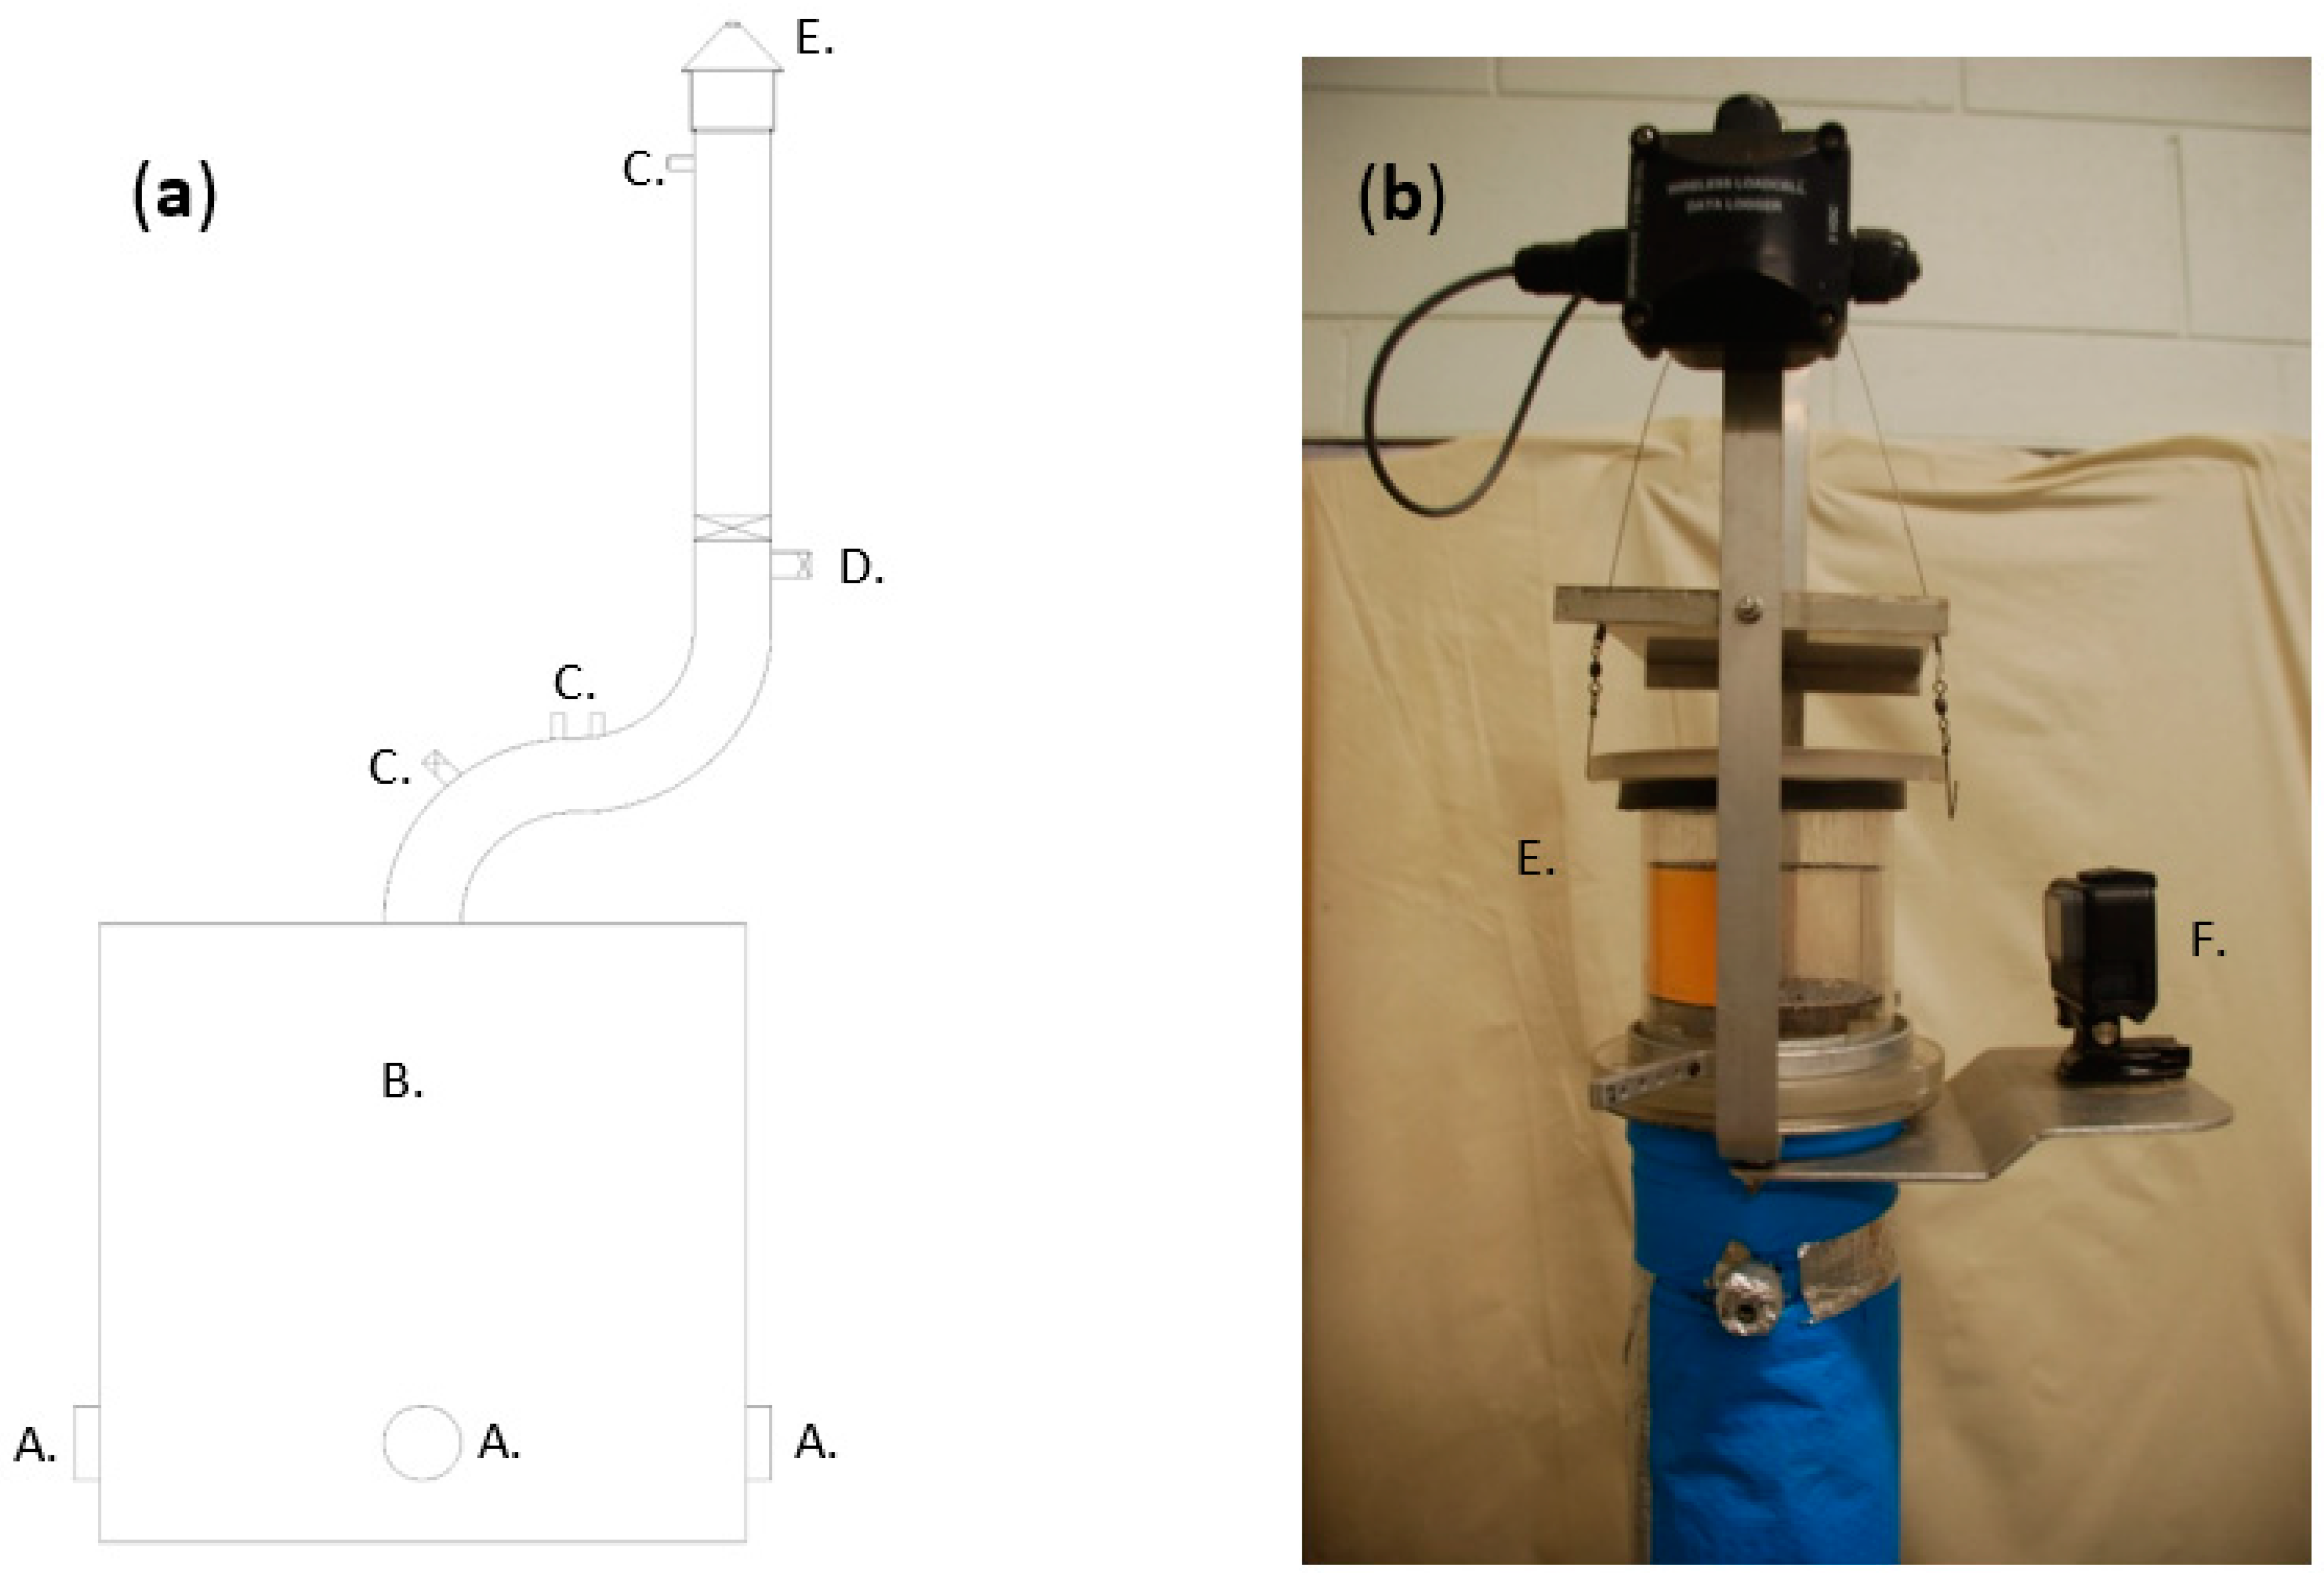
2.2. Apparatus
2.3. Experimental Design
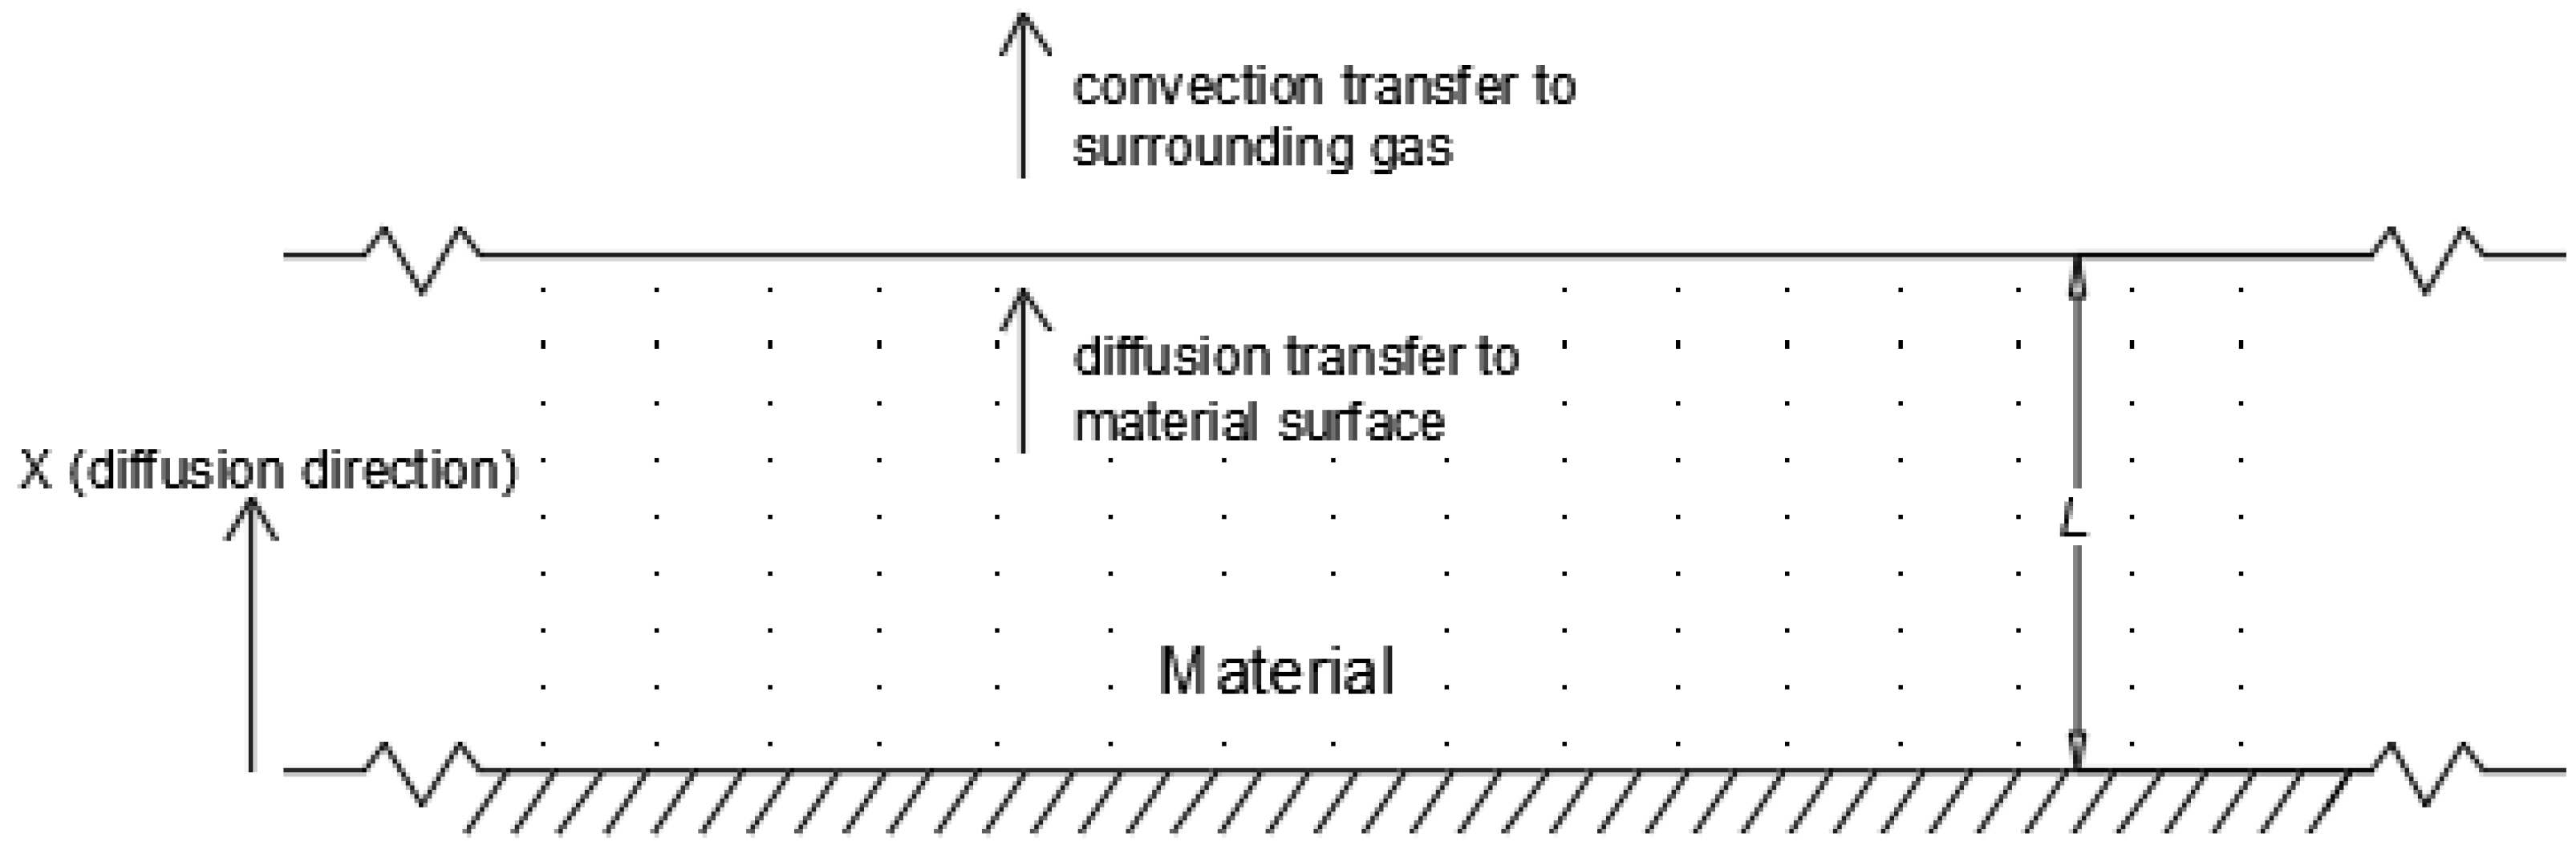
3. Theory
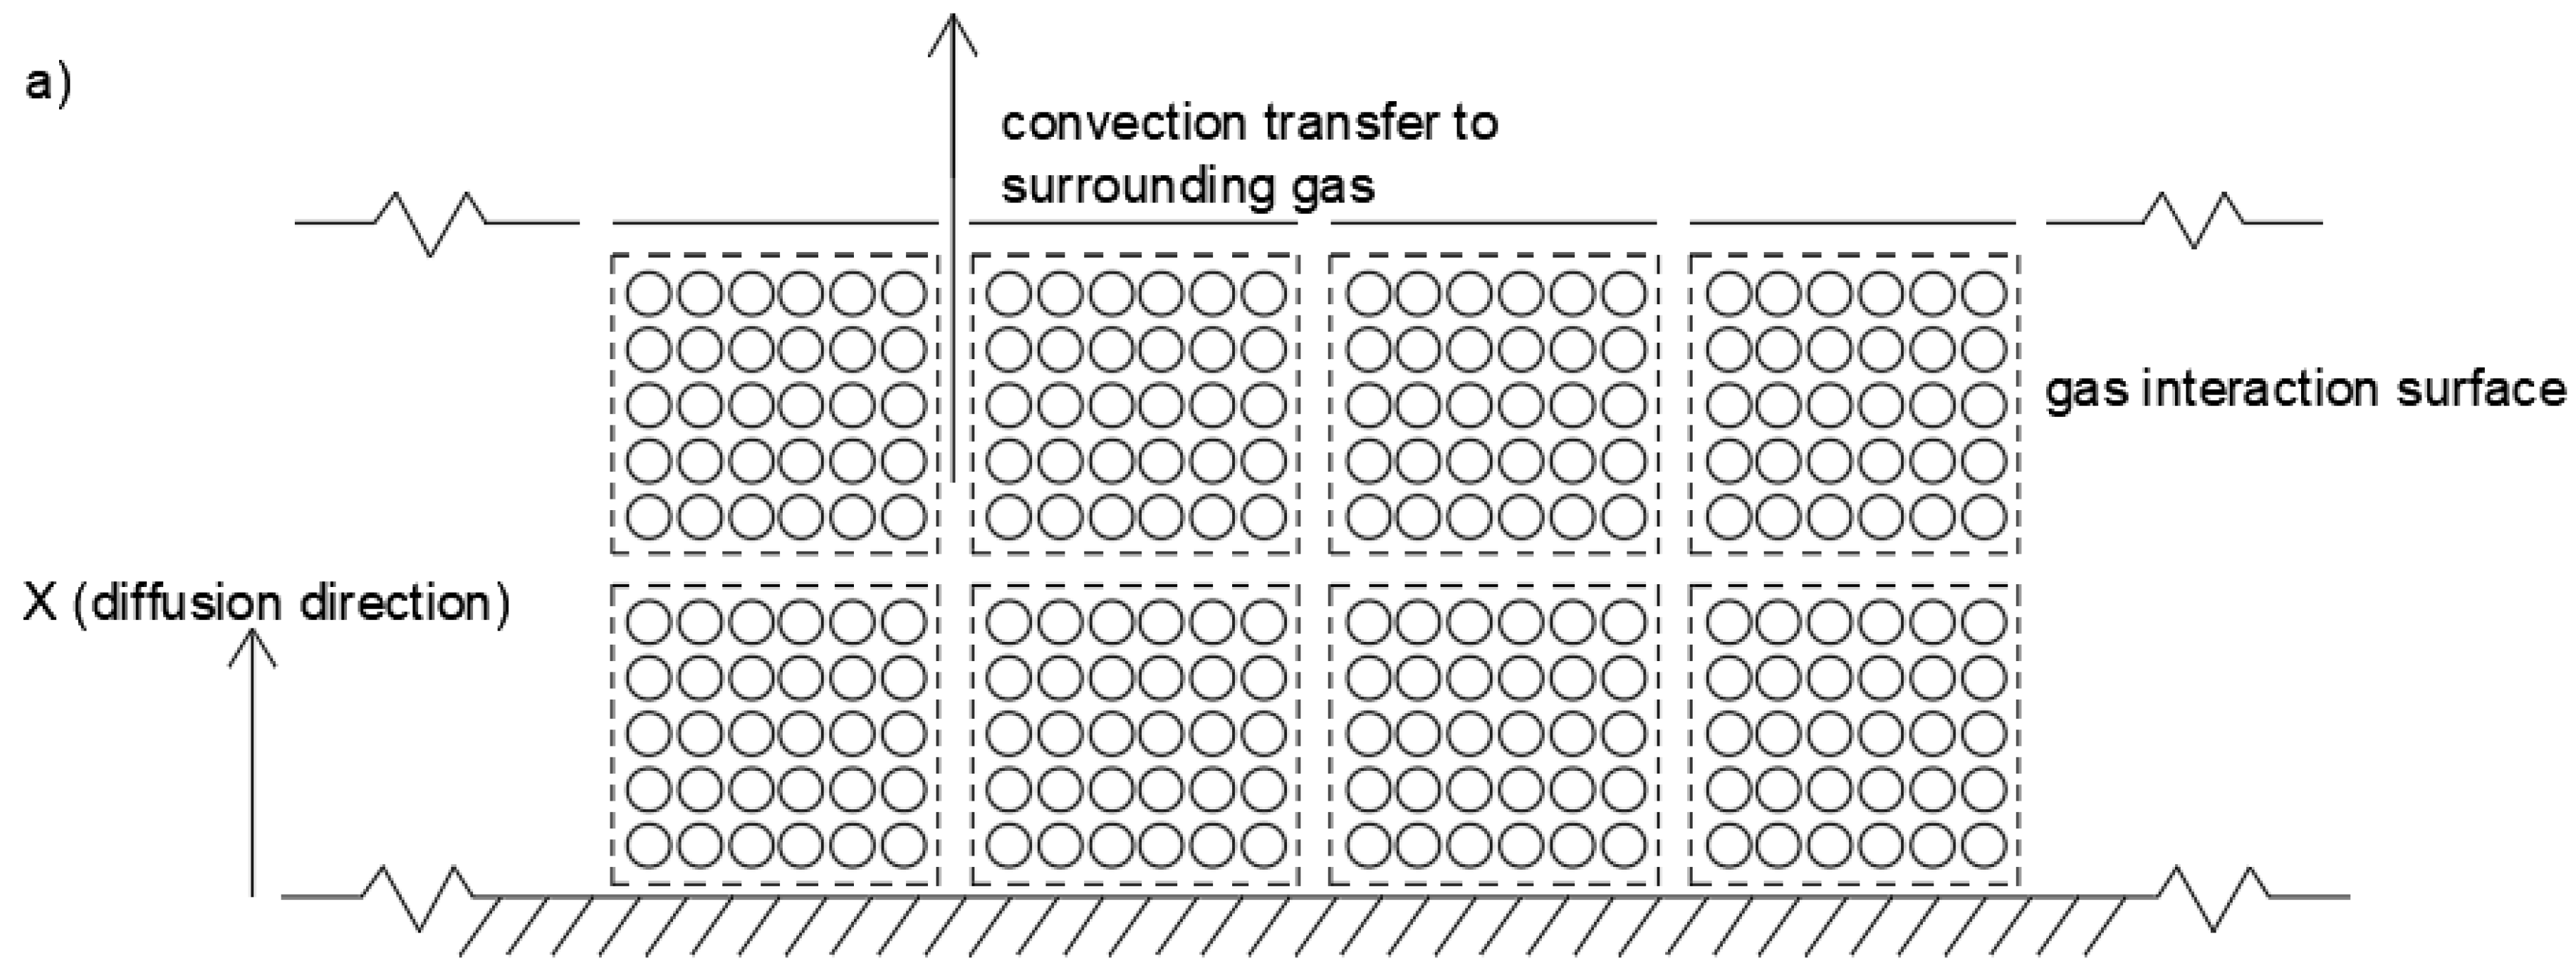
Modeling Shrinkage
4. Results
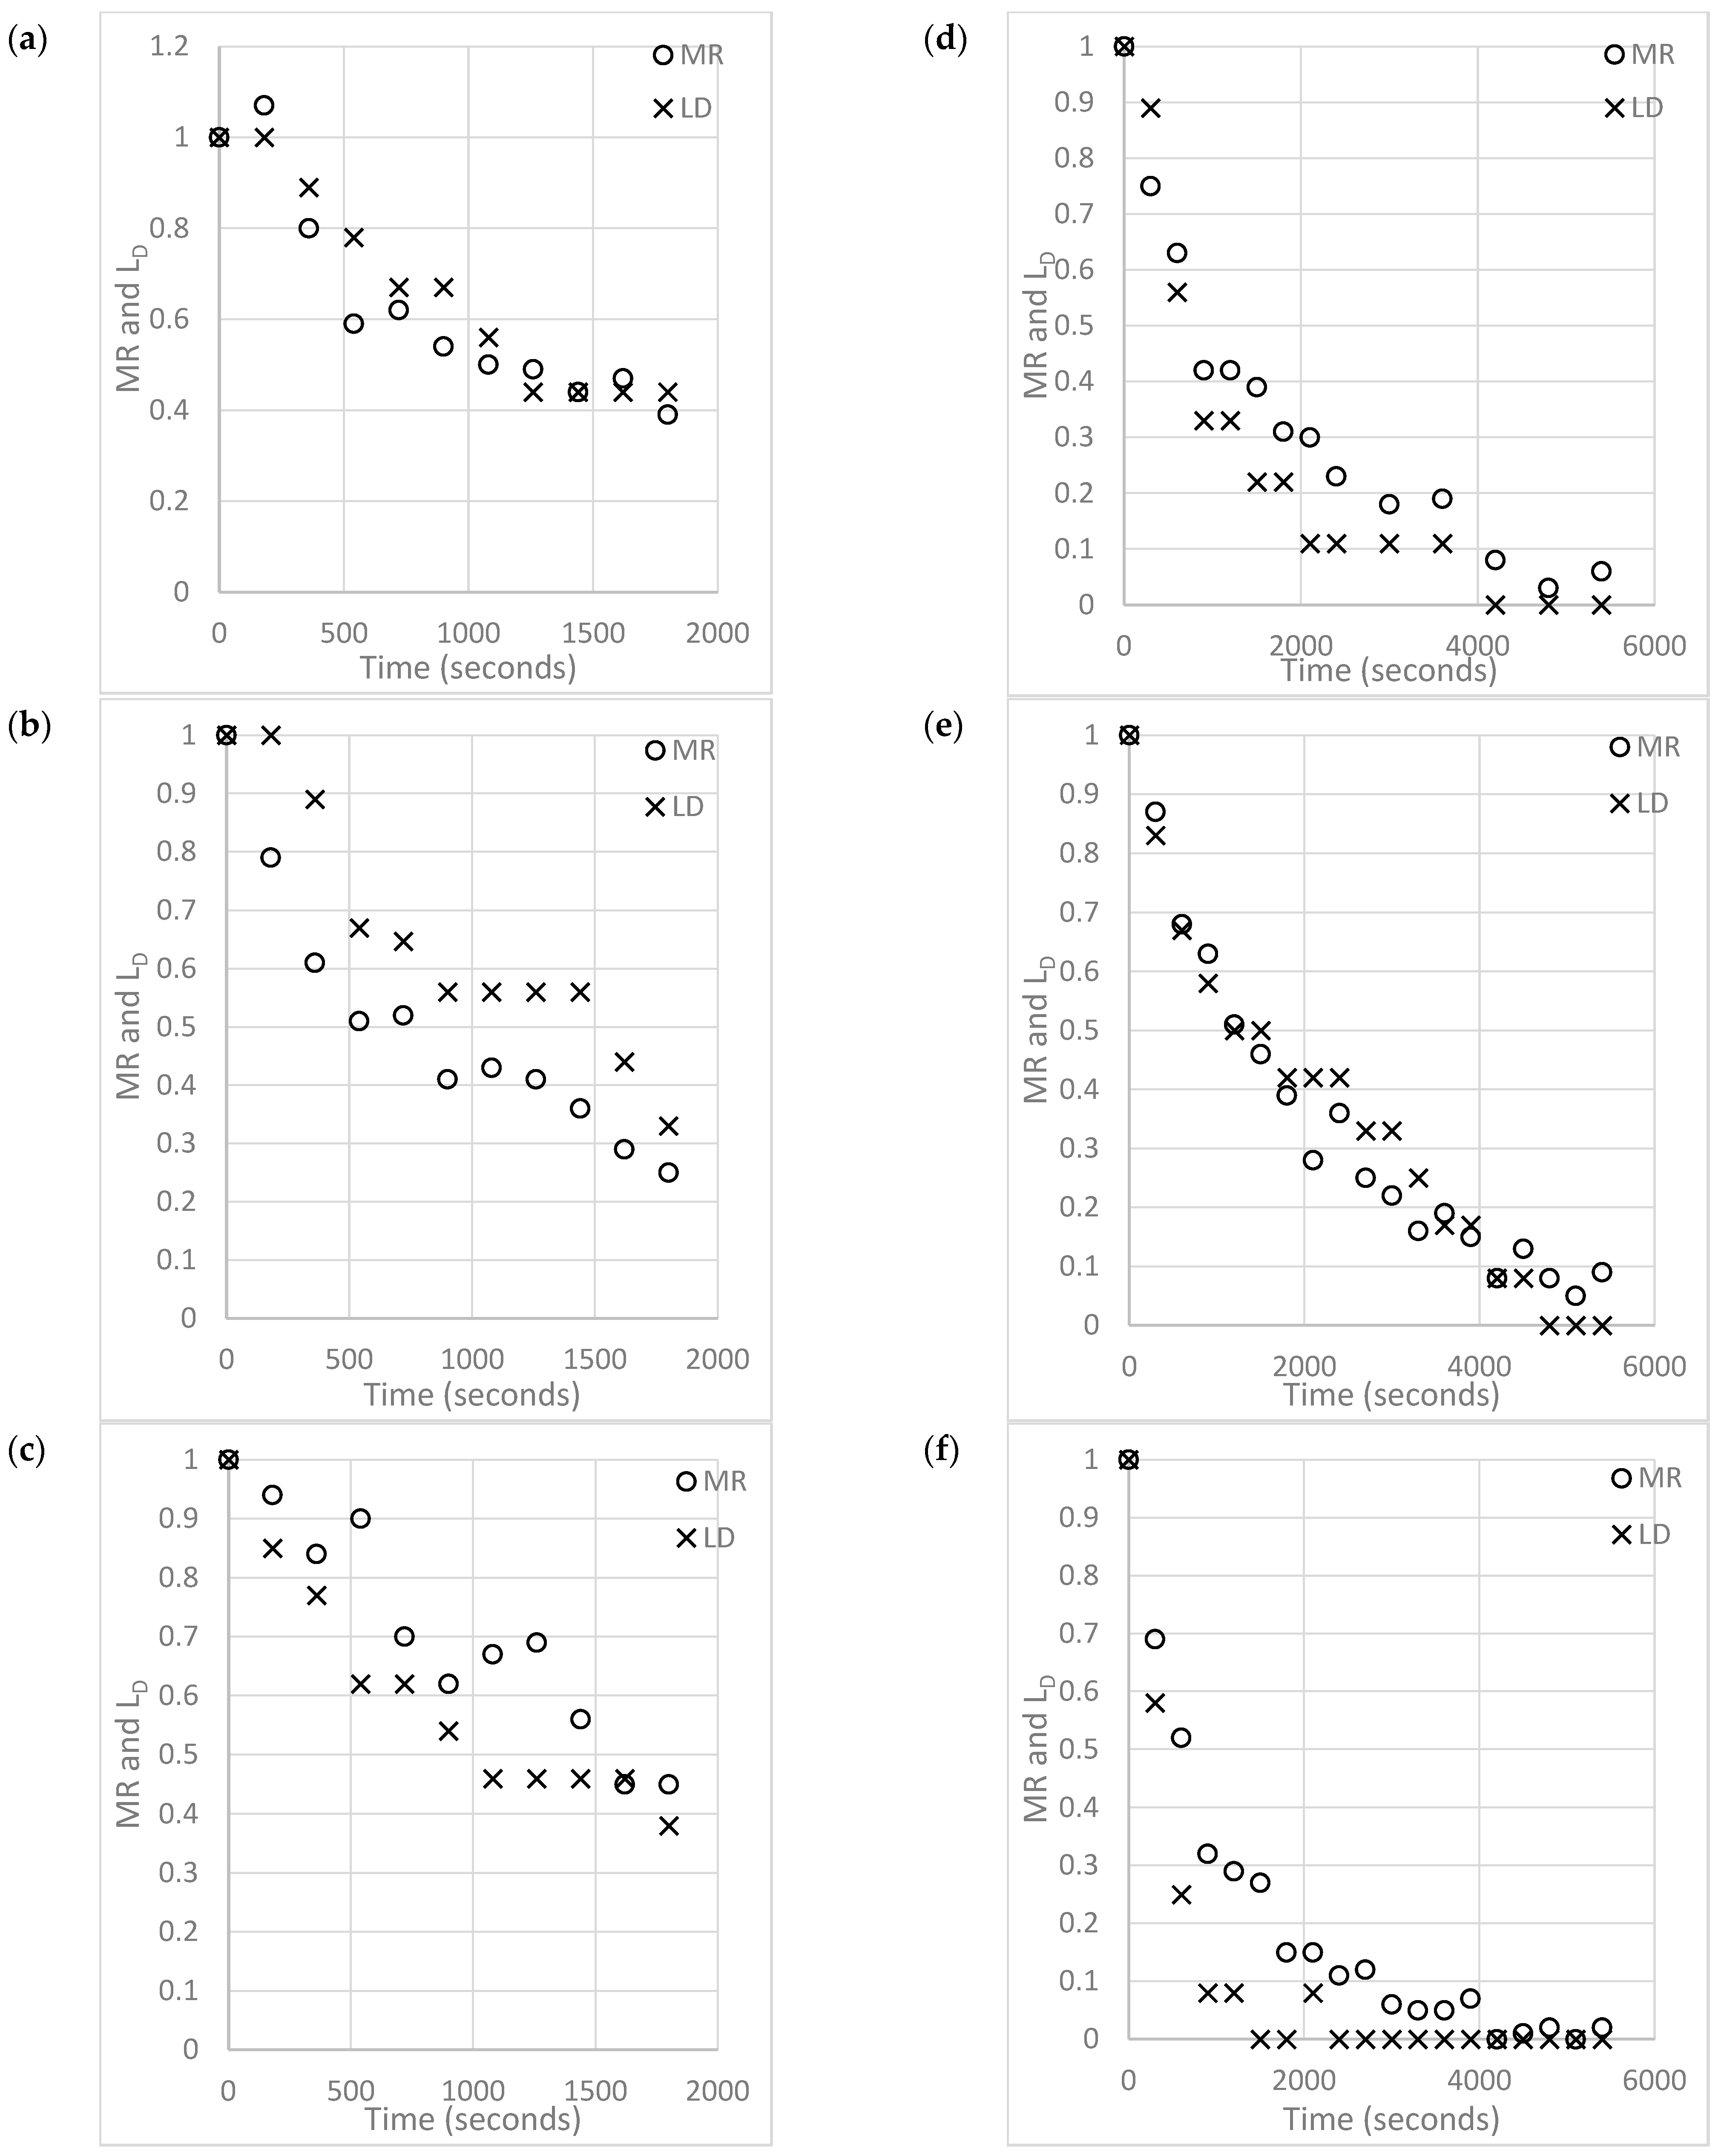
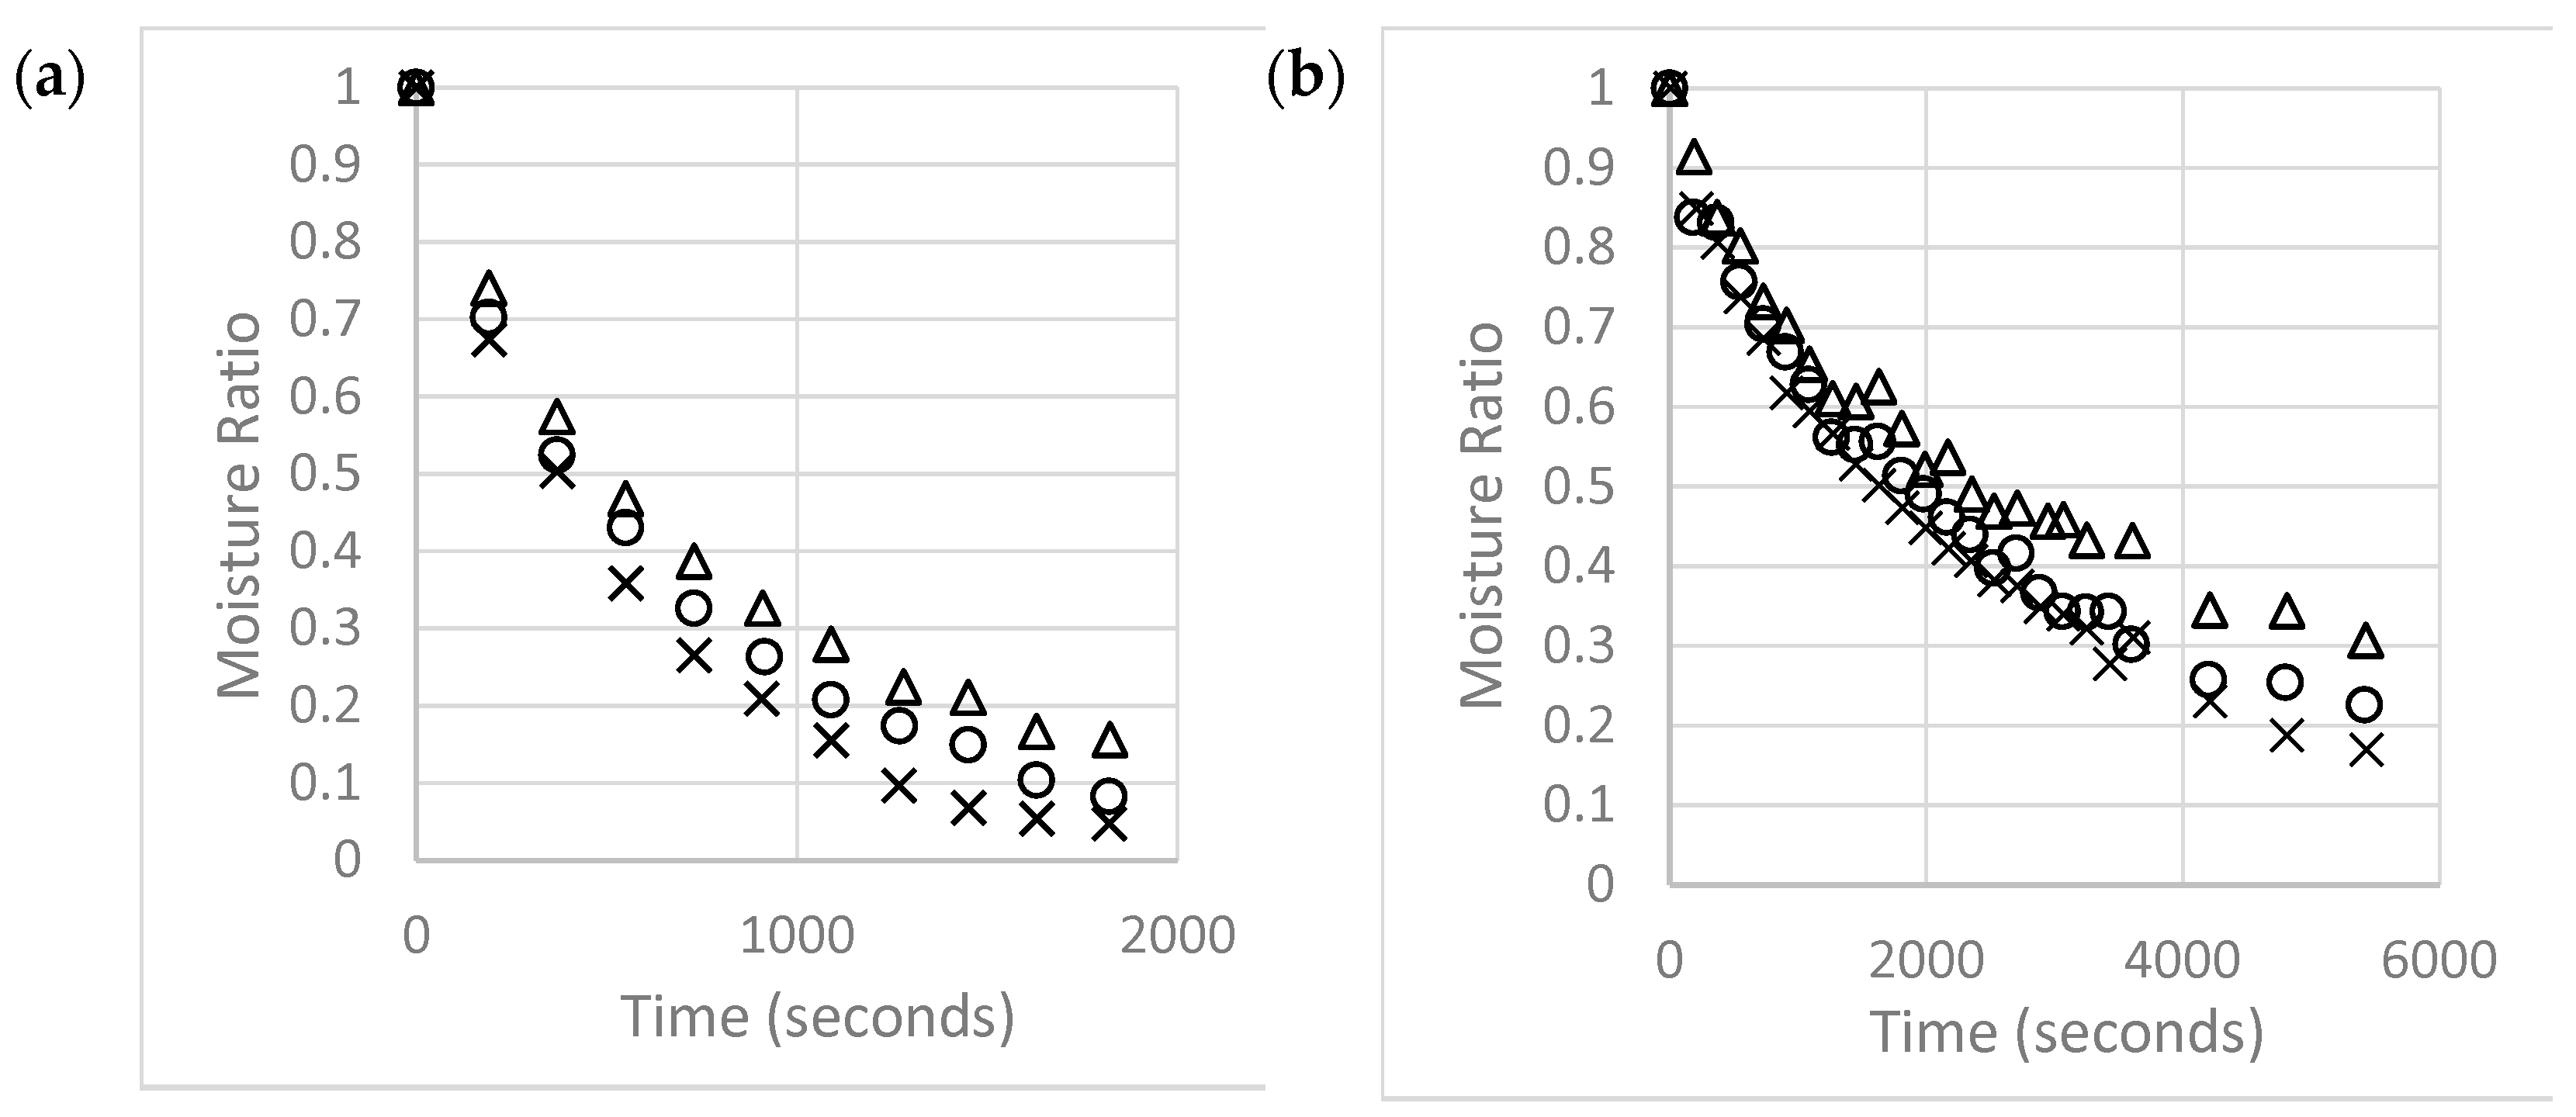
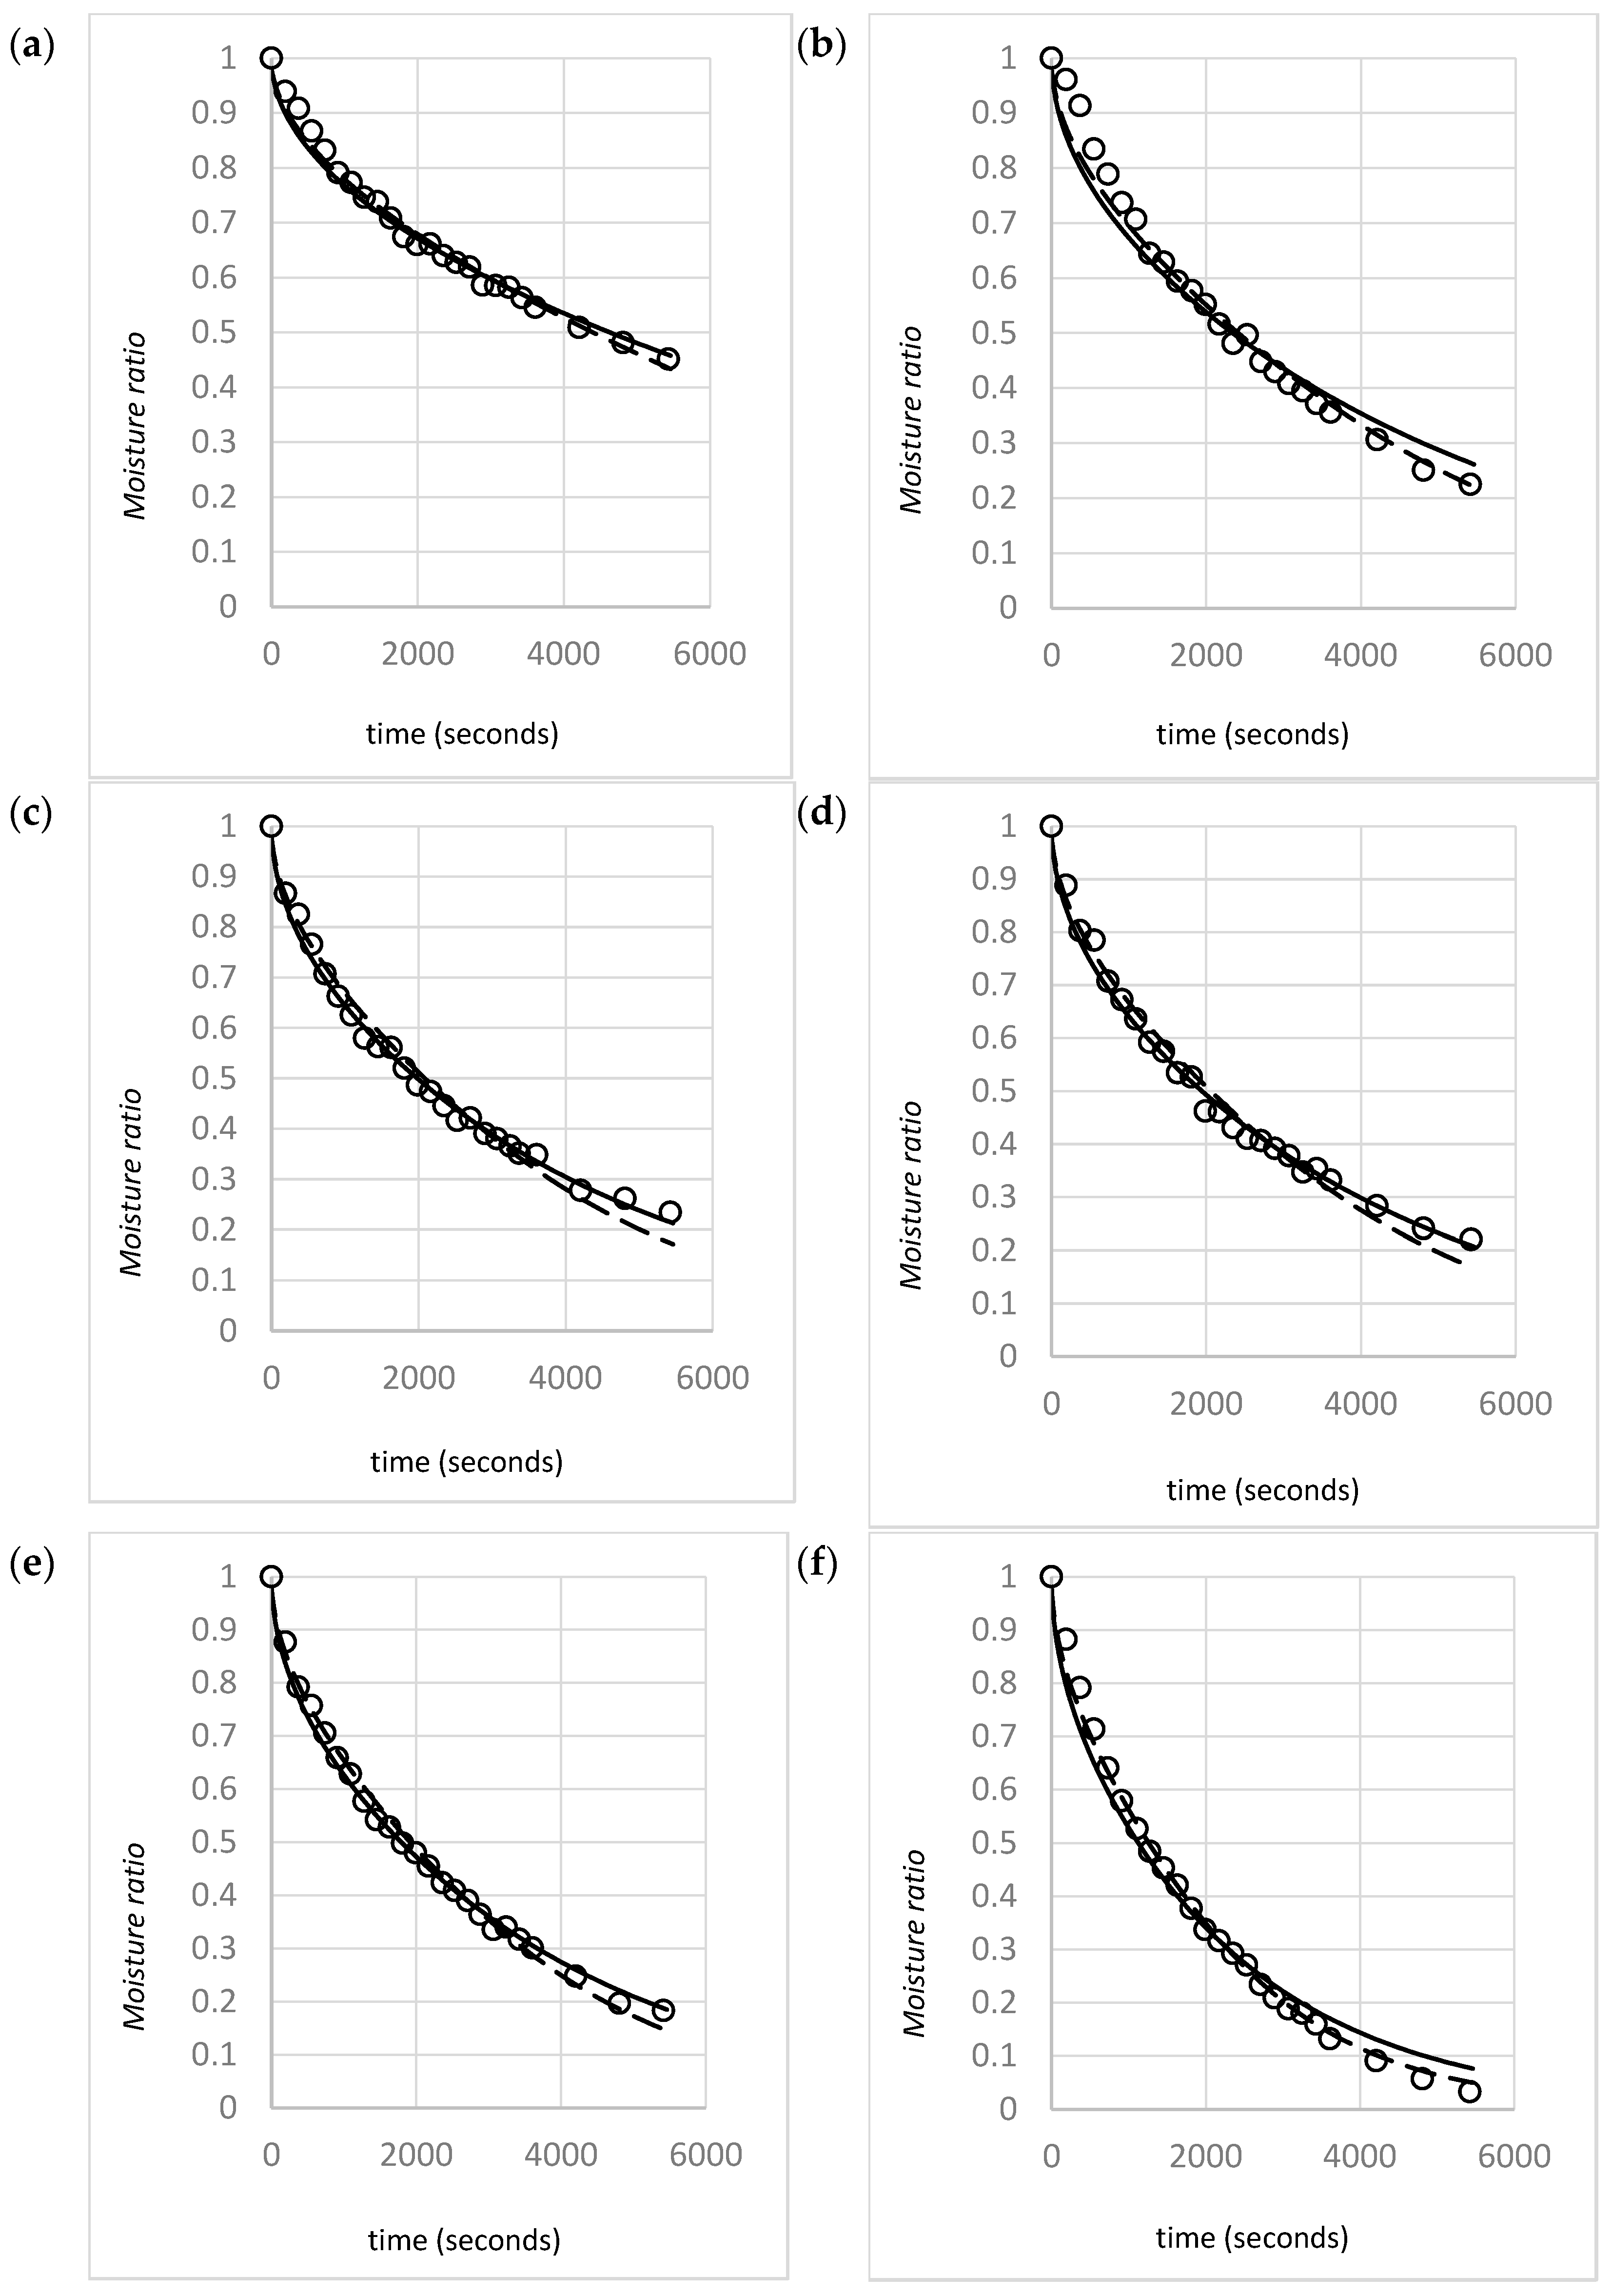
4.1. Raw Data and Model Validity
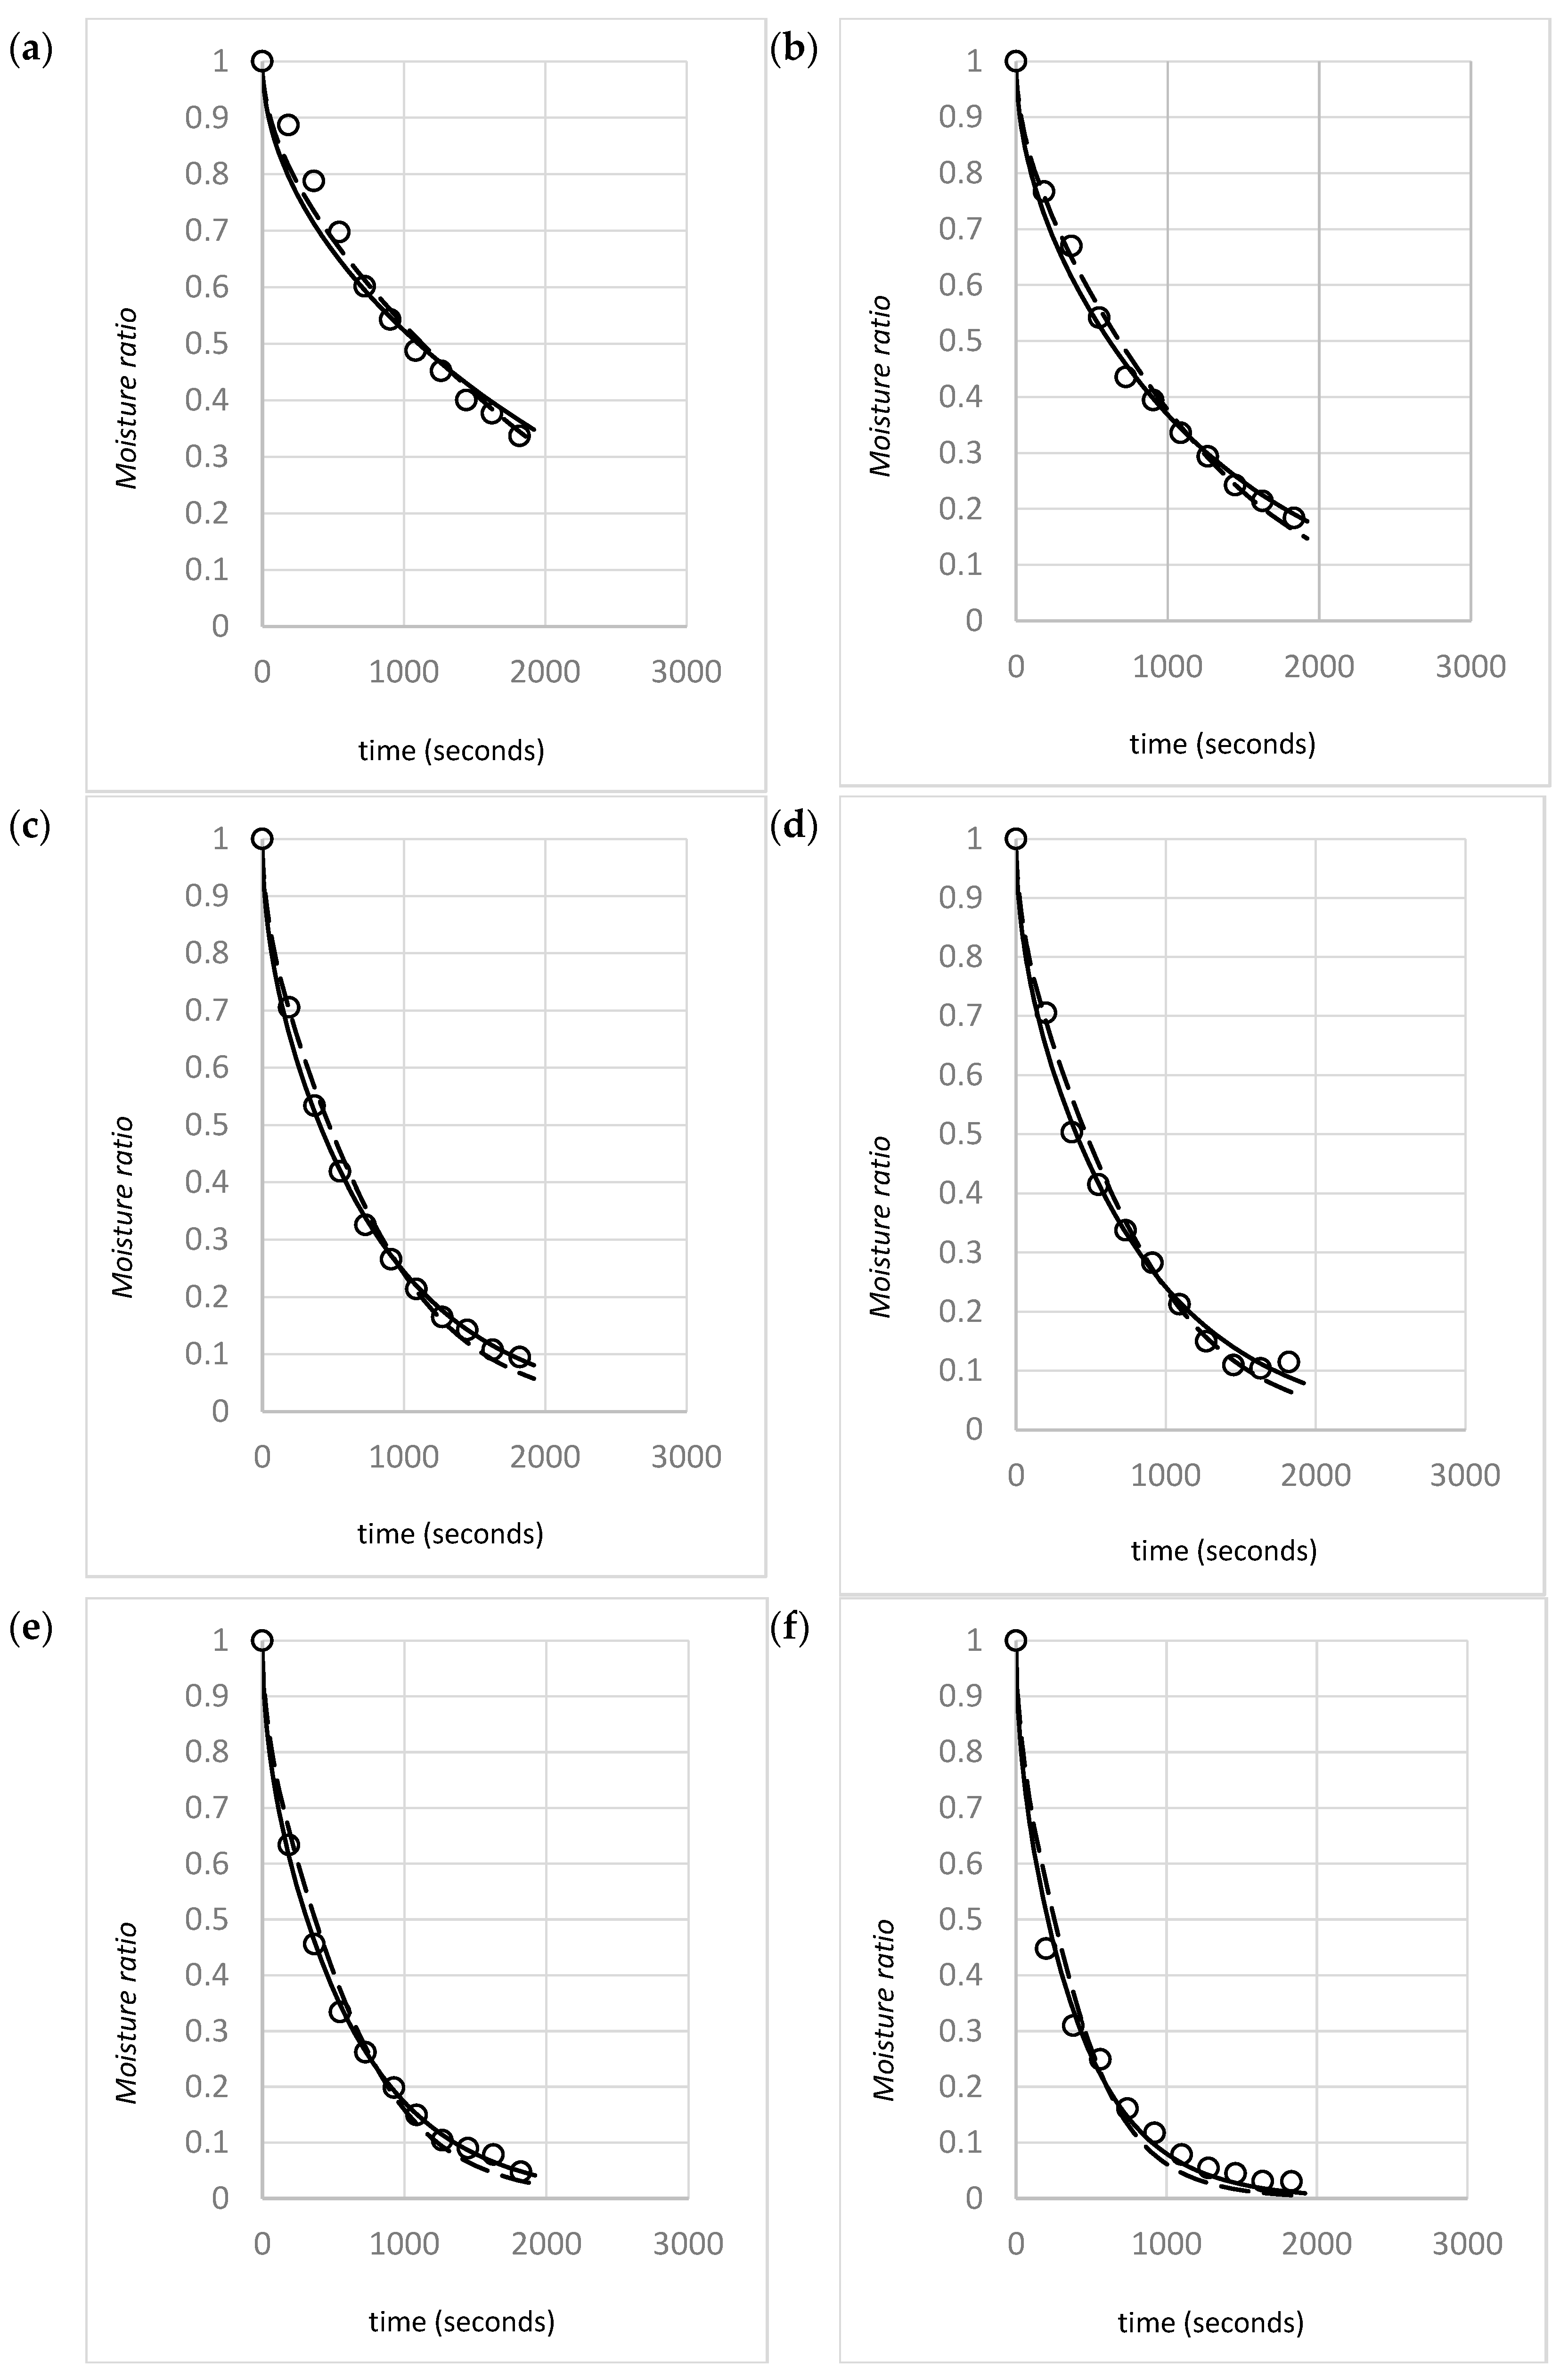
4.2. Modeling Shrinkage
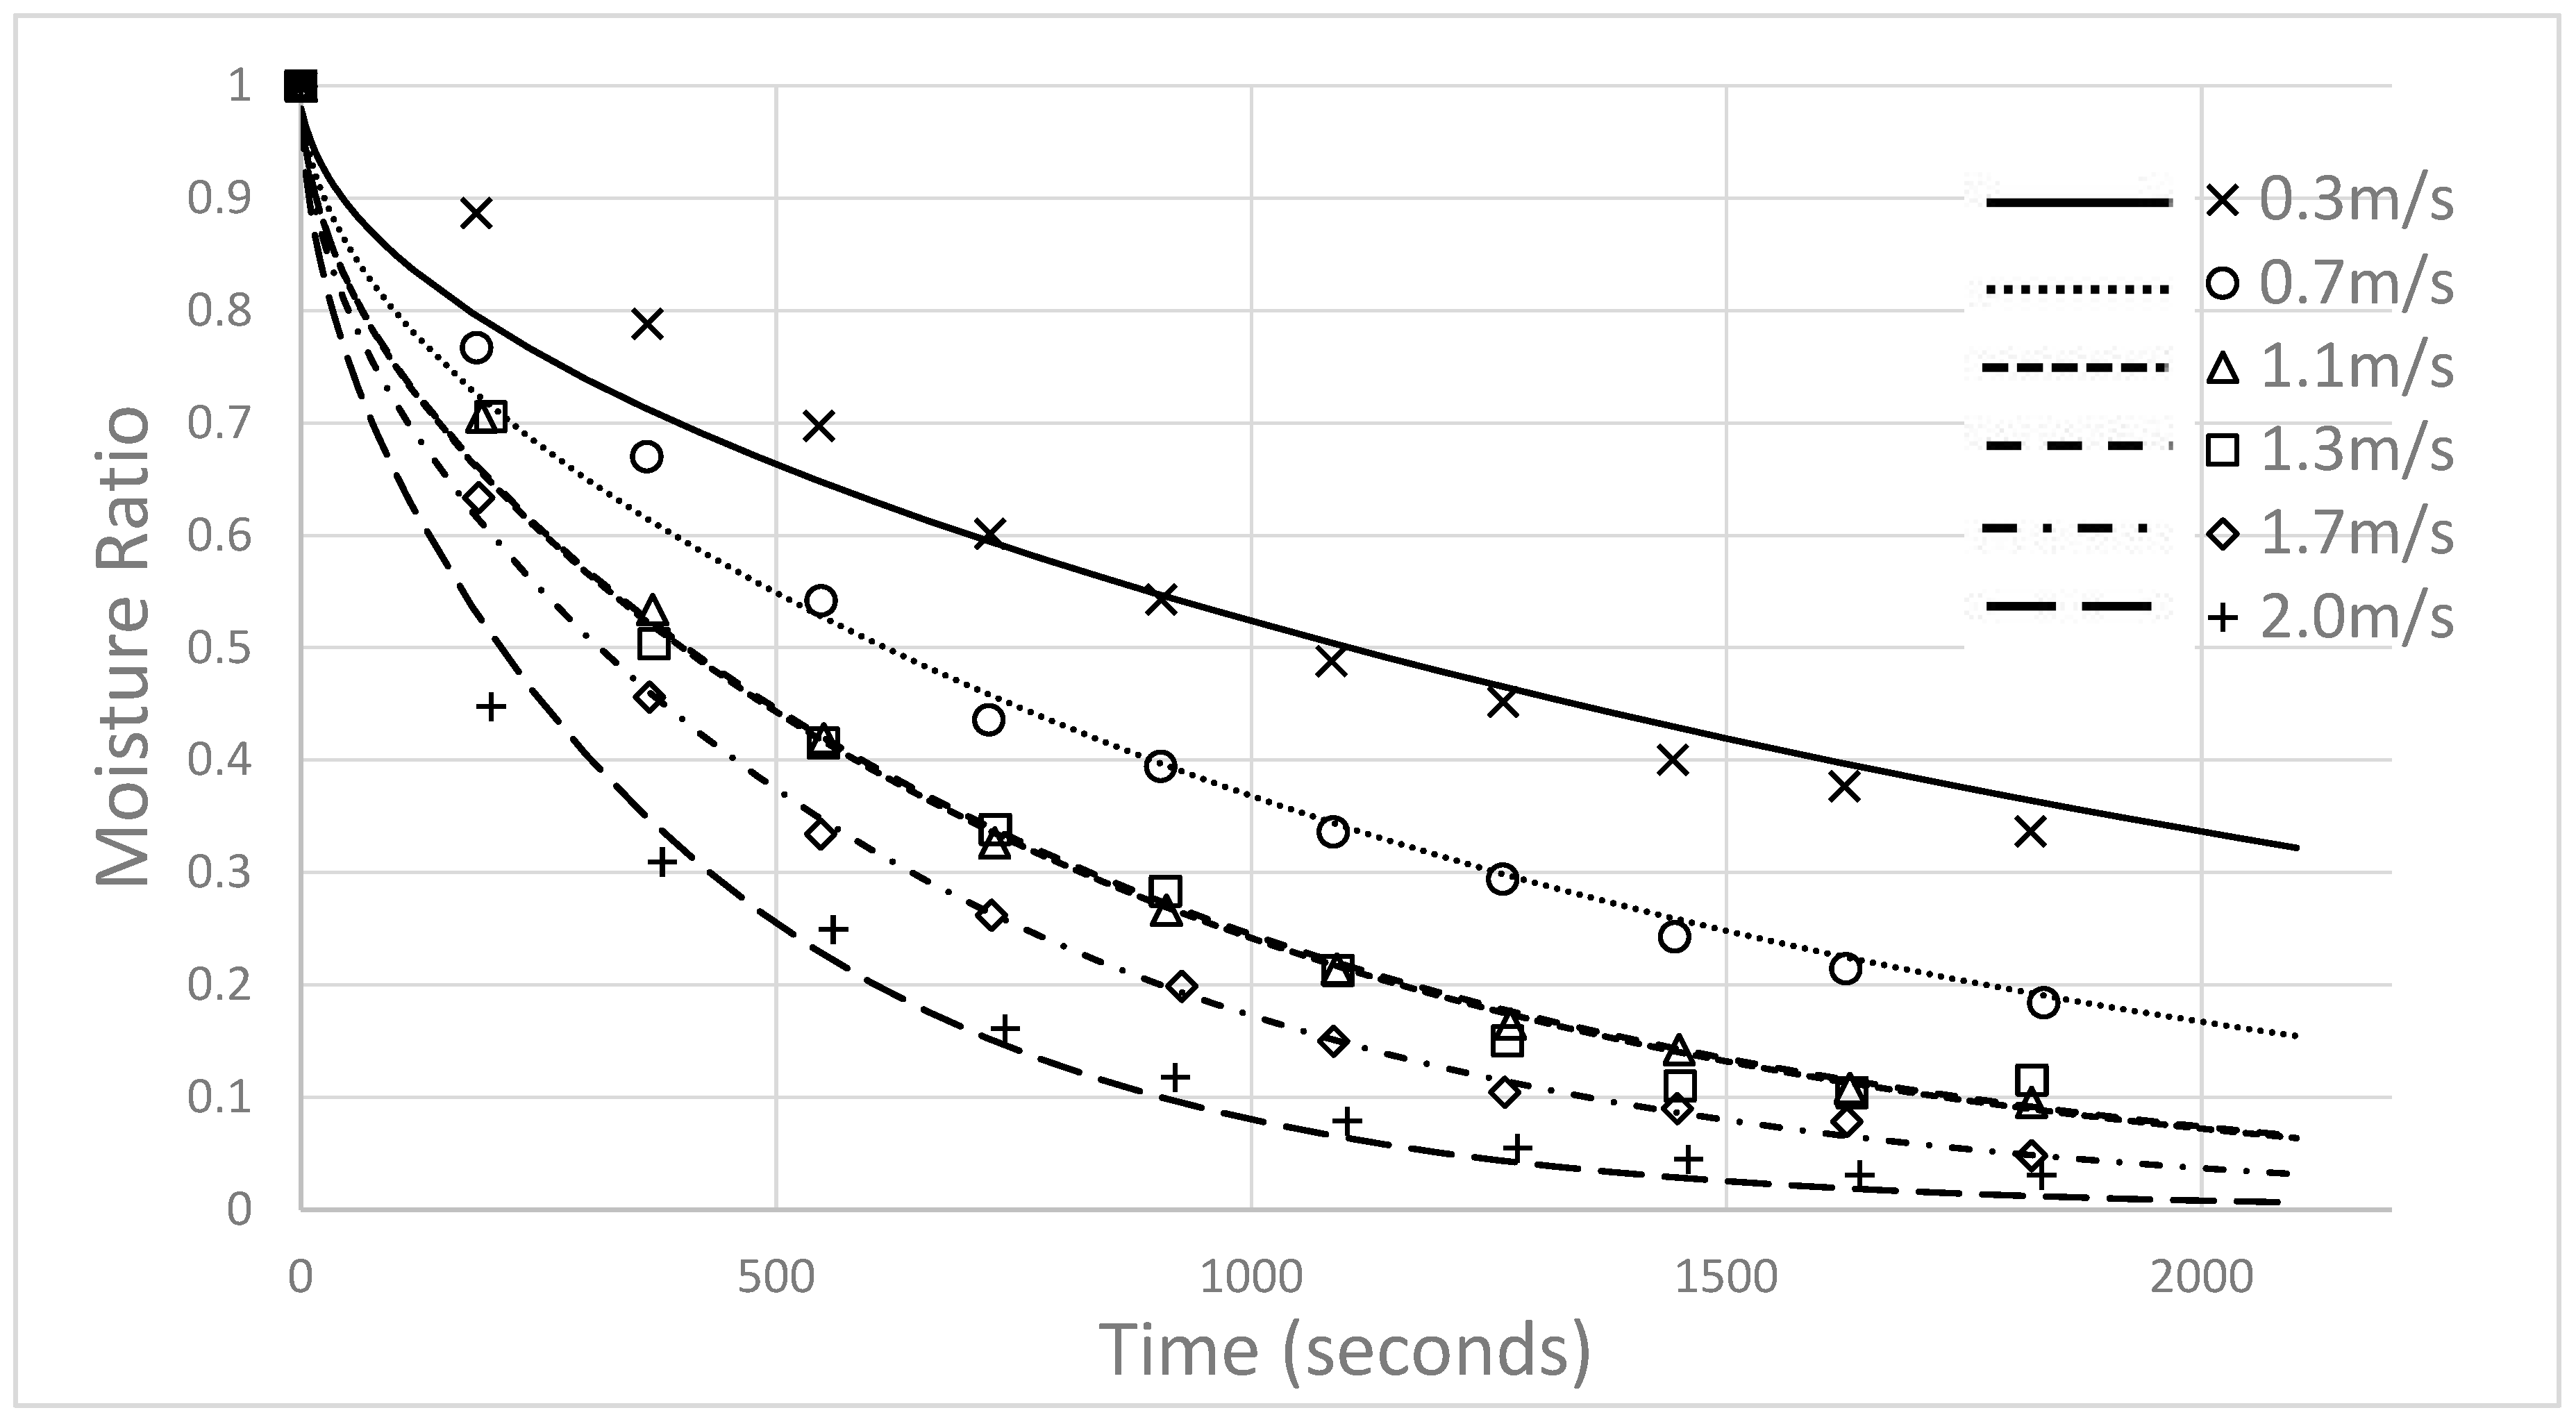
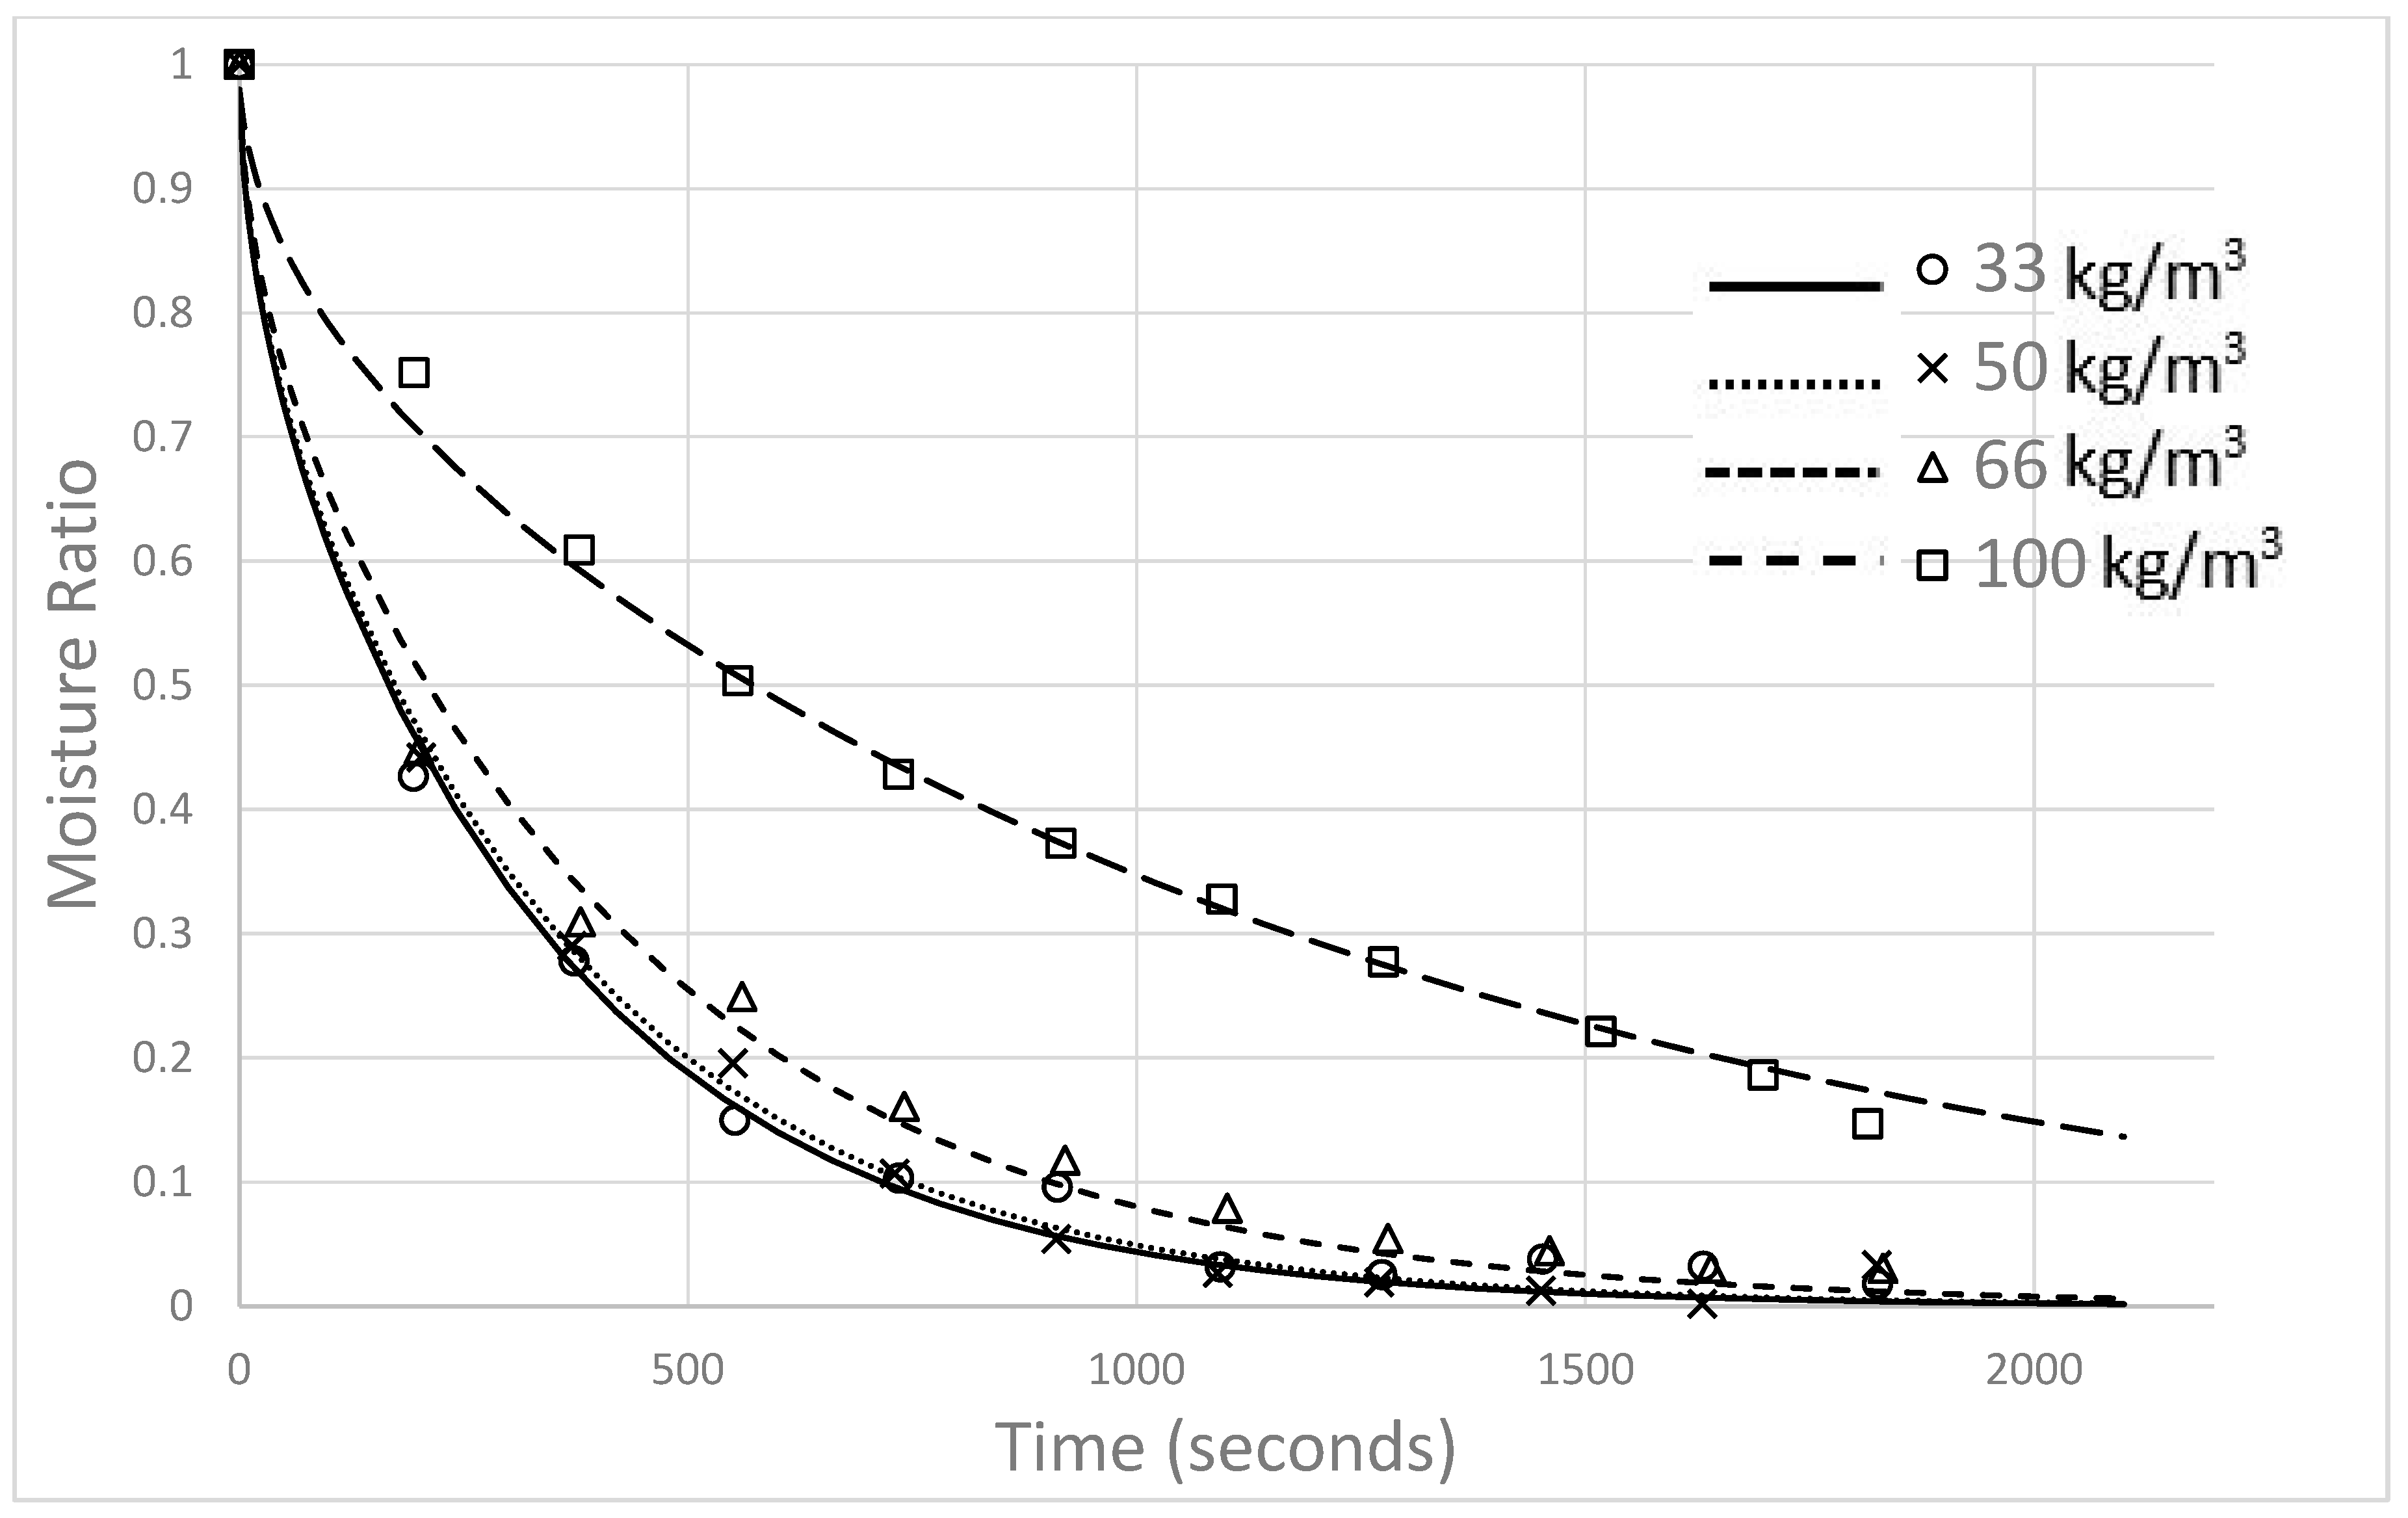
4.3. Impacts of Gas Velocity and Density
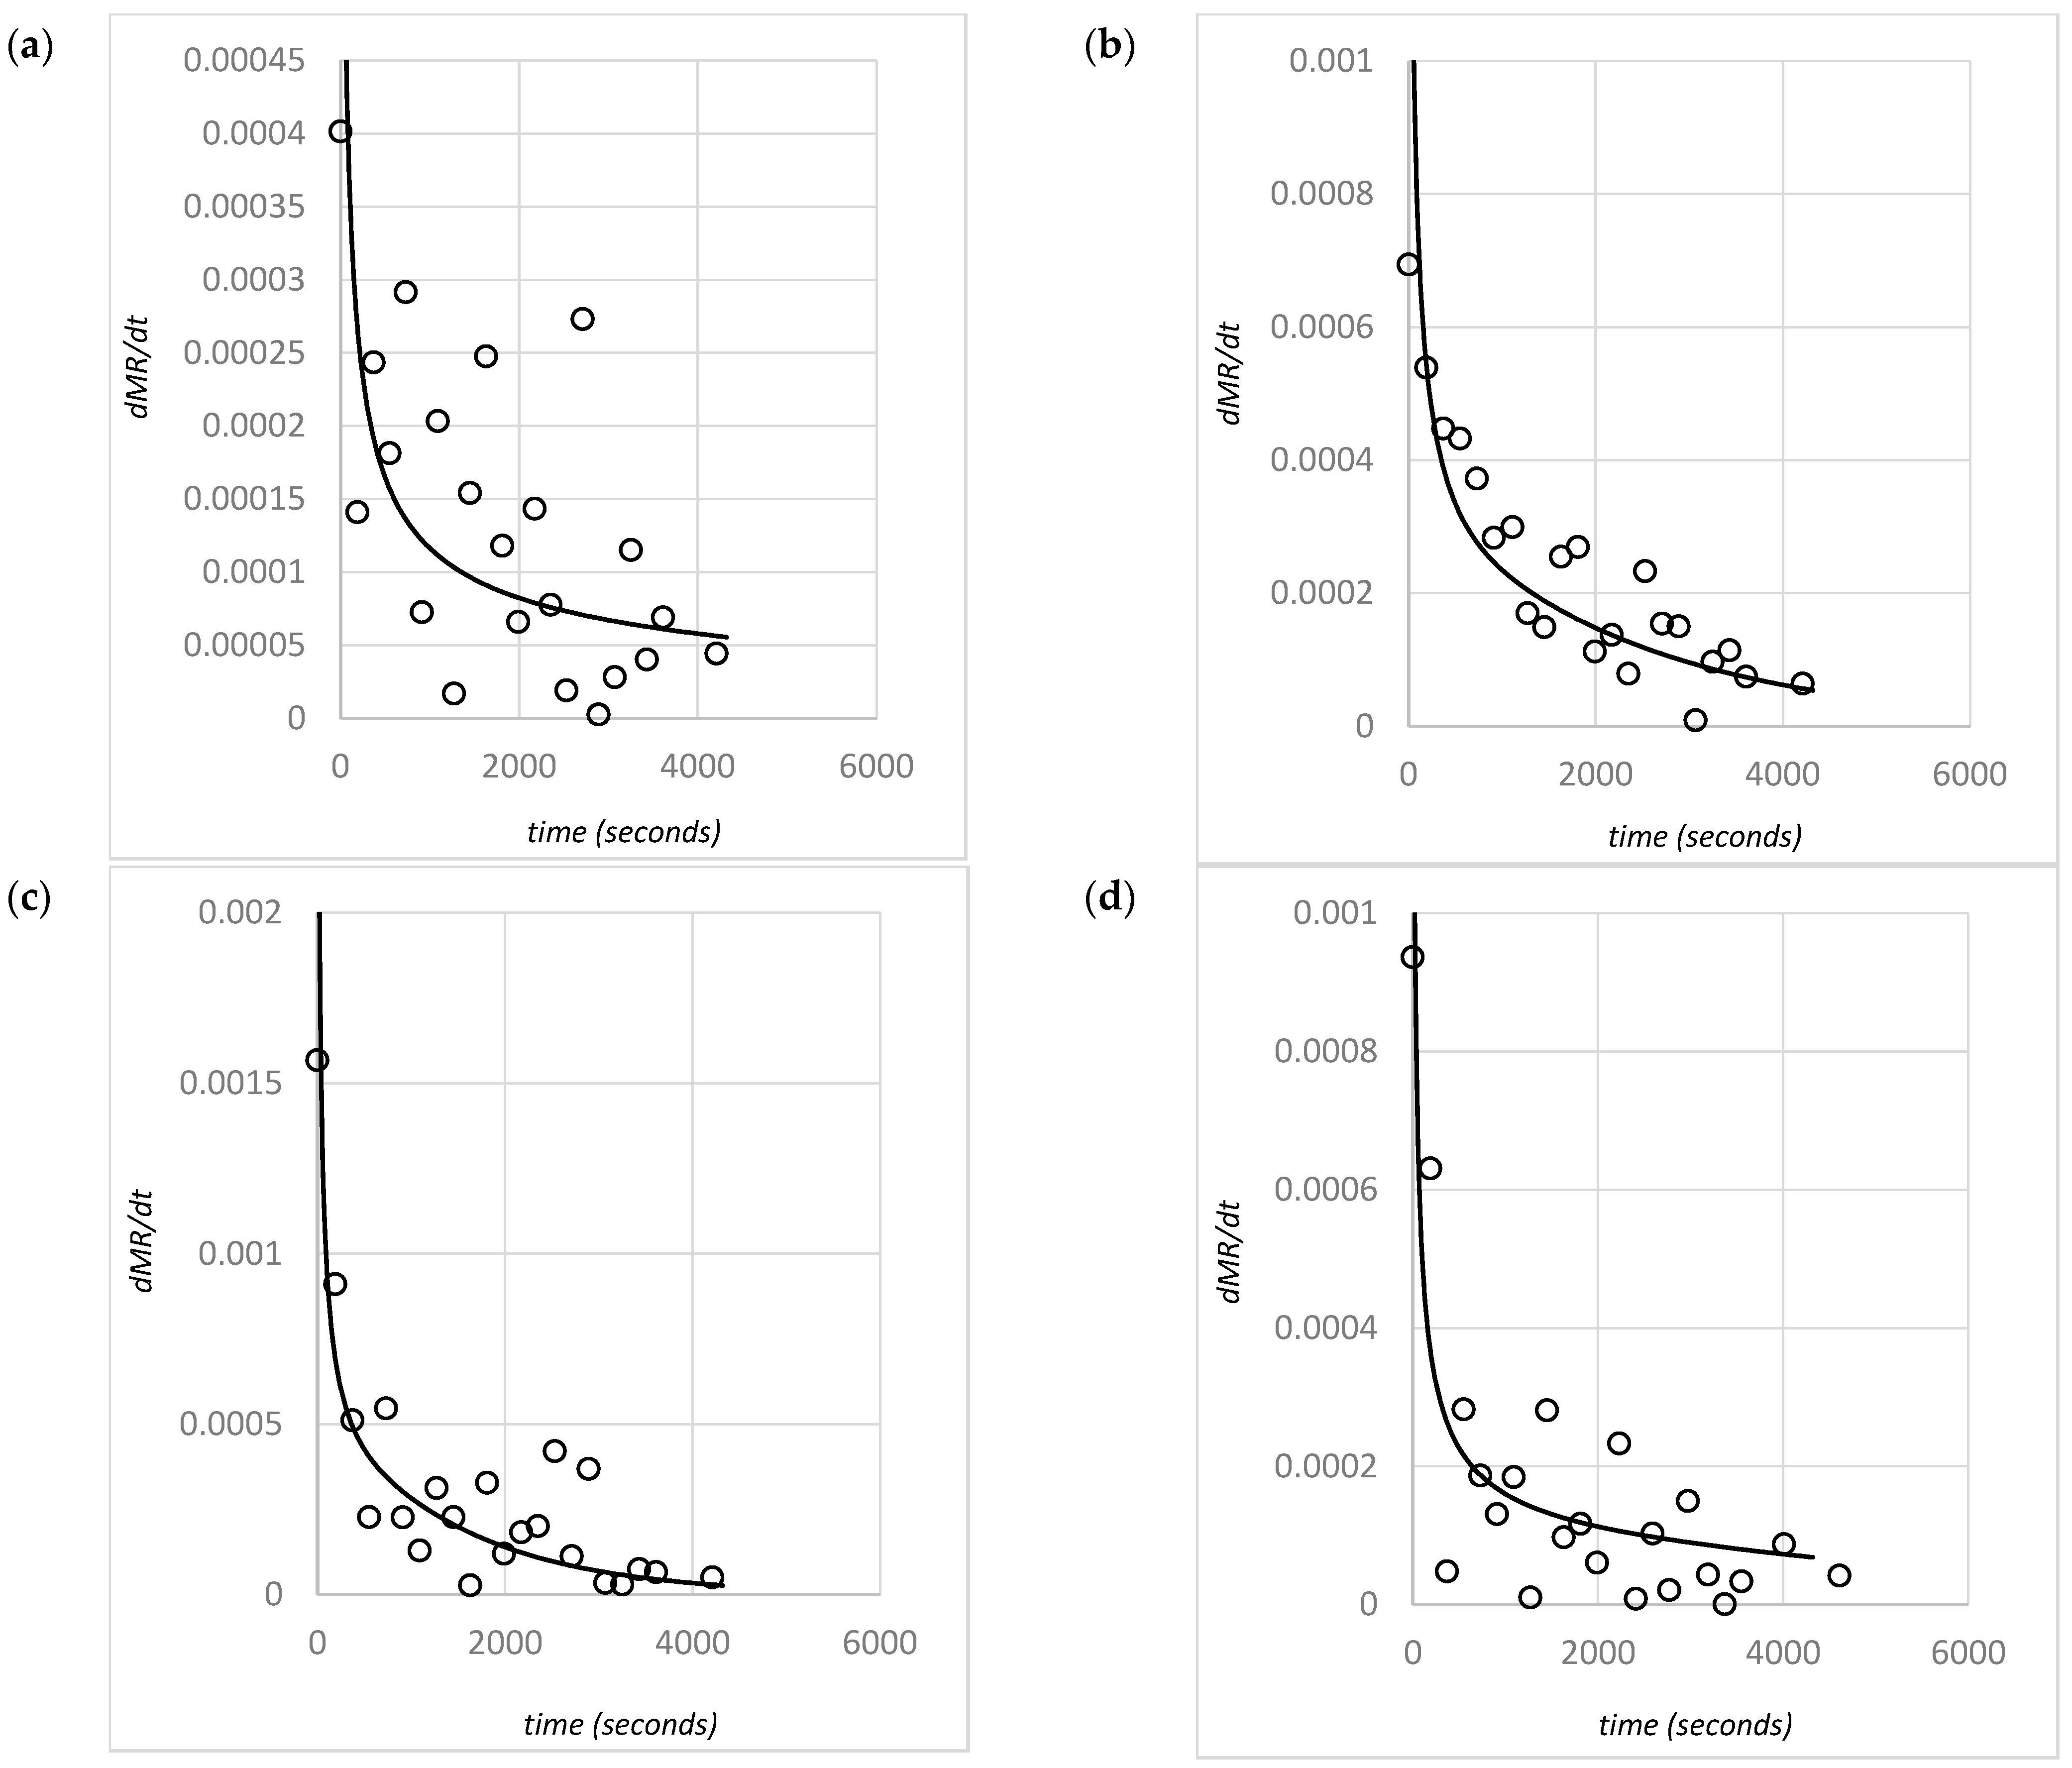
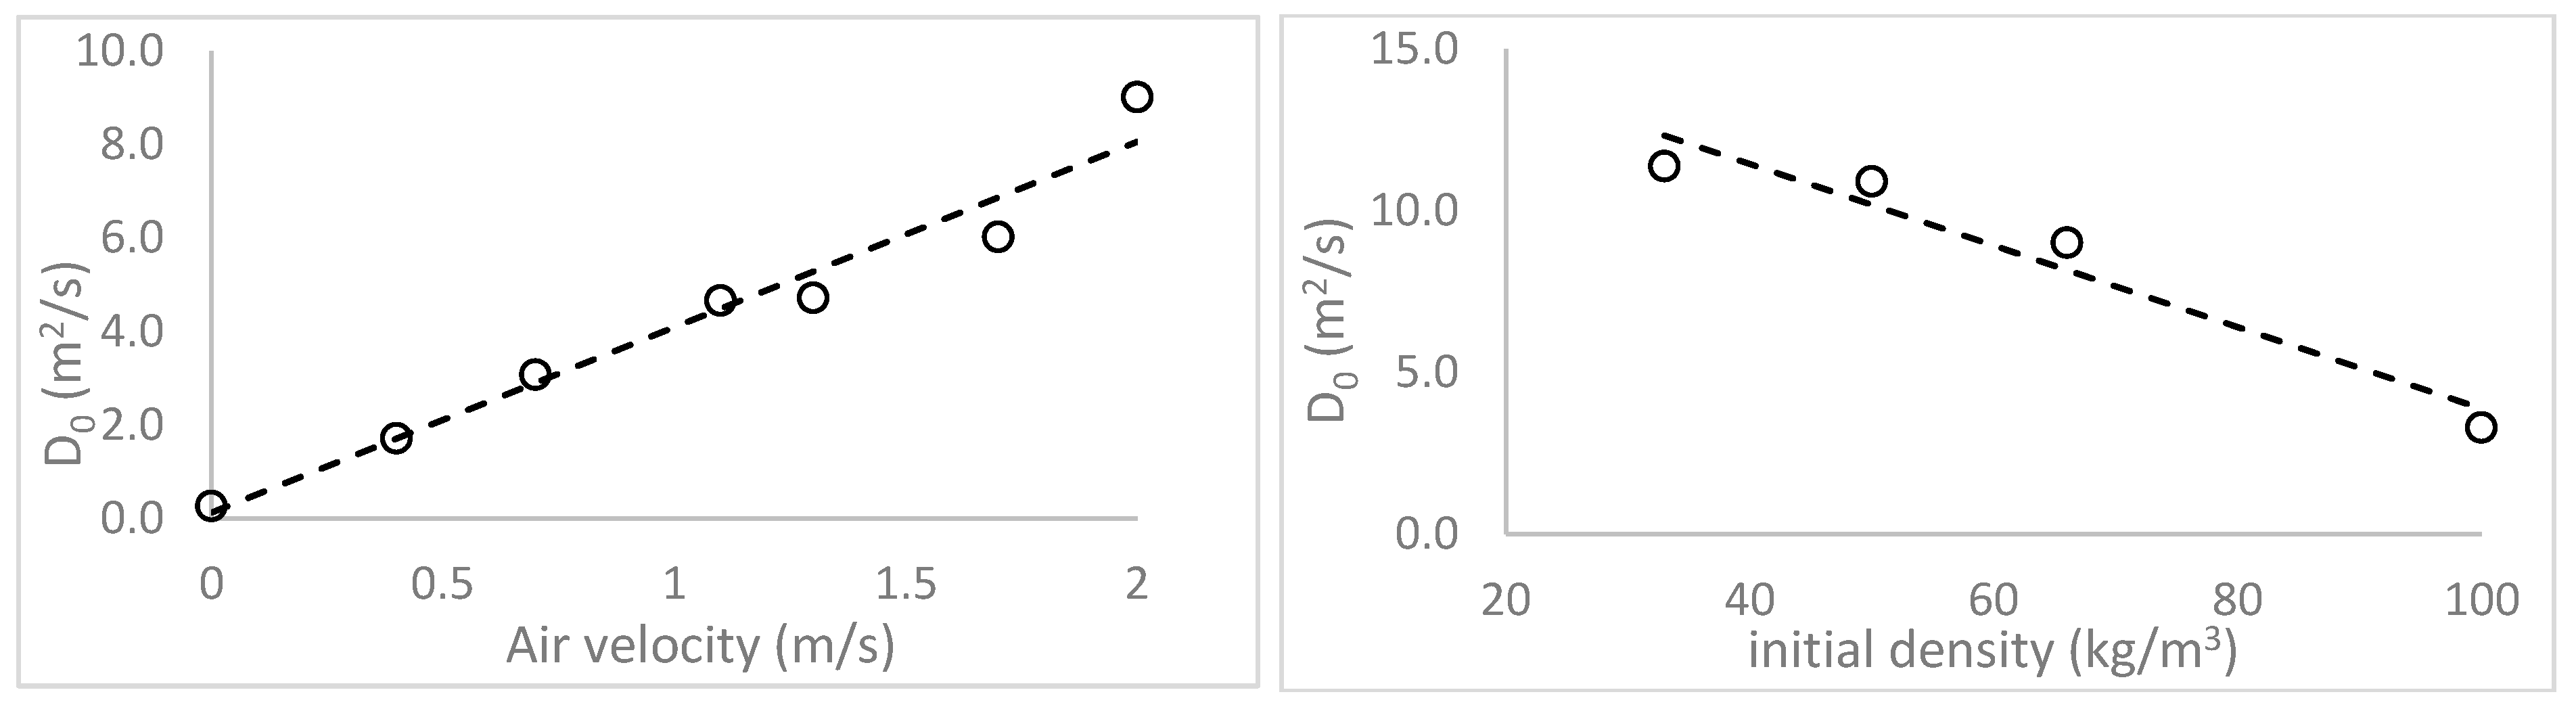
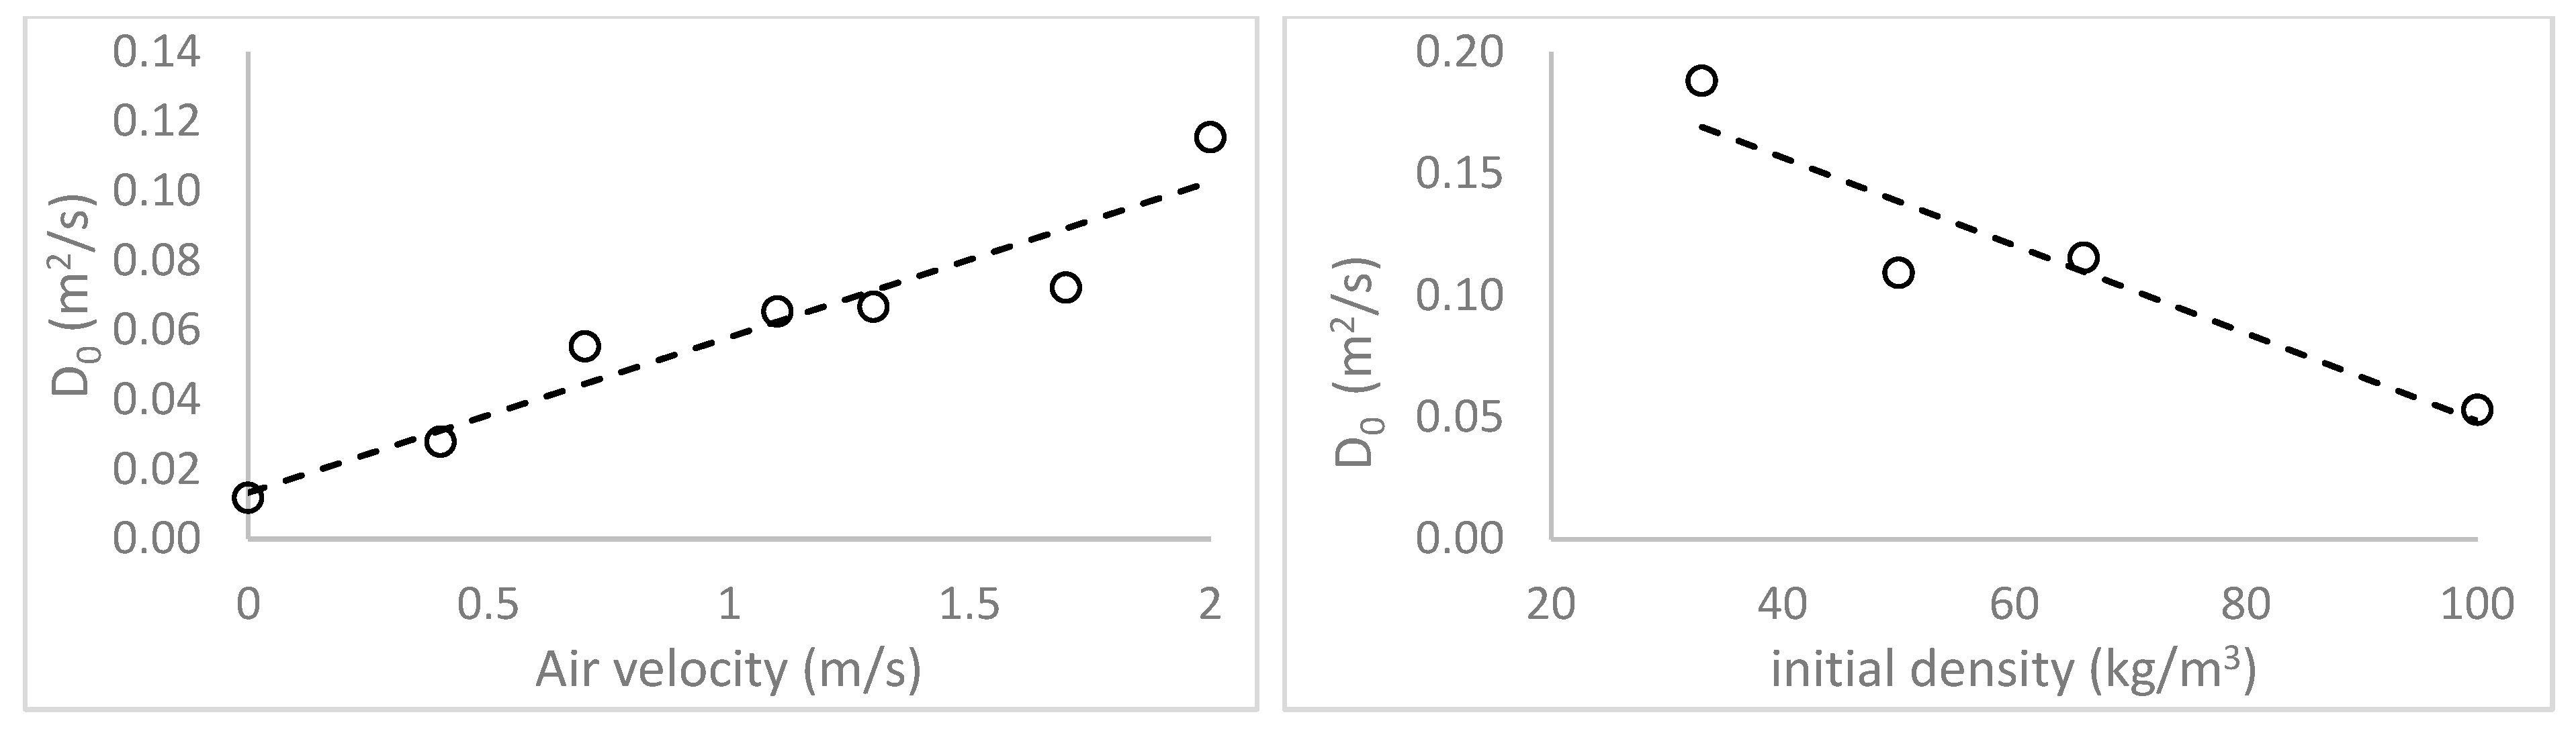
4.4. Diffusivity Relations
5. Discussion
6. Conclusions
Supplementary Materials
Author Contributions
Funding
Institutional Review Board Statement
Informed Consent Statement
Data Availability Statement
Acknowledgments
Conflicts of Interest
References
- Paris Agreement to the United Nations Framework Convention on Climate Change. Available online: https://unfccc.int/sites/default/files/resource/parisagreement_publication.pdf (accessed on 20 May 2022).
- Sudhakar, K.; Mamat, R.; Samykano, M.; Azmi, W.; Ishak, W.; Yusaf, T. An overview of marine macroalgae as bioresource. Renew. Sustain. Energy Rev. 2018, 91, 165–179. [Google Scholar] [CrossRef]
- Garcia-Vaquero, M.; Hayes, M. Red and green macroalgae for fish and animal feed and human functional food development. Food Rev. Int. 2016, 32, 15–45. [Google Scholar] [CrossRef]
- Zeraatkar, A.; Ahmadzadeh, H.; Talebi, A.; Moheimani, N.; McHenry, M. Potential use of algae for heavy metal bioremediation, a critical review. J. Environ. Manag. 2016, 181, 817–831. [Google Scholar] [CrossRef]
- Palma, H.; Killoran, E.; Sheehan, M.; Berner, F.; Heimann, K. Assessment of microalga biofilms for simultaneous remediation and biofuel generation in mine tailings water. Bioresour. Technol. 2017, 234, 327–335. [Google Scholar] [CrossRef]
- Castine, S.; McKinnon, A.; Paul, N.; Trott, L.; de Nys, R. Wastewater treatment for land-based aquaculture: Improvements and value-adding alternatives in model systems from Australia. Aquac. Environ. Interact. 2013, 4, 285–300. [Google Scholar] [CrossRef] [Green Version]
- Lawton, R.; Mata, L.; de Nys, R.; Paul, N. Algal bioremediation of waste waters from land-based aquaculture using Ulva: Selecting target species and strains. PLoS ONE 2013, 8, e0231281. [Google Scholar] [CrossRef] [Green Version]
- Neveux, N.; Yuen, A.; Jazrawi, C.; Magnusson, M.; Haynes, B.; Masters, A.; Montoya, A.; Paul, N.; Maschmeyer, T.; de Nys, R. Biocrude yield and productivity from the hydrothermal liquefaction of marine and freshwater green macroalgae. Bioresour. Technol. 2014, 155, 334–341. [Google Scholar] [CrossRef]
- Machado, L.; Kinley, R.; Magnusson, M.; de Nys, R.; Tomkins, N. The potential of macroalgae for beef production systems in Northern Australia. J. Appl. Phycol. 2015, 27, 2001–2005. [Google Scholar] [CrossRef]
- Machado, L.; Magnusson, M.; Paul, N.; Kinley, R.; de Nys, R.; Tomkins, N. Dose-response effects of Asparagopsis taxiformis and Oedogonium sp. on in vitro fermentation and methane production. J. Appl. Phycol. 2016, 28, 1443–1452. [Google Scholar] [CrossRef]
- Milledge, J.; Benjamin, S.; Dyer, P.; Harvey, P. Macroalgae-derived biofuel: A review of methods of energy extraction from seaweed biomass. Energies 2014, 7, 7194–7222. [Google Scholar] [CrossRef]
- Show, K.; Lee, D.; Chang, J. Algal biomass dehydration. Bioresour. Technol. 2013, 135, 720–729. [Google Scholar]
- Richardson, J.; Harker, J.; Backhurst, J. Coulson and Richardson’s Chemical Engineering; Butterworth-Heinmann: Oxford, UK, 2002; Volume 2. [Google Scholar]
- Walker, C.; Cole, A.; Antunes, E.; Sheehan, M. Equilibrium Moisture and Drying Kinetics Modelling of Macroalgae Species Ulva ohnoi and Oedogonium intermedium. Clean Technol. 2020, 2, 15. [Google Scholar] [CrossRef]
- Hammond, L.; Bai, L.; Sheehan, M.E.; Walker, C. Experimental analysis and diffusion modelling of solar drying of macroalgae—Oedogonium sp. Chem. Eng. Trans. 2018, 65, 427–432. [Google Scholar]
- ega-Gálvez, A.; Ayala-Aponte, A.; Notte, E.; Fuente, L.; Lemus-Mondaca, R. Mathematical modeling of mass transfer during convective dehydration of brown algae Macrocystis pyrifera. Dry. Technol. 2008, 26, 1610–1616. [Google Scholar] [CrossRef]
- Gupta, S.; Cox, S.; Abu-Ghannam, N. Effect of different drying temperatures on the moisture and phytochemical constituents of edible Irish brown seaweed. Food Sci. Technol. 2011, 44, 1266–1272. [Google Scholar]
- Uribe, E.; Vega-Gálvez, A.; Vásquez, V.; Lemus-Mondaca, R.; Callejas, L.; Pastén, A. Hot-air drying characteristics and energetic requirement of the edible brown seaweed Durvillaea antarctica. J. Food Processing Preserv. 2017, 41, e13313. [Google Scholar] [CrossRef]
- Lemus, R.; Pérez, M.; Andrés, A.; Roco, T.; Tello, C.M.; Vega, A. Kinetic study of dehydration and desorption isotherms of red alga Gracilaria. Food Sci. Technol. 2008, 41, 1592–1599. [Google Scholar] [CrossRef]
- Tello-Ireland, C.; Lemus-Mondaca, R.; Vega-Gálvez, A.; López, J.; Scala, K. Influence of hot-air temperature on drying kinetics, functional properties, colour, phycobiliproteins, antioxidant capacity, texture and agar yield of alga Gracilaria chilensis. LWT 2011, 44, 2112–2118. [Google Scholar] [CrossRef]
- Mohamed, L.; Kane, C.; Kouhila, M.; Jamali, A.; Mahrouz, M.; Kechaou, N. Thin layer modeling of Gellidium sesquipedale solar drying process. Energy Convers. Manag. 2007, 49, 940–946. [Google Scholar] [CrossRef]
- Djaeni, M.; Sari, D. Low temperature seaweed drying using dehumidified air. Procedia Environ. Sci. 2015, 23, 2–10. [Google Scholar] [CrossRef] [Green Version]
- Chkir, I.; Balti, M.; Ayed, L.; Azzouz, S.; Kechaou, N.; Hamdi, M. Effects of air drying properties on drying kinetics and stability of cactus/brewer’s grains mixture fermented with lactic acid bacteria. Food Bioprod. Processing 2015, 94, 10–19. [Google Scholar] [CrossRef]
- Bezzina, G.; Sheehan, M.; Walker, C. The influence of gas velocity and fibre density on the drying kinetics of bagasse. In Proceedings of the 40th Annual Conference of the Australian Society of Sugar Cane Technologists, Mackay, Australia, 17–20 April 2018; pp. 424–435. [Google Scholar]
- Chen, X.D. Moisture diffusivity in food and biological materials. Dry. Technol. 2007, 25, 1203–1213. [Google Scholar] [CrossRef]
- Prakotmak, P.; Soponronnarit, S.; Prachayawarakorn, S. Modelling of moisture diffusion in pores of banana foam mat using a 2-D stochastic pore network: Determination of moisture diffusion coefficient during adsorption process. J. Food Eng. 2010, 96, 119–126. [Google Scholar] [CrossRef]
- Walker, C. Modelling the Drying Kinetics of Fresh-Water and Salt-Water Macroalgae. Ph.D. Thesis, James Cook University, Townsville, Australia, 2021. [Google Scholar]
- Montgomery, D. Design and Analysis of Experiments; John Wiley and Sons: Hoboken, NJ, USA, 2013. [Google Scholar]
- Mohamed, L.; Kouhila, M.; Lahsasni, S.; Jamali, A.; Idlimam, A.; Rhazi, M.; Aghfir, M.; Mahrouz, M. Equilibrium moisture content and heat of sorption of Gelidium sesquipedale. J. Stored Prod. Res. 2005, 41, 199–209. [Google Scholar] [CrossRef]
- Moreira, R.; Chenlo, F.; Sineiro, J.; Arufe, S.; Sexto, S. Water sorption isotherms and air drying kinetics of fucus vesiculosus brown seaweed. J. Food Processing Preserv. 2017, 41, e12997. [Google Scholar] [CrossRef]
- Walker, C.; Cole, A.; Sheehan, M. Modelling of thin layer drying of macroalgae. In Proceedings of the 16th Asian Pacific Confederation of Chemical Congress, Melbourne, Australia, 27 September–1 October 2015. [Google Scholar]
- Freire, F.; Figueiredo, A.; Ferrão, P. Modelling high temperature, thin layer, drying kinetics of olive bagasse. J. Agric. Eng. Res. 2001, 78, 397–406. [Google Scholar] [CrossRef]
- Slogrove, H.; Sheehan, M.; Walker, C. Modelling and experimental determination of the drying kinetics of bagasse fibre. In Proceedings of the 39th Annual Conference of the Australian Society of Sugar Cane Technologists, Cairns, Australia, 3–5 May 2017; pp. 406–416. [Google Scholar]
- Santacatalina, J.; Soriano, J.; Cárcel, J.; Garcia-Perez, J. Influence of air velocity and temperature on ultrasonically assisted low temperature drying of eggplant. Food Bioprod. Processing 2016, 100, 282–291. [Google Scholar]


| Gas Velocity (m/s) | Initial Bulk Density (kg/m3) |
|---|---|
| 0.4 | 66 |
| 0.7 | 66 |
| 1.1 | 66 |
| 1.3 | 66 |
| 1.7 | 66 |
| 2.0 | 66 |
| 2.0 | 33 |
| 2.0 | 50 |
| 2.0 | 100 |
| 0.4 | 33 |
| Density (kg/m3) | Velocity (m/s) | De (10−8 m2/s) | R2 | RMSE | Χ2 |
|---|---|---|---|---|---|
| 66 | 0.4 | 27.3 | 0.968 | 0.109 | 0.0047 |
| 66 | 0.7 | 45.5 | 0.989 | 0.076 | 0.0022 |
| 66 | 1.1 | 66.1 | 0.977 | 0.116 | 0.0057 |
| 66 | 1.3 | 66.7 | 0.969 | 0.139 | 0.0076 |
| 66 | 1.7 | 84.4 | 0.989 | 0.081 | 0.0027 |
| 66 | 2 | 125 | 0.971 | 0.141 | 0.0073 |
| 33 | 2 | 158 | 0.983 | 0.108 | 0.0045 |
| 50 | 2 | 151 | 0.986 | 0.101 | 0.0038 |
| 100 | 2 | 48.3 | 0.953 | 0.151 | 0.0095 |
| 33 | 0.4 | 56.1 | 0.988 | 0.085 | 0.0028 |
| Density (kg/m3) | Velocity (m/s) | De (10−8 m2/s) | R2 | RMSE | Χ2 |
|---|---|---|---|---|---|
| 66 | 0.4 | 6.95 | 0.957 | 0.087 | 0.0028 |
| 66 | 0.7 | 12.7 | 0.852 | 0.236 | 0.0215 |
| 66 | 1.1 | 14.7 | 0.956 | 0.119 | 0.0053 |
| 66 | 1.3 | 14.9 | 0.949 | 0.134 | 0.0068 |
| 66 | 1.7 | 16.1 | 0.856 | 0.229 | 0.0204 |
| 66 | 2 | 24.4 | 0.949 | 0.173 | 0.011 |
| 33 | 2 | 38.6 | 0.985 | 0.091 | 0.003 |
| 50 | 2 | 23.2 | 0.890 | 0.207 | 0.0175 |
| 100 | 2 | 12.2 | 0.926 | 0.139 | 0.0068 |
| 33 | 0.4 | 20.9 | 0.953 | 0.159 | 0.009 |
| Density (kg/m3) | Velocity (m/s) | (10−8 m2/s) | R2 | RMSE | Χ2 |
|---|---|---|---|---|---|
| 66 | 0.4 | 19.4 | 0.859 | 0.230 | 0.0205 |
| 66 | 0.7 | 37.1 | 0.951 | 0.164 | 0.0102 |
| 66 | 1.1 | 60.6 | 0.971 | 0.129 | 0.0070 |
| 66 | 1.3 | 72.3 | 0.965 | 0.147 | 0.0087 |
| 66 | 1.7 | 95.9 | 0.981 | 0.111 | 0.0049 |
| 66 | 2 | 114 | 0.968 | 0.148 | 0.0081 |
| 33 | 2 | 164 | 0.983 | 0.107 | 0.0045 |
| 50 | 2 | 138 | 0.984 | 0.110 | 0.0045 |
| 100 | 2 | 61.5 | 0.894 | 0.208 | 0.0215 |
| 33 | 0.4 | 69.9 | 0.950 | 0.167 | 0.0116 |
| Density (kg/m3) | Velocity (m/s) | (10−8 m2/s) | R2 | RMSE | Χ2 |
|---|---|---|---|---|---|
| 66 | 0.4 | 8.11 | 0.917 | 0.108 | 0.0054 |
| 66 | 0.7 | 10.8 | 0.827 | 0.236 | 0.0253 |
| 66 | 1.1 | 14.4 | 0.956 | 0.121 | 0.0054 |
| 66 | 1.3 | 16.1 | 0.941 | 0.132 | 0.0077 |
| 66 | 1.7 | 19.7 | 0.804 | 0.235 | 0.0278 |
| 66 | 2 | 22.4 | 0.943 | 0.167 | 0.0123 |
| 33 | 2 | 34.5 | 0.976 | 0.116 | 0.0047 |
| 50 | 2 | 28.2 | 0.847 | 0.233 | 0.0242 |
| 100 | 2 | 9.94 | 0.861 | 0.175 | 0.0128 |
| 33 | 0.4 | 20.2 | 0.951 | 0.159 | 0.0092 |
Publisher’s Note: MDPI stays neutral with regard to jurisdictional claims in published maps and institutional affiliations. |
© 2022 by the authors. Licensee MDPI, Basel, Switzerland. This article is an open access article distributed under the terms and conditions of the Creative Commons Attribution (CC BY) license (https://creativecommons.org/licenses/by/4.0/).
Share and Cite
Walker, C.; Sheehan, M. Drying Kinetics of Macroalgae as a Function of Drying Gas Velocity and Material Bulk Density, Including Shrinkage. Clean Technol. 2022, 4, 669-689. https://doi.org/10.3390/cleantechnol4030041
Walker C, Sheehan M. Drying Kinetics of Macroalgae as a Function of Drying Gas Velocity and Material Bulk Density, Including Shrinkage. Clean Technologies. 2022; 4(3):669-689. https://doi.org/10.3390/cleantechnol4030041
Chicago/Turabian StyleWalker, Craig, and Madoc Sheehan. 2022. "Drying Kinetics of Macroalgae as a Function of Drying Gas Velocity and Material Bulk Density, Including Shrinkage" Clean Technologies 4, no. 3: 669-689. https://doi.org/10.3390/cleantechnol4030041
APA StyleWalker, C., & Sheehan, M. (2022). Drying Kinetics of Macroalgae as a Function of Drying Gas Velocity and Material Bulk Density, Including Shrinkage. Clean Technologies, 4(3), 669-689. https://doi.org/10.3390/cleantechnol4030041