1. Introduction
Green hydrogen [
1] was first observed by Paracelsus [
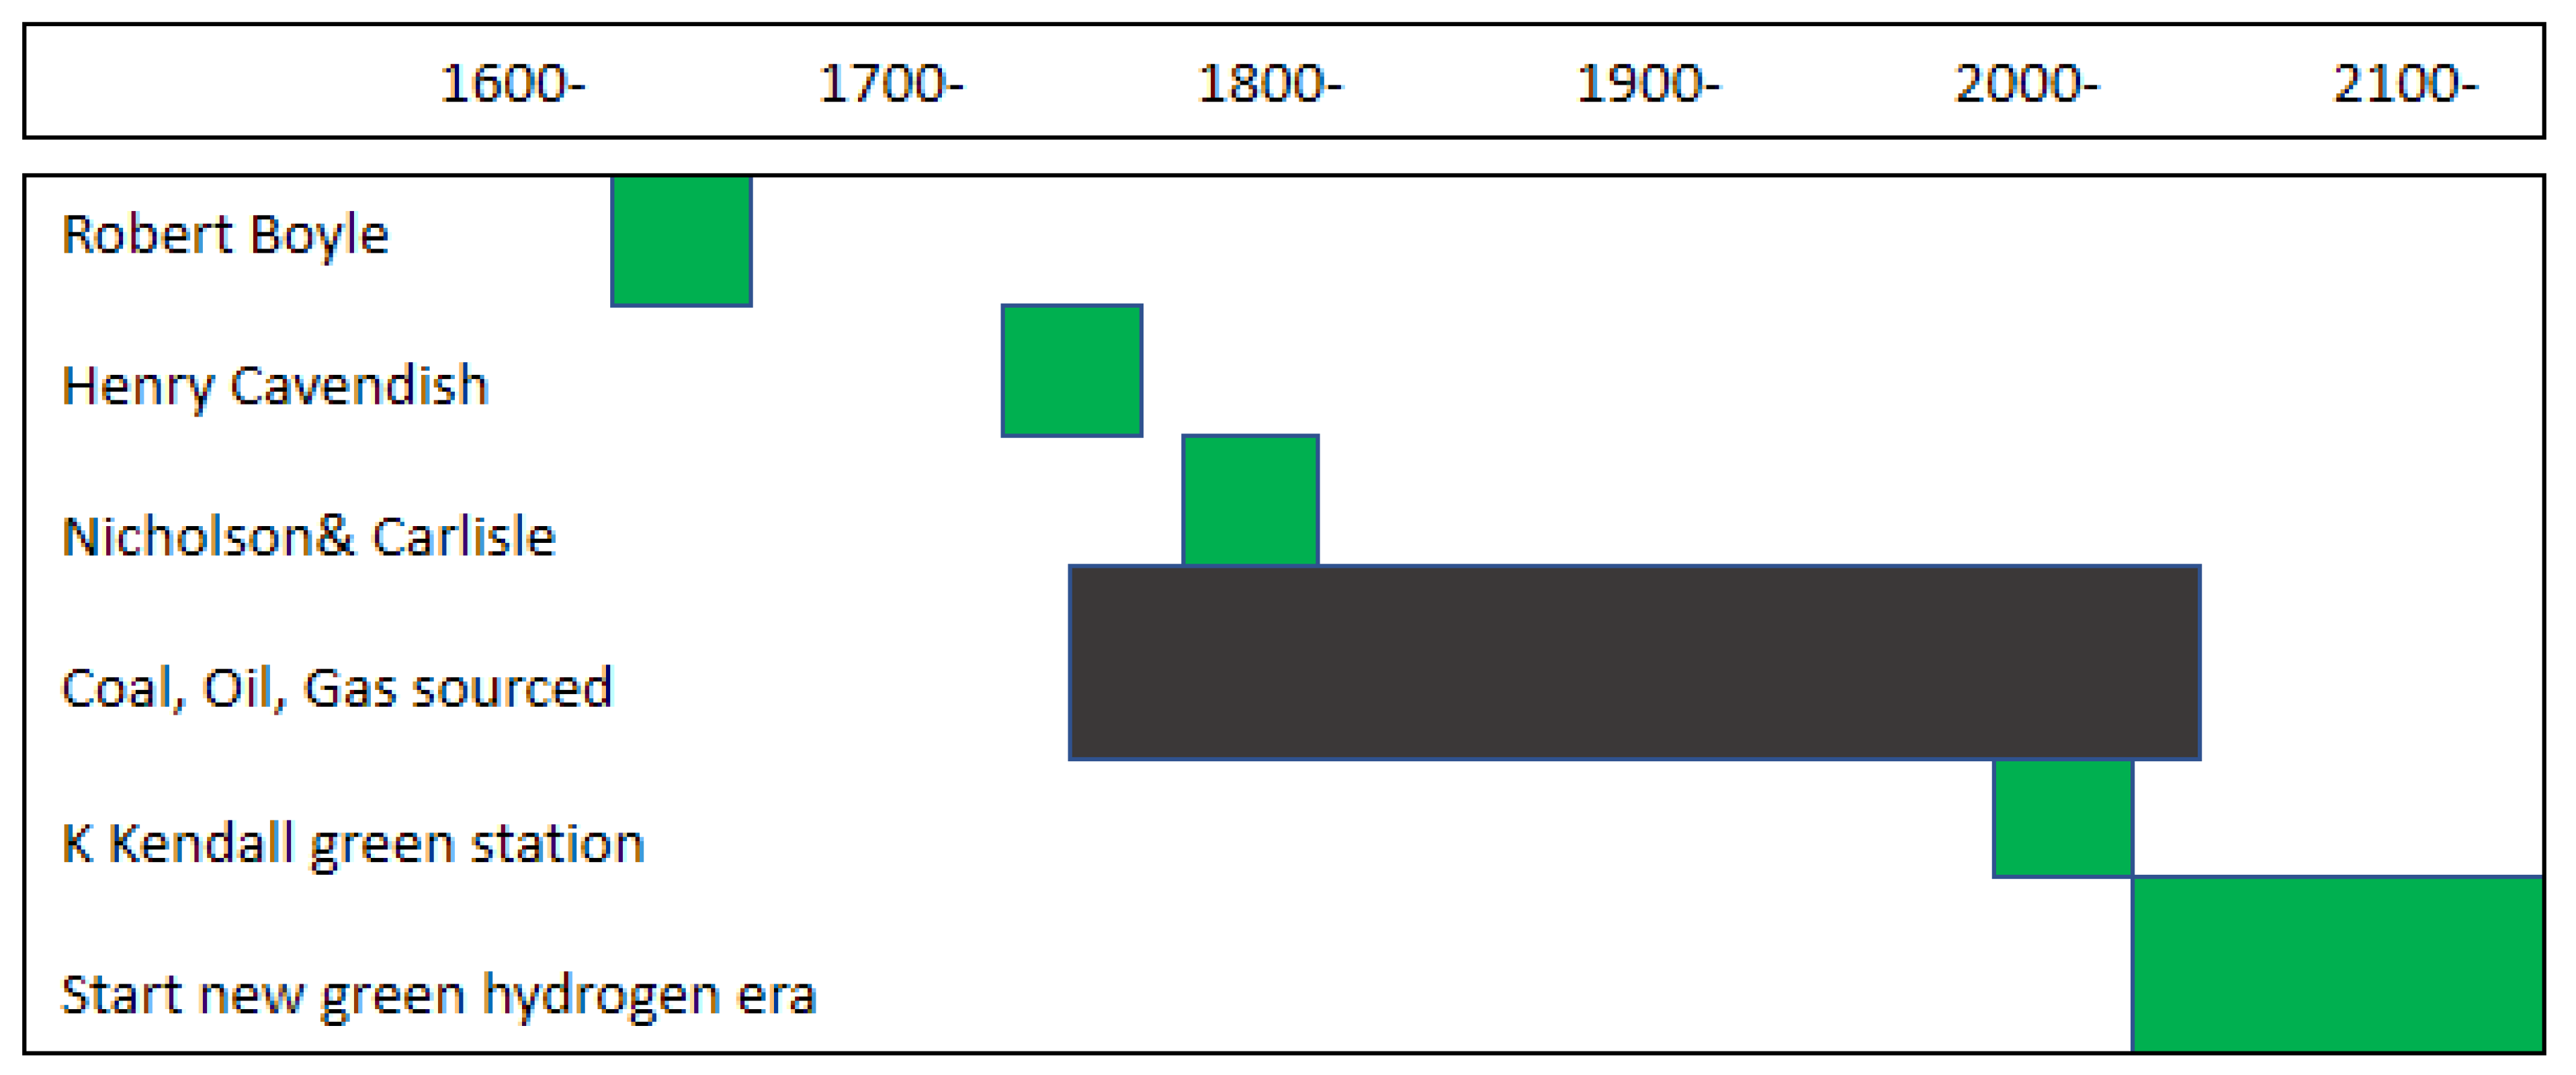
2] in the early 1500s, but he did not follow up his experiments, which dissolved metals such as zinc in acid, where he saw gas bubbles fizzing out. Because these metals were made using charcoal to reduce the ore, no fossil fuel was burned, so fossil carbon dioxide was not released. In 1671, Robert Boyle [
3] observed a similar effect in the UK when he mixed iron filings in dilute acid, before Henry Cavendish [
4], in his 1766 papers, first demonstrated that this green gas was a well-defined substance with remarkable properties, producing water when burned. Lavoisier later wrote about the correct theory of this reaction and called the reactants hydrogen and oxygen in 1783. Even after the electrolysis of water was presented to generate hydrogen and oxygen in 1800 by Nicholson and Carlisle, the reaction was probably grey (i.e., fossil), but may still have been green if the voltaic batteries used to provide the electric current were made from metals manufactured from charcoal. However, around that time, metal production was increasing so fast that coke derived from fossil coal, first used in 1709 by Abraham Derby in Shropshire, expanded manyfold by 1800, and replaced charcoal as the major reducing agent for metal ores, initiating 300 years of our global warming experiment with coal as the dominant cheap source of energy, still not peaking until 2030 at a predicted 8 Gte/a. During the 20th century, hydrocarbon oil and gas took over from coal in hydrogen production on petrochemical plants, because the benefits of steam methane reforming (SMR) using a nickel catalyst discovered by BASF in 1913 soon became apparent when the first UK plant began operating in Billingham, UK in 1936 [
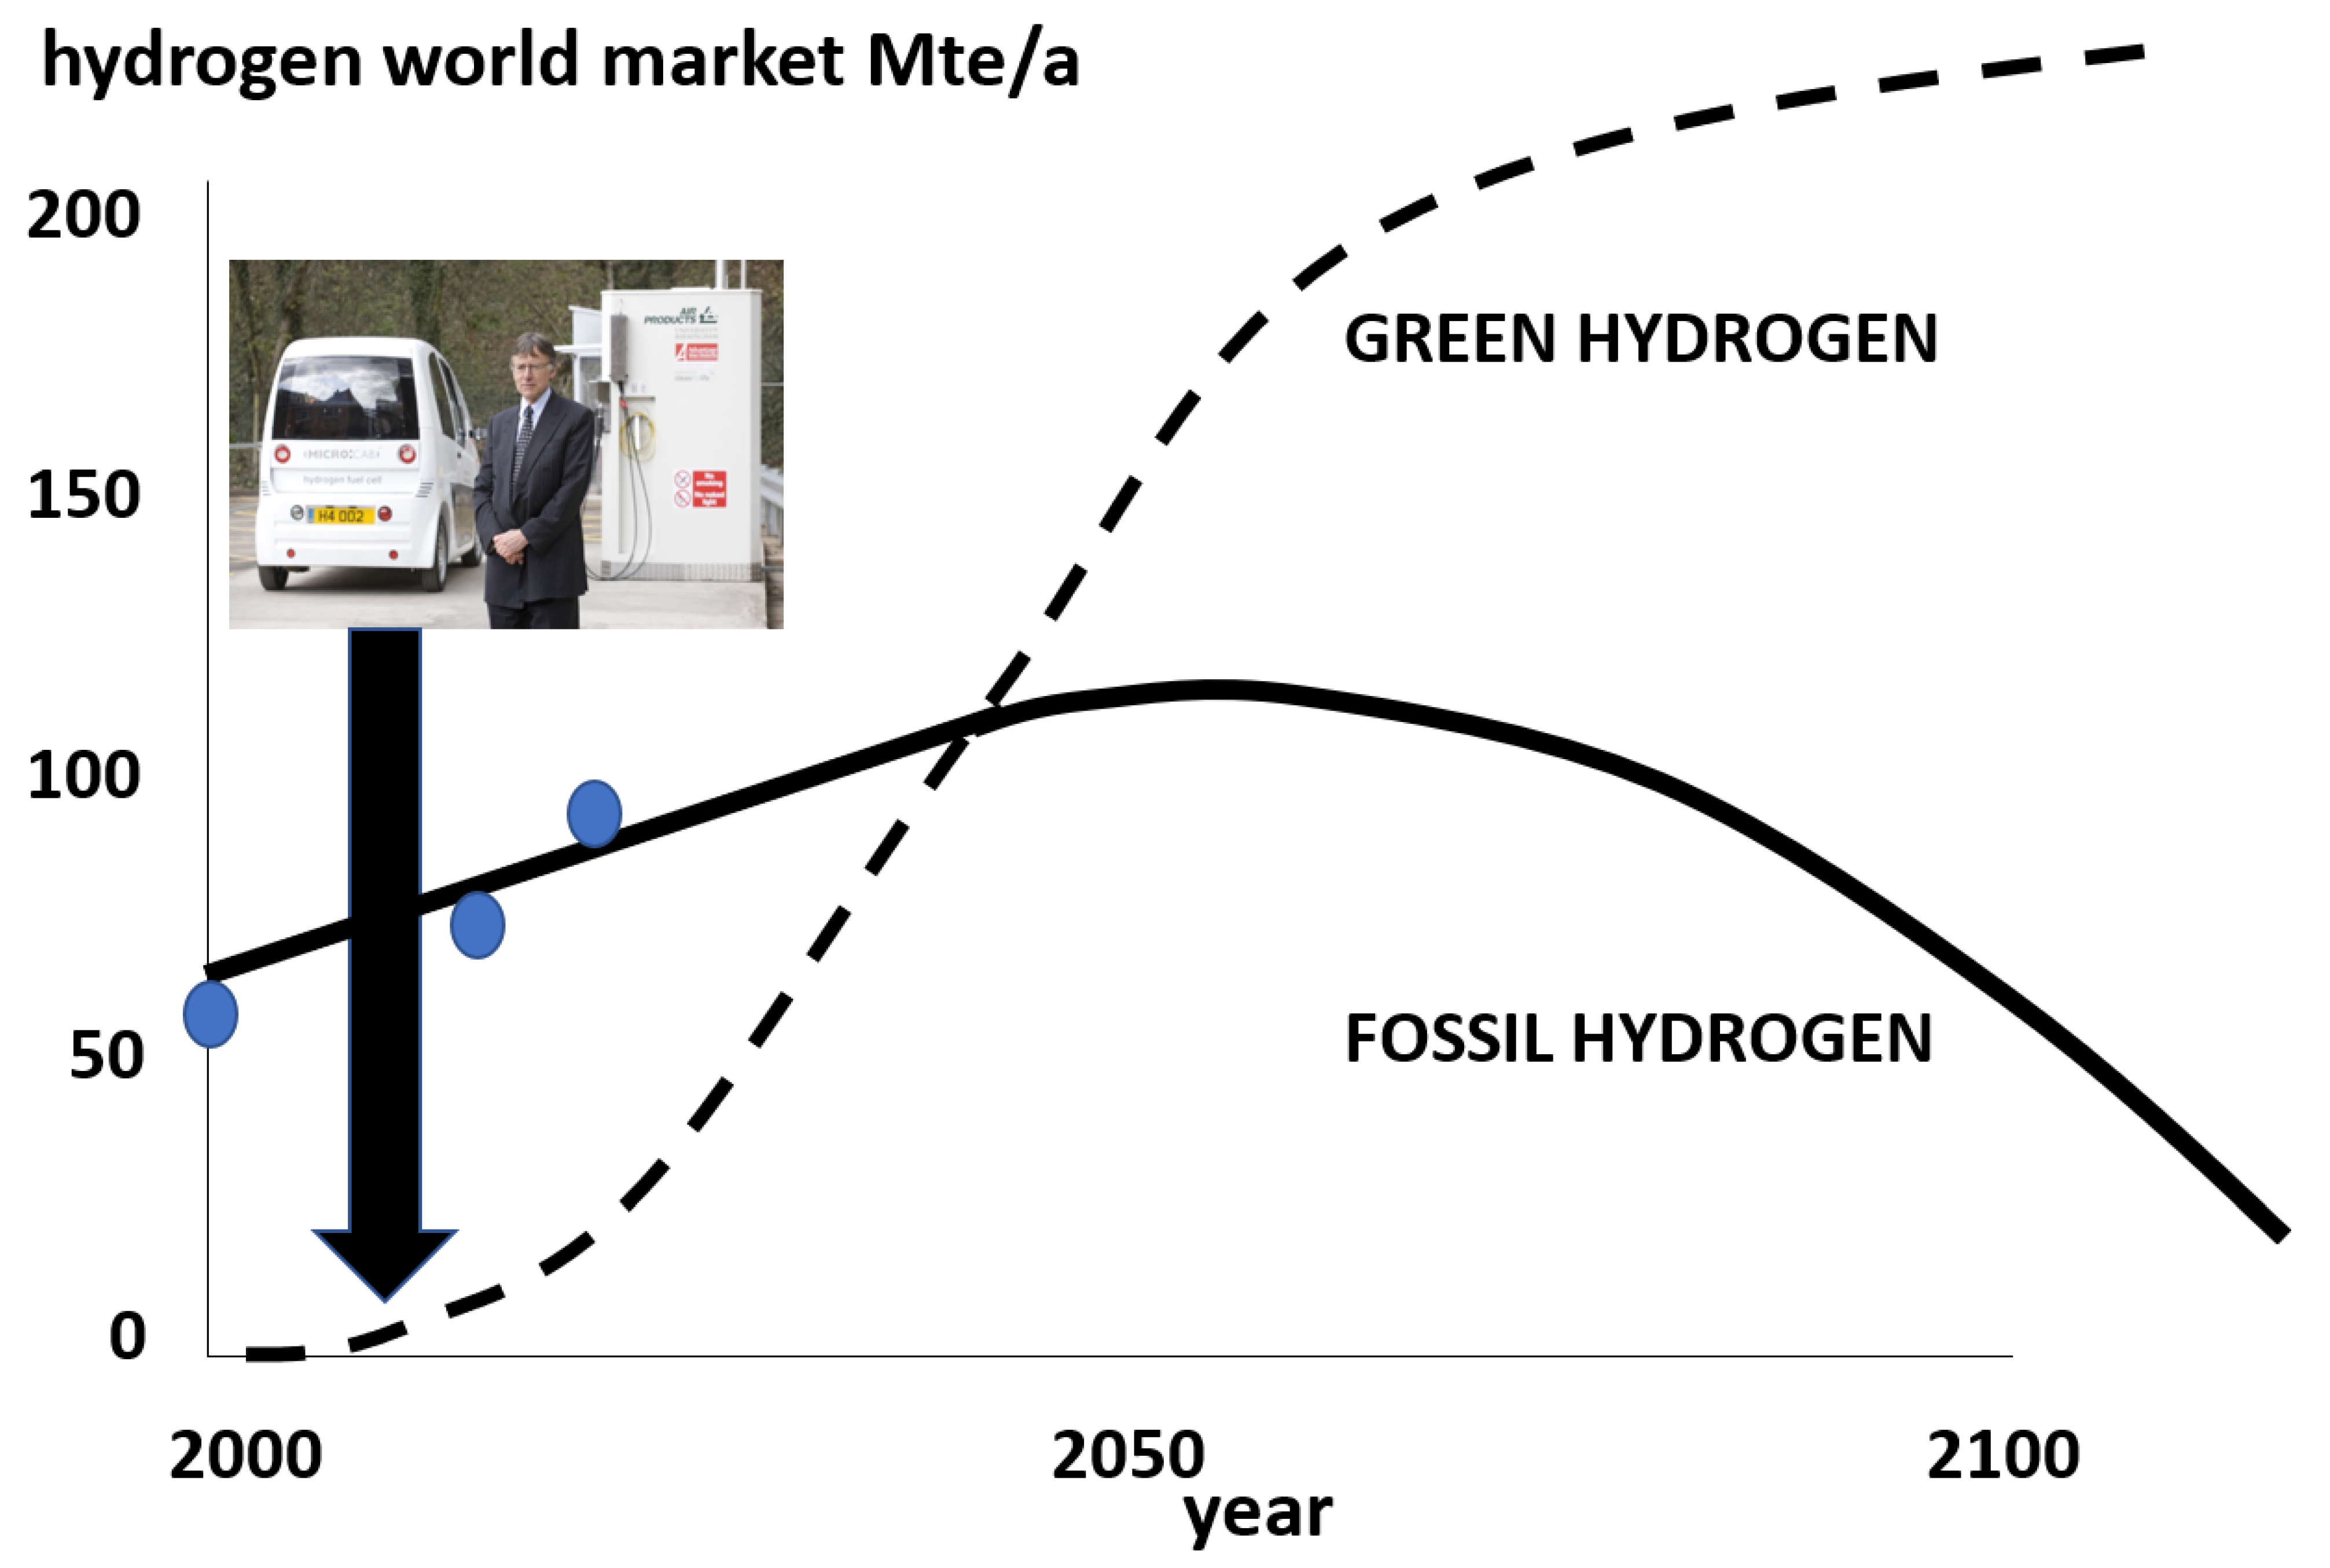
5]. Such fossil-based hydrogen, also called grey hydrogen, is still steadily growing in production across the globe, but must decline by 2100 if global warming is to be limited, as shown in
Figure 1.
Only in 2021 did the UK government move towards green hydrogen as a rational solution to the climate crisis [
6], putting it second on the priority list of ten options, after wind energy, but ahead of nuclear, zero-emission vehicles and greener buildings. Cities, such as Birmingham, had long recognised the need to reduce toxic emissions from combustion to create Clean Air Zones (CAZs) in city centres, but this was not integrated into the global warming response. A new green hydrogen refuelling station was opened in Birmingham in July 2021, and 20 hydrogen fuel cell battery electric vehicles (HFCBEVs) arrived to replace diesel buses. These projects were mainly funded by the Brussels FCHJU programme that had been introducing these clean buses in cities across the EU since 2003, well before UK politicians saw the need. The key invention was the Ballard PEMFC (Polymer Electrolyte Membrane Fuel Cell) bus first demonstrated in Vancouver in 1993, yet this was resisted by lithium battery proposers of the pure battery electric vehicle (BEV), claiming that the ‘fool cell’ was ‘mind bogglingly stupid’. In 2003, the first hydrogen-fuel-cell bus came to London, but the fuel was not green. Dr K Kendall installed the first UK green hydrogen station in 2008 to test 5 HFCBEV taxis on the University of Birmingham campus, successfully proving that this technology displayed similar energy utilisation to the lithium BEV, but twice the range of a combustion vehicle at equal weight and energy stored. A plan for the growth of green hydrogen in UK cities to solve the 35% CO
2 countrywide emissions from fossil-fuelled transport has been proposed, but the timescale is uncertain. Another century of green hydrogen development and dissemination appears to be necessary for the complete rejection of fossil hydrogen in the UK.
This paper describes the growth of UK green hydrogen, starting with the question ‘What do you mean, Green?’, and followed by the concept that fossil CO2 from transport is the major problem to be solved by green hydrogen. Then, the Clean Air Zone and Climate Emergency in UK cities are addressed. Early progress in the use of green hydrogen in transport is described, with a schedule to implement change first in Birmingham, then in all UK cities. Finally, the long-term prospect of green hydrogen in the UK is addressed.
2. What Do You Mean, Green?
The concept of green hydrogen is not simple. This paper shows how we can approach it systematically by removing fossil diesel fuel that permeates every aspect of our lives, from food, to steel, to grid electricity, heating and transport (
Table 1). First consider a visit to the pub to drink beer in the UK. If you emerge and meet a police constable, he might breathalyse you with a fuel cell device based on a proton conducting membrane, one of the early commercial applications of PEMFC technology by Lion Laboratories in the UK during the early 1980s [
7]. Breath containing ethanol vapour passes over one surface of the membrane and air flows on the opposite surface, both coated with platinum catalysts. As the alcohol reacts at the catalyst surface to form ethanoic acid, electrons are released and the current measured to give a blood alcohol reading, after calibration. Meanwhile, a proton diffuses through the damp membrane and reacts with oxygen at the air electrode to produce water. The question we wish to answer is this: ‘How green is the alcohol in your breath?’
You might think that this ethanol must be green because you have not consumed any fossil fuel. Yet, when we consider the barley used as raw material for beer, we find that one hectare of field produces about 5 te of product, equivalent to about 50 GJ of energy. Ploughing the field, seeding, weeding, spraying, harvesting and other tractor usage demands lots of fossil diesel, using approximately 25 GJ of energy. Then, processing the barley, shipping the beer and heating the pub take another 5 GJ. The surprising conclusion is that your visit to the pub caused you to consume considerable fossil diesel fuel. This started to happen around 1896 when Hornsby used Ackroyd’s engine patents (predating Diesel in Germany) [
8] to construct four tractors that could be used in agriculture. By 1918, many such machines had replaced horsepower and manpower in agriculture, eventually making the UK the most industrialised country in this global food sector, with less than 1% of the population working on the land.
Yet, agriculture is a relatively small 8% contributor to fossil CO
2 in the UK, as shown in
Table 1, so four larger CO
2-emitting sectors must be prioritised.
Industry and waste account for almost double the agriculture emissions. Next comes the electrical grid that has significantly improved since wind turbines have multiplied, with England generally being about 50% green in 2021, but fluctuating as renewables, such as wind and solar, vary with time. Green hydrogen produced from the grid is beneficial because it can cut the peaks and store excess wind energy to stabilise the system. Scotland is much better at around 98% green grid. A major problem sector is the heating of buildings, where natural gas has dominated since 1968, so it is difficult to change, yet, in 2020, Keele University showed that 20% green hydrogen can be injected into their private gas-pipe system to reduce fossil fuel usage through the HyDeploy project [
9]. Yet, the overriding fossil CO
2 problem in the UK is transport, which increases every year and mainly uses fossil oil and gas to propel cars, buses and trucks. This is the sector that can rapidly be improved through concerted action using green hydrogen in city centres first, then spreading outside the Clean Air Zones (CAZs).
(It is important, here, to avoid the distraction of UK Government exercises to define Net-Zero Hydrogen (NZH), which is ‘Hydrogen that releases 20 g of fossil CO
2 for every MJ of hydrogen product’ [
10]. It appears that, at first sight, this hydrogen is nowhere near green).
3. Clean Air Zone (CAZ)
The UK has had problems with coal polluting its city atmospheres for centuries. London imposed smoke control in the thirteenth century because coal fires were ‘prejudicial to health’. Soot was seen to cause cancer deaths in chimney sweeps in the nineteenth century. The UK Clean Air Acts of 1853, 1856, 1956 and 1968 had a significant effect on carbon particles and sulphurous smogs, but did not address the less visible toxic emissions, such as CO, CO2 and NOx. The UK has lagged behind Los Angeles whose smog originated largely from vehicle fuel pollution, which was so bad in the 1940s and 1950s that legislation was imposed, defining more carefully the noxious molecules and fine particles. The CARB (California Air Resources Board) was formed in 1967 to identify and cut emissions, recognising that large combustion engines had a nasty effect, ultimately leading to the introduction of catalytic clean-up on all gasoline vehicles in the 1970s, 25 years ahead of the UK, which, in 2020, at last recognised that combustion engines must be replaced by electric vehicles, banning new combustion vehicle sales by 2030.
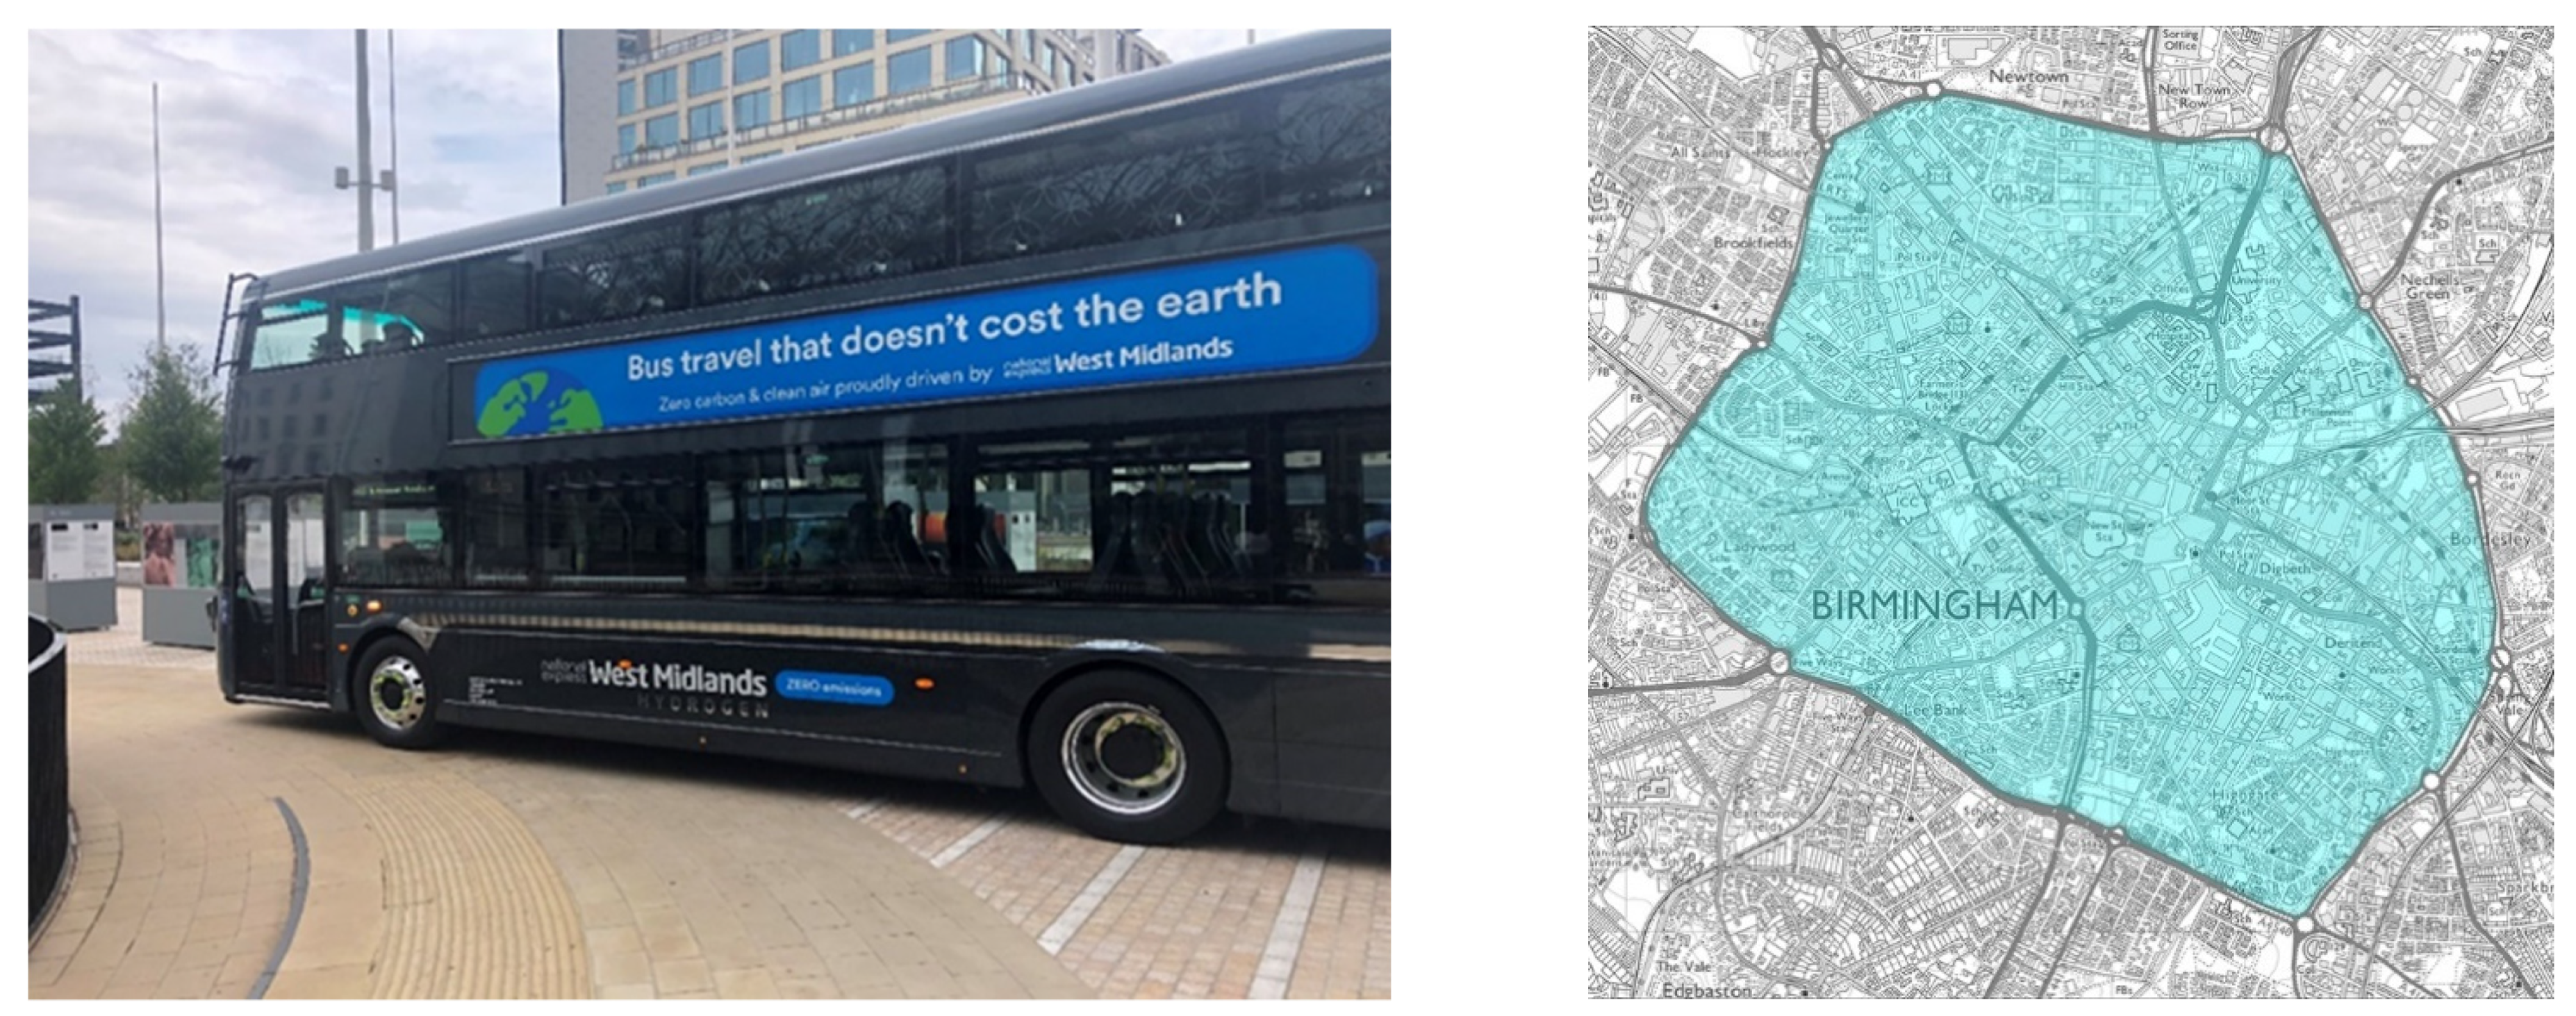
A key incentivisation step for green hydrogen has been the Clean Air Zone (CAZ) starting in Birmingham in 2021, coinciding with the delivery of 20 hydrogen fuel cell battery electric vehicle (HFCBEV) buses to replace the standard diesel double-deckers. Penalties are issued to drivers of cars (GBP 8/day) and trucks (GBP 50/day) that are defined as polluting. The problem is that polluting emissions from vehicles are not measured in the CAZ. Only vehicle age is deemed important.
Figure 2 shows the first of these Zero-Emission Vehicles (ZEVs) arriving in the CAZ, with 124 more being expected soon. By removing diesel exhaust fumes from buses, the air quality must increase. However, the logic of the CAZ legislation is faulty. There is no doubt that heavier vehicles produce more emissions, and this is embodied in the six-times-higher penalties for heavy-goods vehicles and buses. However, Birmingham has adopted the ludicrous EU policy that emissions depend on the age of the vehicle. Volkswagen proved that idea wrong by selling many new vehicles with emissions 40 times higher than the regulations. In all the CAZ reports since the start of June 2021, emissions are neither mentioned nor measured. It turns out that the CAZ is a dilution zone that moves dirty vehicles onto the ring road. It does little to encourage zero emissions and does not mention the great need for electric vehicles. It has been clear since the King Review in 2007 [
11] that the electric vehicle, whether BEVs or HFCBEVs, can eliminate both toxic emissions and fossil CO
2. If the CAZ regulations inserted CO
2 as a toxic emission with penalties, similar to NOx, SOx, CO, VOCs and particulates, then the integration of CAZ and low carbon would be complete. It is essential in the future that the CAZ incentivises electric drive rather than penalising old vehicles. Total electric vehicle registrations in the UK approached 1% of the total vehicle population in 2021, so this needs to improve by two orders of magnitude by 2030 to satisfy UK government targets.
Unfortunately, Birmingham has followed the London model, which started in 2003, and has failed to significantly reduce either carbon dioxide or toxic air in its 19-year existence. GBP 250 M of penalties were collected in 2020, but many citizens are still dying on the London streets because of bad policy [
12], which fails to address emissions in a rational way.
Fossil fuels, such as diesel, are so embedded in the UK civilization that enormous amounts of green hydrogen will be required in the future to eradicate the CO
2 problem and climate emergency. A total of 2.2 Mte of diesel fuel was used in the UK in 2017 [
13]. Hydrogen required to fully replace this is a factor 6 less for two reasons: Firstly, HFCBEVs travel twice as far at the same weight, so only half the energy is needed for these new vehicles; secondly, hydrogen has three times more energy than diesel per kg of mass. Consequently, the UK needs about 400,000 te/a of green hydrogen to solve the diesel problem for heavy transport. Taking into account the energy losses in a typical large electrolyser, this is only 4 GW of electrical power, so by 2030, when the UK government has targeted 4 GW of green hydrogen from wind, the diesel emission problem could be eliminated. Much more green hydrogen will be required to replace petrol, natural gas and other fossil fuels that are used in larger quantities than diesel, giving a long-term UK target for green hydrogen of around 40 GW.
4. Progress in Demonstrating UK Green Hydrogen
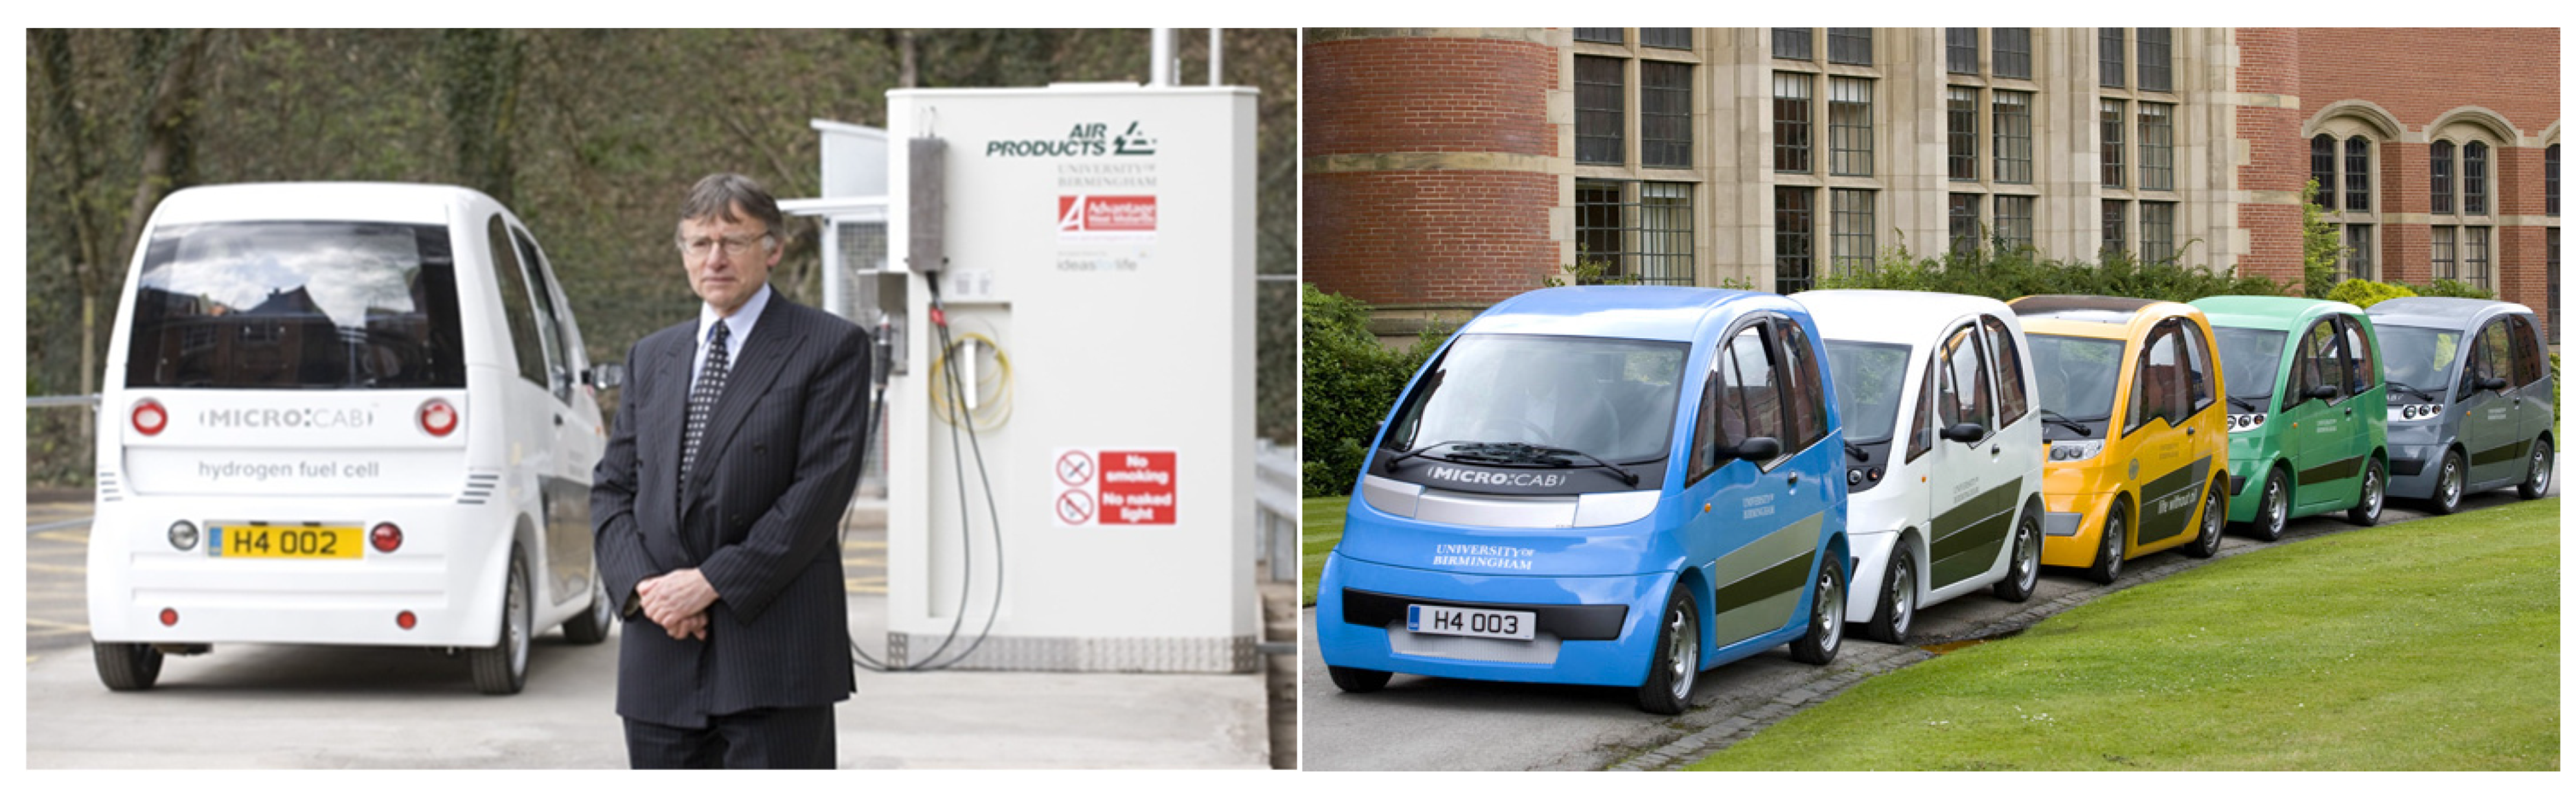
The first UK green hydrogen station was revealed in Chemical Engineering at the University of Birmingham in 2008. It was used to refuel five hydrogen fuel cell battery electric vehicles (HFCBEVs) shown in
Figure 3. During 2007, Professor Kendall sought quotes for green hydrogen from gas companies, such as Shell, BOC and Air Products. The reaction was negative: ‘There is no market for green hydrogen and we cannot supply’. Consequently, a biomass company was contacted and agreed to generate electricity from biogas, then electrolyse water to produce hydrogen that was shipped to Birmingham in steel cylinders. The gas was compressed to 400 bar to refuel the Microcab vehicles through the Air Products dispenser (
Figure 3). Although the green hydrogen cost was high, around GBP 30/kg, the project objective was to propel the cars without recourse to fossil fuel, preventing further energy loss caused by converting fossil molecules to hydrogen. Then, the improved performance of the HFCBEVs, compared to petrol cars, could be proved by 50 PhD students recruited in 2009 on an EPSRC Doctoral Training Centre programme.
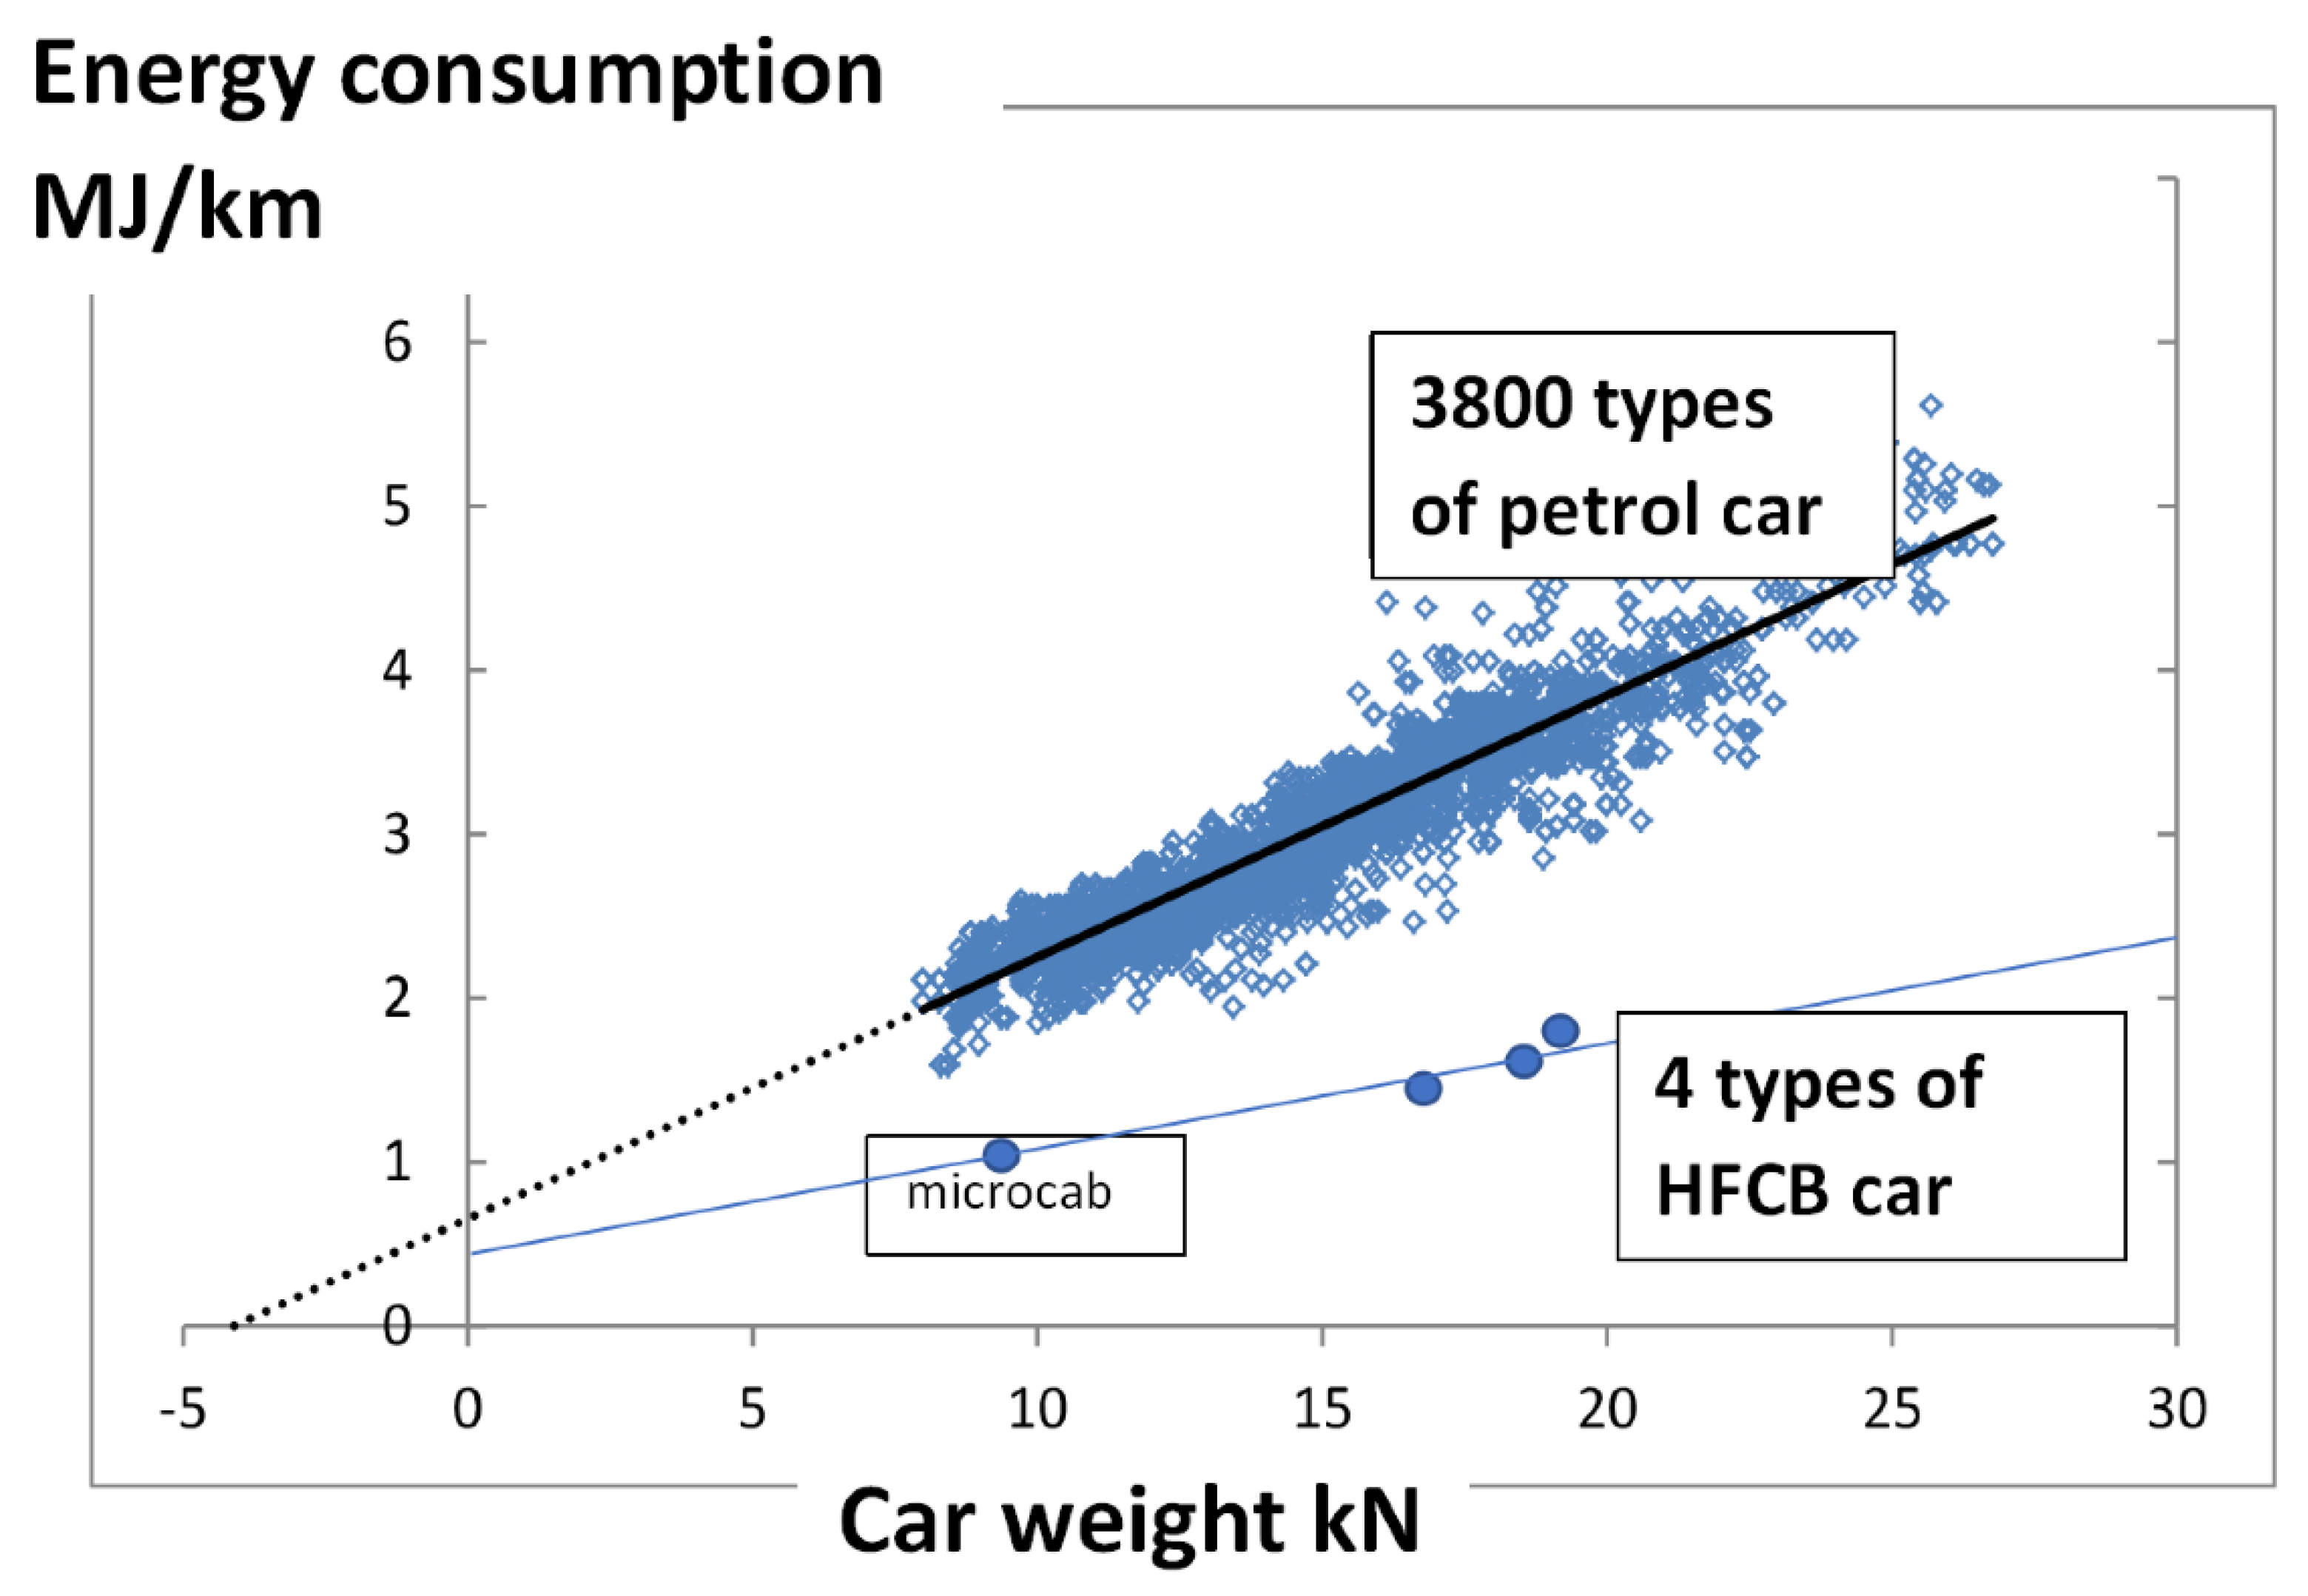
To demonstrate the improved energy performance of the five Microcabs [
14], compared to the conventional petrol cars, standard-drive cycles were performed and the energy consumption per km was measured in MJ, as shown in
Figure 4, to compare with 3800 different types of petrol cars used in China from 2000 to 2010. The surprising result was that the energy consumption was linearly dependent on the vehicle weight, despite substantial scatter of the 3800 data points. For many years, it has been known that heavier vehicles demand more energy per kilometre driven, but the explanation had not been discovered. Additionally, electric vehicles were known to travel further per MJ than combustion vehicles, but this had previously been analysed in terms of ‘vehicle efficiency’, which turns out to be a false idea. It is very misleading to claim that a battery car is 90% efficient, as is often stated. The battery itself may be tested to show that its electrical energy is cycled with 90% efficiency, but the whole vehicle presents a very different picture of energy losses by numerous mechanisms.
When properly analysed [
15], vehicle efficiency is zero in the fuel consumption standard test measuring litre/100 km (or MJ/km in this paper). All the energy injected into the motion of a vehicle during a standard drive cycle is lost because the vehicle is stationary at the start and finish. Thus, the common statement that an electric car is more efficient than a petrol car is incorrect, because each vehicle has zero efficiency in the fuel-consumption drive cycle. The difference in the vehicle energy input/distance travelled (MJ/km) measurements must be explained in terms of numerous energy dissipation mechanisms, for example, energy lost in heating the cabin, friction loss in the tires, and viscous loss in air flowing around the vehicle. Many of these mechanisms are identical for both combustion and electric vehicles, and so produce similar losses, whatever the drive train.
The first idea that emerged from viewing the
Figure 4 results was that Coulomb’s friction law was dominant. Coulomb found [
15] that frictional resistance force F depended on both weight W and adhesion A, according to Equation (1), where μ is the friction coefficient.
which is the bold line drawn in
Figure 4.
There are many frictional losses in a complex vehicle, including brake loss, tire loss and bearing losses. However, losses in cabin heating are almost independent of vehicle weight, while air resistance is non-linear in weight. By identifying ten separate energy-loss mechanisms and adding them together, it was found that the resultant sum was linear and fitted the results of
Figure 4. This allowed the losses of combustion vehicles to be rationally compared with losses in four kinds of pre-production hydrogen fuel cell battery electric vehicles shown in the lower line of
Figure 4. It was interesting to demonstrate that HFCBEVs had half the energy losses of the combustion machines in this standard-drive cycle test. Pure battery electric vehicles (BEVs) fell approximately on this same line, showing that there was little advantage in energy losses for BEVs compared to HFCBEVs.
The competition between the pure battery electric vehicle (BEV) and the fuel cell (HFCBEV) remains unresolved. The BEV is marginally better because the line plotted for a number of BEVs falls a few percent below the HFCB line in
Figure 4. This can be attributed to the differences between lithium and fuel cell electrode catalysts. However, while BEVs have improved since 2010, the lithium batteries carry 50 times less energy per kg than gasoline. Range is therefore limited and charging times remain high, even when expensive high-power chargers are installed. The main advantage in hydrogen fuel cell battery electric vehicles (HFCBEVs) is that range can be increased by inserting more cylinders, with rapid refuelling in 5 to 10 min, lighter in weight and more economic than lithium batteries. Only HFCBEV buses can compete with existing diesel buses at the present time, since BEV buses have typically one third of the range due to 70% less energy stored in lithium batteries than in hydrogen cylinders. A confusing issue is that BEV buses with 324 kWh storage (e.g., BYD K9) are said to be equivalent to HFCBEV buses with 900 kWh storage (e.g., Wrightbus in
Figure 2).
5. Accelerating the Green Hydrogen Prospect in UK
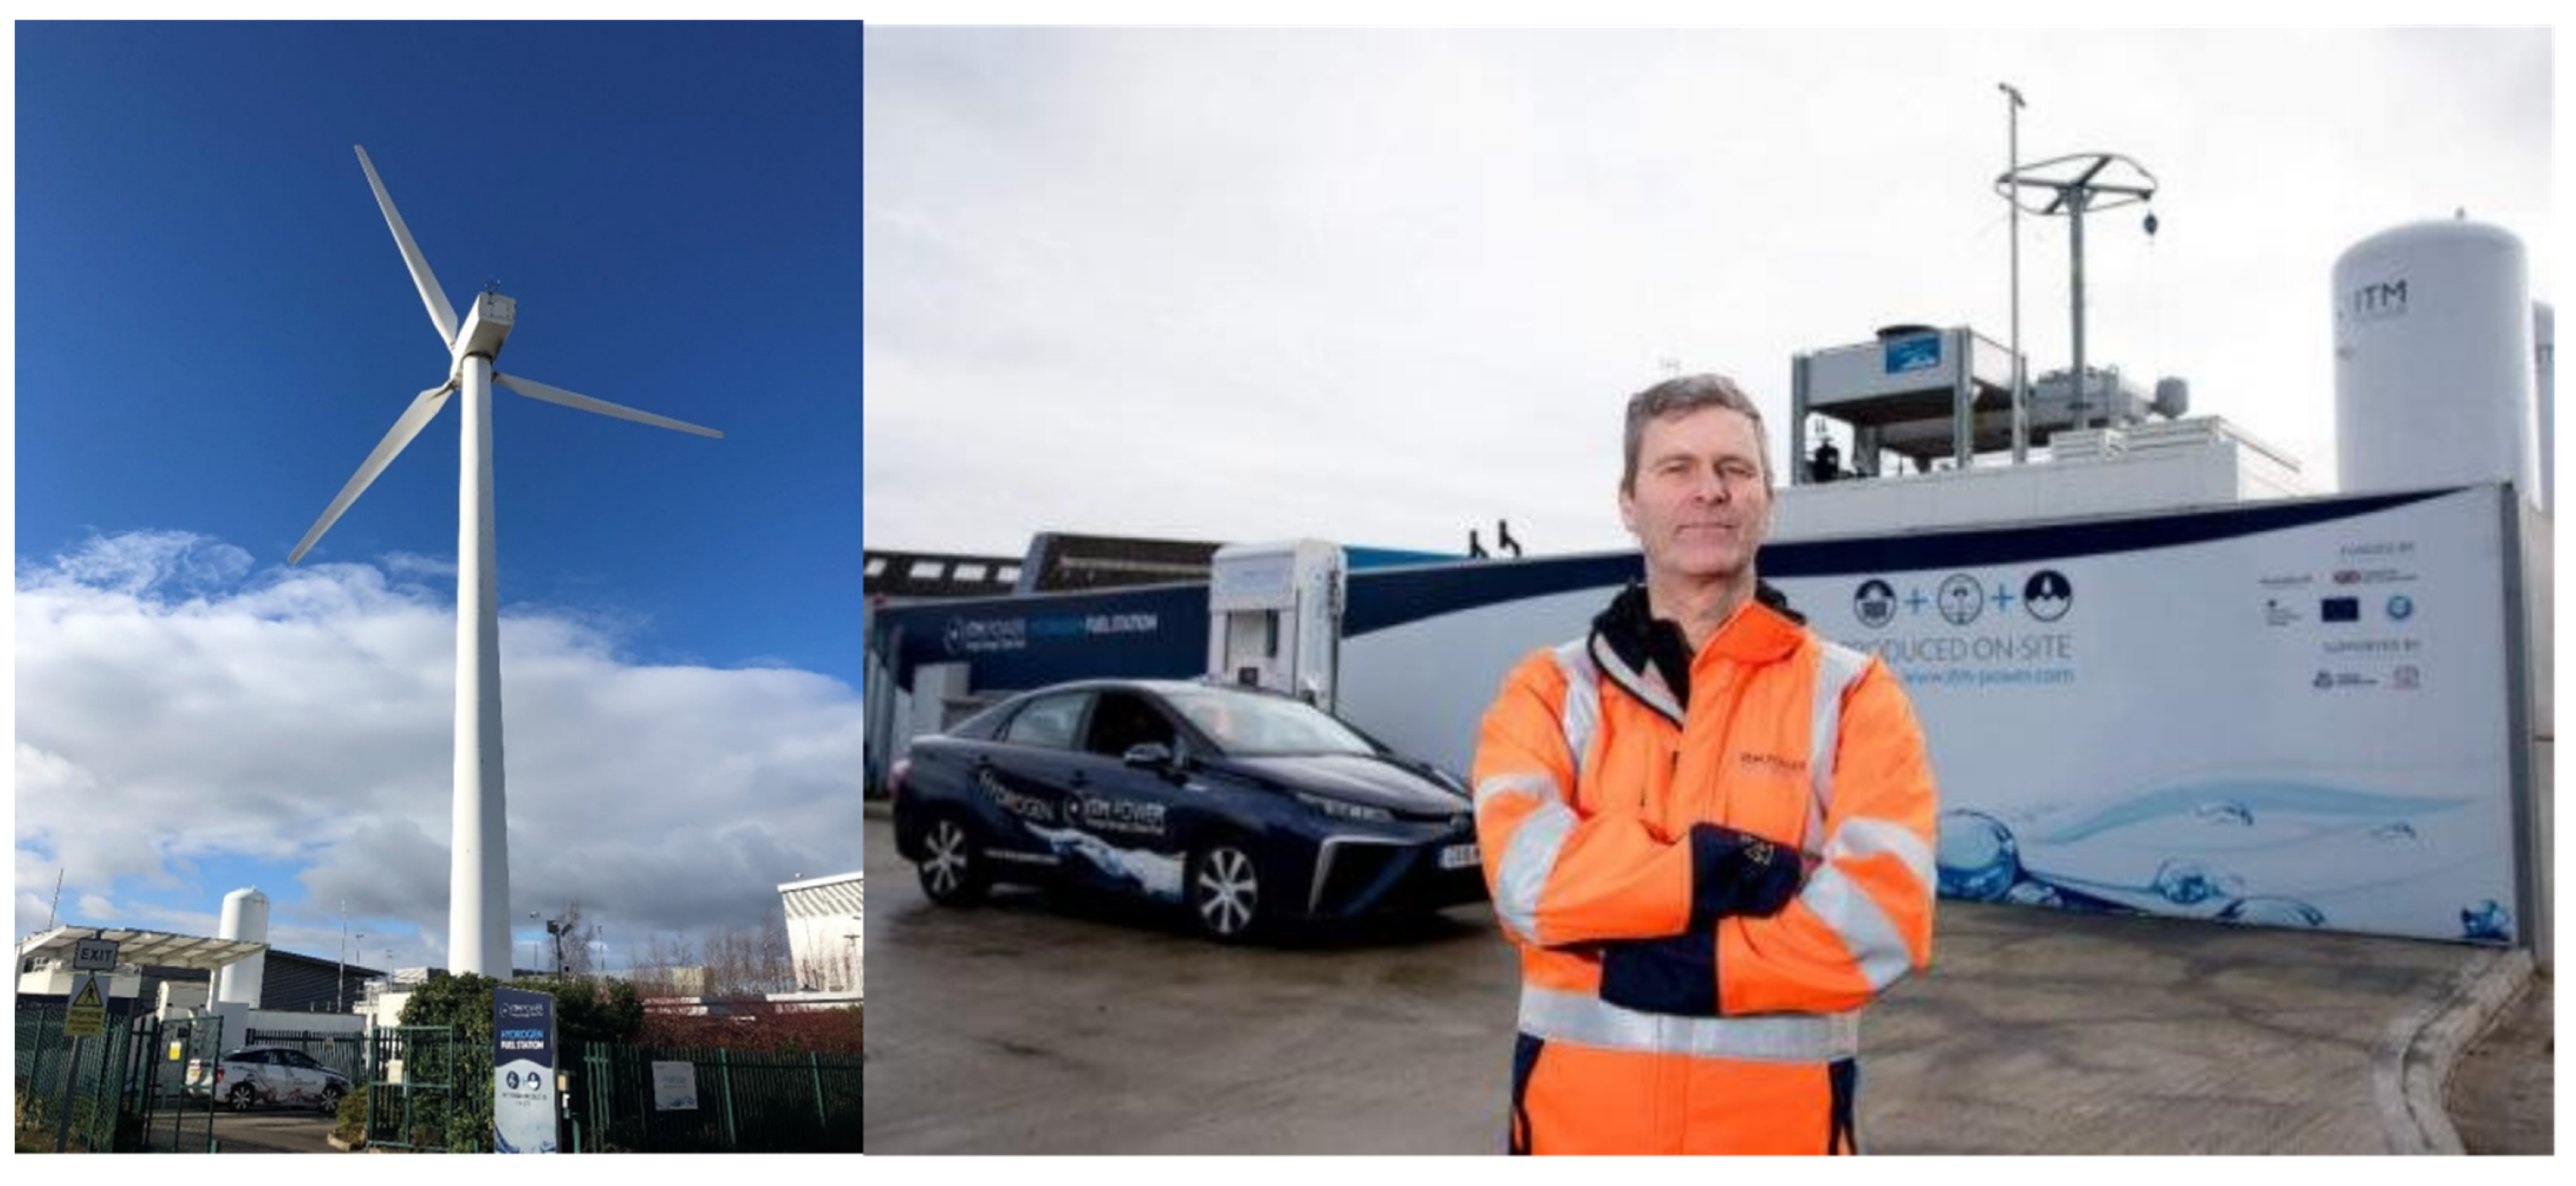
At present, there are four UK locations focusing on the rapid expansion of green hydrogen production, delivery and downstream applications. These regions are Birmingham CAZ, Aberdeen, Tees-Valley and Liverpool–Manchester. The objective is to build green hydrogen projects at an increasing scale. This demands the matching of supply and consumer demand that includes buses, trucks, taxis and other highly utilised vehicles. In 2021, most UK green hydrogen was generated on-site by grid-electrolysis in stations developed by companies, such as ITM Power in Rotherham, Birmingham, Beaconsfield and similar sites. Such installations are expensive to install and run, but have been important in stimulating early action, despite being stranded without sufficient vehicle demand.
Figure 5 shows how this green hydrogen production has been increasing globally, compared to the much larger amount of fossil hydrogen produced on petrochemical refinery sites. Large companies, such as Air Liquide, have claimed they will move to green hydrogen by 2050, with larger electrolysers 200 MW in scale [
16]. ITM Power is on a parallel track in the UK, having recently completed its mega-factory with a claimed annual capacity of 1 GW, about 200,000 te/a of hydrogen production. The challenge here is that the oxygen is vented, wasting half the product and causing high prices, which cannot easily compete with other green hydrogen sources, such as biorefining, which produces a number of valuable by-products that can be fully utilised.
The difficulty is planning the hydrogen vehicle markets to expand and utilise the hydrogen produced. One Chinese city, Foshan, achieved this by manufacturing 1000 hydrogen buses to match the installation of 10 city stations [
18]. This is the path adopted in Birmingham, UK, where hundreds of buses (
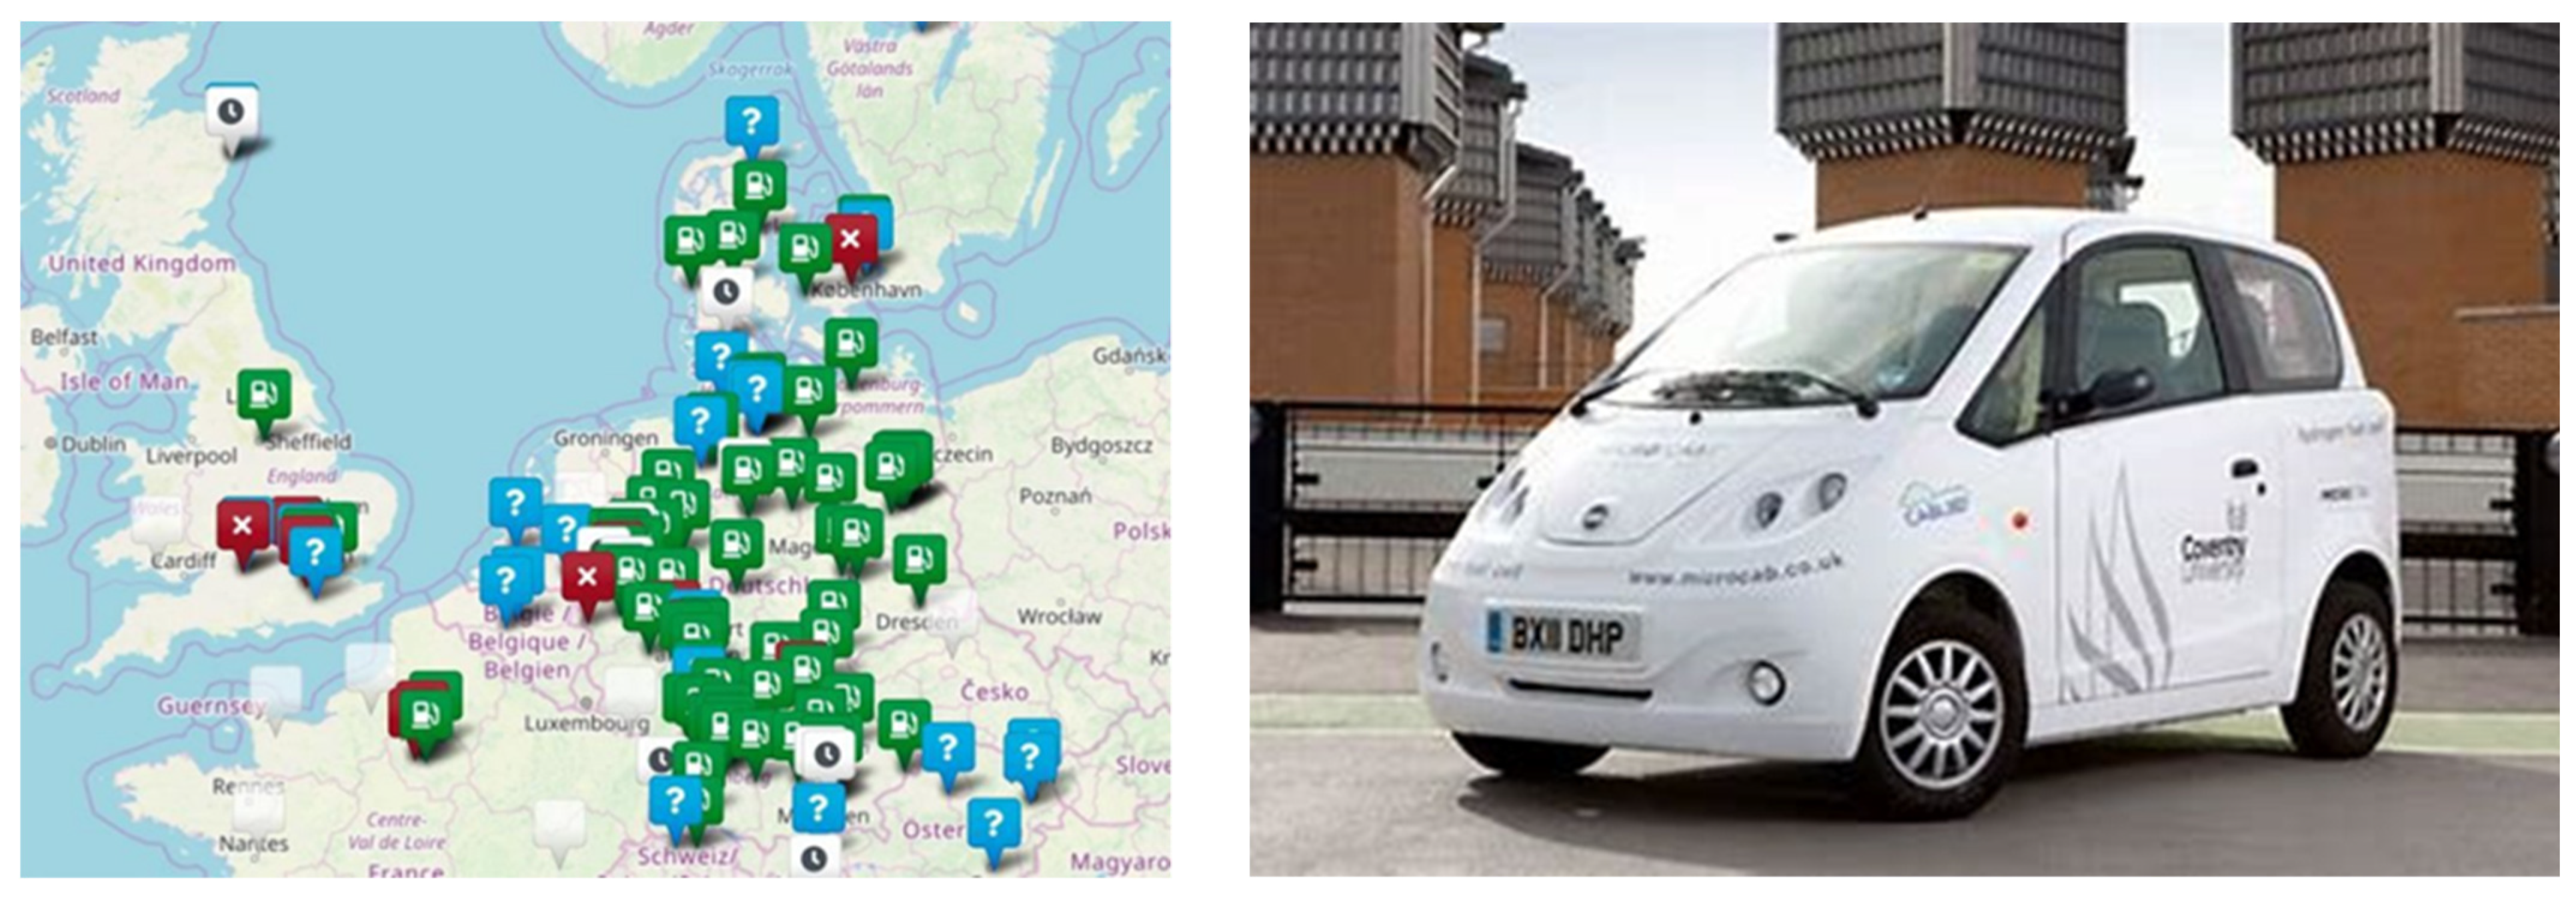
Figure 2) are being ordered to justify the installation of six hydrogen stations around the ring road. Building infrastructures prematurely, as both Japan and Germany have done to obtain hundreds of stations across their countries, leads to stranded assets that fail economically. Private vehicles, such as taxis, vans and trucks, are also needed, but are less predictable, so can be allowed to increase organically as the bus backbone is expanded. One novel HFCBEV manufactured in Birmingham is the Microcab taxi/van (
Figure 6) that was created by Jon Jostins in 2004, then further developed and improved since 2012, when the EU SWARM project was initiated with a plan to build a hydrogen highway from Birmingham to Germany. Although that infrastructure concept was premature, the Microcab idea has been proved over ten years and will be an important contribution to green hydrogen demand in the Birmingham CAZ.
The unsatisfactory 2022 UK picture of hydrogen refuelling stations compared to Germany is shown in
Figure 6, with the green square points indicating existing open stations, demonstrating that only 4 of the UK installations were operational out of the 12 in existence [
19]. Because these stations were built without a vehicle plan to use the hydrogen, money has been lost, stations idle, and opportunity wasted. The present objective is to position several new profitable green hydrogen stations around Birmingham city CAZ by 2025. Repeating this plan over 80 UK conurbations could then provide connected economic hydrogen infrastructures across the country by 2030. Without profit, this exponential growth cannot occur, as illustrated in Germany where 93 stations are operating, but have stalled because they lose money and are underutilised.
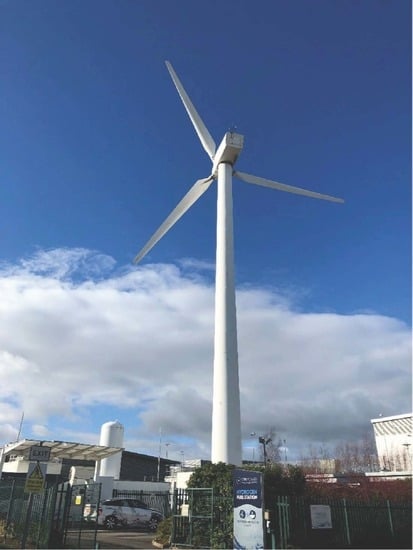
Most importantly, the future stations must be green hydrogen, which is not usual in Germany (which is about 30% green), and a problem in England because electrolysers operating on grid electricity are only about 50% green at the present time. Two examples are shown in
Figure 7. A wind turbine at Rotherham produces green electricity to electrolyse water, making green hydrogen. By contrast, the Birmingham station obtains its power from the electrical grid and claims it is green because green energy input to the grid is audited and allocated to ITM on paper. This is a less satisfactory definition of green hydrogen because other grid users are receiving less green power without realising it. Another snag is that many of the station components are made using fossil fuel that should be taken into account to present the full picture of green energy in the cradle-to-grave assessment. As green hydrogen becomes a dominant energy source for manufacturing steel, cement and other components, this snag will be reduced, but it could take decades of further effort.
An important consequence of the new UK focus on green hydrogen is the creation of new and evolving businesses that have suddenly become aware of a growing market demand, though not yet profit-making in 2021. Adelan is a company that has pivoted from fuel cell innovation to green hydrogen, while JCB, the large digger manufacturer, has moved towards hydrogen buses and hydrogen construction equipment [
20]. Meanwhile, completely new SMEs have been created, such as HydrogenUnited.org, to develop infrastructure or Fusion Fuel Green to innovate in electrolysers, competing with ITM Power created 20 years ago, when Intelligent Energy and Ceres Power were also founded.
6. Conclusions
The priority issue in the UK regarding green hydrogen is replacing more than 1 Mte/a of fossil hydrogen currently produced in petrochemical plants. Solving this problem will have a major influence on fossil-fuel transport that is currently raising unhealthy air pollution plus carbon emissions causing climate change. Heavy-duty vehicles, such as buses and trucks, should be changed to hydrogen fuel cell battery electric vehicles (HFCBEVs). Replacing all such combustion vehicles could prevent many deaths and illnesses in cities, while removing 35% of UK fossil CO2 emissions.
To date, UK battery electric vehicle (BEV) registrations reached almost 1% penetration in 2021, but hydrogen fuel cell battery electric vehicle (HFCBEV) numbers are still 1000 times lower. Heavier vehicles, such as buses and trucks that are highly utilised, need hydrogen because battery storage is too heavy, expensive and slow to recharge. By 2030, it is expected that BEVs and green hydrogen vehicle populations will have increased to 100,000 in Birmingham, substantially reducing CO2 and other emissions. A total of 50 other UK cities should then follow this leading location because profits will be generated and citizens incentivised.
Clean Air Zones (CAZs) are vital because they can encourage the change to green hydrogen, and prove to citizens that this new fuel will improve quality of life throughout Britain. Around 1Mte/a of UK green hydrogen (4 GW continuous production) is needed to make this radical change, starting from near zero in 2020. Until 2021, the UK has lagged behind the USA, Germany, Japan and China, but the integrated and educated democratic population in the UK can readily surge past its competitors, having now recognised the major benefits of clean air and zero carbon.
Significant applications for green hydrogen are also appearing in buildings to cut natural gas usage, and on industry sites where the local generation of heat and power can distribute energy more effectively than the electricity grid. These changes will require a further 4 GW of continuous production, mainly sourced from wind turbines whose population will rise by an order of magnitude in 2050, with salt-cavern storage rapidly proliferating from the three small sites used to date.


