

Thermal Investigation of a Turbocharger Using IR Thermography


Abstract
:
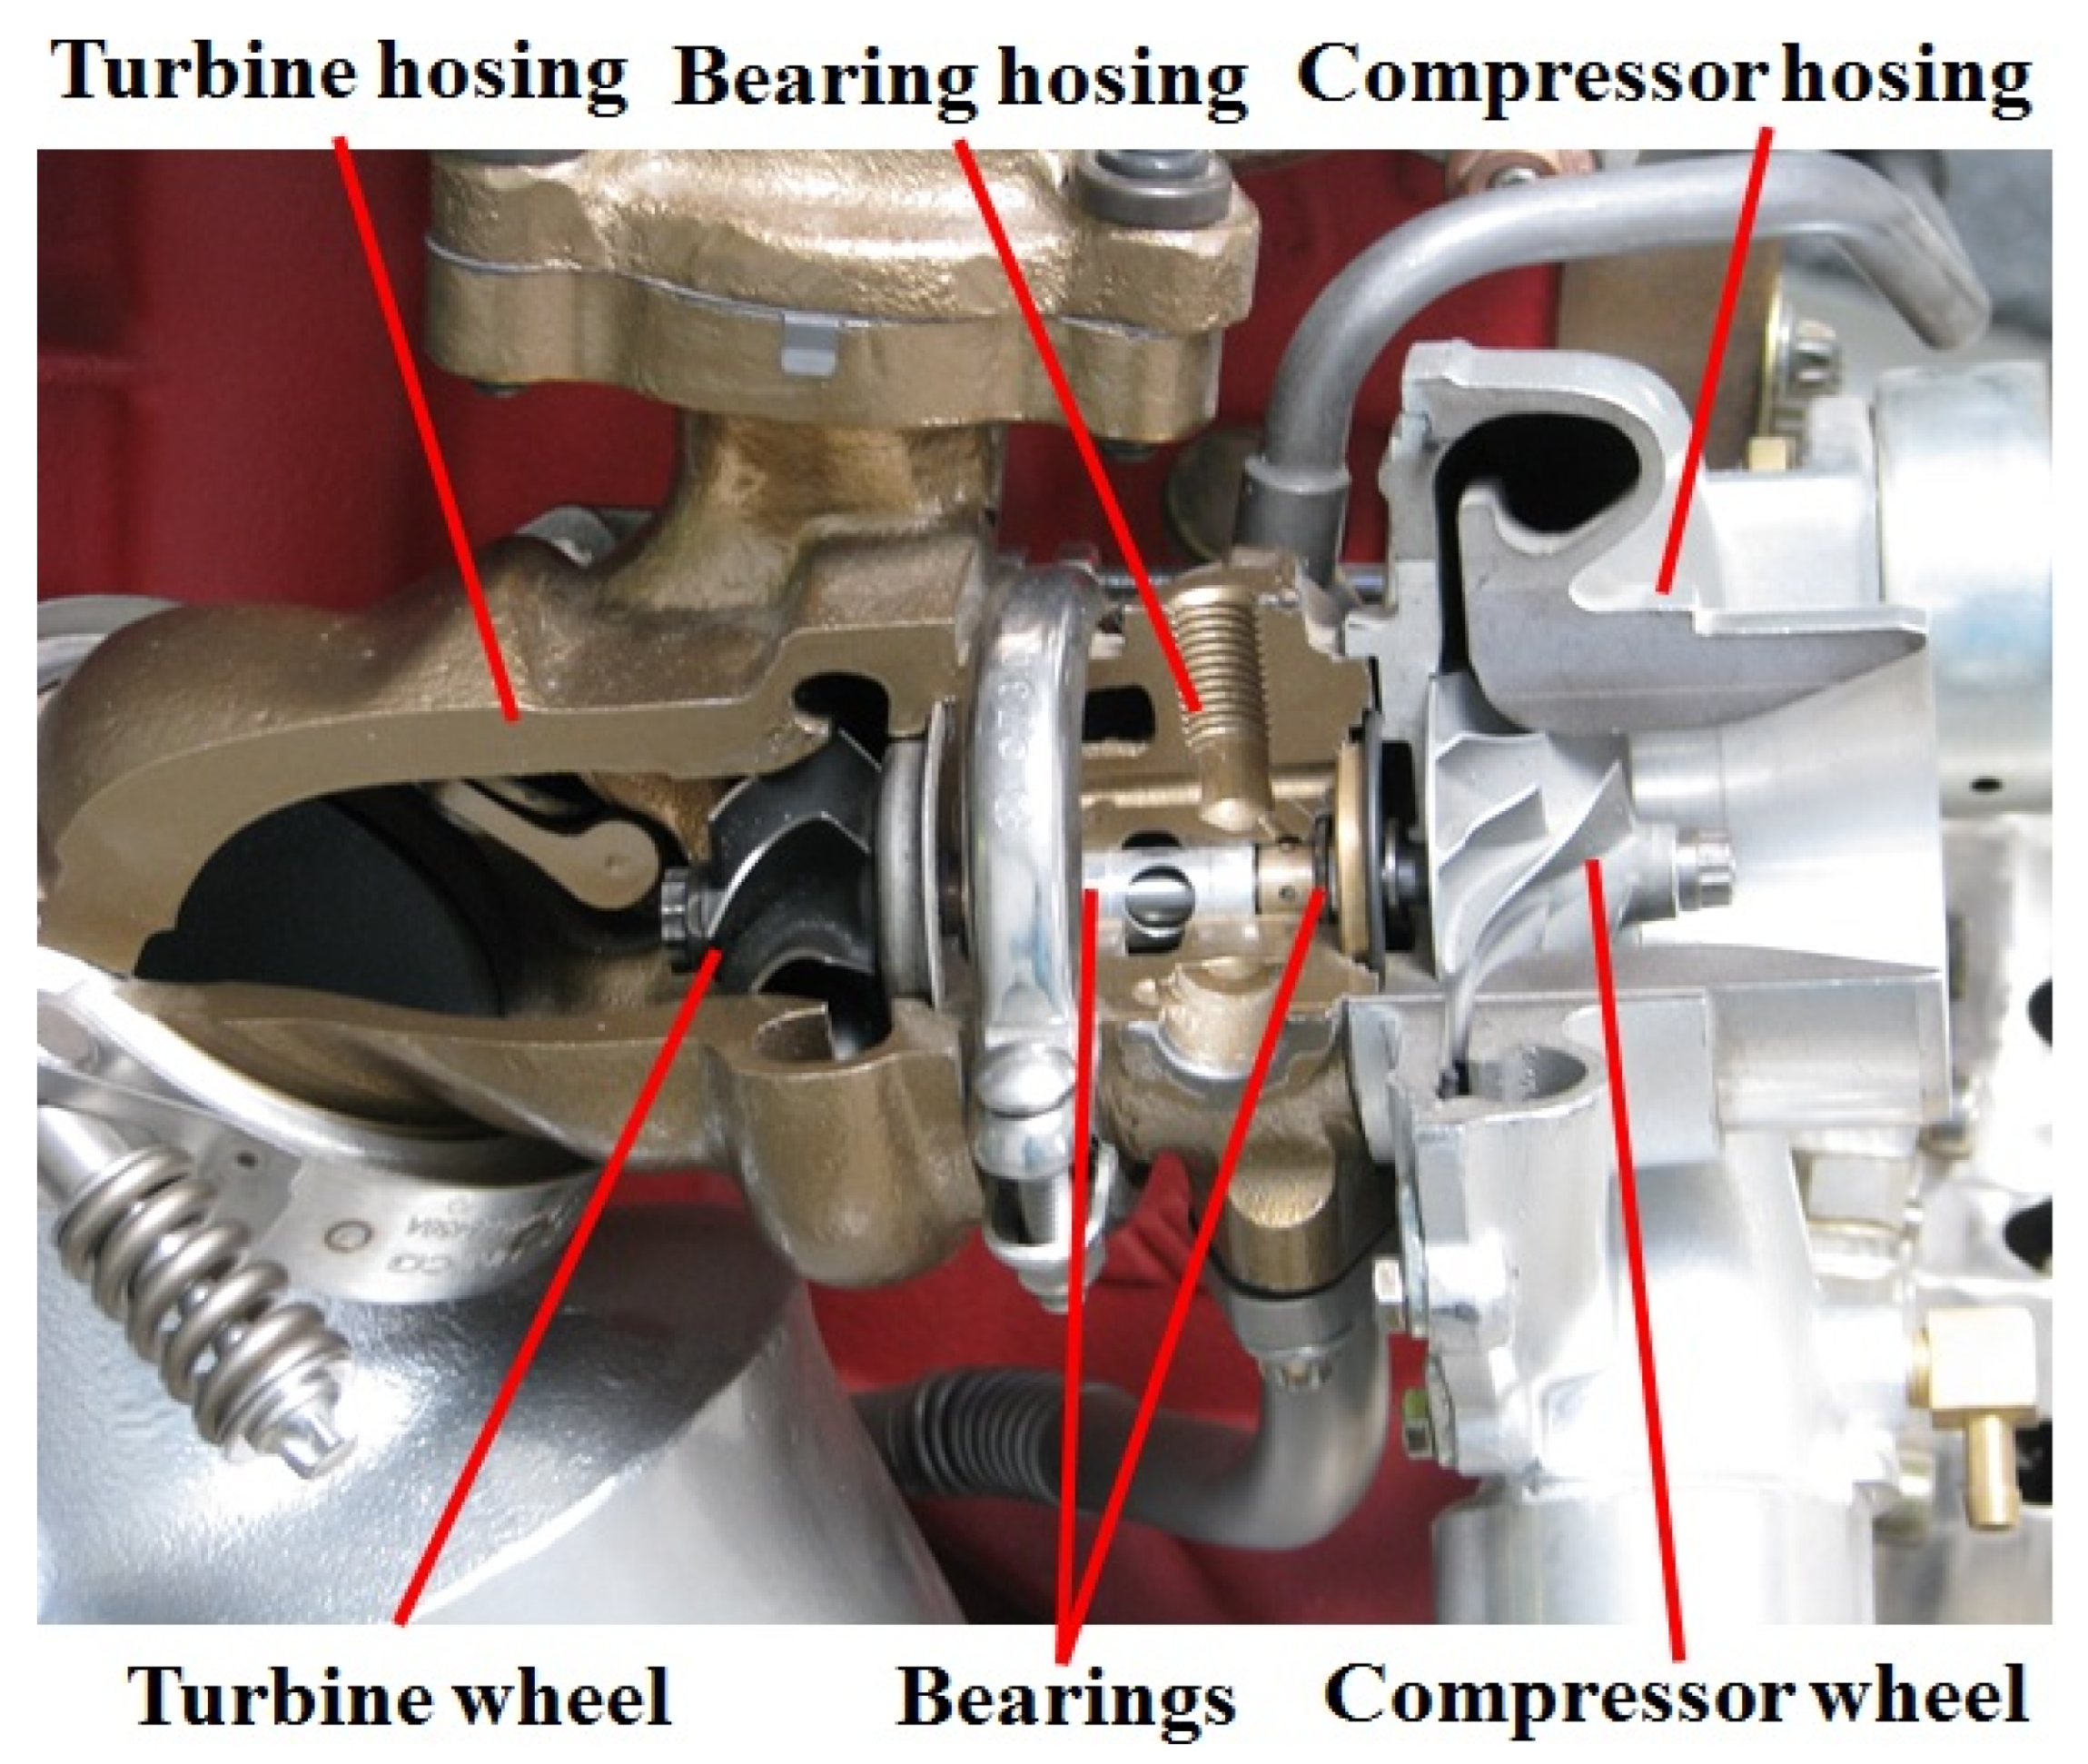
1. Introduction
2. Radiation Coefficient of Turbocharger Parts
2.1. Specifications of Furnaces (Vertical)
2.2. Specifications of Thermal Camera
2.3. Emissivity of the Compressor Housing
2.4. Emissivity of Bearing Housing
2.5. Emissivity of the Turbine Housing
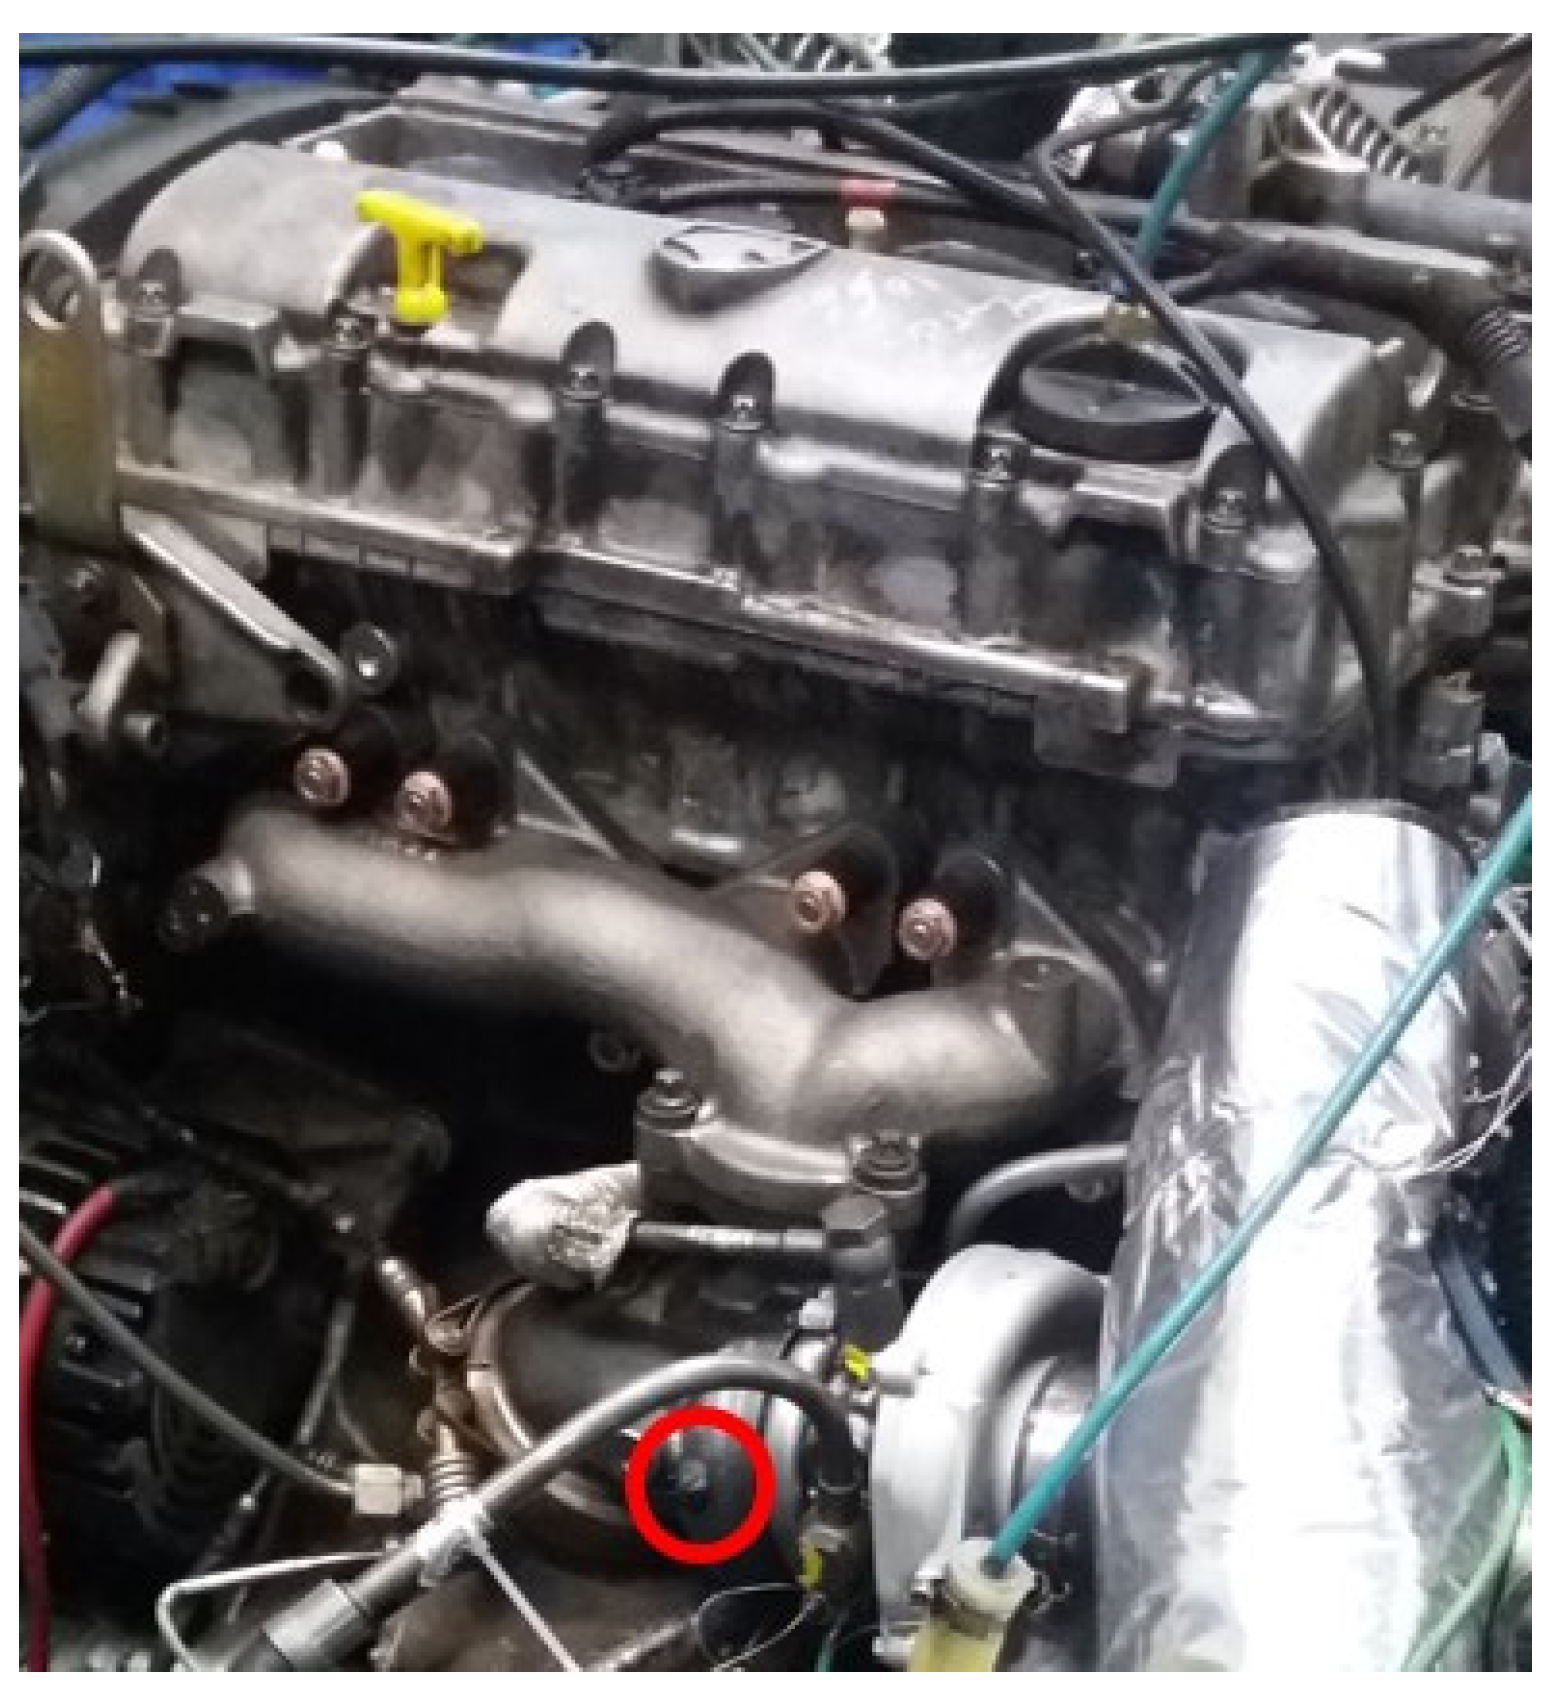
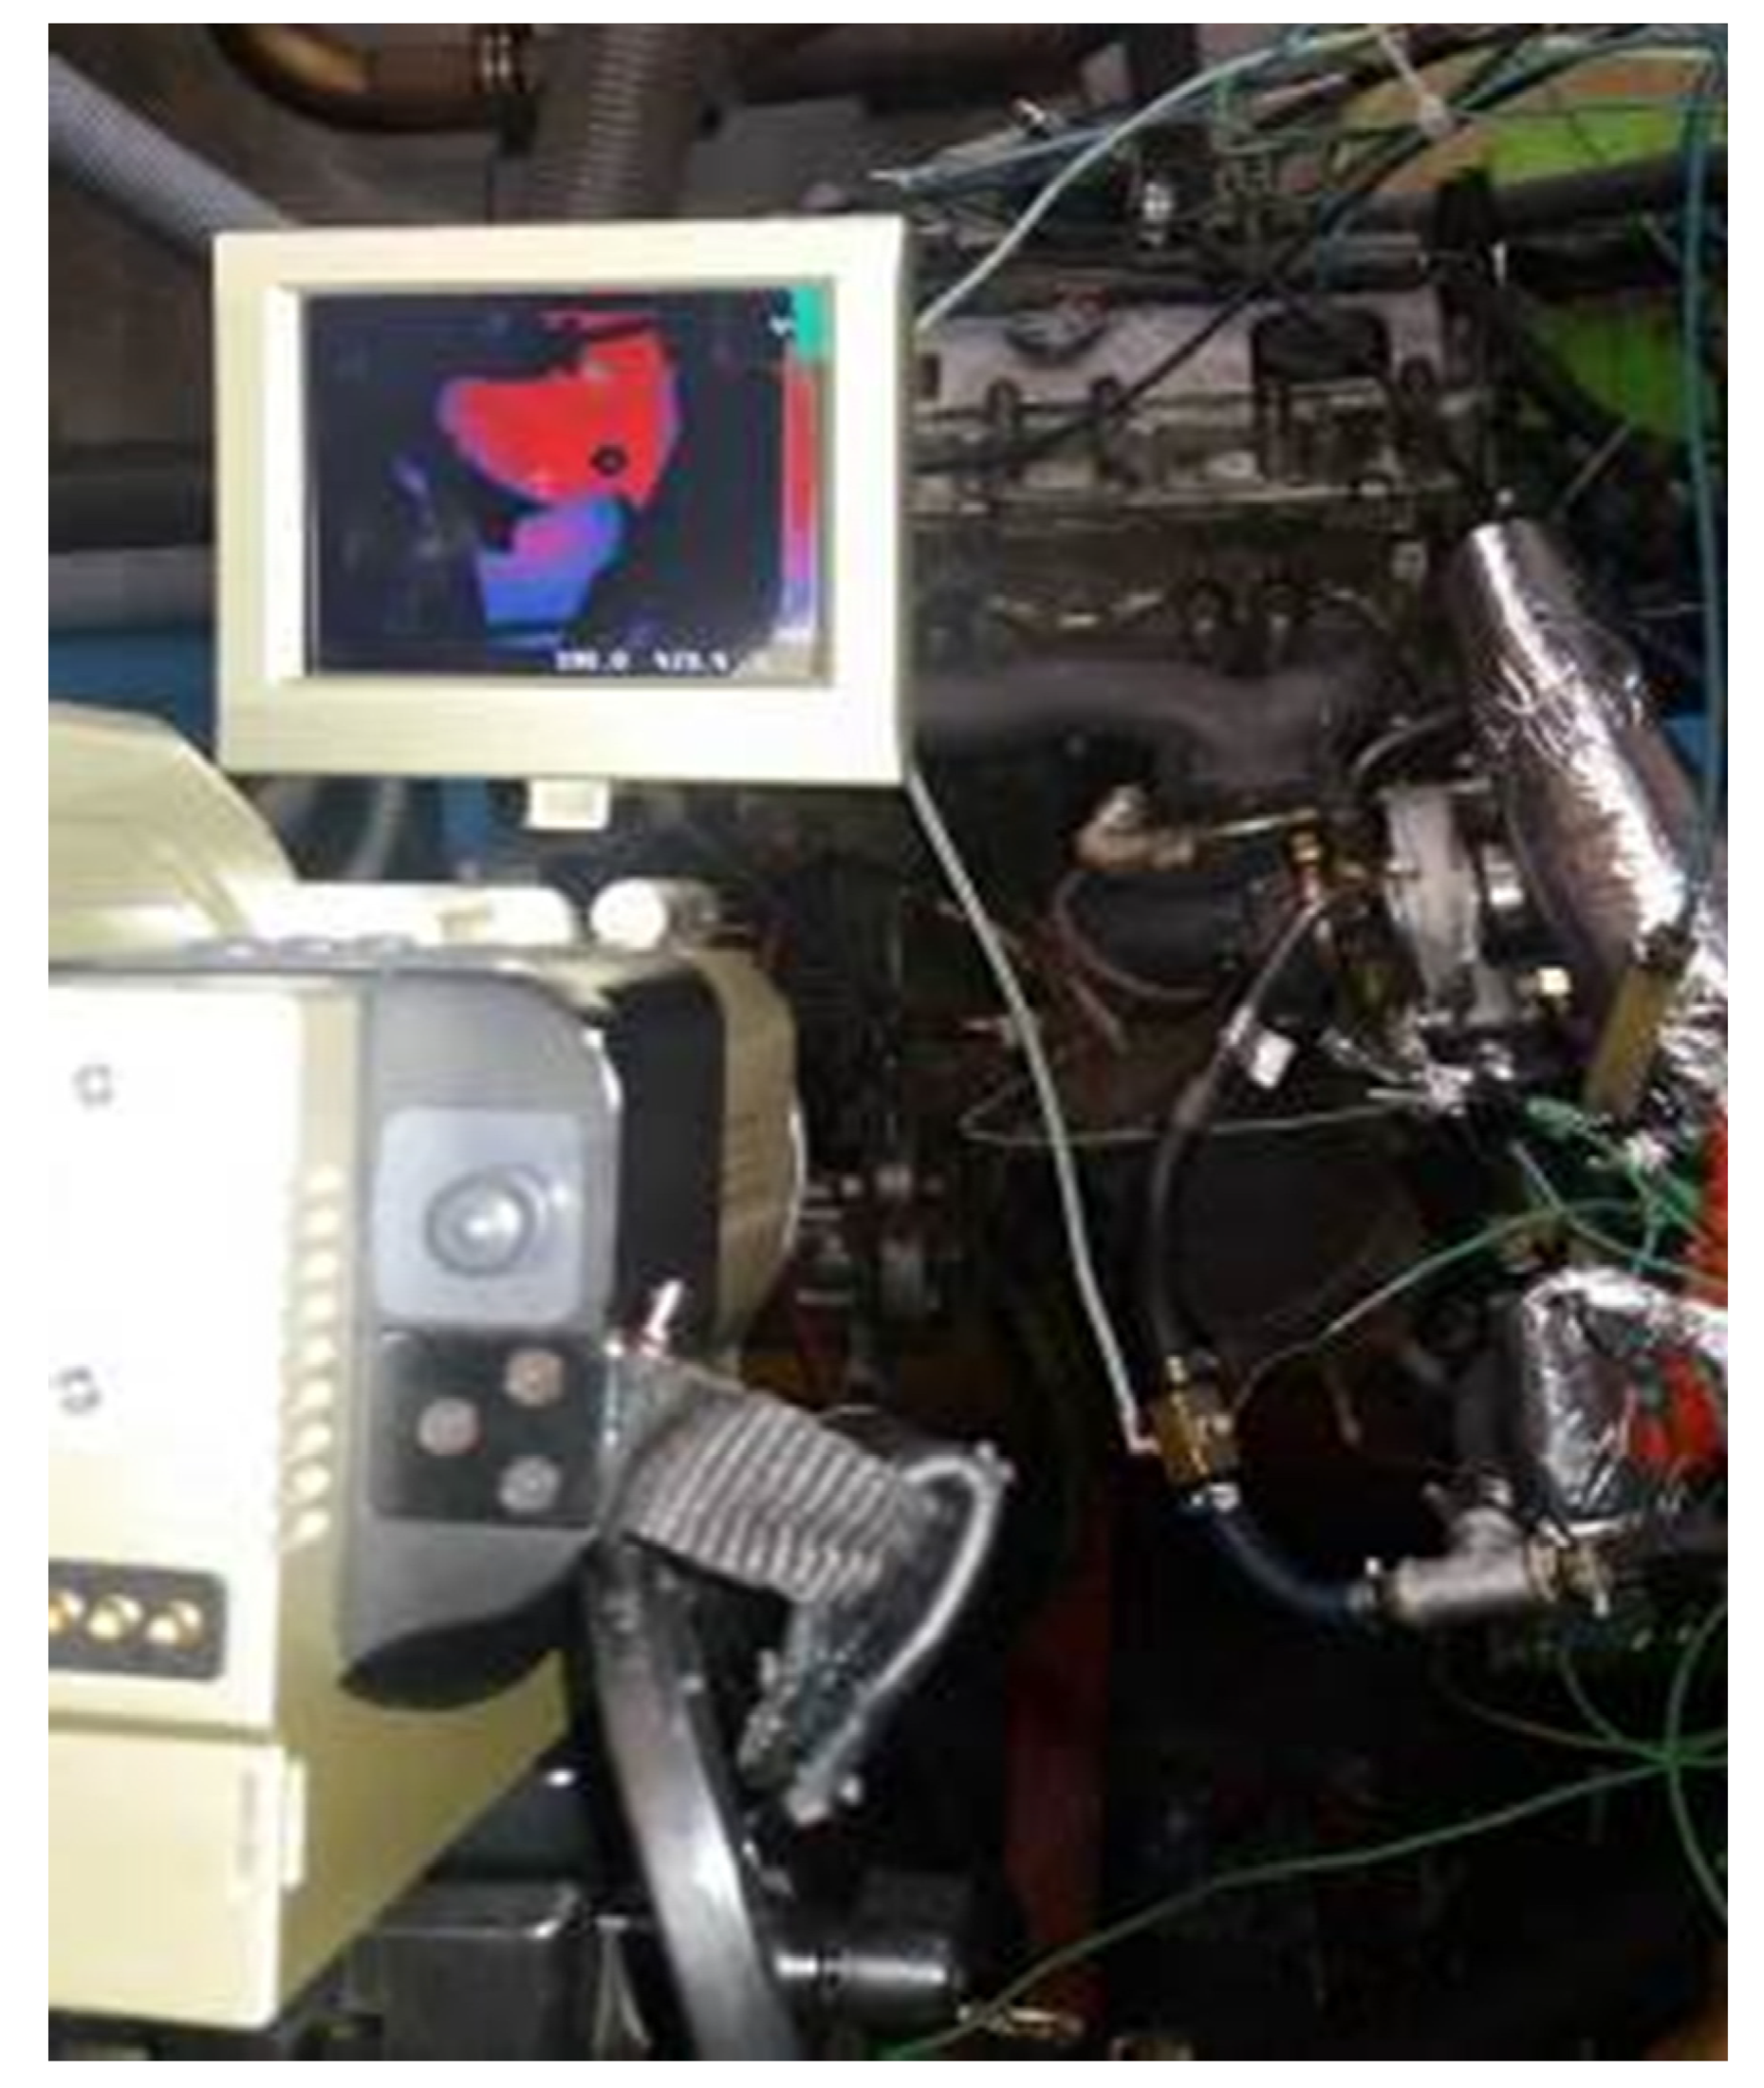
3. Experimental Test
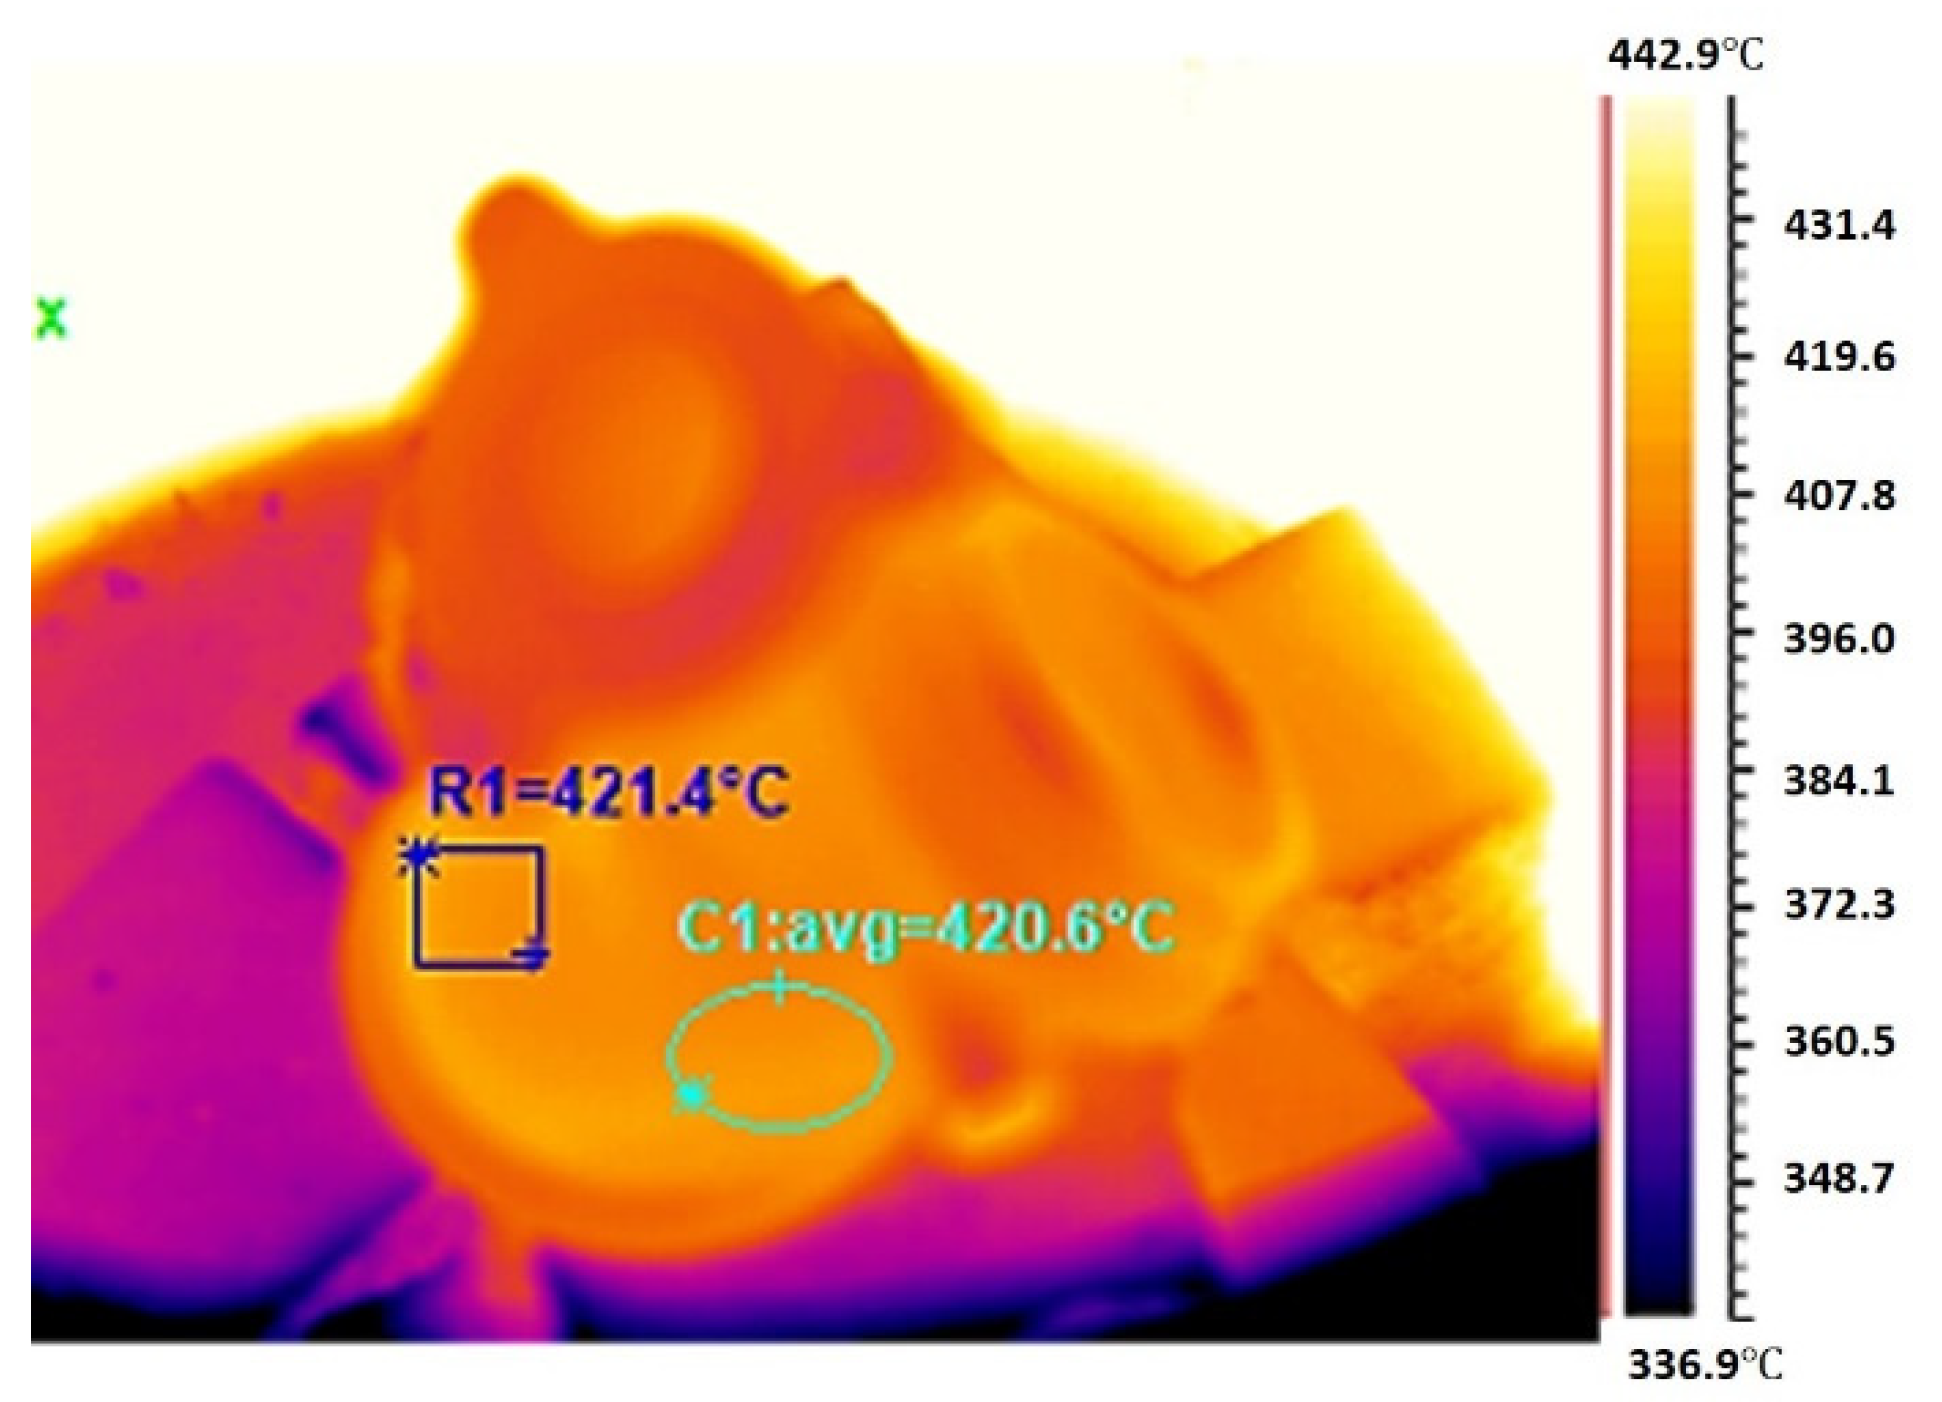
4. Test Results
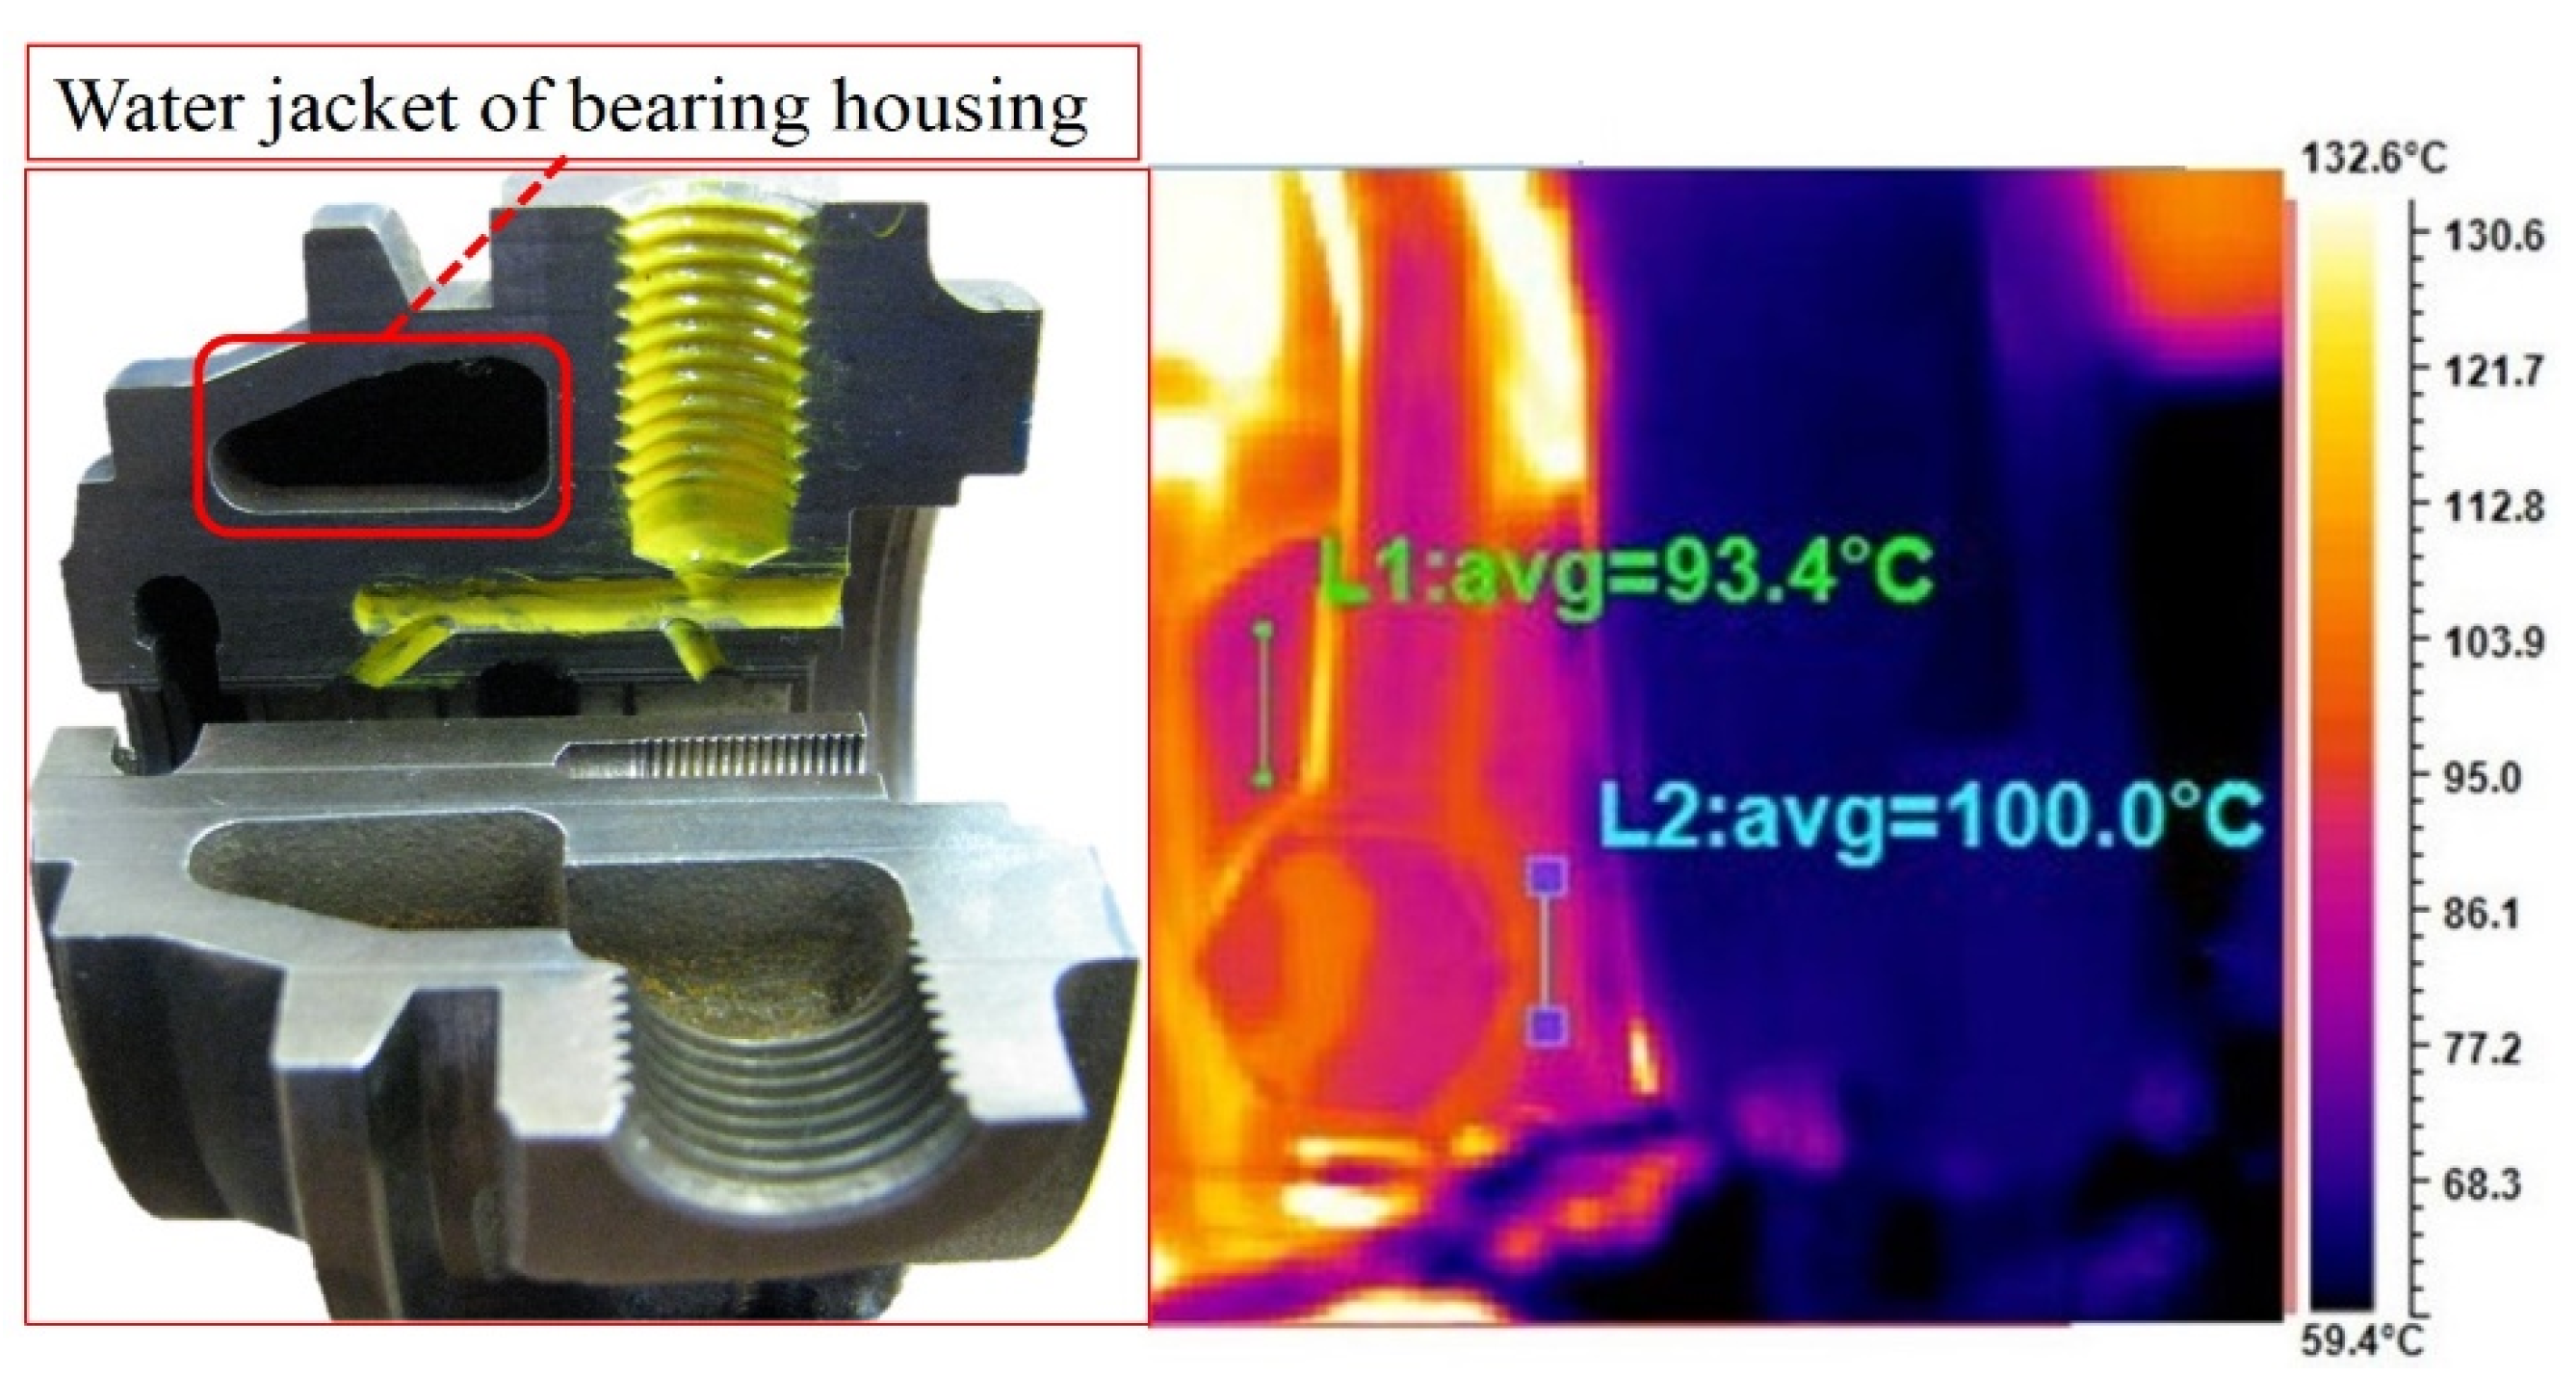
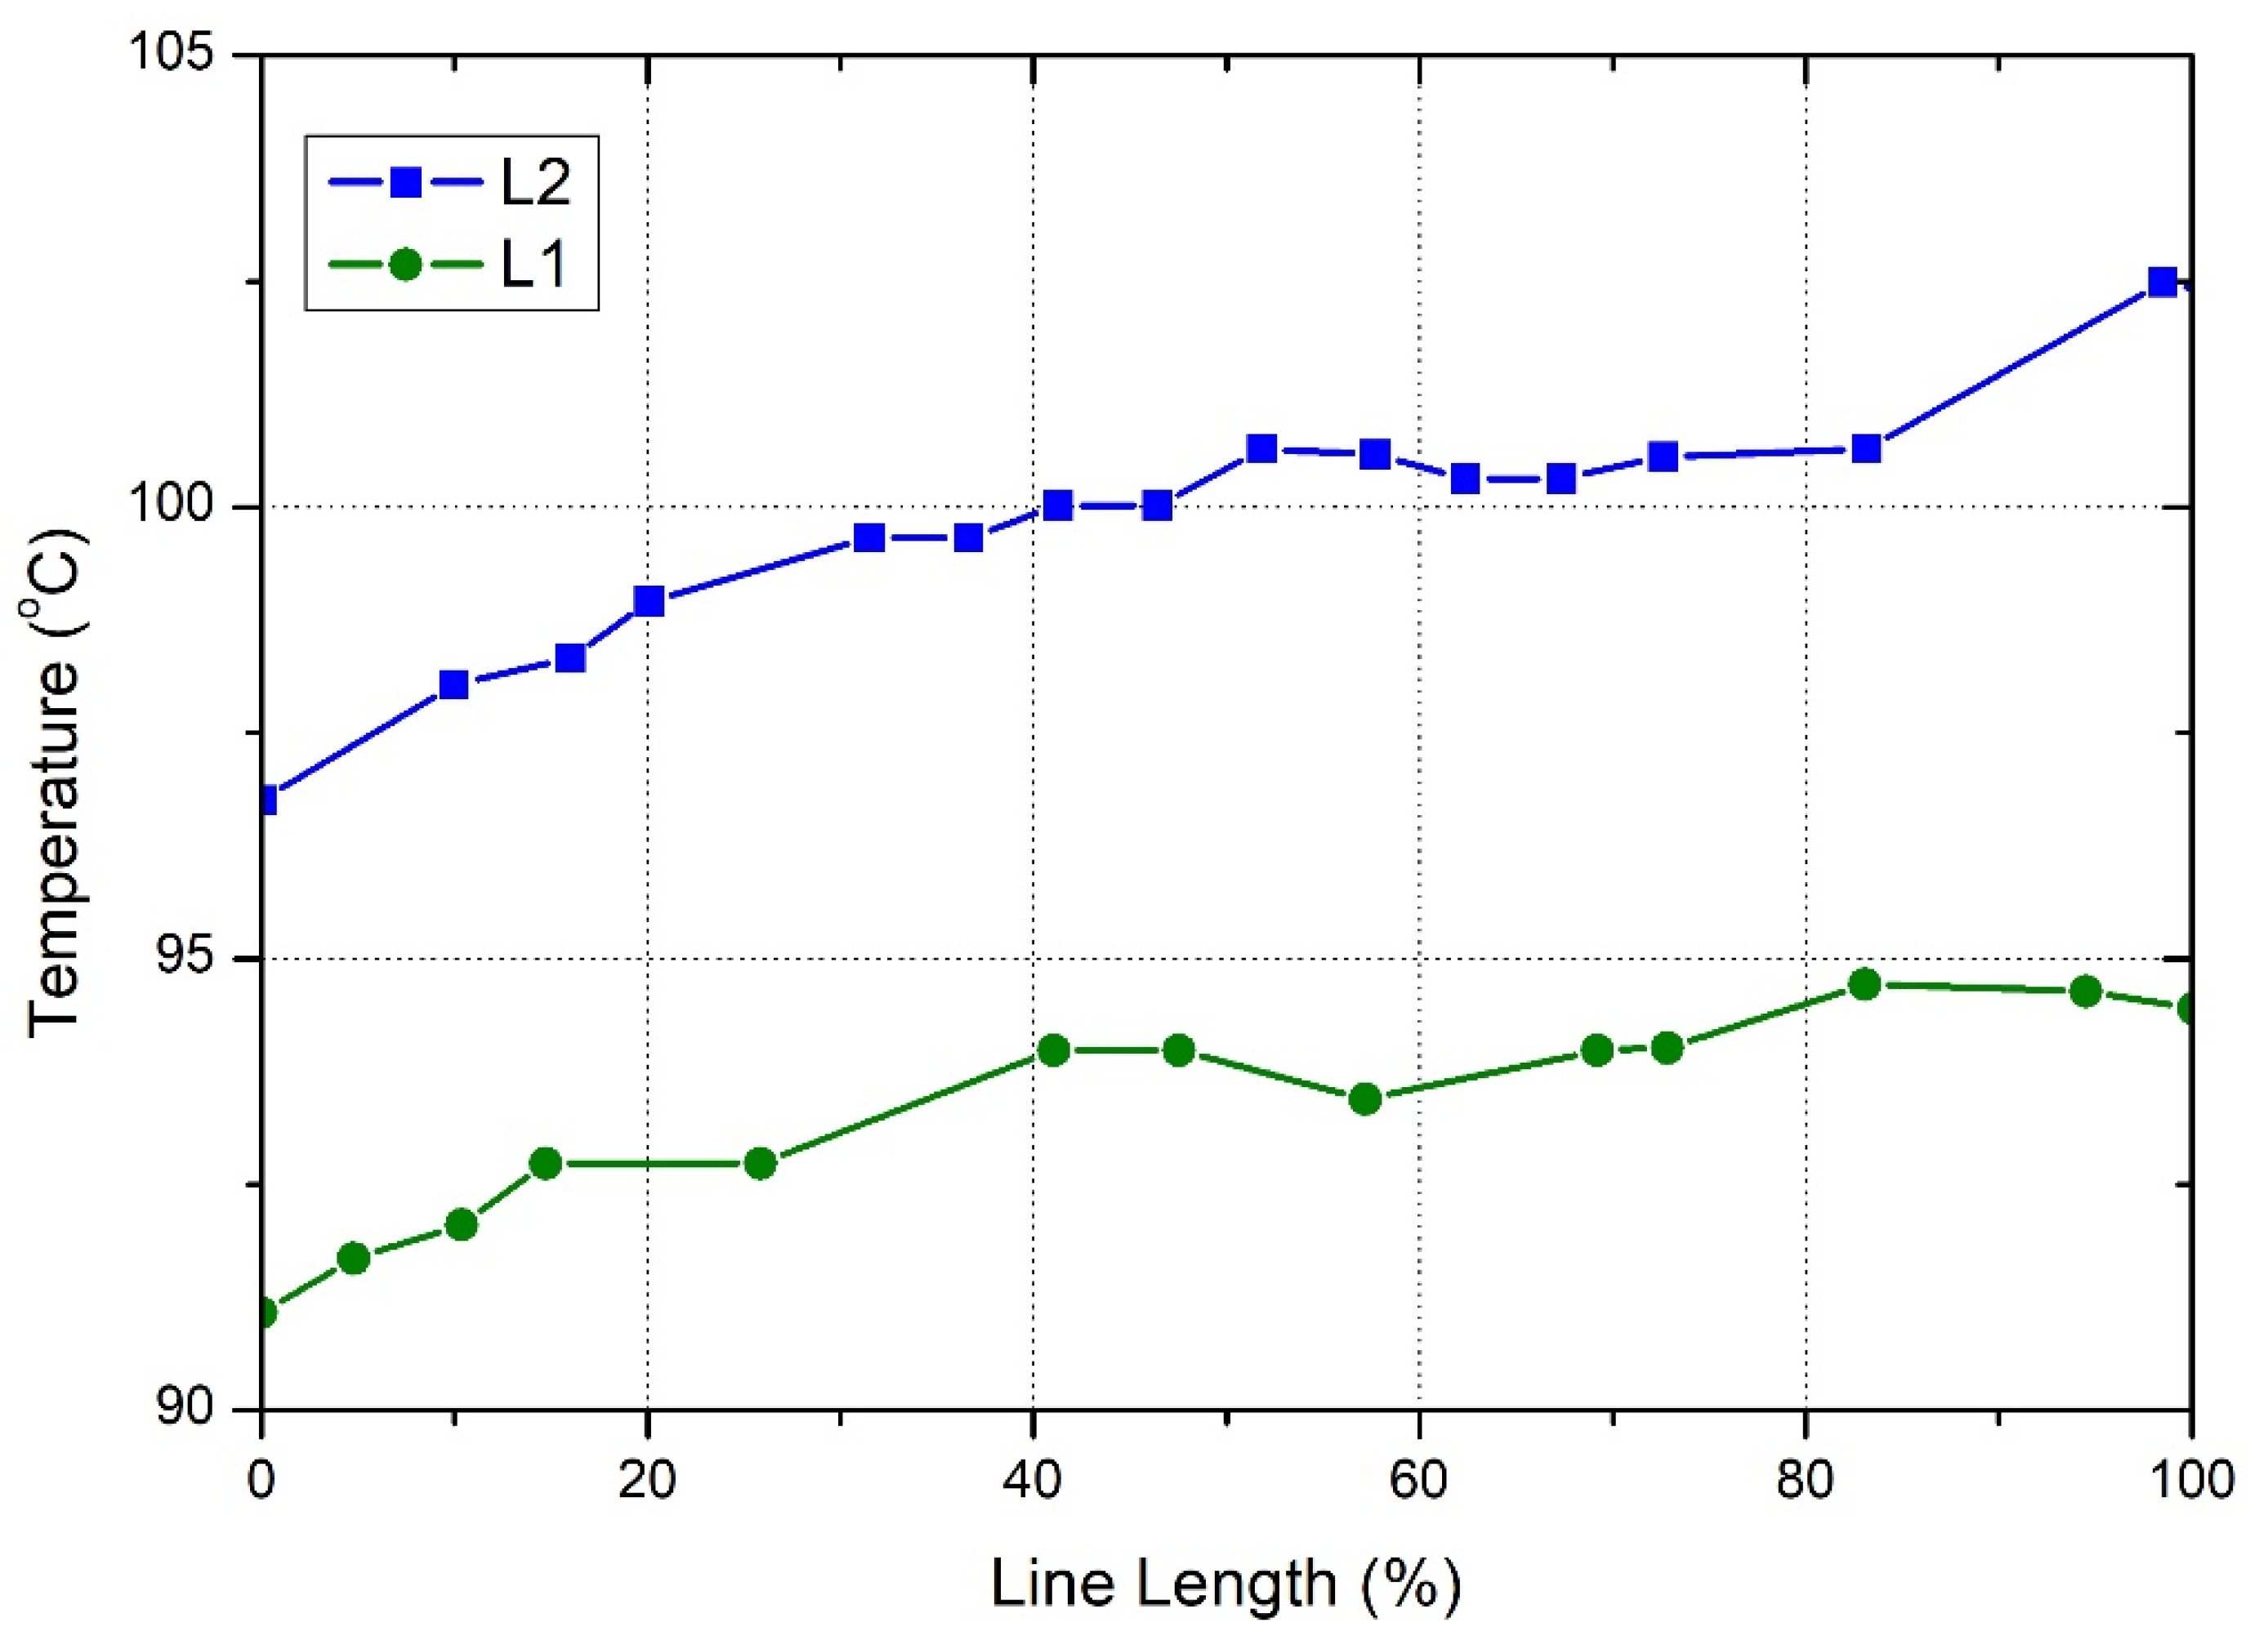
4.1. Bearing Housing Test Results
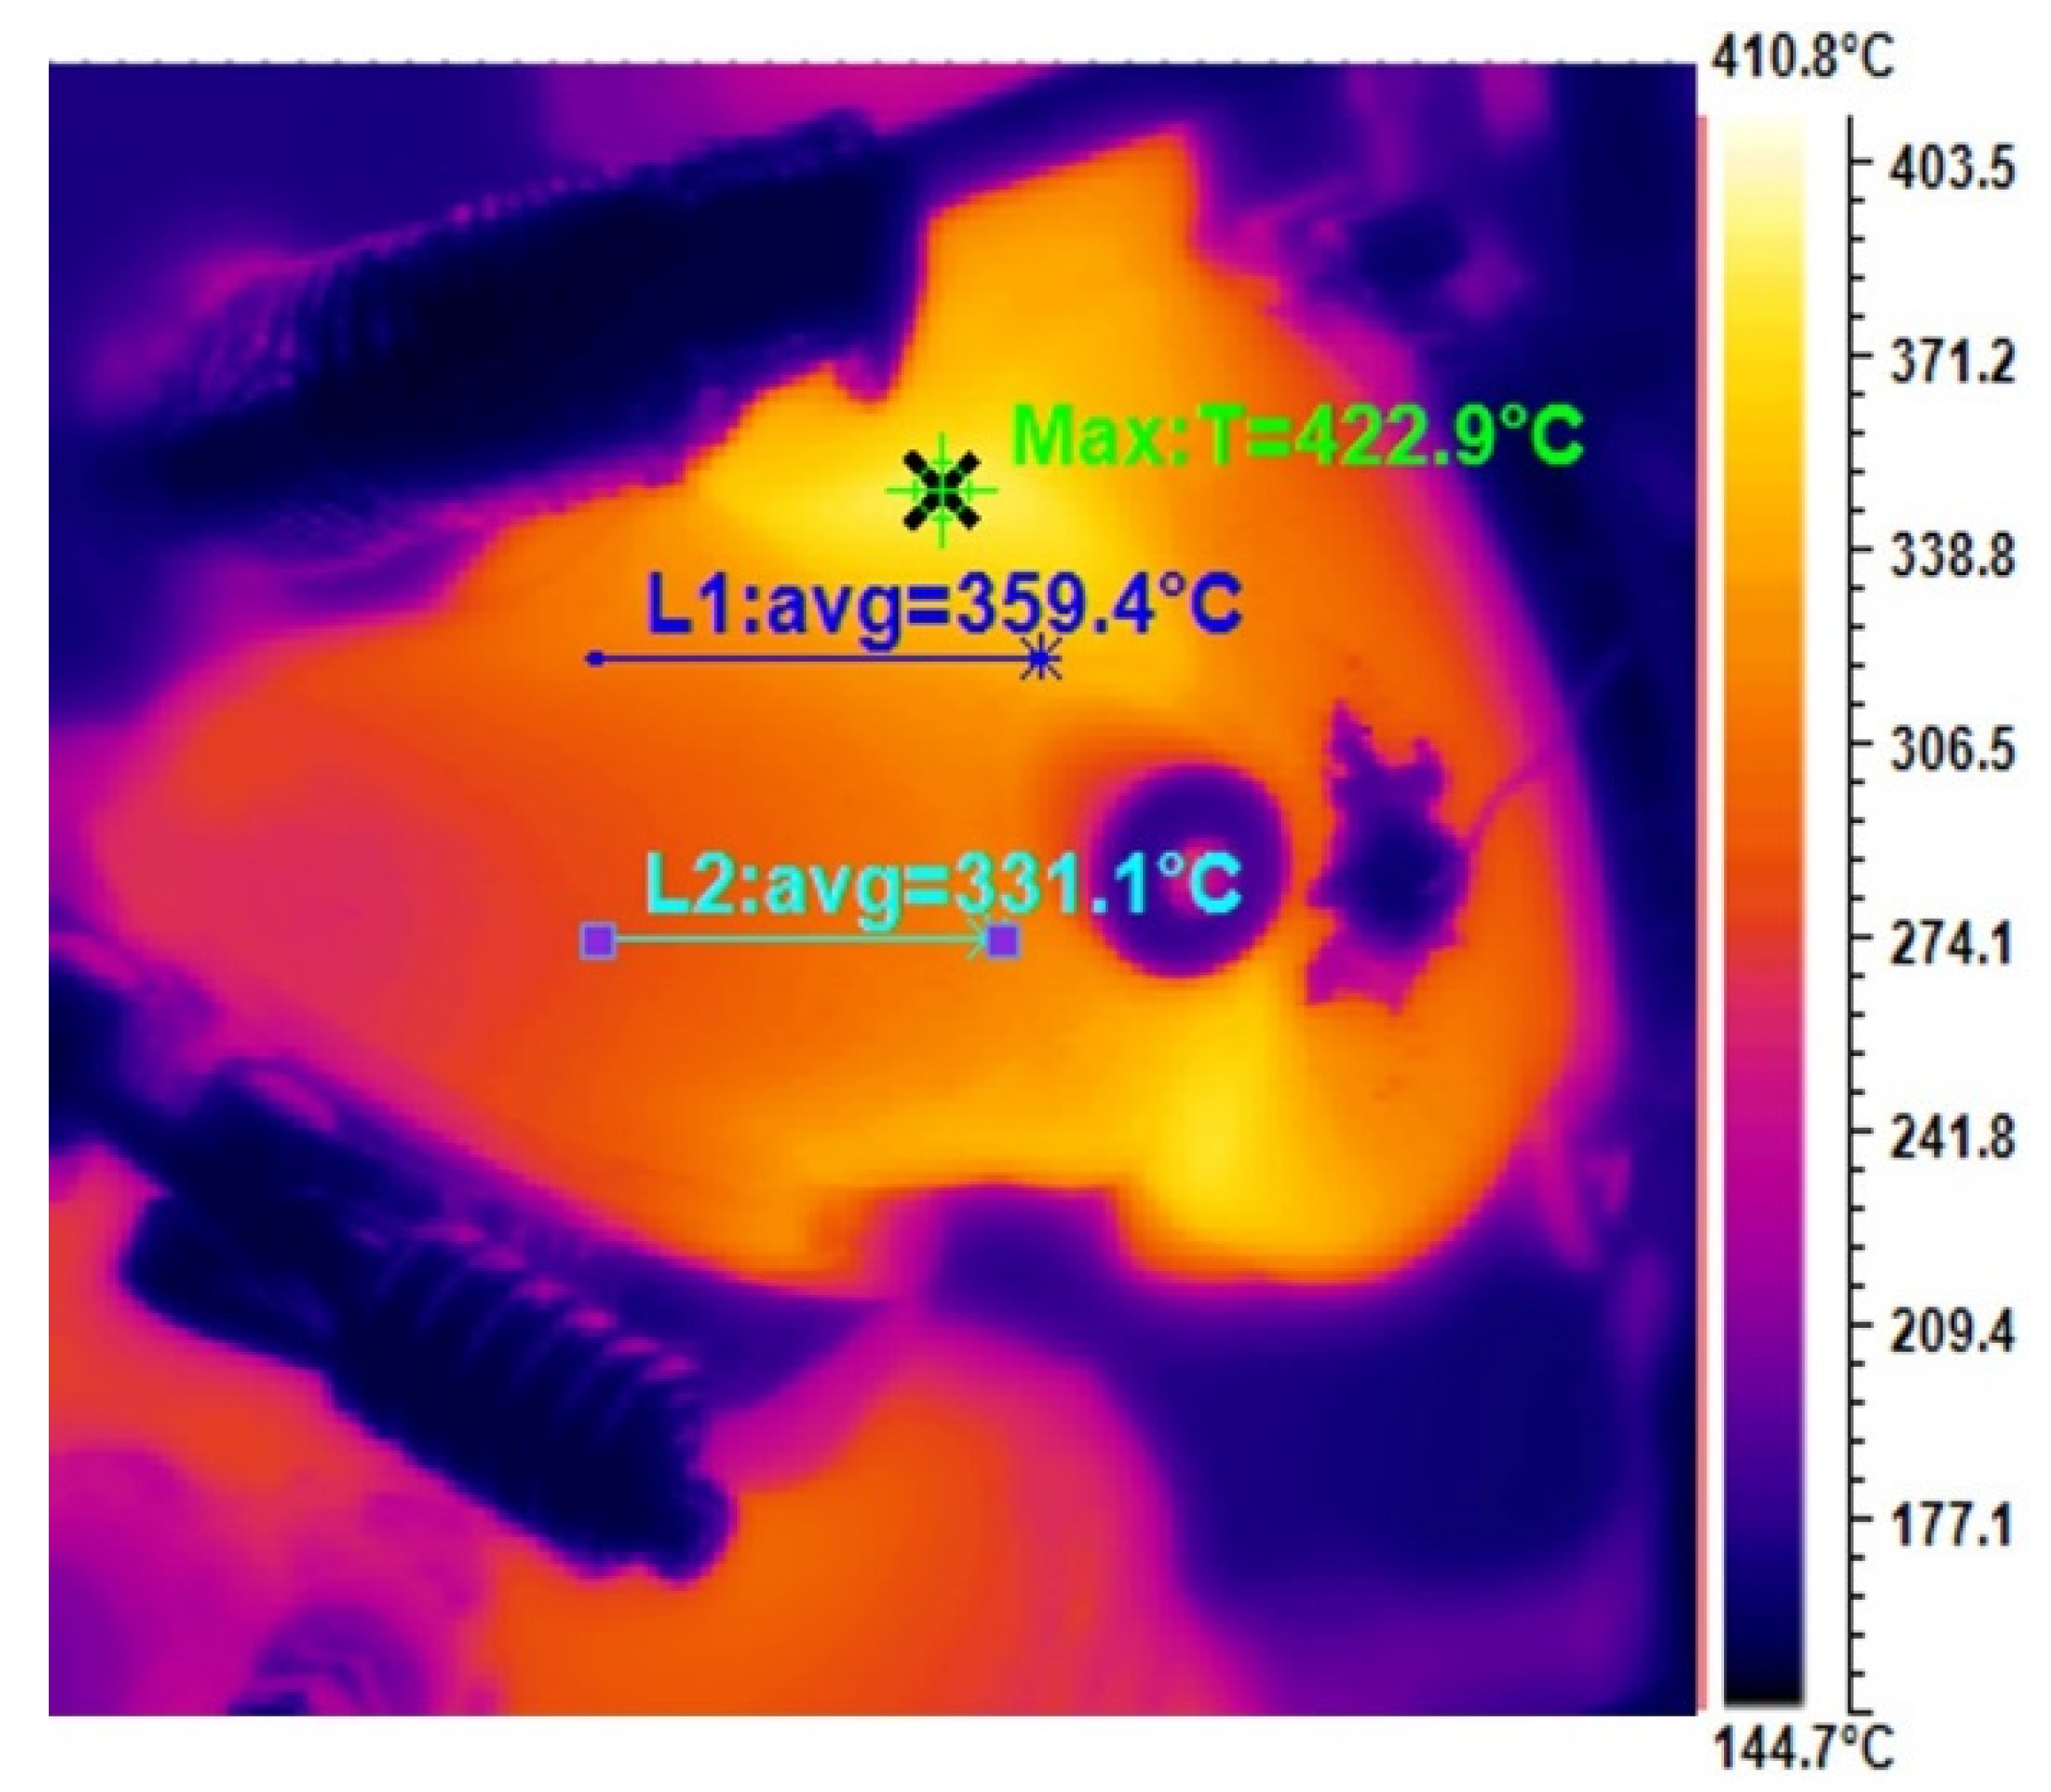
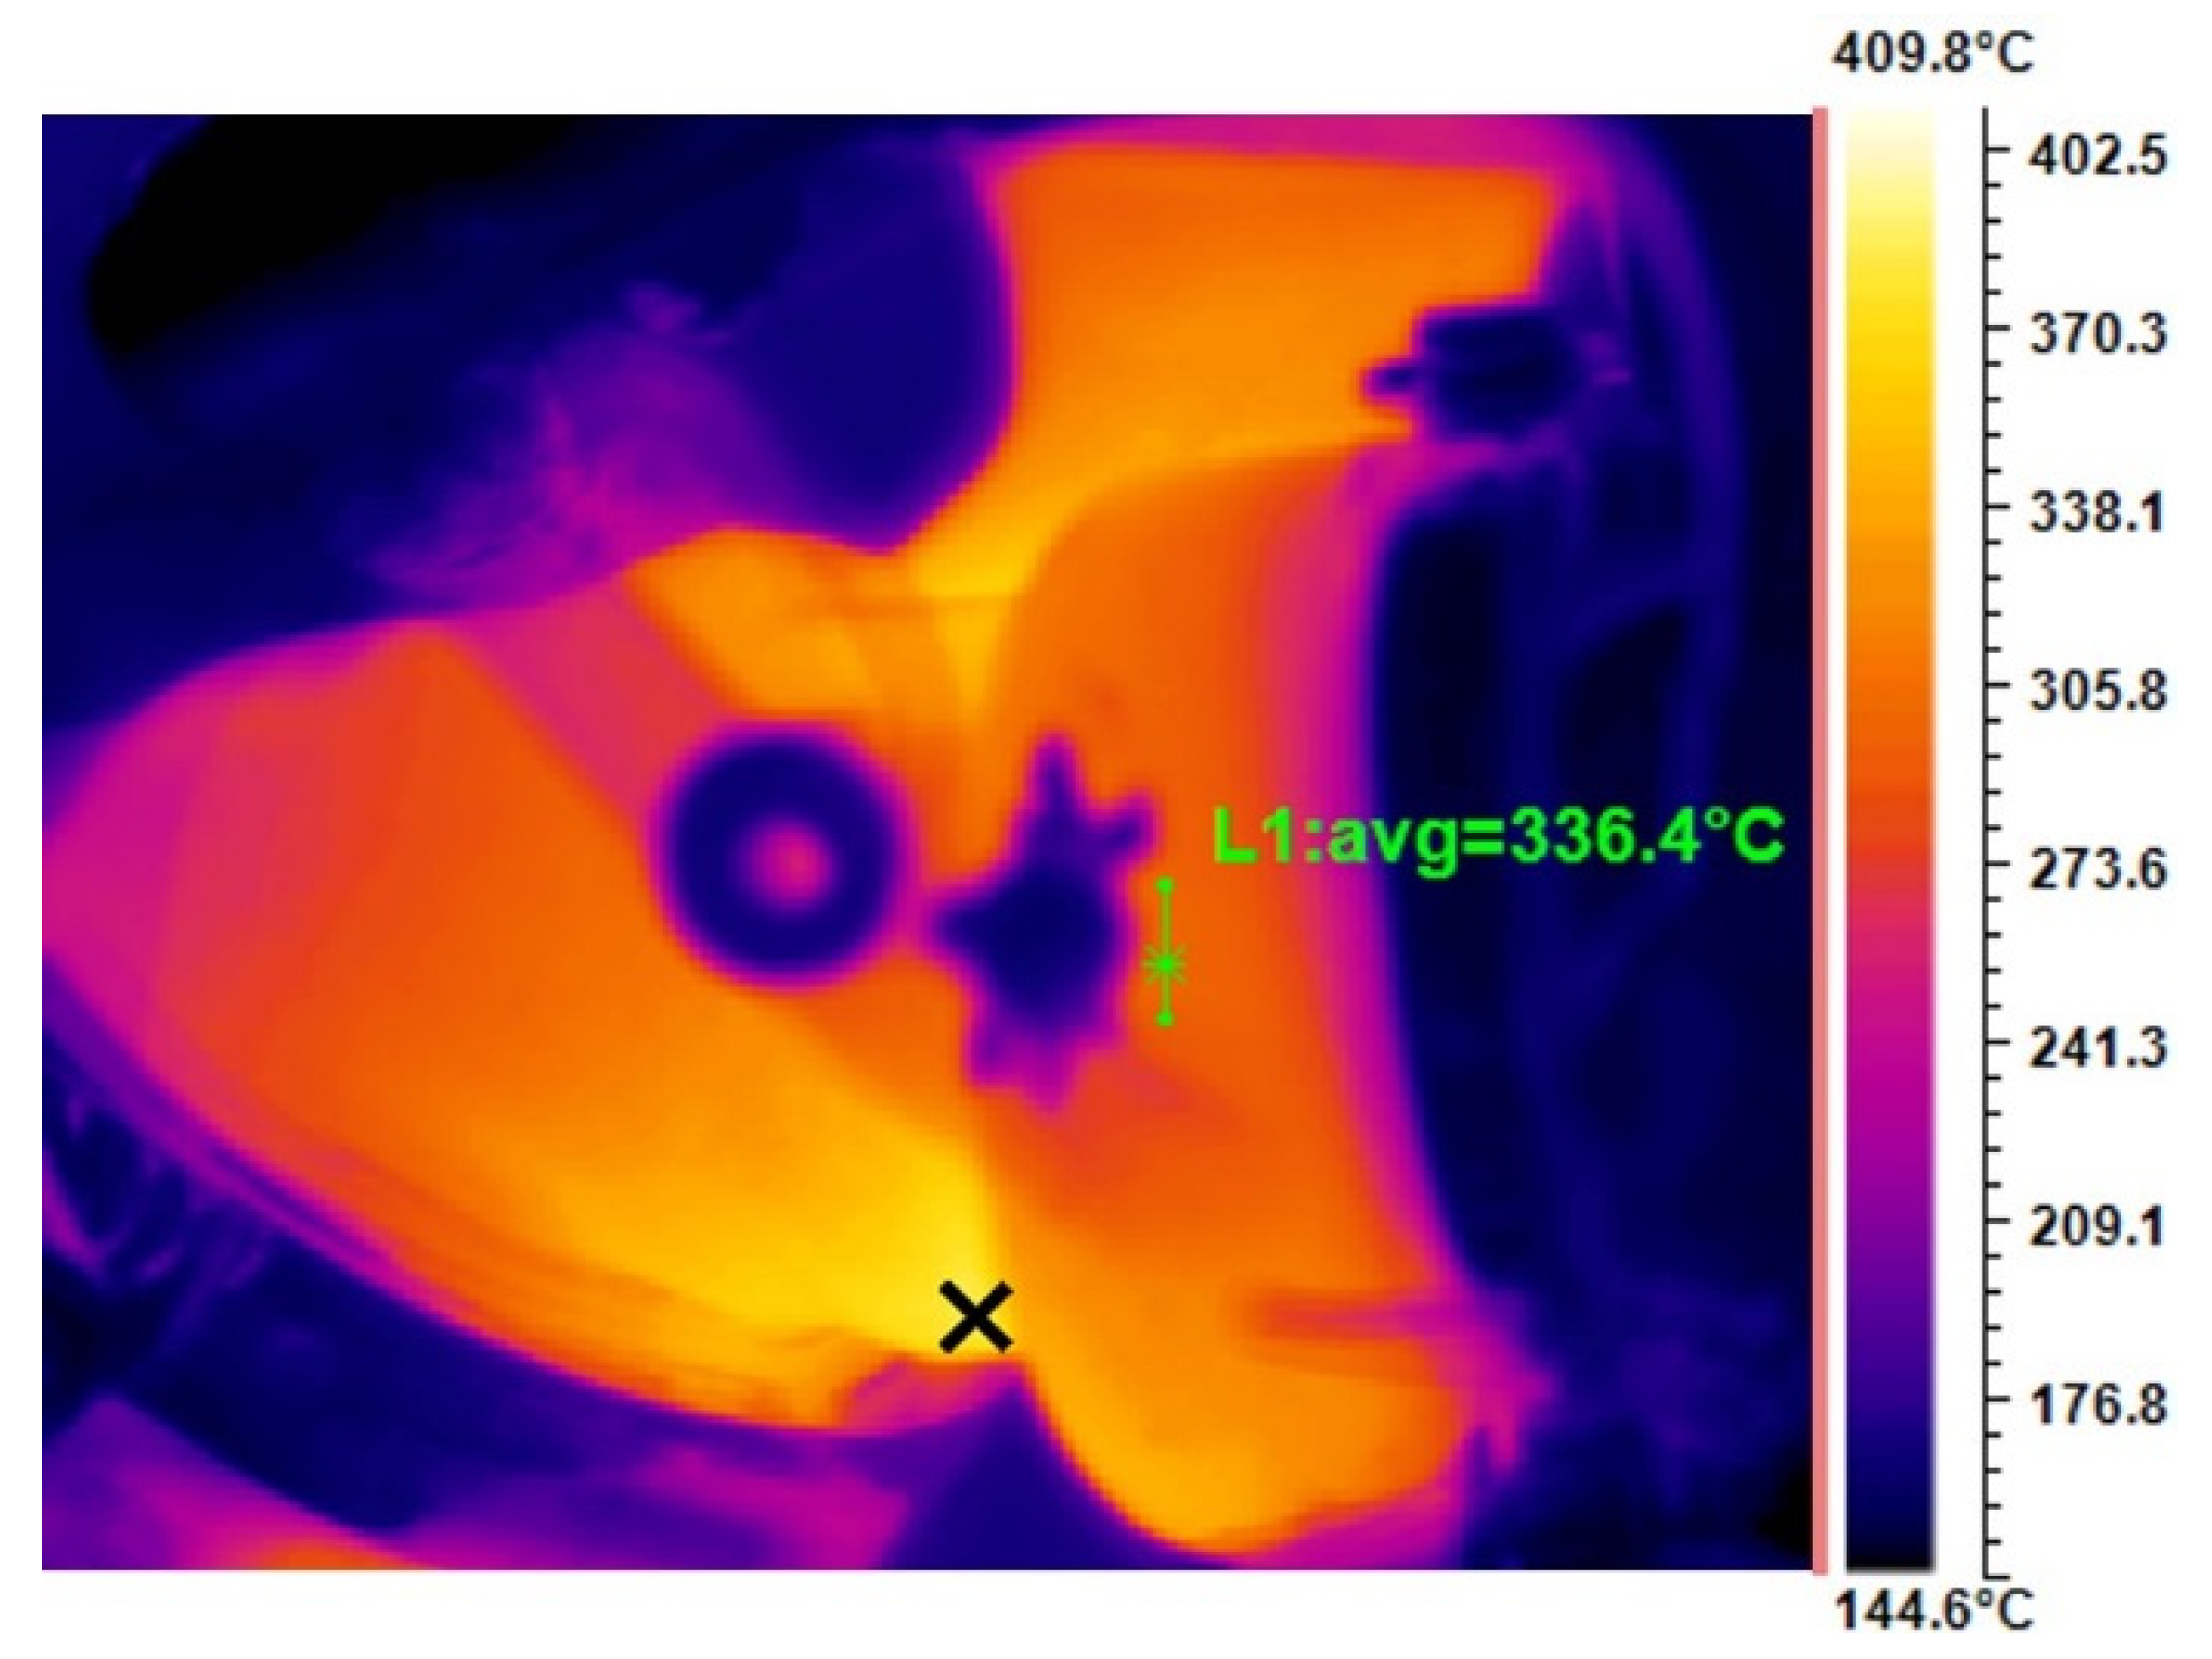
4.2. Test Results for Turbine Housing
4.3. Test Results for Compressor Housing
4.4. Cool-Down Test
4.5. Warm-Up Test
5. Conclusions
Author Contributions
Funding
Data Availability Statement
Conflicts of Interest
References
- Serrano, J.; Arnau, F.; Dolz, V.; Piqueras, P. Methodology for characterisation and simulation of turbocharged diesel engines combustion during transient operation. Part 1: Data acquisition and post-processing. Appl. Therm. Eng. 2009, 29, 142–149. [Google Scholar] [CrossRef]
- Fu, J.; Shu, J.; Zhou, F.; Liu, J.; Xu, Z.; Zeng, D. Experimental investigation on the effects of compression ratio on in-cylinder combustion process and performance improvement of liquefied methane engine. Appl. Therm. Eng. 2017, 113, 1208–1218. [Google Scholar] [CrossRef]
- Liu, J.; Fu, J.; Ren, C.; Wang, L.; Xu, Z.; Deng, B. Comparison and analysis of engine exhaust gas energy recovery potential through various bottom cycles. Appl. Therm. Eng. 2013, 50, 1219–1234. [Google Scholar] [CrossRef]
- Galindo, J.; Tiseira, A.; Navarro, R.; Tarí, D.; Meano, C.M. Effect of the inlet geometry on performance, surge margin and noise emission of an automotive turbocharger compressor. Appl. Therm. Eng. 2017, 110, 875–882. [Google Scholar] [CrossRef]
- Baines, N.C. Fundamentals of Turbocharging; Concepts NREC: White River Junction, VT, USA, 2005; ISBN 0-933283-14-8. [Google Scholar]
- Chen, W.J. Rotordynamics and bearing design of turbochargers. Mech. Syst. Signal Process. 2012, 29, 77–89. [Google Scholar] [CrossRef]
- Nguyen-Schäfer, H. Rotordynamics of Automotive Turbochargers; Springer: Berlin/Heidelberg, Germany, 2015. [Google Scholar]
- Matsumoto, K.; Tojo, M.; Jinnai, Y.; Hayashi, N.; Ibaraki, S. Development of compact and high-performance turbocharger for 1050 °C exhaust gas. Mitsubishi Heavy Ind. Tech. Rev. 2008, 45, 1–5. [Google Scholar]
- Zhao, J.; Ma, C.; Hu, L. Lightening structure optimization on turbine wheel of vehicular turbocharger. Front. Energy Power Eng. China 2008, 2, 422–426. [Google Scholar] [CrossRef]
- Benajes, J.; Galindo, J.; Peña, P.F.; Navarro, R. Development of a segregated compressible flow solver for turbomachinery simulations. J. Appl. Fluid Mech. 2014, 7, 673–682. [Google Scholar]
- Alaviyoun, S.; Ziabasharhagh, M.; Farajpoor, M. Experimental Investigation and Numerical Simulation of Gas Flow Through Wastegated Turbine of Gasoline Turbocharger. J. Appl. Fluid Mech. 2020, 13, 1835–1845. [Google Scholar]
- Bohn, D.; Moritz, N.; Wolff, M. Conjugate flow and heat transfer investigation of a turbocharger: Part II—experimental results, in: ASME Turbo Expo 2003, collocated with the 2003 International Joint Power Generation Conference. Am. Soc. Mech. Eng. 2003, 3, 723–729. [Google Scholar] [CrossRef]
- Baines, N.; Wygant, K.D.; Dris, A. The Analysis of Heat Transfer in Automotive Turbochargers. J. Eng. Gas Turbines Power 2010, 132, 042301. [Google Scholar] [CrossRef]
- Romagnoli, A.; Martinez-Botas, R. Heat transfer analysis in a turbocharger turbine: An experimental and computational evaluation. Appl. Therm. Eng. 2012, 38, 58–77. [Google Scholar] [CrossRef]
- Romagnoli, A.; Manivannan, A.; Rajoo, S.; Chiong, M.; Feneley, A.; Pesiridis, A.; Martinez-Botas, R. A review of heat transfer in turbochargers. Renew. Sustain. Energy Rev. 2017, 79, 1442–1460. [Google Scholar] [CrossRef]
- Aghaali, H.; Ångström, H.-E. Turbocharged SI-engine simulation with cold and hot-measured turbocharger performance maps. In Proceedings of the ASME Turbo Expo 2012: Turbine Technical Conference and Exposition, Copenhagen, Denmark, 11–15 June 2012; pp. 671–679. [Google Scholar]
- Aghaali, H.; Ångström, H.-E. A review of turbo compounding as a waste heat recovery system for internal combustion engines. Renew. Sustain. Energy Rev. 2015, 49, 813–824. [Google Scholar] [CrossRef]
- Jiaqiang, E.; Zhang, Z.; Tu, Z.; Zuo, W.; Hu, W.; Han, D.; Jin, Y. Effect analysis on flow and boiling heat transfer performance of cooling water-jacket of bearing in the gasoline engine turbocharger. Appl. Therm. Eng. 2018, 130, 754–766. [Google Scholar] [CrossRef]
- Burke, R.D. Analysis and Modeling of the Transient Thermal Behavior of Automotive Turbochargers. J. Eng. Gas Turbines Power 2014, 136, 101511. [Google Scholar] [CrossRef]
- Payri, F.; Olmeda, P.; Arnau, F.J.; Dombrovsky, A.; Smith, L. External heat losses in small turbochargers: Model and experiments. Energy 2014, 71, 534–546. [Google Scholar] [CrossRef]
- Tadesse, H.; Rakut, C.; Diefenthal, M.; Wirsum, M.; Heuer, T. Experimental Investigation of Steady State and Transient Heat Transfer in a Radial Turbine Wheel of a Turbocharger. In Turbo Expo: Power for Land, Sea, and Air; American Society of Mechanical Engineers: New York, NY, USA, 2015; Volume 56796, p. V008T23A015. [Google Scholar] [CrossRef]
- Basir, H.; Gharehghani, A.; Ahmadi, A.; Mirsalim, S.M.A.; Rosen, M.A. Experimental and numerical investigation on the heat transfer of an automotive engine’s turbocharger. Proc. Inst. Mech. Eng. Part D J. Automob. Eng. 2021, 235, 2124–2135. [Google Scholar] [CrossRef]


| Characteristic | Value |
|---|---|
| Internal diameter of furnace (cm) | 35 |
| Height (cm) | 50 |
| Maximum power (kW) | 14 |
| Accuracy of temperature (°C) | ±3 |
| Maximum operating temperature (°C) | 1200 |
| Parameter | Volume |
|---|---|
| Temperature range | −20 to 1450 °C |
| Accuracy | ±2 °C or ±2% |
| Filter ranges | Range 1 (−20 to 120 °C) Range 2 (0 to 500 °C) Range 3 (500 to 1500 °C) |
| Emissivity correction | Flexible 0.01 to 0.99 by 0.01 increments |
| Parameter | Volume |
|---|---|
| No. of cylinders | 4 |
| Fuel type | Gasoline |
| Displacement (cc) | 1700 |
| Maximum power (kW) | 110 (at 5500 rpm) |
| Maximum torque (Nm) | 215 (at 2200–4800 rpm) |
| Maximum speed of the turbocharger | 220,000 rpm |
| Compressor wheel diameter (mm) | 51 |
| Turbine wheel diameter (mm) | 43 |
| Turbocharger wastegate actuator | Pneumatic (pressurized) |
| Maximum temperature of turbine inlet gas (°C) | 950 |
| Material of turbine housing | GGG-NiSiCr 3552 |
| Material of bearing housing | Cast iron (HT250) |
| Material of compressor housing | Aluminum alloy (ZL101) |
| Engine Speed (rpm) | Bearing Housing Temp. (Near Compressor, T5) (°C) | Bearing Housing Temp. (T4) (°C) | Bearing Housing Temp. (Near a Turbine, T3) (°C) |
|---|---|---|---|
| 5500 | 122 | 124 | 155 |
| Engine Speed (rpm) | Compressor Housing Temperatures (°C) | ||
|---|---|---|---|
| T6 | T7 | T8 | |
| 5000 | 124.6 | 133.5 | 136 |
Publisher’s Note: MDPI stays neutral with regard to jurisdictional claims in published maps and institutional affiliations. |
© 2022 by the authors. Licensee MDPI, Basel, Switzerland. This article is an open access article distributed under the terms and conditions of the Creative Commons Attribution (CC BY) license (https://creativecommons.org/licenses/by/4.0/).
Share and Cite
Savaripour, H.; Alaviyoun, S.; Rosen, M.A. Thermal Investigation of a Turbocharger Using IR Thermography. Clean Technol. 2022, 4, 329-344. https://doi.org/10.3390/cleantechnol4020019
Savaripour H, Alaviyoun S, Rosen MA. Thermal Investigation of a Turbocharger Using IR Thermography. Clean Technologies. 2022; 4(2):329-344. https://doi.org/10.3390/cleantechnol4020019
Chicago/Turabian StyleSavaripour, Hamed, Shahab Alaviyoun, and Marc A. Rosen. 2022. "Thermal Investigation of a Turbocharger Using IR Thermography" Clean Technologies 4, no. 2: 329-344. https://doi.org/10.3390/cleantechnol4020019
APA StyleSavaripour, H., Alaviyoun, S., & Rosen, M. A. (2022). Thermal Investigation of a Turbocharger Using IR Thermography. Clean Technologies, 4(2), 329-344. https://doi.org/10.3390/cleantechnol4020019