1. Introduction
The amount of gas distributed by Distribution System Operators (DSOs) in Hungary is steadily decreasing. It is a high priority task for the DSOs to halt this trend [
1]. Another challenging task for the distribution network is to compensate for the effects of certain types of points of delivery (PODs), including producer, consumer and storage PODs, and the maintenance of energy balance.
Today, the importance of a sustainable, evenly balanced energy supply is increasing. To find the balance between autonomous operation, the utilization of renewable energy sources, and quality and cost-effective service require competences that give a considerable competitive advantage for DSOs [
2]. To exploit this competitive edge, it must be a high priority task to create and develop models that can operate profitably in practice.
The complexity of this task is indicated by the fact that several expectations must be taken into consideration at the same time. In the optimal solution, these expectations are met to the maximum level possible. In the present research project, which was funded and implemented by a local Hungarian DSO, the following perspectives were taken into consideration when compiling the conceptions and the feasibility study for a future living lab, i.e., the pilot site discussed in this paper:
inclusion of the consumption habits of prosumers [
3] (partially or fully automated consumer/producer/storage customers) into the strategic network planning process;
optimal utilization of synergy possibilities within the company, concerning gas and electricity possibilities and customer needs;
integration of innovative technology to keep the balance of the network energy;
optimal network operation service, with the least possible customer disturbance.
The aim of our research project was to prepare a feasibility study for a model system, which allows the following:
- ▪
Taking the emergence of prosumers into account, the analysis of the distribution network behavior of the producer/storer/consumer.
- ▪
Search for possible energetic developments and energy storage alternatives, the analysis of synergy possibilities.
- ▪
Prevision of the sustainability of power and gas networks [
4], creation of POD-level control methods (EFIR—energy supervision and control system) in the intersection of supply safety and economic optimum.
The objective of all the above steps is to develop a complex [
5], cost-effective, multifunctional energetic solution that can be customized to local needs, using innovative solutions.
During our research, the energetic design, return calculation and control concept for a hybrid energetic system (hydrogen, photovoltaic, electric vehicle (EV) charger, H2 filling station) were completed for a real-life pilot site, to create a sustainable energy community. The present article describes the pilot site and the elements of the hybrid energetic system. The possibility of the joint operation of the various technologies is discussed, and the results of the sizing and designing work are presented. The article is concluded by the summary of experiences, and the possible future research directions are set.
2. The Present System at the Pilot Site
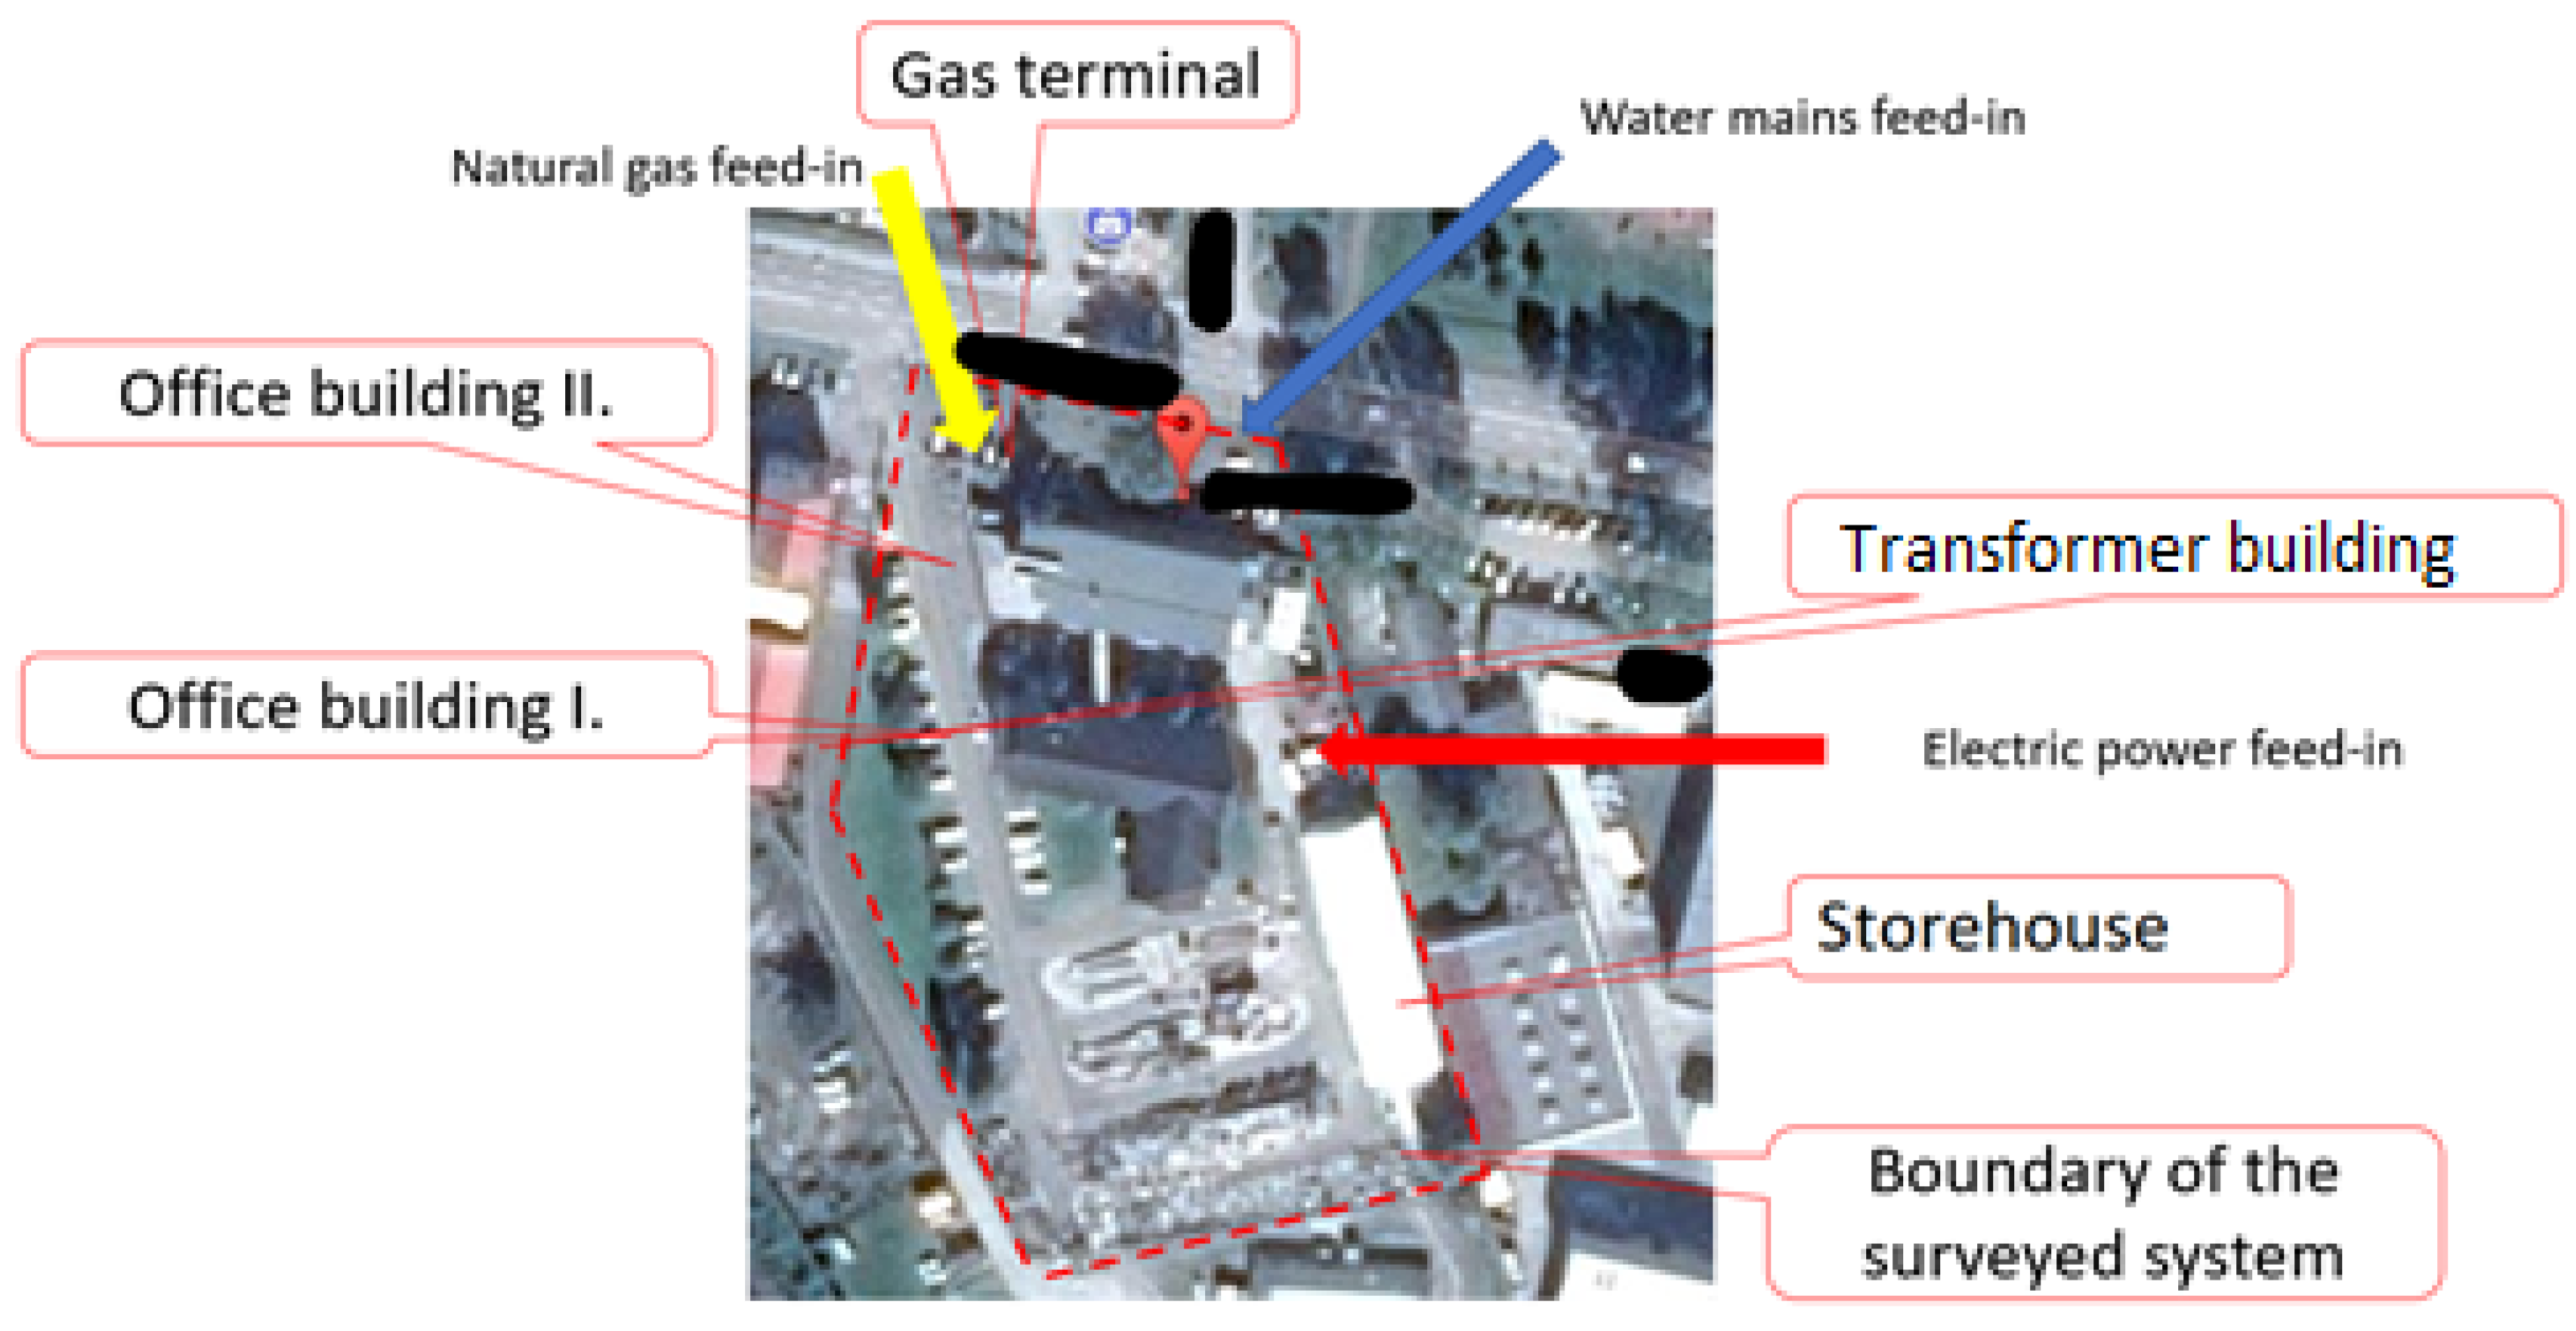
Figure 1 shows the pilot site and the boundaries of the surveyed system. The energy balance for the material and energy amounts crossing this boundary was analyzed.
The new system to be set up was expected to match the present system. The energy demands of the site should be satisfied by the new system. That is, the demands for gas, heat and electricity should be satisfied, and water should be available to produce of hydrogen from water splitting.
2.1. Natural Gas Consumption
The pilot site was served by an NA200 natural gas pipe coming from the town. The mean pressure of the arriving gas was ~3.4 bar, which was reduced to ~1 bar by a reductor in a Fiorentini pressure regulator box at the gas terminal. The gas arrived at this pressure to the submeter of the pilot site. From here, the local pipeline served the gas furnaces of the site. The main meter was an Actaris G-100 Fluxi 2080/TZ turbine gas meter with a transmitter. Within the test site, there was 1 accounting meter, and 2 submeters were installed.
The estimation of the yearly basic value of gas consumption was of primary importance, so that the accuracy of the estimation of the possible savings achievable by various energy efficiency measures and the economic evaluation of such measures could be the highest.
As for heating, the following values need to be determined accurately: (i) heat demand (the heating power demand mapped to the outer temperature Tkm, which serves as the basis for sizing); (ii) expected basic value of the heat and fuel demand that depends on long-term meteorological statistical data. Heat demand is crucially important for the determination of the heat source performance (of the furnace or the consumer’s heating plant), and for the fuel or heat performance to be secured. It is often the case that the amount of fuel or heat performance option secured is seriously overestimated. This means, the real peak performance demand is considerably lower than the designed heat demand, and the reduction of peak performance demand may be the first step towards the reduction of energy costs. Designers rarely give the expected heat and fuel consumption for a site, which is necessary for the estimation of the changing part of the energy costs. However, it could serve as a basis for calculating the expected savings and after implementation, the real savings of the proposed energy-efficiency measures.
It was difficult to determine the basic value for the pilot site based on the available data. The site uses gas for both heating and the production of domestic hot water (DHW). More exact data would be required to see what amount of gas is used for heating and DHW production, respectively. The comparison of yearly consumptions is not sufficient either, as there are considerable differences in the values from year to year.
Finally, the basic value was determined in cooperation with the owner and the operator of the test site.
2.2. Use of Electric Energy
Data were available broken down to months for electricity consumption for the pilot site, for the years 2018–2019–2020 (
Table 1). However, it seemed the data given for 2018 were faulty: they were too low and the figures in the data series were exactly the same as in the data series given for water consumption in 2018. Therefore, the data for electricity consumption for 2018 were regarded as an administrative mistake and were not taken into consideration in the calculation of the basic value.
Data were not provided for November and December 2020; therefore, the average of the other months of the same year was assigned to these 2 months. The average energy consumption of the examined years was 179,000 kWh/year, 15,587 kWh/month and 520 kWh/day. If it is supposed that work was done in the site for 12 h a day, the average electric energy demand of the site was 43 kW.
As the data series showed, consumption was higher in winter than in summer. The main reason for this probably is that the storehouse had an electric heating system. It is also noticeable that the consumption in summer was higher than in spring, probably owing to the operation of the chiller.
Comfort cooling of the buildings was achieved by 49 kW compact RHOOS chillers. One of these was mounted to the base of the building, while the other one was on the top, in the case of both office buildings. Cooling convectors attached to the four-pipe chiller system cooled the rooms.
Based on the monthly electricity consumption data, it was supposed that the electric energy consumed for cooling in the hottest month was 3000 kWh/month. The basic value for the electricity consumption of the chillers was 10,000 kWh/year.
Although water consumption data were analyzed in detail in our comprehensive study, in this article this analysis is not presented, as the data had negligible significance with respect to the hydrogen technology.
3. Inclusion of the Renewable-Based Energy Production and Storage into the System
It was supposed that energy production based on renewable sources should be achieved by a photovoltaic (PV) system. The presently used system’s performance was 49 kWp; the energy produced was fully consumed in the pilot site. If the capacity of the PV system was increased, feeding into the electric grid became possible as well. In both cases, however, there were three possible uses of the electric energy produced by the PV cells.
In the first scenario, the electric energy produced was directly consumed by the regular consumers within the pilot site, i.e., the energy was not stored, and the load was not shifted.
In the second scenario, the electric energy produced in the pilot site was partially or fully stored in batteries and was used in the site if necessary.
In the third scenario, electric energy produced by the PV cells was designated to produce hydrogen, which was stored in H2 stores. This could be transformed into electric energy by fuel cells, if the demand arose.
3.1. Solar Power Station
Before the start of the present survey, based on technical and economic considerations, the owner decided to deploy a solar power station with 49 kWp nominal performance in the pilot site (The DC side electric performance of the production system was 49.58 kWp, and its electric performance calculated from the AC side performance of the inverter was 4 kVA [
6]).
Given this situation, the present study calculated the expected amount of electric energy produced by the SunForte PM096B00 PV panels of the planned solar power station at the pilot site, taking the long-term meteorological data into consideration. The expected amount of the produced electric energy was determined by the freely available PVGIS-CMSAF database and software (
http://re.jrc.ec.europa.eu/pvgis/ (accessed on 4 June 2019)), created with the support of the EU.
According to the available designs, PV panels have been installed in three groups on the roof of Office Building 2. Modules with a nominal performance of 35.7 kWp were mounted on the southern roof, while the nominal performance of the panels on the south-eastern roof was 13.1 kWp. In reality, the roof sections in question did not exactly face these points of the compass, but for the sake of calculation, these idealized directions were considered. As given by the designs, the inclination angle of the panels was 30°. The yield loss arising due to environmental temperature and temporary low irradiation was taken to be 13%, the loss arising from the reflection due to the angle of incidence was taken to be 2.9%, while other losses (due to cables, the inverter etc.) were taken to be 14% by the PVGIS system.
3.2. Production and Storage of Electric Energy
The analyzed solar system produced more electric energy in the majority of the year than the electric energy demand of the pilot site consumers, based on the available data. This extra production primarily arose in the summer months. Additionally, it was also possible that in periods characterized by low electricity consumption (e.g., weekends), the PV system could produce the whole amount of energy demanded. It must be highlighted that the above data are only applicable if the sky is clear. Real production, modified by weather conditions, would not reach the daily demands in the overwhelming majority of cases.
If the sky is not ideally clear during all days, the storage capacity must be changed as well. In this case, according to PVGIS, the performance was 30 kW, while the storage capacity should be around 100 kWh. The lower change in the performance stemmed from the fact that if the system was sized to meet the full demand of the site even for night hours, the storage capacity was underestimated. Contrarily, if the system was sized to the installable capacity, we had net extra production more rarely, thus the amount of energy to be stored was lower.
3.3. Hydrogen and Electric Energy Production
This study analyzed the possibility of energy production with PV panels, which can be used for water splitting [
7]. The energy is stored in the form of hydrogen, which is used in fuel cells to produce electric energy in the peak hours. The HySTAT 10-10 brand water electrolyzer produced by Hydrogenics works at 10 bar nominal water pressure. If it uses 4.9 kWh/Nm
3 nominal electric energy, it produces 10 Nm
3/h hydrogen [
8].
The nominal energy demand of the water electrolyzer is 4.9 kWh/Nm
3 at full load [
9]. If the PV panels produce the above average amounts of electricity daily and monthly, the average daily and monthly hydrogen amount produced by the nominal energy demand is the following (see the first 4 columns in
Table 2).
The nominal performance of the commercially available HyPM-HD 30 fuel cell produced by Hydrogenics is 31 kW (the nominal performance of the Celerity fuel cell is 60 kW). Based on the technical specifications, the smaller fuel cell, which has a better efficiency (55%), requires ~19 Nm
3/h H
2 if the calorific value of the hydrogen is 10.76 MJ/Nm
3; which can be produced by ~93 kWh electric energy [
10]. Consequently, if the above devices are used to produce hydrogen by electricity, and to produce electric energy again from hydrogen, the efficiency of electric energy production is 33%.
If the total annual electric energy produced by the 49 kWp photovoltaic power station (55,700 kWh) was used to split water, and then the hydrogen produced was used to make electric energy again, approximately ~18,600 kWh electric energy could be produced. If this electric energy were sold at a price of 50 HUF/kWh, the annual income from this would be 928,000 Ft/year [
11].
Table 2 shows how much electric energy can be produced from the hydrogen in fuel cells [
12]. The last column gives the income from this energy if the price of electric energy is 50 HUF/kWh.
If economic life expectancy is 10 years and the expected minimal acceptable rate of return (MARR) is 6%, it can be stated that the allowable investment cost would be ~6.5 million HUF to reach 929,000 HUF regular income per year.
To construct an energy monitoring and controlling system, it was suggested to meter the following amounts: (i) electric energy used by the water electrolyzer; (ii) produced amount of H2; (iii) electric energy used for storage; (iv) electric energy produced by the fuel cell; (v) heat energy produced by the fuel cell.
3.4. Energy Production by Gas Turbines and Engines
It is expected that in the future industrial parks, office buildings, public buildings, hotels, swimming pools and blocks of freeholds will have their own electric and heat energy producing units with gas turbines or gas engines [
13].
Taking the above basic value of electric energy consumption into consideration, the installation of a complex, heat and electric energy production unit of 50–65 kWe nominal performance was supposed. For comparison, values were calculated both for gas turbines and gas engines. To estimate the investment costs, quotations were asked for [
14].
If the amount of gas required to produce of DHW is considered to be stable, to satisfy the annual heating power demand, the heat power capacity of gas required is ~1115 GJ. If the efficiency of the furnace is 90%, the heating power demand is ~1005 GJ/year. Consequently, the heat demand is around 136 kW.
For a gas turbine, the efficiency of electric energy production is taken to be 29%, while for a gas engine it is 40%. The thermal equivalent for the expected gas consumption of blocks is 6500 GJ/year and 3600 GJ/year, respectively. As a result, the whole electric energy demand of the pilot site can be produced, and the gas used for producing the annual heat demand of the site is saved (1082 GJ/year, and 1004 GJ/year). If the devices with the above nominal performance are installed, surplus electric, heat, and cooling energy is produced, which can be fed into the electric grid, or can be sold to heat or cool the neighboring buildings [
15].
The detailed economic analysis explored the feasibility of the investment into a combined energy production unit, to replace the present solution (direct heat production, purchased electric energy). In addition to the calculation of economic indicators, it was also examined to what extent these indicators were sensitive to the price fluctuations of electric energy and natural gas.
3.5. Alternative Fuel for the Vehicles of the Pilot Site
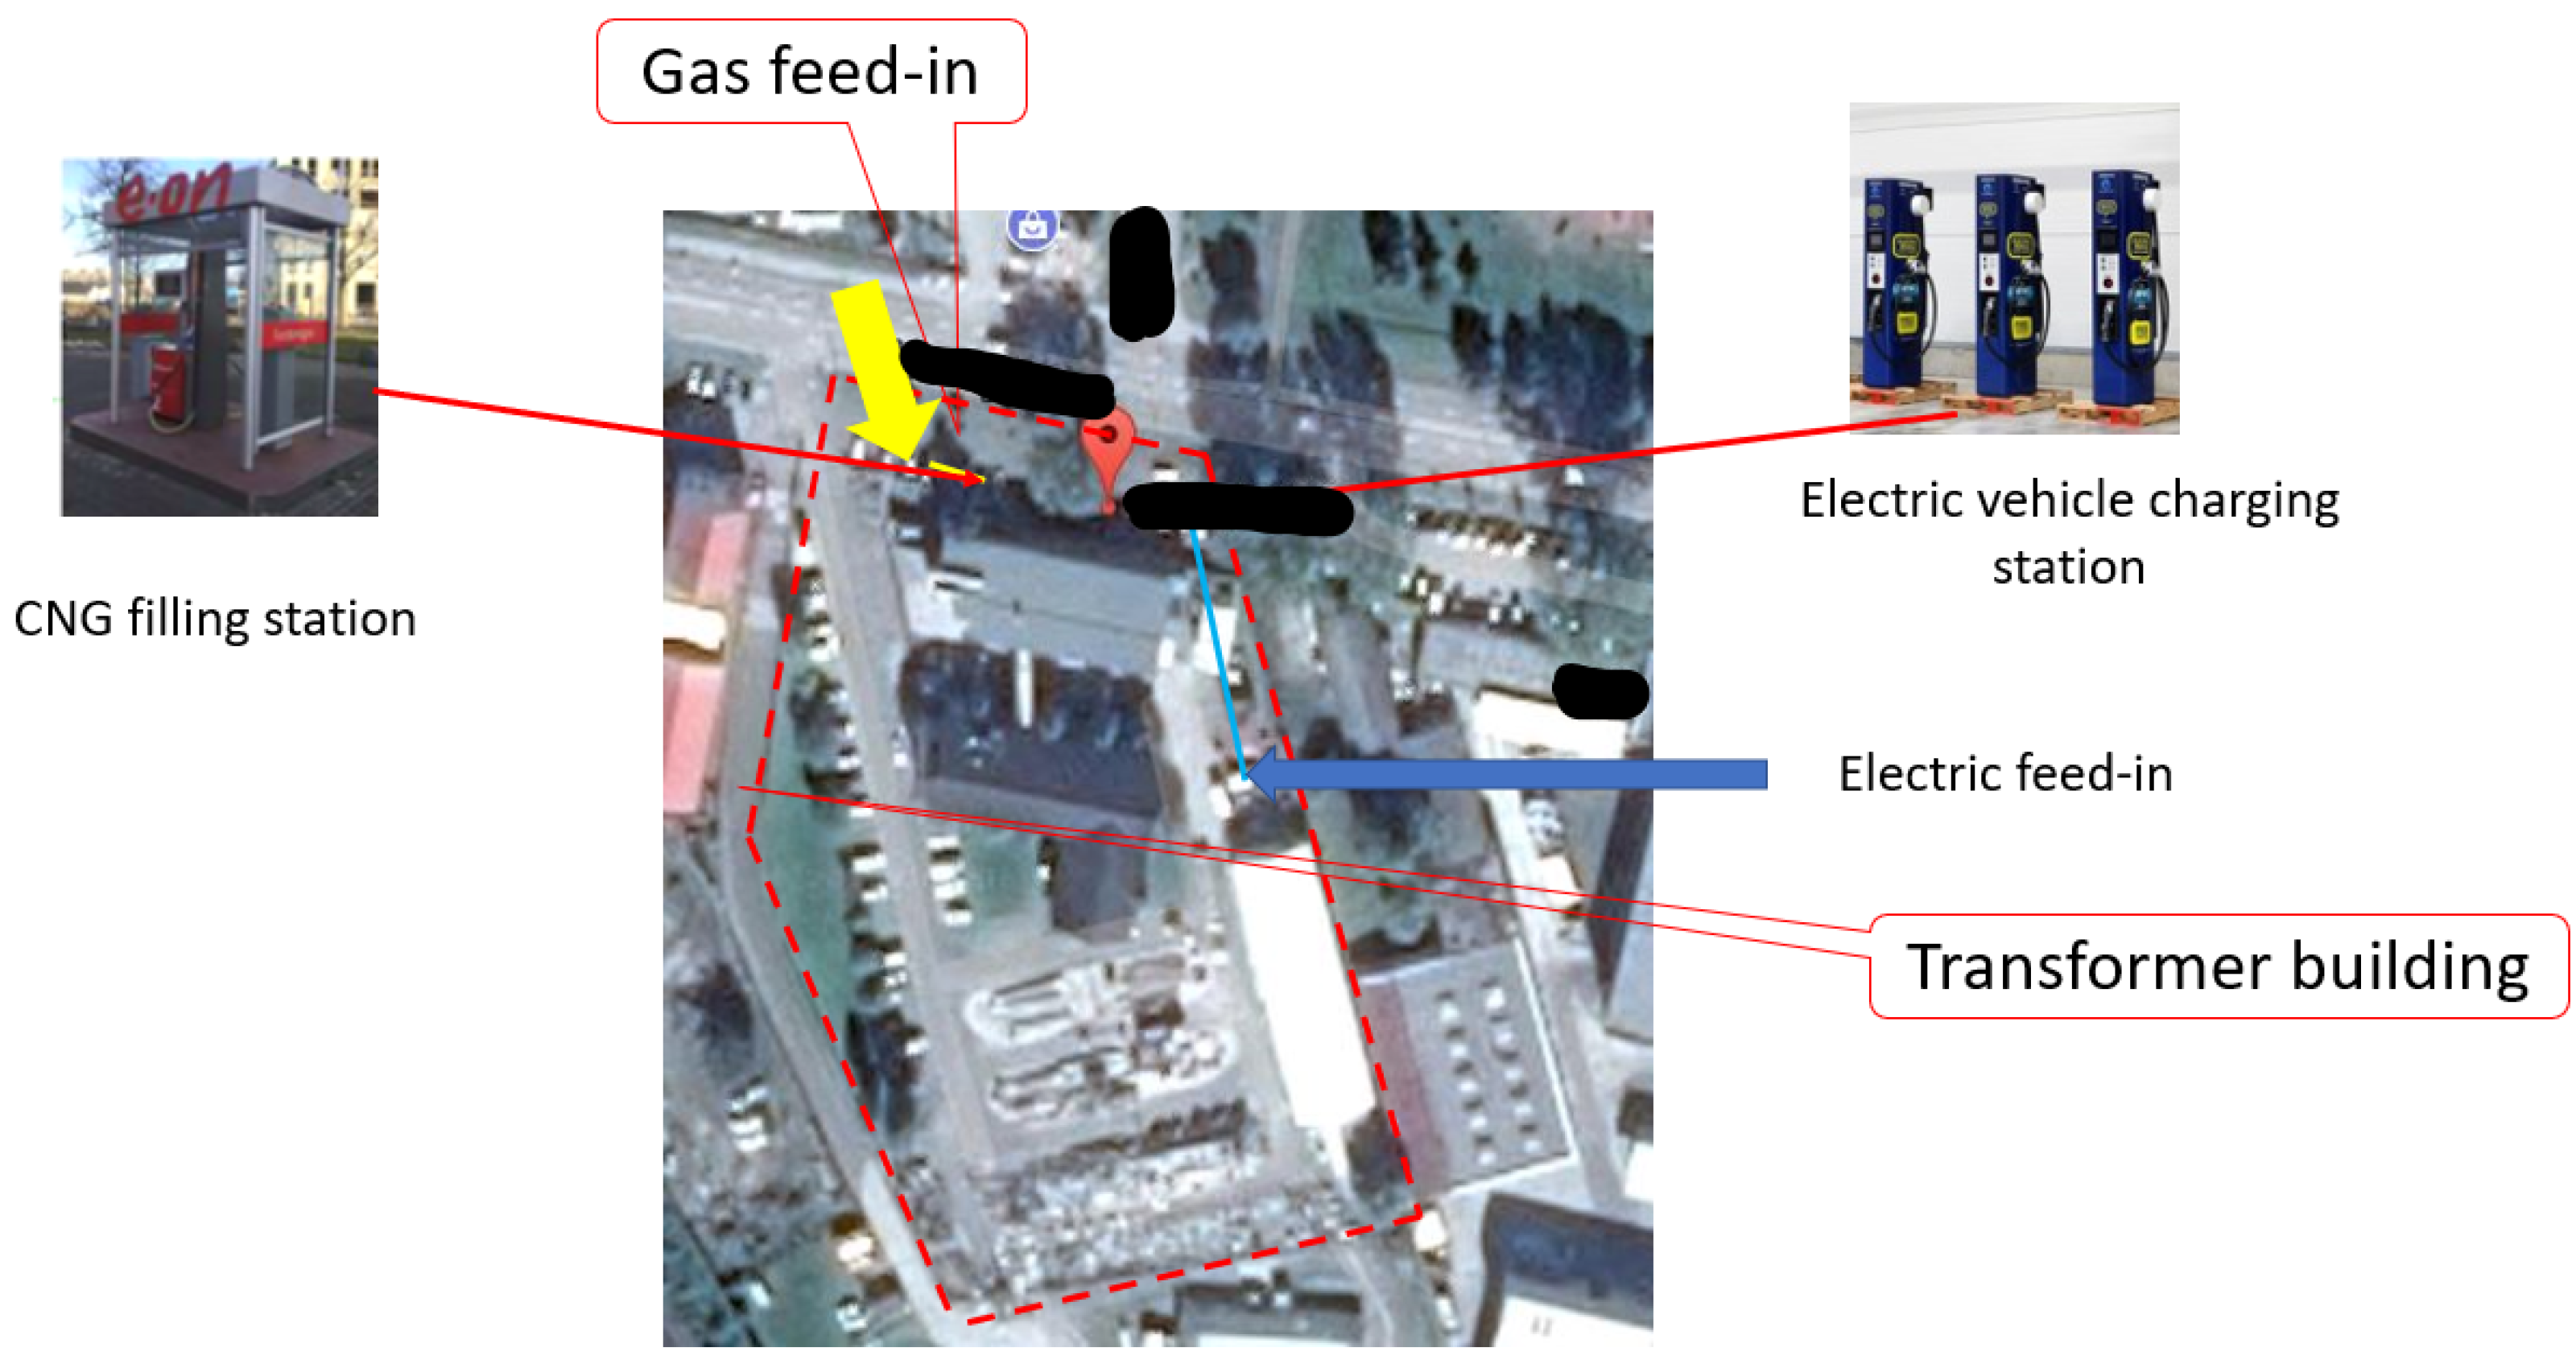
According to the original plans, the filling stations for electric and gas-fueled vehicles of the site would have been built within the premises of the pilot site. However, the personal discussions revealed that it would be more beneficial to construct the filling station in front of the pilot site, on public grounds [
16]. If the filling station is open to the public, it has a marketing value, it can enhance the electricity and natural gas consumption, which will lead to an increase in the profitability of the pilot site.
Figure 2 shows the suggested location of the filling stations. For the construction, a permit from the government should be obtained, and the access road should be paved.
For the compressed natural gas (CNG) filling station, quotations were asked from the CNG Port Kft. as the distributor for two products with different performance: Blue Line TB 35 Midi Comfort and Green Line TB–160 complete filling stations.
The performance of the compressor in the Blue Line TB 35 Midi Comfort station is 35 m3/h, and the capacity of the storage is 210 Nm3 at standard air pressure. It is suitable for filling the vehicles of the company’s own fleet. The Blue Line TB CNG filling station is an ideal choice for small businesses with 20–30 vehicles or for sites with low traffic. Although owing to its capacity, it is not very much profitable for public operation, it can excellently serve a delivery fleet or the cars of a maintenance group.
The compressor can produce 26 kg CNG per hour, i.e., for calculations the capacity value of 520 kg CNG per day can be used.
For comparison, let us look at the CNG-consumption of various vehicle categories per 100 km:
Supposing that each vehicle covers 200 km per day, the filling station can serve:
This filling station cannot serve larger vehicles (buses, trucks).
Technical specifications:
overall dimensions: 2980 × 2500 × 2300 mm;
material of the container: reinforced concrete;
weight of filling station: 8800 kg;
length of the attached cable: custom, depending on the site parameters;
diameter of the connection: DN 50, with PN 16 flange;
pressure at the connection point: pressure of the primary network.
The Tenderer determined the designated overall price of the complete filling stations as 30 million HUF, in addition to the cost of certification (15 million HUF).
The estimated cost of the technical preparations and the installation of the feeder cable is 5 million HUF.
Thus, the expected overall investment cost is 50 million HUF. (The detailed cost estimations for the solutions below are omitted due to size limitations.)
In contrast, the performance of the compressor in the Green Line TB–160 is 160 m3/h, and the and the capacity of the storage is 700 Nm3 at standard air pressure. It is suitable for filling a bus fleet. This type of station is deployed at approximately 500 sites in Germany, operated by the DSO of the pilot study. The expected investment cost is 95 million HUF.
If economic life expectancy is 10 years and the MARR is 6%, it can be stated that for the Blue Line TB 35 Midi Comfort filling station (investment cost: 50 million HUF), the annual regular income/savings should reach ~6.5 million HUF/year.
If the Green Line TB–160 station is constructed (investment cost: 95 million HUF), the required amount of annual income/savings should be almost the double of the above value, ~12.6 million HUF/year.
4. Results
If we want to explore for what proportion of the energy production renewable sources are responsible, it is indispensable to meter the produced energy at the electricity, gas and heat etc. sides. The reasons exceed simple monitoring; the direct or indirect control profile of storage and other, regulable devices is possible only if the general and actual behavior of all the devices in the system is known. Monitoring with a possible SCADA (supervisory control and data acquisition) system is the minimal requirement. If the designed system is not totally autonomous, this monitoring function is still indispensable. However, to enhance energy efficiency, it is suggested that active controlling devices should be installed, and the classic SCADA functions should be integrated. Passive management is also suggested to be set. After the system is launched, and consumption/production data are available, optimal operational and management functions should be added to the system for the relevant devices (e.g., storage, inverter). If it is possible, the introduction of direct control should prove to be useful on the medium and the long run (e.g., charging control and management). The prerequisites for this include communication and other conditions.
In practice, high pressure gas storage is completed in two steps. In the first step, the H2 gas is compressed to an intermediate pressure. During transloading, a compressor produces the storage pressure. The suggested HySTAT-10 water hydrolyzer produces 10 Nm3/h at 10 bar pressure. The volumetric density of the hydrogen gas at this pressure is extremely low.
The capacity of the chosen HYPM HD 30 fuel cell is 31 kWe, and it consumes 18.86 Nm3/h hydrogen for its nominal production. This equals ~19 kg/h H2 usage at 10 bar pressure. According to these data, the operation of the fuel cell requires almost twice as much hydrogen for operating at nominal capacity as the nominal capacity of the hydrolyser connected to the existing solar panel.
Consequently, and owing to the fact that hydrogen production and electric energy production do not occur contemporarily, H2 storage capacities must be installed. The higher the storage pressure is, the less volume for storage is required. However, the higher the pressure is, the higher amount of electric energy is required for compression. If daily capacities are examined, and if 50 m3/day average H2 production is supposed for the summer months (May–August), the hydrogen storage should at least store 50 m3 hydrogen.
Industrial compressed gas cylinders can be used at a minimum of 150 bar pressure, but the maximal pressure for modern types ranges from 200 to 300 bar. If the amount of gas to be stored is relatively high, several cylinders are connected to form a cylinder bank. To serve the high needs, the cylinders are connected with a common manifold system in parallel. This system allows simultaneous flow from all cylinders through a central valve.
Let us consider a cylinder bank made up of 12 cylinders, 50 L each. The total volume of the cylinder bank is thus 50 × 12 = 600 L. If the pressure of the ideal gas is 300 bar, and the temperature is 15 °C, 182 Nm3 gas can be taken out of the system at 1 bar extra pressure. This is in line with the rule of thumb that the volume of an ideal gas stored at 300 bar at atmospheric pressure is the storage volume multiplied by ~300. In the present case, the stored hydrogen gas must be handled as a real gas; thus, its volume at atmospheric pressure will be only ~254 times the storage volume, i.e., 152 Nm3.
Using the above algorithm, two cylinder banks can store hydrogen which is 304 Nm3 at atmospheric pressure, while three cylinder banks can store 456 Nm3. As the nominal capacity of the fuel cell is 19 Nm3/h, the stored amount of gas ensures 8, 16 or 24 h of constant operation, respectively.
If storage capacity is calculated from the amount of H2 gas created with the electricity produced by the solar panels, and the average production between May and August is taken as the starting point, it can be stated that three cylinder banks can store the amount of hydrogen produced in ~10 days in this period. This amount can ensure the continuous operation of the fuel cell (nominal capacity: 31 kW) for ~24 h.
In the decision-making process, in addition to the above described situation, the energy demand of hydrogen gas compression must also be taken into consideration. According to the specifications of a compressor applied at CNG chargers, a CNG filling station that can compress gas up to 345 bar, has an electric energy demand of approximately 90 kW. If this amount is taken into consideration, the energy balance of the H2 production, storage and energy production will be negative.
The new system to be set up for the pilot site should be created in a way that the possible future implementation of more complex system operation and management systems could be achieved without major modifications.
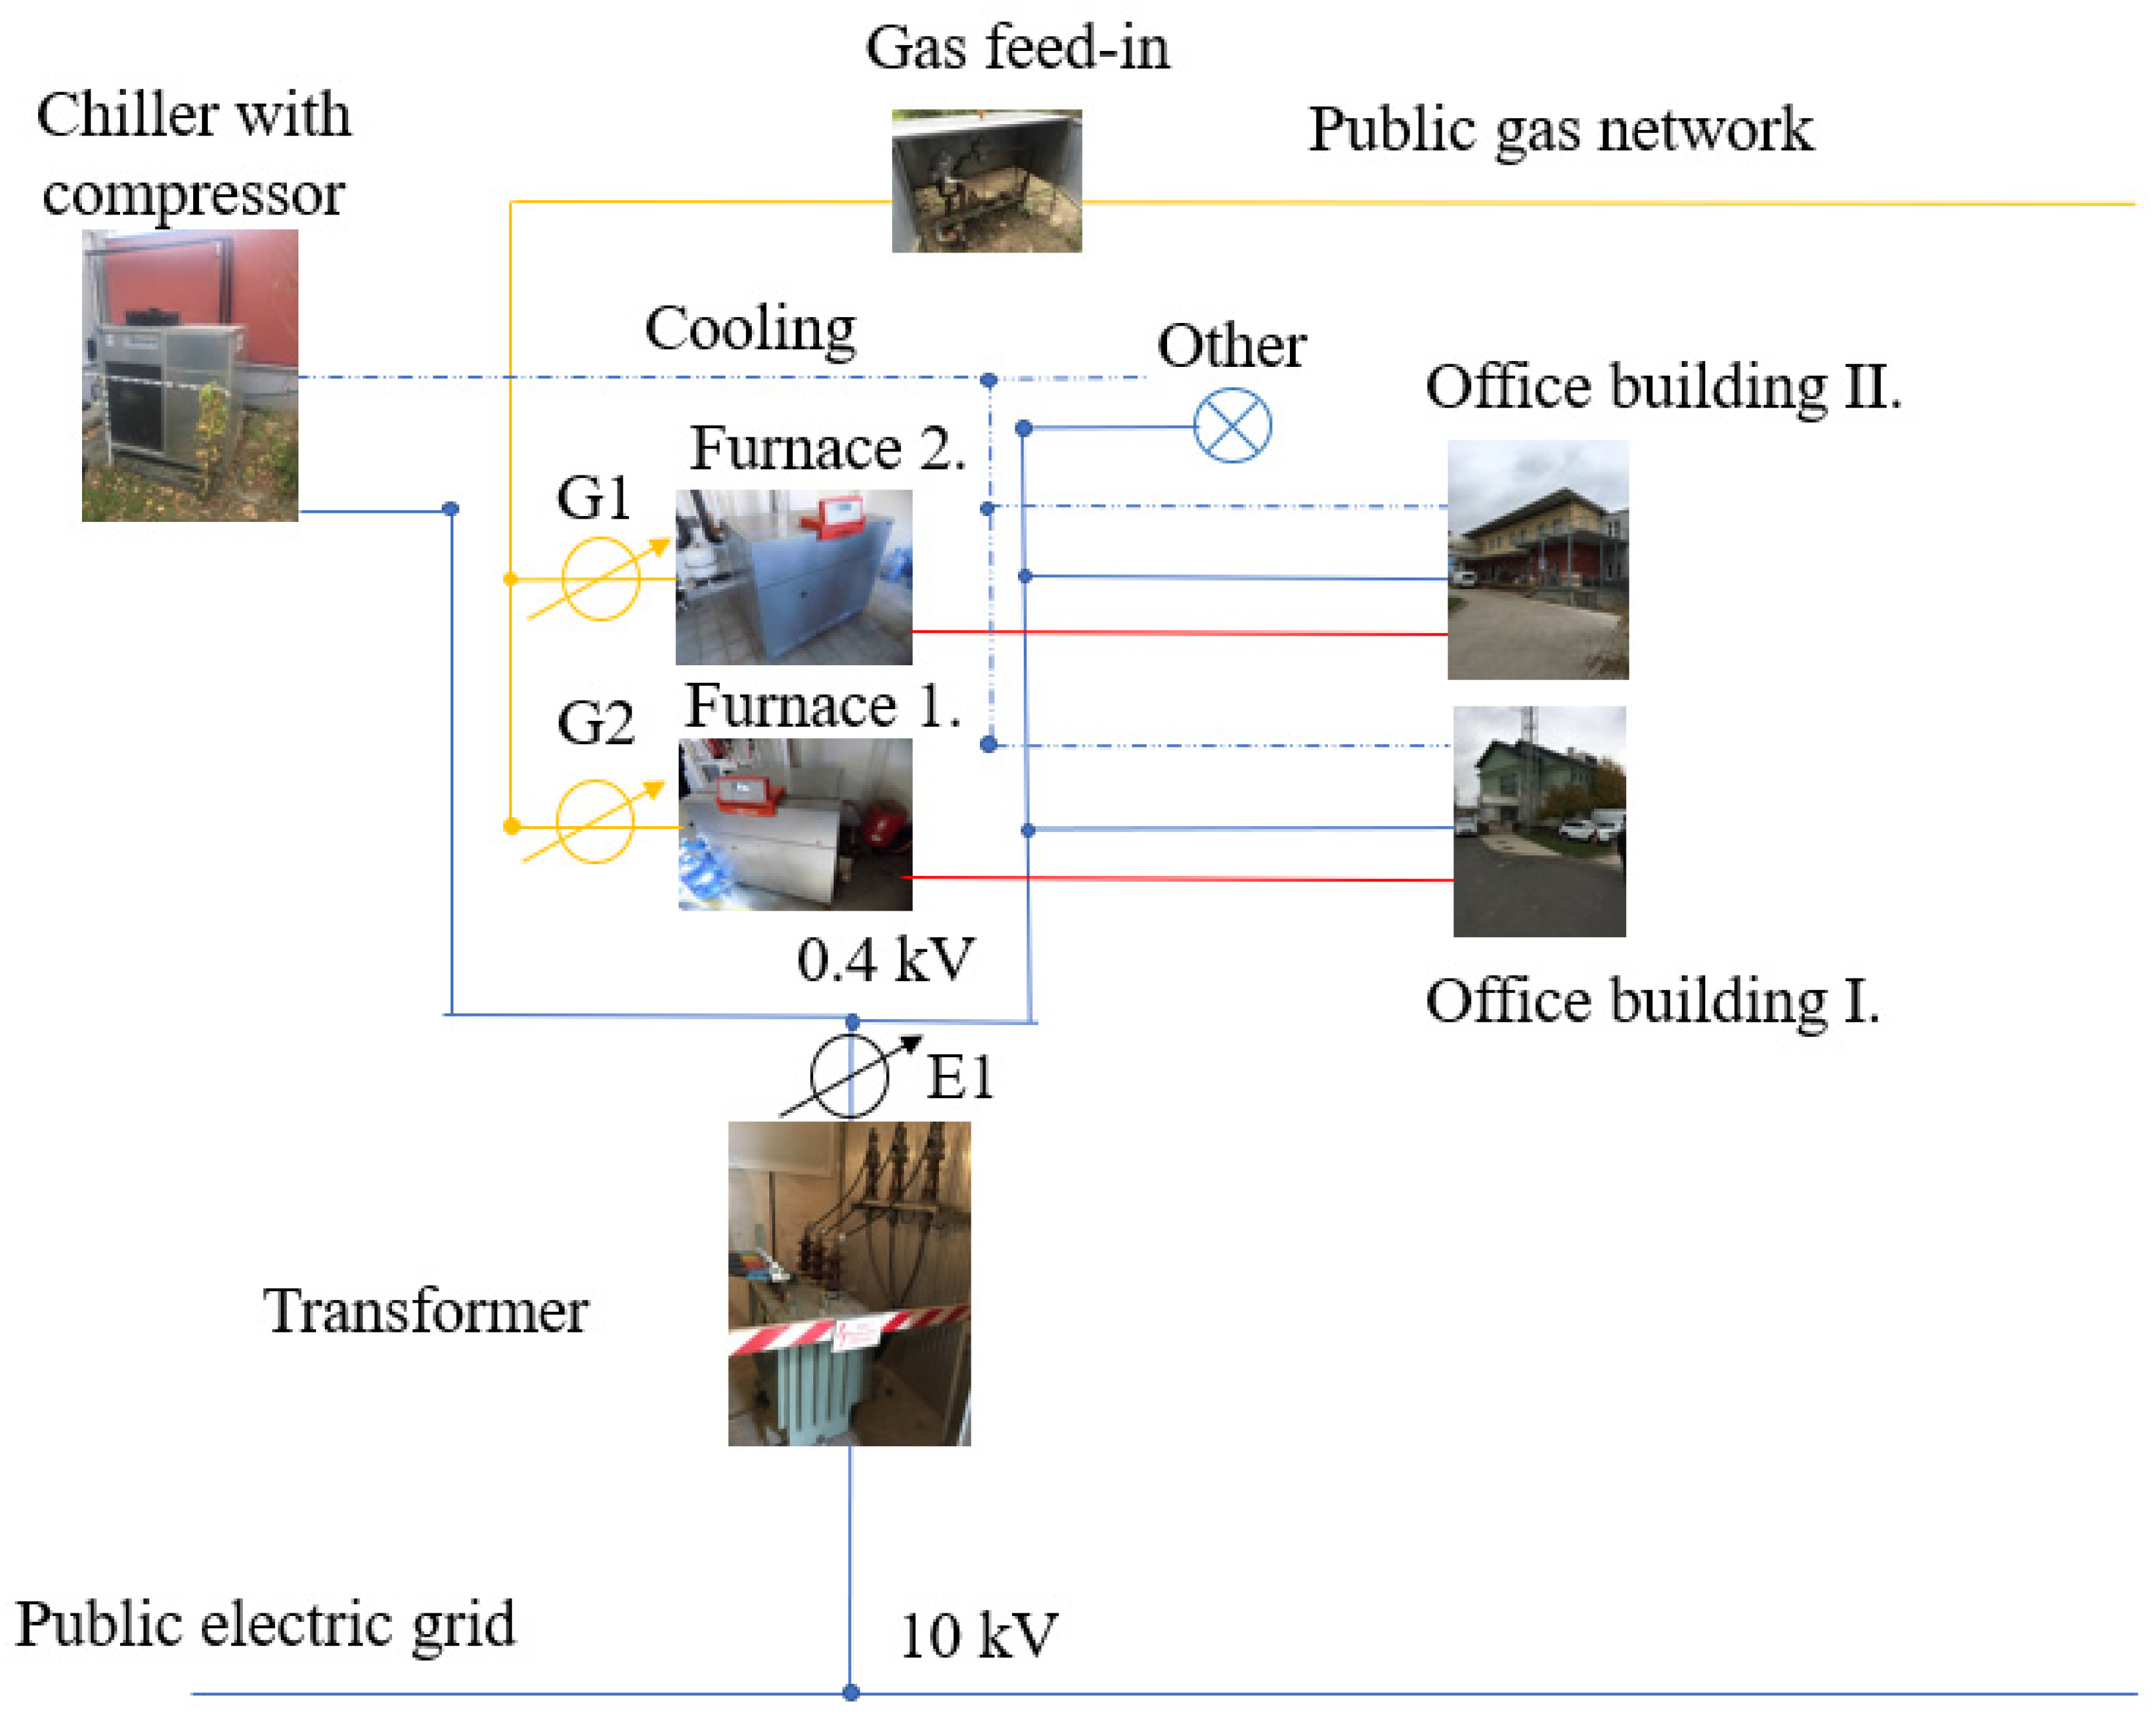
The present circumstances are well illustrated by
Figure 3 below, but the number of installed devices will grow considerably. Consequently, the arrangement of metering points should be much more complex. Based on the available energy consumption data, it can be stated that there were two gas meters (G1, G2) in the site, which are read irregularly. Additionally, there was an electricity meter (E1) and a water meter (V1). None of these could be read remotely. It was suggested that these meters be changed to smart devices that allowed remote meter reading (RMR) and could be connected to the EFIR system.
Figure 4 shows the metering devices to be installed to the designed equipment. Types of metering devices: G—gas, E—electricity, V—water, H—heat.
Remotely readable electricity meters should also be installed on both sides of the transformer that also measure idle performance. In this way, the loss of performance, the effective, the capacitive and the inductive performance, as well as the consumption could be metered and followed. Concerning the PV power station, a solar irradiance meter and an outer thermometer should be installed. If the system of metering devices was optimal, the heterogenous energy production systems could be harmonized and controlled.
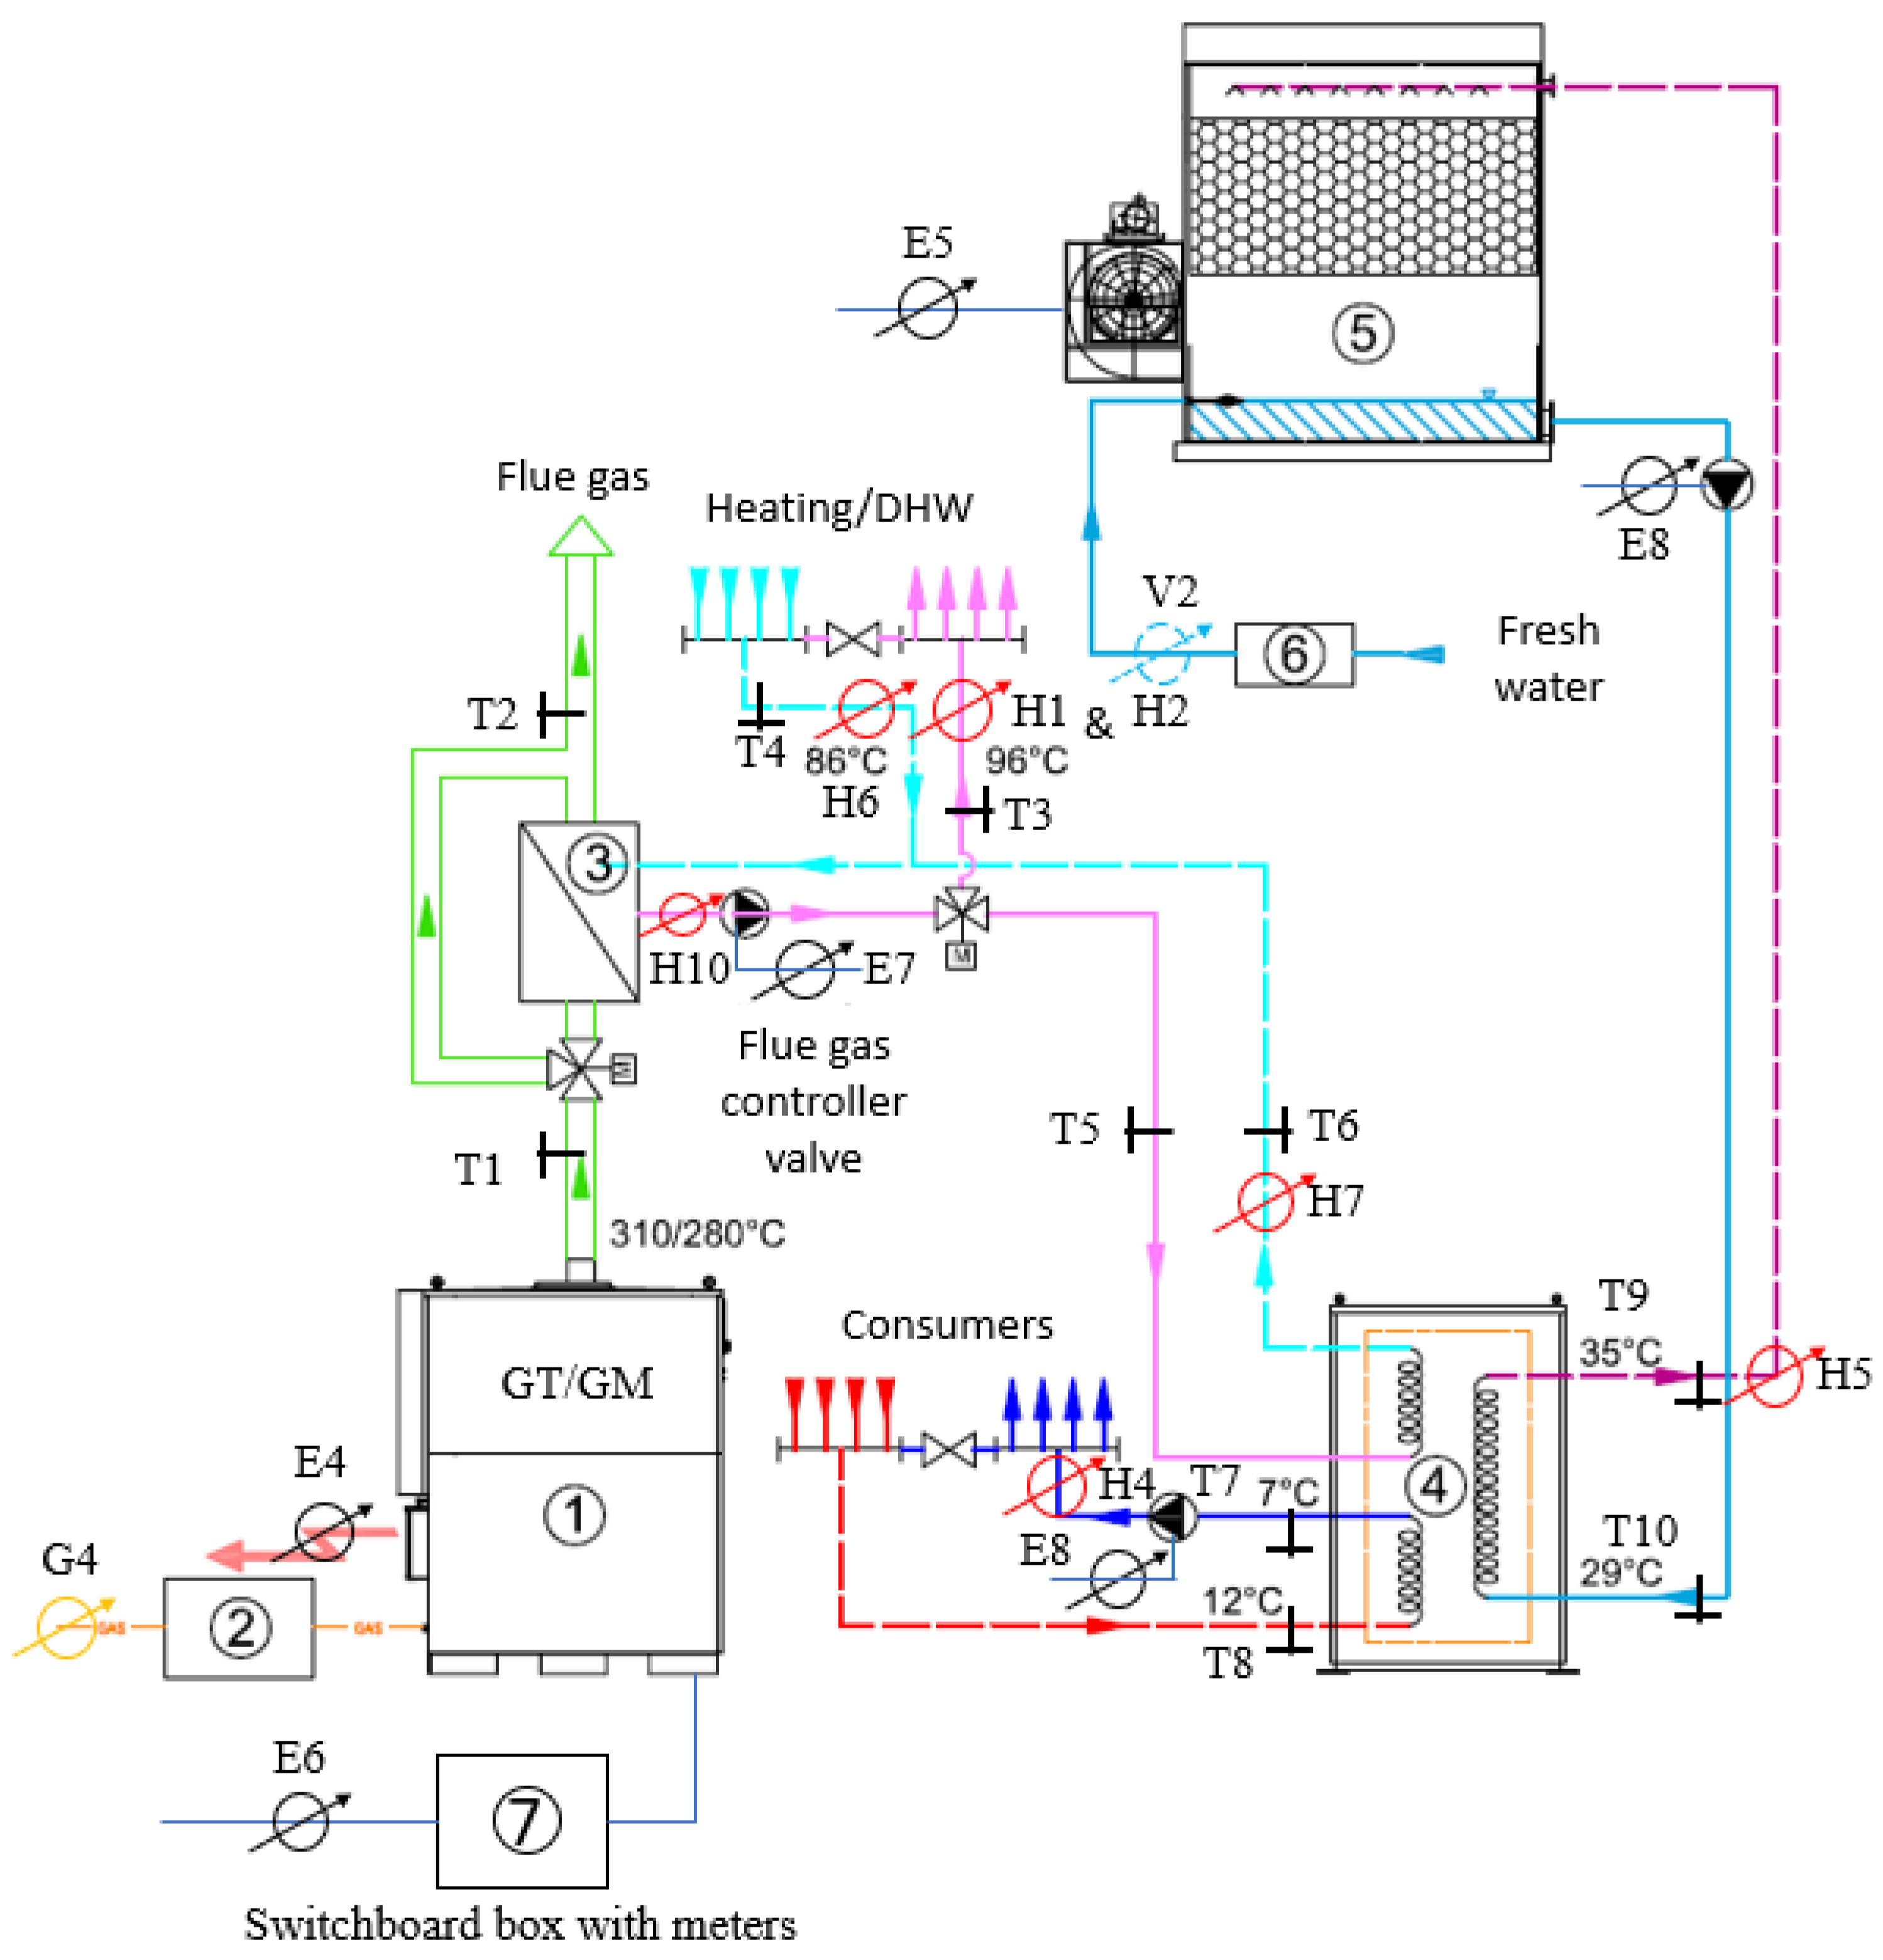
The suggested metering devices for the connected heat and electric energy producing block are shown in
Figure 5.
It is necessary to meter the produced energy concerning the electricity, gas, heat etc. sides to reveal the size of renewable-based energy production. This need is justified by several reasons. Besides monitoring, the general and actual behavior of the devices in the system should be known to be able to create the control profile for the directly or indirectly controllable storages and devices. Consequently, the minimal requirement for the planned SCADA system is to make monitoring possible. Furthermore, a passive control system should also be set up. After the whole system is put into operation, and the demand and production profiles are obtained, the optimal operational and management profiles should be fed into the relevant devices (e.g., storages, inverters etc.). If the possibilities are given, a direct management system is to be set up in the medium and long run (e.g., charge control and management). For this, both communication systems and other circumstances must be provided.
It is suggested that the pilot site be reconstructed in a way that allows the implementation of more complex network operation and management systems without significant modifications.
The planned site setup is a possible end result, but it is important to highlight that this can be achieved by the end of a long process.
This process can take a long time; and during construction, all subsystems must stay operational. Therefore, both the reconstruction process and the whole system should be designed to be modular.
According to the major principles of the designing process, each module should be designed in a way that synergetic possibilities could be exploited. The fact that each unit to be installed enables two-way energy flow makes the otherwise rather complicated optimization process simpler. The measurements of gas, electric energy and water should be planned while keeping this fact in mind, i.e., that the produced and consumed amounts of energy of new units constitute valuable pieces of information; consequently, a balanced-based measurement is not satisfactory.
Thus, those meters shown in
Table 3 are to be deployed that serve the subsystems constructed in the relevant phases. The necessary minimum was determined during the design process of metering devices. In a later phase of the project, calculation-based estimation is also possible. However, the figures given here are to be regarded as necessary minima based on prior experience.
5. Discussion
Electricity production from solar energy can be solved by commercially available PV panels. For this, the most suitable nominal performance had to be determined, based on technical, economic and environmental parameters.
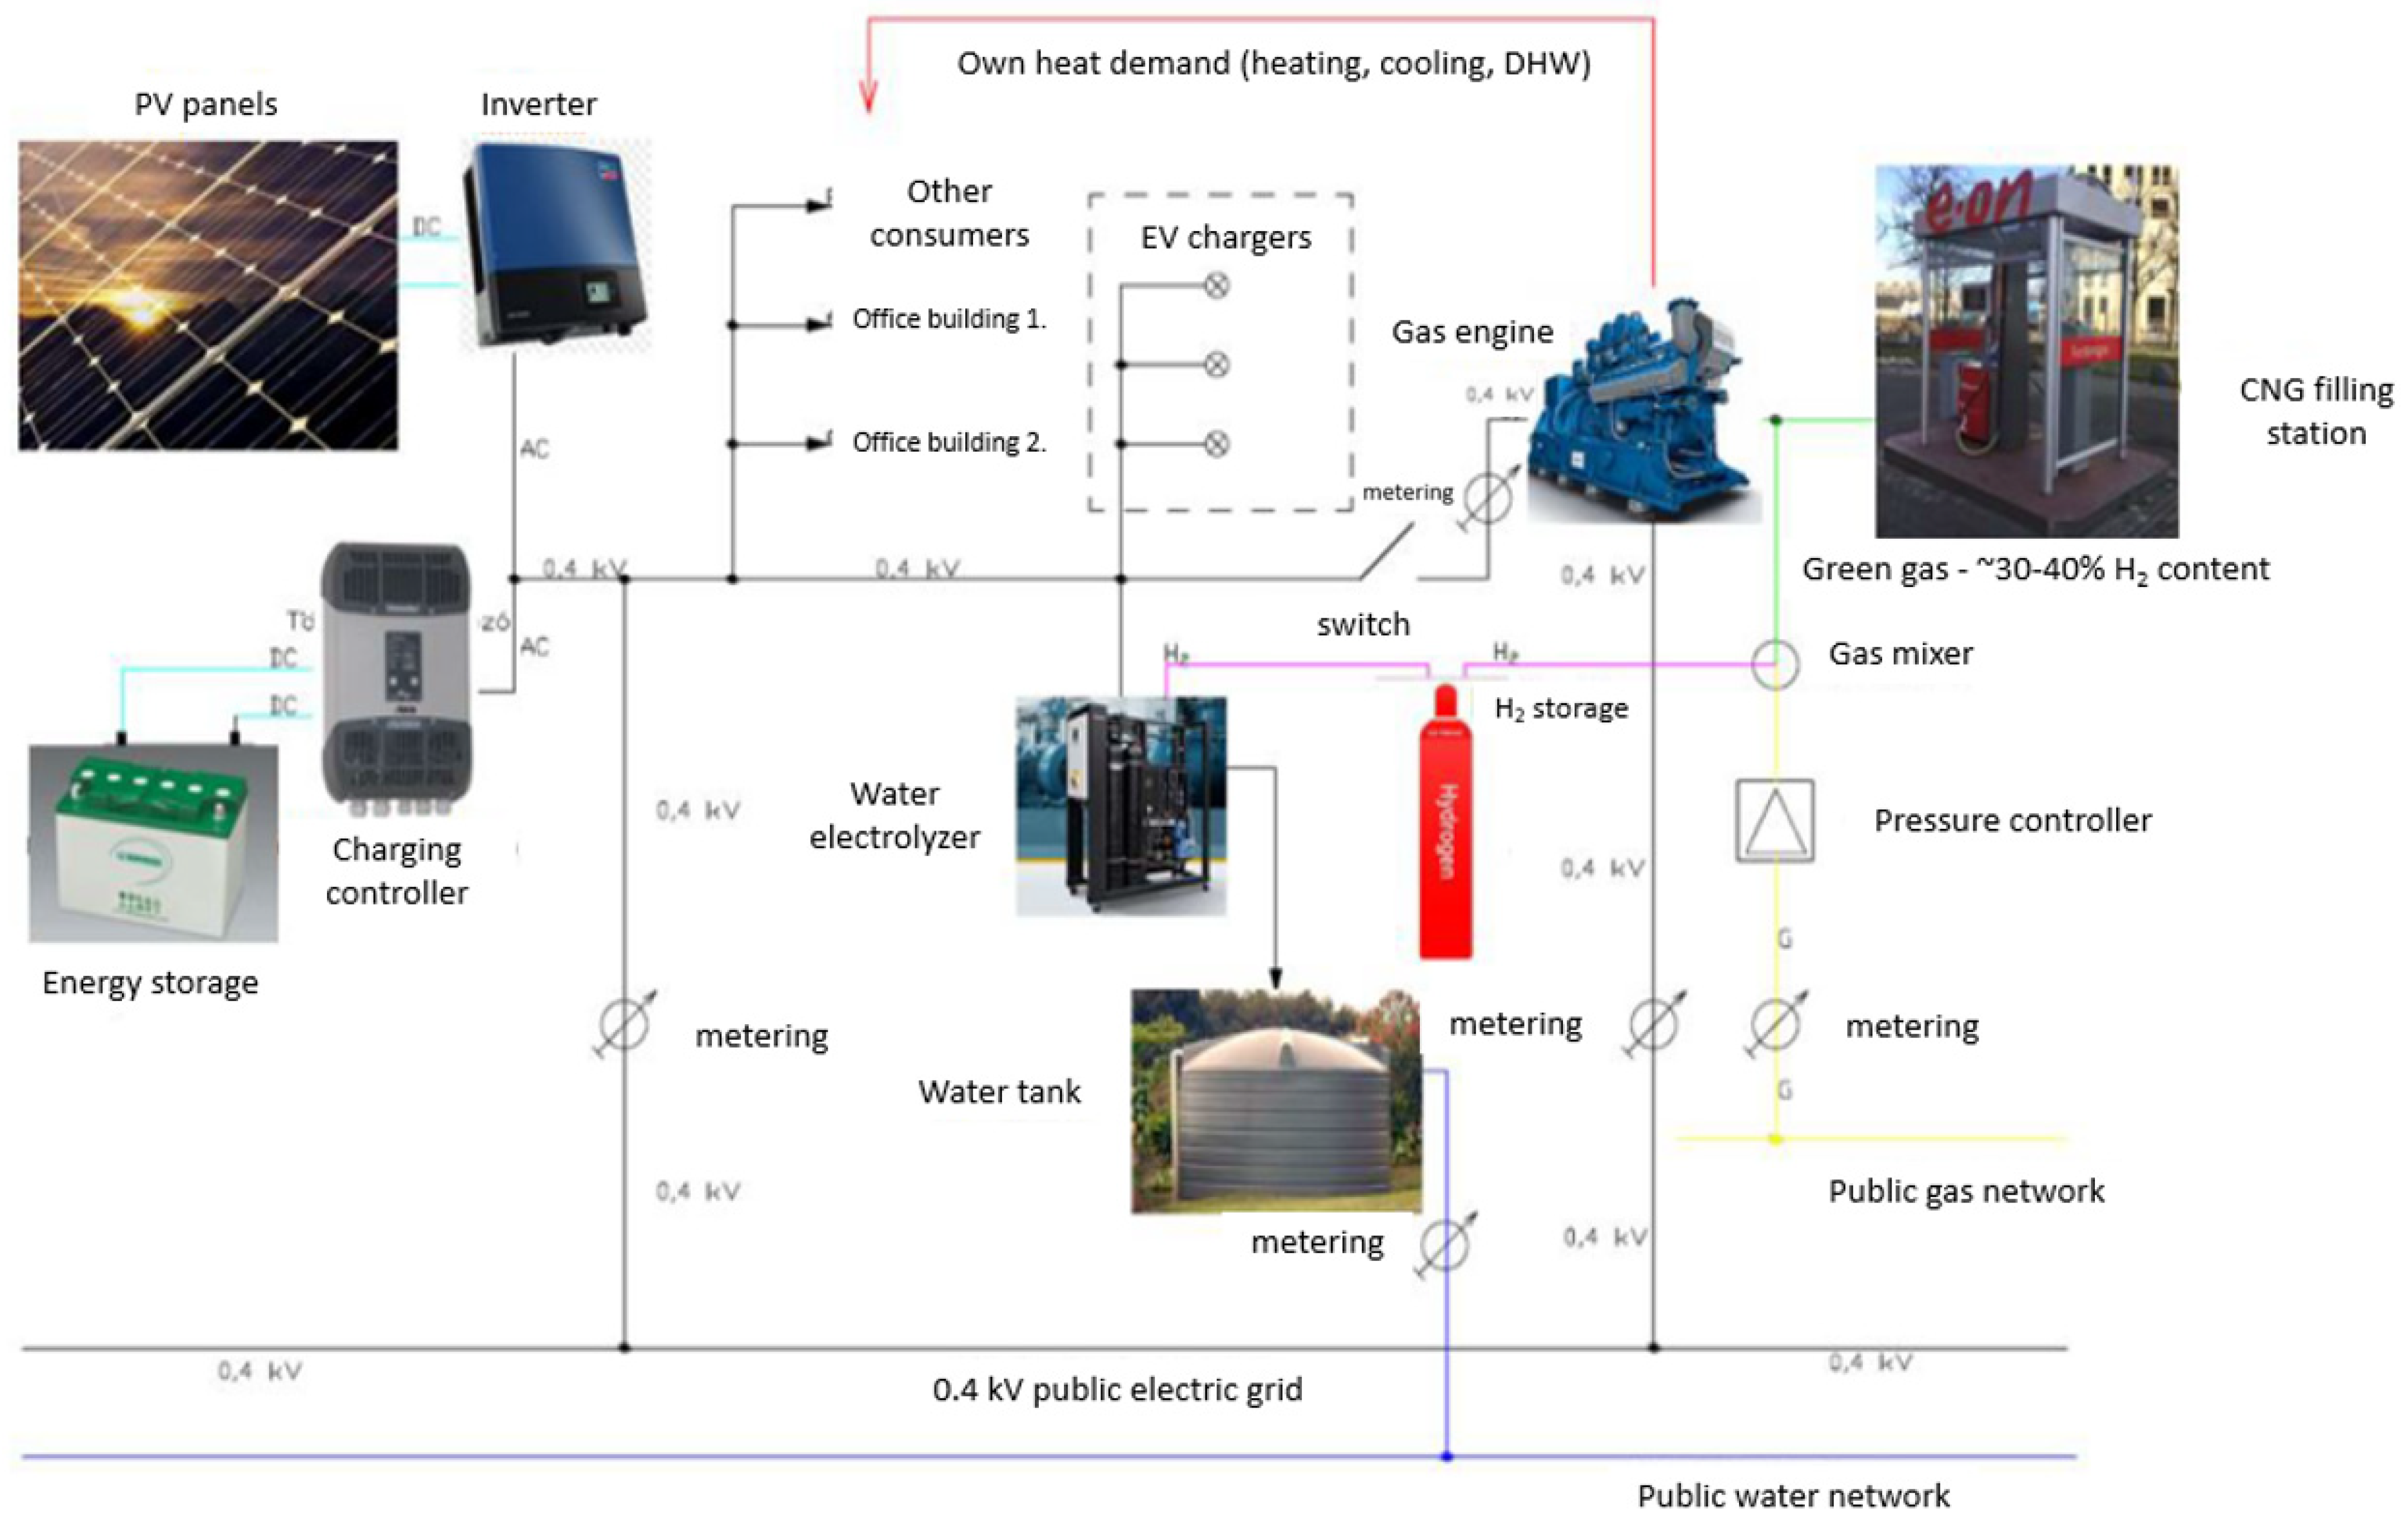
Furthermore, the method, the effect and the possibility of mixing the hydrogen produced by water splitting into natural gas had to be explored. It is ambiguous whether it is possible to use a gas mix with 30–40% of hydrogen added to natural gas in internal combustion engines. It is especially problematic if the gas is not only used in the gas engine deployed at the site for electricity production, but it is also sold at the filling station.
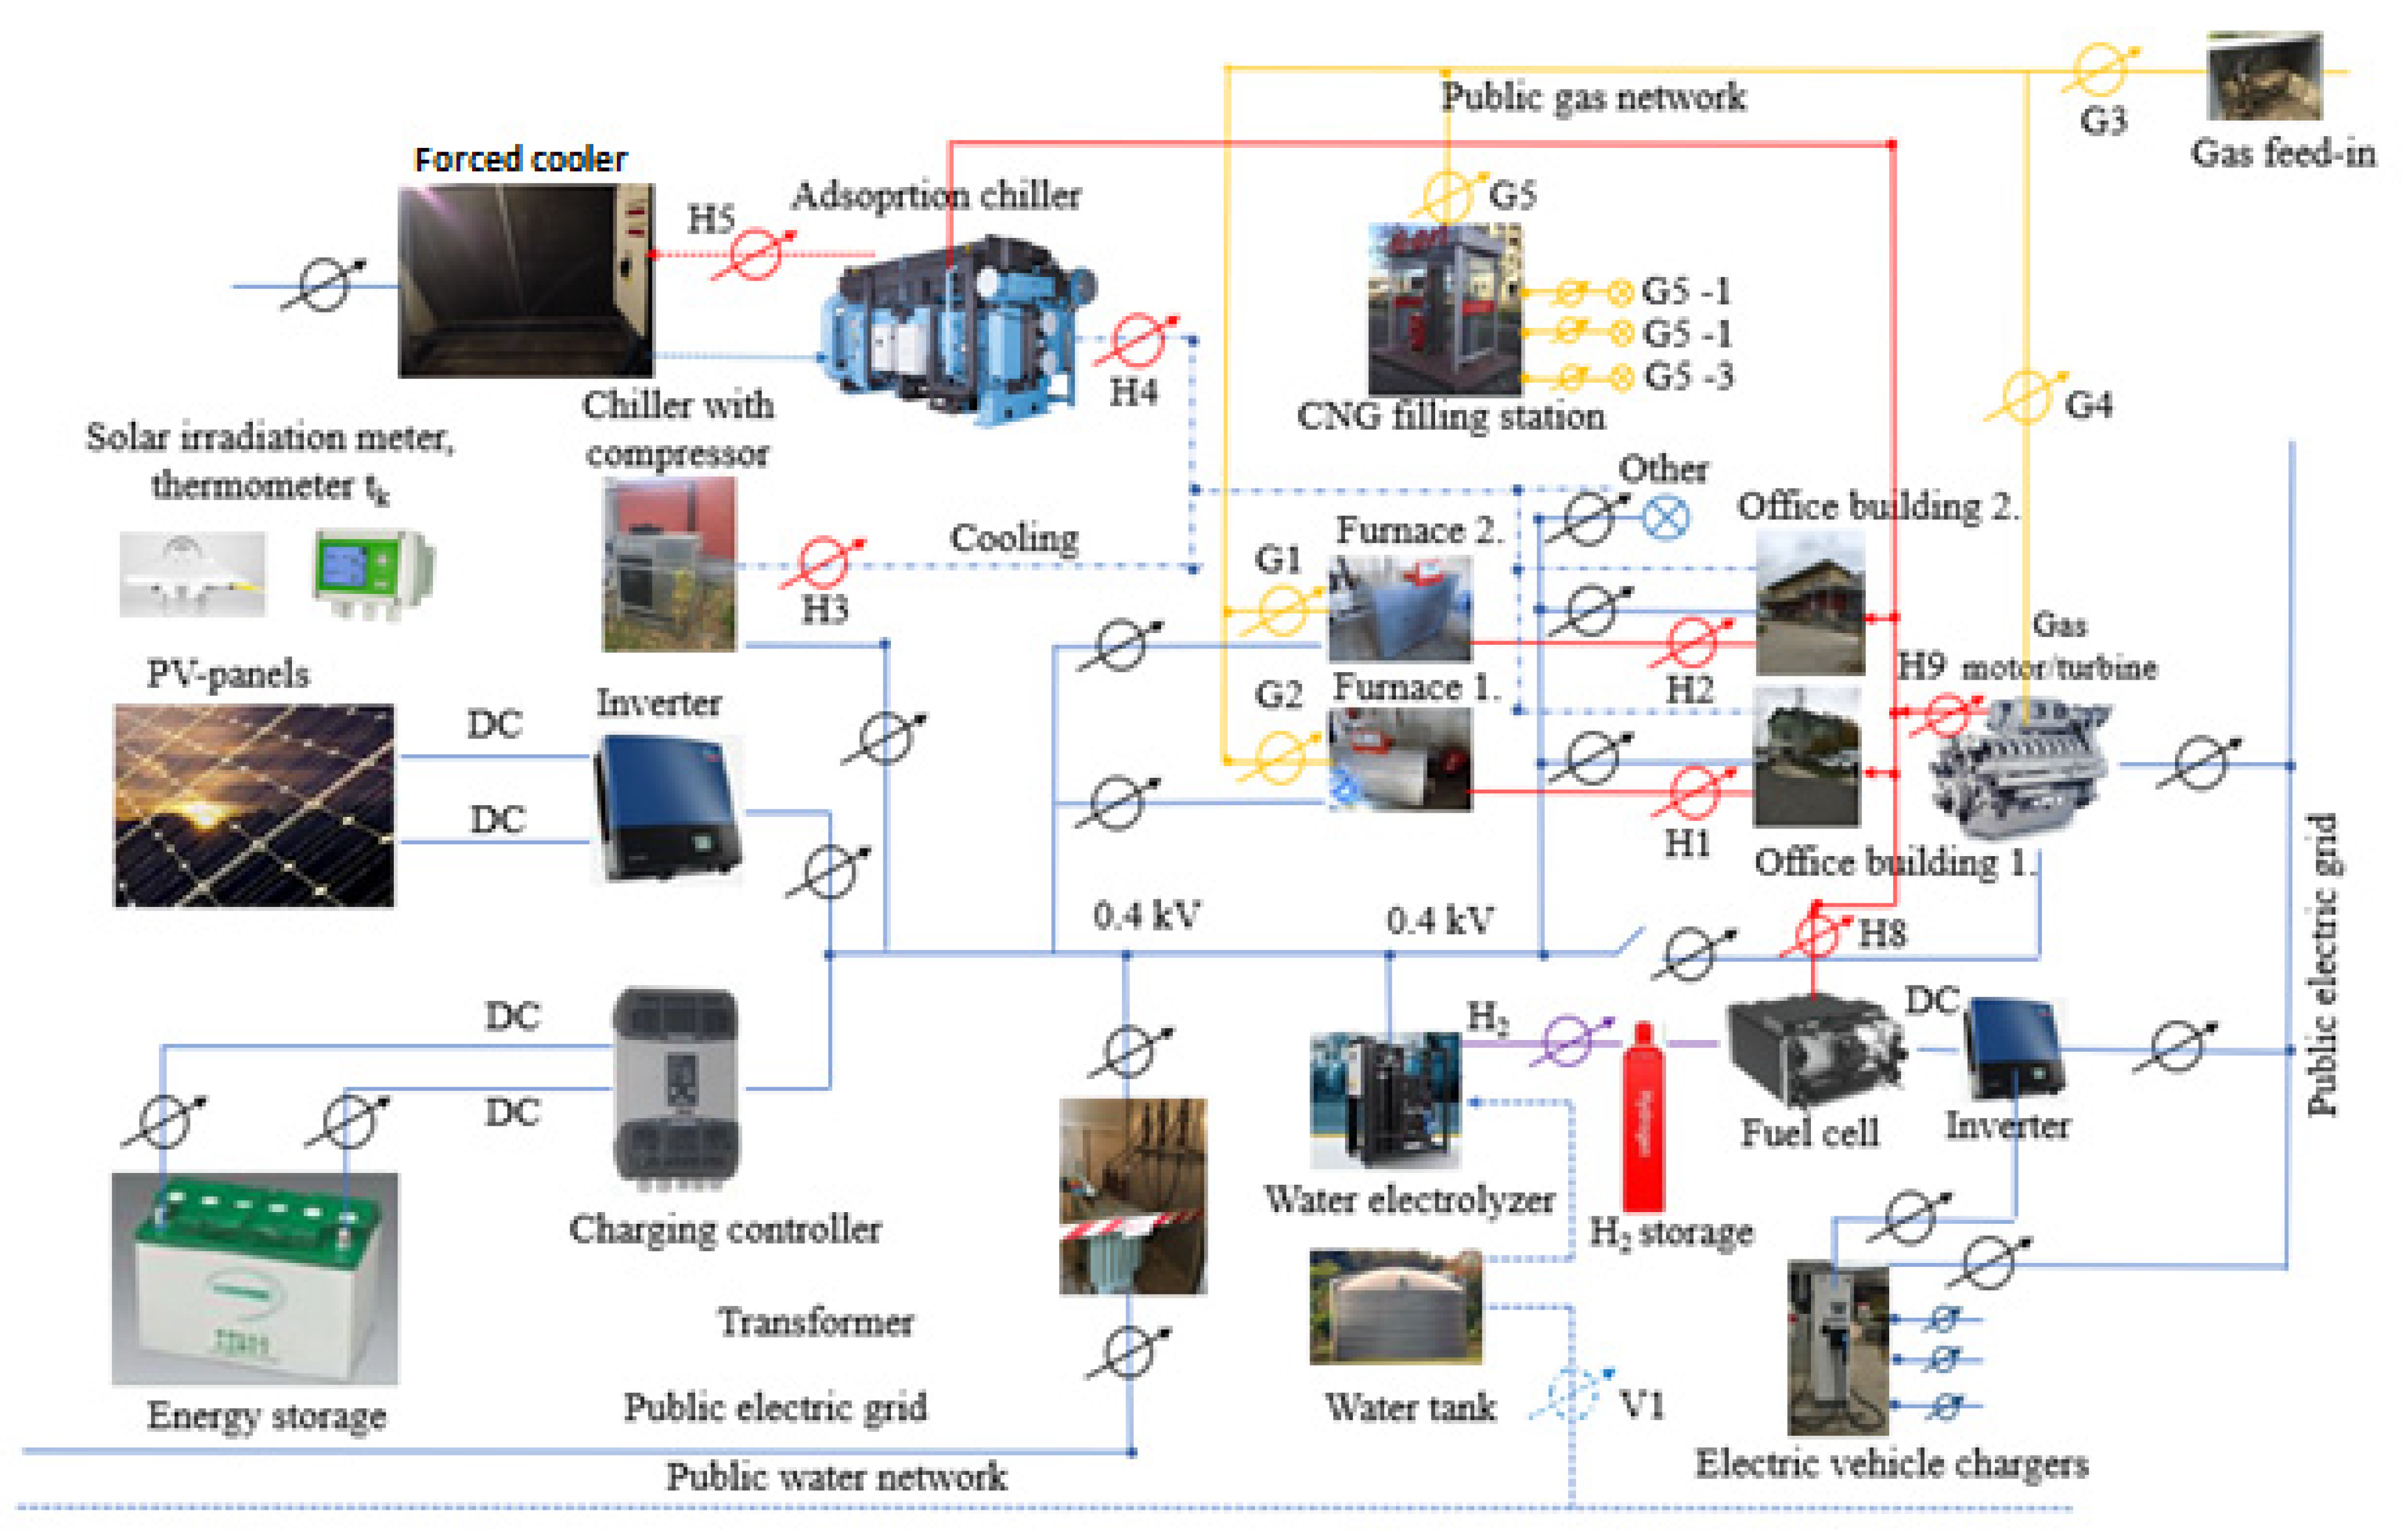
The block sketch of the project was prepared for this purpose (
Figure 6).
Based on the above sketch and taking the aims of the project into consideration, several possibilities have been analyzed:
installation of energy producing sources (solar power station, gas turbine/engine with complex functions, fuel cell); the gained energy can be used for heating in winter and cooling in summer;
water electrolyzers to produce hydrogen;
energy storage systems to store electricity, heat and hydrogen;
EV and CNG filling stations.
The technology feasibility study required the application of unusual methods and innovative solutions. The innovation itself is not coming from a solution without any patent or brand new technology, but the system concept. Some of these technologies are in use, some of them are brand new in Hungary, but all of them together, in one common system operation is unusual at all.
Evaluating the suggested project setup, the well-known SWOT (strengths, weaknesses, opportunities, opportunities, threats) analysis can be useful:
- -
strengths:
- ○
heterogenous energy sources are used
- ○
possibility of energy control
- ○
not only electricity, but other energy types are generated
- -
weaknesses:
- ○
high investment costs
- ○
development issues—not matured technologies
- ○
short internal return is expected
- -
opportunities:
- ○
it could be a lighthouse project, market share
- ○
emerging energy prices, and e-mobility penetration
- ○
external tender resources
- -
threats:
- ○
volatile regulation environment
- ○
lack of operational experience
- ○
environment (Covid)


