Article

Precision Fertilization Strategies Modulate Growth, Physiological Performance, and Soil–Plant Nutrient Dynamics in Sabal palmetto

by
Amir Ali Khoddamzadeh
*,
Bárbara Nogueira Souza Costa
and
Milagros Ninoska Munoz-Salas
Department of Earth and Environment, Institute of Environment, Florida International University, Miami, FL 33199, USA
*
Author to whom correspondence should be addressed.
Soil Syst. 2025, 9(4), 121; https://doi.org/10.3390/soilsystems9040121
Submission received: 1 September 2025 / Revised: 20 October 2025 / Accepted: 4 November 2025 / Published: 6 November 2025

Abstract

Optimizing fertilizer management is essential for reducing salinity-related risks and improving nutrient efficiency in ornamental plant production. Fertilization enhances plant performance; however, excessive nutrient inputs can disrupt substrate chemistry, elevate salinity, and promote nitrogen leaching—particularly in containerized systems with limited rooting volume. This study evaluated the growth, physiological performance, and soil–plant nutrient dynamics of Sabal palmetto (cabbage palm) cultivated under six fertilization regimes over 180 days in a subtropical shade-house environment. Treatments ranged from a single baseline application of 15 g per plant (T0) to a cumulative 75 g (T5) using granular slow-release fertilizer. Morphological traits (plant height: 26–70 cm; leaf number: 4–18) and physiological indices (atLEAF+: 34.3–66.4; NDVI: 0.26–0.77) were monitored every 30 days. Substrate nitrogen and carbon concentrations increased from 0.57% and 41.78% at baseline to 1.24% and 42.94% at 180 days, while foliar nitrogen ranged from 1.46% to 2.57%. Fertilization significantly influenced all parameters (p < 0.05). Higher fertilization levels elevated electrical conductivity, salinity, and nitrogen leaching, with principal component analysis revealing strong positive associations among total nitrogen, electrical conductivity, and salinity. Moderate fertilization (T2 = 45 g) maintained favorable substrate chemistry, high foliar nitrogen, and balanced canopy growth with minimal nutrient losses. Sensor-based chlorophyll indices (atLEAF+ and NDVI) correlated strongly (r = 0.71, p < 0.001), confirming their reliability as non-destructive diagnostics for nitrogen management. These findings demonstrate that integrating optical monitoring with adaptive fertilization mitigates substrate salinization, sustains ornamental quality, and promotes the sustainable cultivation of Sabal palmetto in urban horticultural systems.

Graphical Abstract

1. Introduction

The overuse of fertilizers in managed landscapes and containerized ornamental systems has become a critical environmental and agronomic concern, with direct implications for soil health, water quality, and plant performance [1]. Excessive fertilization disrupts nutrient balance in the rhizosphere, increases osmotic pressure, and promotes salt accumulation, ultimately impairing root function and reducing substrate porosity [2]. These effects occur as excessive nutrient inputs elevate the concentration of soluble ions that increase electrical conductivity (EC) and osmotic potential in the root zone [3]. The resulting ionic stress limit water uptake efficiency and alters cation–anion equilibrium, promoting salt precipitation and accumulation within the substrate matrix over time. In containerized systems with restricted rooting volume and suboptimal drainage, highly soluble ions such as nitrate (NO3), ammonium (NH4+), potassium (K+), and chloride (Cl) leach readily into surrounding environments, contaminating groundwater and surface waters [4,5,6]. These nutrient losses elevate substrate electrical conductivity (EC), alter cation exchange capacity, and contribute to eutrophication and biodiversity loss in adjacent aquatic ecosystems [7]. In coastal urban landscapes, these risks are compounded by periodic saline intrusion, which accelerates ion accumulation and exacerbates osmotic stress.
Urban horticulture is particularly vulnerable because ornamental plantings are often maintained under high-input fertilization regimes to preserve aesthetic quality [8]. The combination of small container volumes, frequent irrigation, and standardized fertilizer programs can result in cumulative salt buildup, nutrient runoff, and long-term degradation of substrate quality [9,10]. Optimizing nutrient supply to match plant demand is therefore essential to sustaining ornamental value while reducing environmental impact [11]. Precision diagnostic tools, such as proximal optical sensors—including chlorophyll meters, canopy reflectance devices, and fluorescence-based platforms—enable non-destructive, real-time monitoring of plant nitrogen status, supporting site-specific fertilization and improving nutrient-use efficiency [12,13,14]. Recent advances also integrate imaging systems with machine learning, achieving high classification accuracy of fertilization levels in containerized crops [15], and combining indices such as SPAD, atLEAF+, and NDVI to identify optimal nitrogen application rates while minimizing leaching losses [16].
Among native ornamentals, Sabal palmetto (Walter) Lodd. ex Schult. & Schult.f.—commonly known as cabbage palm—offers a valuable model for evaluating sustainable fertilization strategies. This slow-growing palm is a keystone species across the southeastern United States, ranging from the coastal plains of North Carolina through Florida and into the northern Caribbean [17]. In Florida, it occupies diverse habitats, from pine flatwoods to coastal floodplains, contributing to soil stabilization, wildlife habitat provision, and ecosystem resilience [18]. Its tolerance to drought, periodic flooding, and moderate salinity has supported its widespread use in medians, parks, bioswales, and ecological restoration projects. However, despite its adaptability, S. palmetto is physiologically sensitive to nutrient mismanagement: excessive fertilizer doses—especially in confined root zones—can elevate substrate salinity, impair nutrient uptake, and trigger stress symptoms such as chlorosis, leaf abscission, and canopy thinning [19]. Salinity trials further indicate that chlorophyll content, as measured by SPAD and NDVI, declines sharply under increasing salt concentrations, with S. palmetto exhibiting higher sensitivity than related palm species [20].
Research on palm nutrition in Florida has demonstrated that maintaining balanced nutrient ratios is fundamental for canopy vigor and long-term palm health. Broschat [21] reported that sustained use of slow-release formulations containing nitrogen (N), potassium (K), magnesium (Mg), and micronutrients prevents chronic deficiencies and minimizes leaching losses in sandy soils typical of subtropical landscapes. Conversely, excessive nitrogen inputs disrupt the N:K and N:Mg balance, intensifying potassium and magnesium deficiencies and leading to foliar chlorosis, necrosis, and canopy thinning [22]. Controlled-release fertilizers therefore represent the most effective and environmentally compatible approach to maintain consistent nutrient availability under high rainfall and irrigation conditions [21]. Comparable findings were observed in Dypsis lutescens (Arecaceae), where a controlled-release NPK formulation enhanced growth and chlorophyll indices compared with conventional fertilizers [23]. Similarly, moderate fertilization in Serenoa repens (Arecaceae) improved vegetative development without compromising physiological stability, whereas repeated high nutrient applications suppressed carbohydrate allocation and canopy persistence [24]. Collectively, these studies emphasize that nutrient balance, release kinetics, and species-specific responses are critical determinants of sustainable ornamental palm cultivation in managed landscapes.
Despite the horticultural and ecological prominence of Sabal palmetto, research addressing its nutrient dynamics remains absent. To date, no studies have examined fertilization responses, nutrient partitioning, or optical-sensor diagnostics in S. palmetto, marking the present work as the first reported investigation of nutrient management in this native palm species. Considering the expanding use of palms as landscape materials and bio-adaptive ornamentals worldwide [25], establishing fertilization benchmarks for S. palmetto is essential to sustain canopy vigor and reduce salinity risks under containerized and nursery conditions. The present study integrates optical chlorophyll sensing (SPAD, atLEAF+, NDVI) with substrate and foliar chemical analyses to elucidate soil–plant nutrient interactions across six graded fertilization regimes. By quantifying growth responses, physiological performance, and chemistry interaction, this study establishes evidence-based thresholds for nutrient efficiency that sustain ornamental palm quality, minimize leaching losses, and promote sustainable production under nursery conditions.

2. Materials and Methods

2.1. Experimental Site and Plant Material

The experiment was conducted over 180 days, from September 2021 to March 2022, at the Organic Garden shade house of Florida International University (FIU) in Miami, Florida, USA (25°45′14″ N, 80°22′48″ W) at 7 m.a.s.l. The region experiences a subtropical climate with distinct wet and dry seasons. During the study period, total precipitation was 620 mm, with peaks in September (180 mm) and March (137 mm), and dry months (<75 mm) from November to February [26].
Uniform six-month-old Sabal palmetto (cabbage palm) plants were sourced from a commercial nursery (Santa Barbara Nursery, Miami, FL, USA). Each plant was already established in a 12-L plastic container (28 cm diameter × 24 cm height) filled with a commercial nursery substrate. Containers were placed under a shade net, maintaining photosynthetically active radiation (PAR) at 750 μmol m−2 s−1, and were exposed to ambient temperature and light conditions. Irrigation was applied uniformly across treatments to maintain consistent substrate moisture and prevent water stress, following the environmental management protocol described by Sharma et al. [27].

2.2. Experimental Design and Fertilizer Application

A completely randomized design (CRD) was implemented with six fertilization treatments to assess the interaction between baseline and supplemental fertilizer applications. A slow-release granular fertilizer (Harrell’s® 8N–3P–9K) was incorporated into the top 5 cm of substrate [28] at baseline, with additional topdressings applied seasonally in November and March. Each treatment was replicated five times (n = 30 plants).
The control (T0) received a single 15 g application at baseline. Treatments T1–T5 varied in initial fertilizer dose (15, 30, or 45 g) and the number of 15 g supplemental applications, resulting in cumulative totals ranging from 15 to 75 g per plant by the end of the experiment (Table 1). This treatment gradient simulated increasing fertilization scenarios commonly observed in urban landscaping.

2.3. Morphological and Physiological Measurements

Morphological and physiological traits were assessed at seven time points: 0, 30, 60, 90, 120, 150, and 180 days after treatment (DAT). At each sampling interval, five plants per treatment were evaluated for plant height, number of leaves, chlorophyll content (SPAD and atLEAF+), and canopy greenness (NDVI).
Plant height was measured as the average of two values: one from the substrate surface to the apex of a fully expanded frond, and another to the apex of a developing frond. The number of fully expanded fronds per plant was also recorded. Chlorophyll content was estimated non-destructively using two handheld optical sensors: the SPAD-502 (Konica Minolta, Osaka, Japan) and the atLEAF+ (FT Green LLC, Wilmington, DE, USA). Measurements were taken on the third fully expanded frond, with three readings averaged per plant, following the protocol of [29].
Canopy greenness was quantified using a GreenSeeker™ handheld sensor (Trimble Inc., Sunnyvale, CA, USA) to record NDVI (Normalized Difference Vegetation Index). The sensor was positioned 45 cm above the plant canopy, and five measurements were collected per plant and averaged [30]. All readings were taken between 9:00 and 14:00 h under stable midday light conditions to reduce environmental variability, in accordance with the procedures by Neupane et al. [31] and Nogueira Souza Costa and Khoddamzadeh [32].

2.4. Leachate and Salinity Monitoring

Leachate was collected at each sampling interval to evaluate salt accumulation and nutrient mobility. The pour-through extraction method [33] was used, in which containers were irrigated to field capacity and then received 350 mL of deionized water to displace the substrate solution.
Electrical conductivity (EC; µS cm−1) and salinity (ppm) of the leachate were measured in situ using a calibrated ExStik® EC500 handheld multiparameter probe (EXTECH Instruments, FLIR Commercial Systems, Goleta, CA, USA).
Immediately after measurement, a 50 mL aliquot of each leachate sample was transferred into sterile polypropylene vials, stored at 4 °C to minimize microbial transformation and nutrient loss during holding [34], and transported under cold-chain conditions to the Nutrient Analysis Core Facility of the Center for Aquatic Chemistry and the Environment (CAChE) at Florida International University for determination of total nitrogen (TN, ppm). Total nitrogen was quantified using an Antek chemiluminescence TN analyzer (Antek Instruments, Houston, TX, USA), which determines total nitrogen through high-temperature catalytic combustion followed by nitric oxide detection [35].

2.5. Carbon and Nitrogen Analysis in Tissue and Substrate

Total nitrogen (TN, %) and total carbon (TC, %) concentrations were quantified in both foliar and substrate samples to assess nutrient partitioning and accumulation over time. Foliar samples were collected from the third fully expanded fronds, which represent metabolically stable tissue suitable for nutrient diagnostics [36]. Substrate samples were taken from the top 15 cm of the growing medium—corresponding to the active root zone—at both the start 0 DAT and the conclusion at 180 DAT of the experiment, following protocols adapted from Sharifi et al. [37].
All samples were oven-dried at 70 °C for 48 h and ground to a fine, homogeneous powder using a planetary ball mill. Elemental analysis was conducted using a Carlo Erba NA1500 Series 1 elemental analyzer, following FIU Standard Operating Procedure SOP-012 and U.S. EPA Method 440.0. Calibration standards and quality assurance procedures adhered to USGS methodologies for quantifying organic carbon and nitrogen in environmental matrices. All chemical analyses were performed with five biological replicates per treatment.

2.6. Statistical Analysis

Statistical analyses were conducted in R (version 4.5.1; [38]). An integrated analytical framework was implemented to evaluate treatment effects on morpho-physiological traits of Sabal palmetto under the different fertilization doses. This framework combined exploratory diagnostics, linear mixed-effects modeling (LMM), and multivariate techniques (ESM 1).
Before model fitting, exploratory data analysis was conducted following [39] to assess data distribution, detect outliers, verify homoscedasticity, and check for multicollinearity. Visual diagnostics were generated using the inti 0.6.9 R package [40], and residuals were interpreted following the criteria of Kozak and Piepho [41].
To model plant responses, a linear mixed-effects model was constructed with fixed effects for days after transplanting ( days ) and fertilizer treatment ( treatment ), and a random intercept for replication (rep). The model was specified as:
y i j k = β 0 + β 1 days i + β 2 treatment j + b k + ε i j k
where y i j k represents the observed plant height at day i , under treatment j , in replication k ; β 0 is the overall intercept; β 1 and β 2 are fixed-effect coefficients; b k N 0 , σ b 2 is the random effect associated with replication; and ε i j k N 0 , σ 2 is the residual error.
The model was fitted using the lmer() function from the lme4 1.1-37 package [42]. Fixed effects were tested using Type III ANOVA with the car 3.1-3 package [43]. Post hoc pairwise comparisons were performed on estimated marginal means (EMMs) using the emmeans 2.0.0 package [44], and groupings were visualized with compact letter displays (CLDs) generated by the multcomp 1.4-29 package [45].
To reduce dimensionality and identify trait contributions to treatment-driven variability, Principal Component Analysis (PCA) was performed on standardized morphological and physiological variables, including plant height, leaf number, SPAD, atLEAF+, and NDVI indices. PCA was conducted using the FactoMineR 2.12 R package [46], and the contribution of each trait to principal components was interpreted using eigenvalue decomposition. Pearson’s correlation coefficients were computed between physiological and chemical variables—including foliar nitrogen content, leachate total nitrogen, electrical conductivity, and substrate salinity—using the psych 2.5.6 package [47]. PCA biplots and correlation matrices were used to visualize covariation patterns. All statistical tests were evaluated at a significance level of α = 0.05.
All visualizations were generated using the ggplot2 4.0.0 package [48] and arranged using the cowplot 1.2.0 package [49]. This workflow allowed the evaluation of treatment effects during plant development and substrate nutrient responses across fertilization regimes.

3. Results

3.1. Morphological and Physiological Responses to Fertilization Treatments

To evaluate the response of Sabal palmetto to increasing fertilizer inputs, morphological and physiological traits were assessed over a 180-day cultivation period to quantify plant performance. These measurements provide an integrated view of growth dynamics and canopy development in response to varying nutrient supply.
Fertilization treatments significantly influenced all measured parameters (p < 0.05; Figure 1). Plant height (Figure 1A) showed clear differentiation among treatments across all time points. Initial heights ranged from 40.50 cm in T4 to 48.13 cm in T5. By day 180, T5 reached the greatest average height (54.48 cm), followed by T2 (53.06 cm) and T3 (50.22 cm). T0 and T1 exhibited intermediate final heights (49.48 cm and 49.41 cm, respectively), while T4 remained the shortest (46.85 cm). Leaf production (Figure 1B) increased over time in all treatments. Baseline leaf counts ranged from 6.02 (T1) to 6.71 (T2). Maximum counts occurred at day 120 in T2 (8.73) and T5 (8.62) and remained highest at day 180 (8.11 and 8.00, respectively). T1 maintained the lowest final leaf number (7.42).
Chlorophyll content measured with the atLEAF+ sensor (Figure 1C) increased until stabilizing near day 90. Initial values ranged from 44.14 (T4) to 47.31 (T5). At day 180, the highest chlorophyll indices were recorded in T5 (55.63), followed by T3 (54.71), T1 (53.92), and T2 (53.39). T0 and T4 recorded the lowest final values (52.46 and 52.66, respectively). Chlorophyll index from atLEAF+ were positively correlated with SPAD measurements (r =0.81, p < 0.001; Supplementary Figure S1). Canopy greenness, assessed by NDVI (Figure 1D), followed trends similar to chlorophyll accumulation. Baseline NDVI ranged from 0.41 (T1) to 0.49 (T5). Divergence among treatments was evident from day 60 onwards. By day 180, T5 recorded the highest NDVI (0.68), followed by T4 and T3 (0.65), T2 and T0 (0.63), and T1 (0.60).
These results confirm that elevated fertilization rates enhance canopy reflectance and overall photosynthetic activity, reflecting improved physiological performance of Sabal palmetto under nutrient-enriched conditions.

3.2. Substrate Chemical Properties and Leachate Dynamics

To assess the impact of increasing fertilizer inputs on substrate chemistry, electrical conductivity (EC), salinity, and total nitrogen (TN) in leachate were monitored throughout the 180-day cultivation period. These measurements provide an integrated view of nutrient release, salt accumulation, and leaching patterns under varying fertilization regimes.
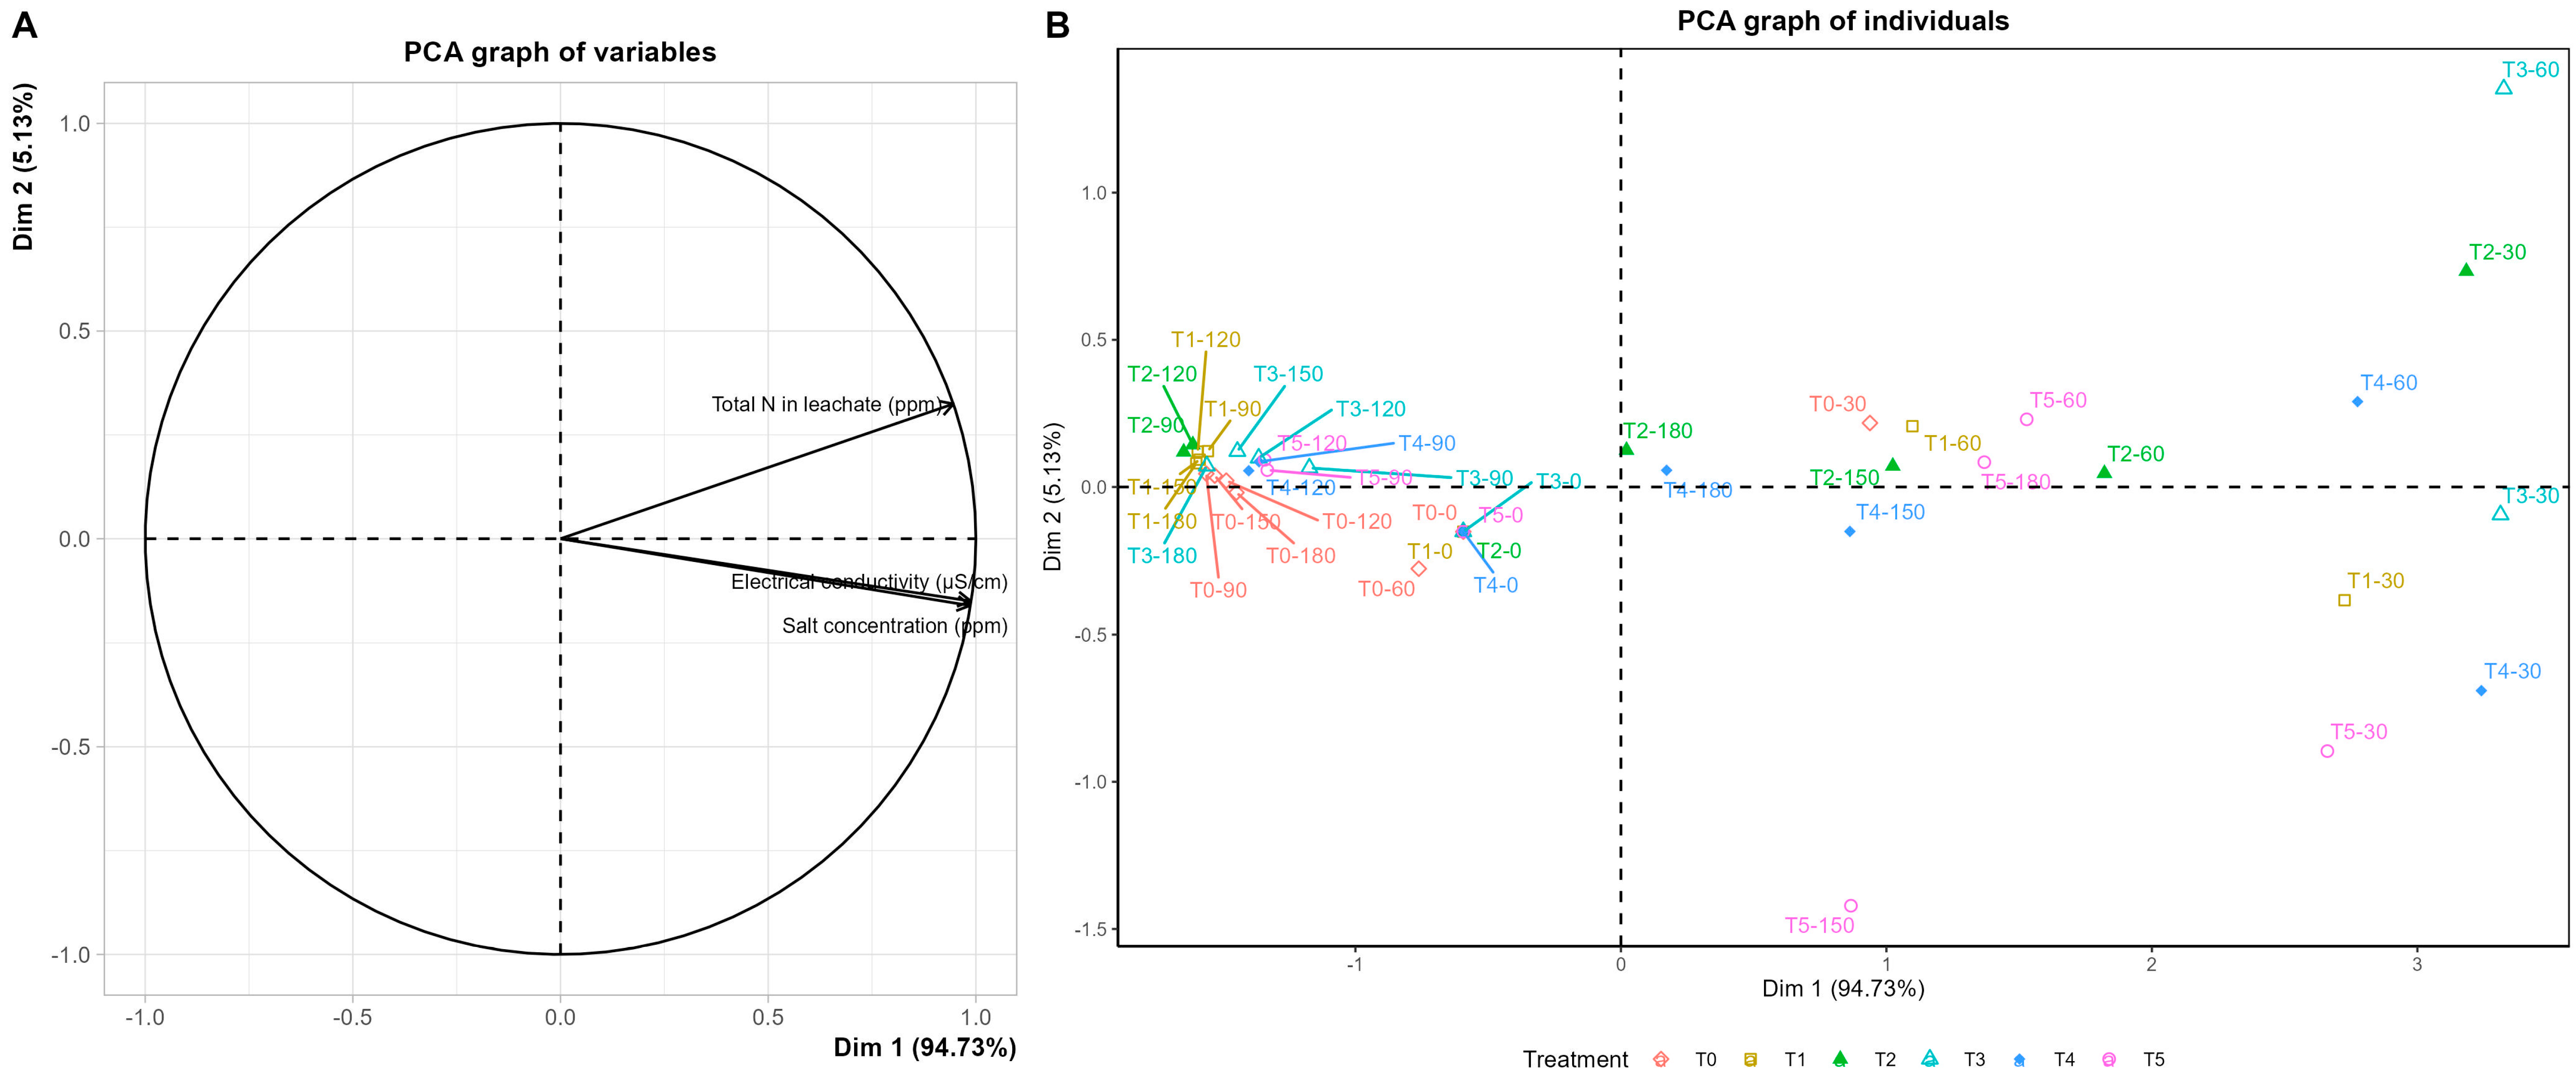
Fertilization treatments significantly affected EC, salinity, and TN concentrations in leachate over time (p < 0.05; Figure 2). The highest TN concentrations were recorded at day 60 in T3 (313.50 ppm), T4 (216.75 ppm), and T2 (156.75 ppm), corresponding with the first supplemental fertilizer application. By day 90, TN levels declined across all treatments.
At day 180, residual TN in leachate was highest in T5 (138.63 ppm), followed by T4 (82.14 ppm) and T2 (79.83 ppm). T0 and T1 recorded the lowest final concentrations (2.98 and 2.91 ppm, respectively). EC and salinity exhibited patterns like TN, with peak values at day 60 in T3, T4, and T5.
The principal component analysis (PCA, Figure 2), the first two dimensions explained 99.86% of the total variance in the dataset. Dimension 1 accounted for 94.73% of the variance, while Dimension 2 explained 5.13%. The remaining dimensions contributed less than 0.2% of the total variance.
The PCA for the variables (Figure 2A), the three evaluated variables—electrical conductivity (EC), salinity, and total nitrogen in leachate (TN)—all loaded positively on Dimension 1, with relative contributions of 34.3% for EC, 34.2% for salinity, and 31.5% for TN (ESM 1). All three variables were oriented in the same direction within the correlation circle, with long and closely aligned vectors, indicating a positive association among them and a similar weight in the construction of Dimension 1. In Dimension 2, contributions were lower, and no change in the direction of association among the variables was observed.
PCA for the individuals (Figure 2B), the sample distribution showed distinct groupings according to treatment and sampling time. Samples from treatments T3 and T2 at days 30 and 60 were positioned in the upper right quadrant, with positive scores on both dimensions and located near the directions of EC, salinity, and TN. The most extreme positions along Dimension 1 corresponded to T3–30 and T2–30, followed by T3–60 and T2–60. Samples from treatments T0, T1, and T4 at day 180 clustered near the origin or in the lower quadrants, with low or negative scores on Dimension 1. Several of these samples (T0–90, T0–150, T1–180) were in the lower left quadrant.
Treatment T5 exhibited a wide dispersion across the PCA space. Samples T5–0, T5–60, and T5–120 were positioned close to the origin, while T5–30 was in the lower right quadrant. Sample T5–150 appeared isolated in the lower part of the plot, with a markedly negative score on Dimension 2. Intermediate positions were observed for samples such as T1–120 and T2–90, located in the positive zone of Dimension 1 with moderate scores on Dimension 2. Samples from T4 showed a heterogeneous distribution: T4–60, T4–90, and T4–120 were placed in the positive half of Dimension 1, whereas T4–150 and T4–180 were located near the origin.
Overall, the results show that increasing fertilization rates increase electrical conductivity, salinity, and total nitrogen in the leachate. The PCA confirmed a positive association among these variables and a clear differentiation among treatments, indicating that higher fertilizer doses led to greater mineralization and salt accumulation in the substrate.

3.3. Foliar Nitrogen Partitioning and Substrate Nutrient Availability

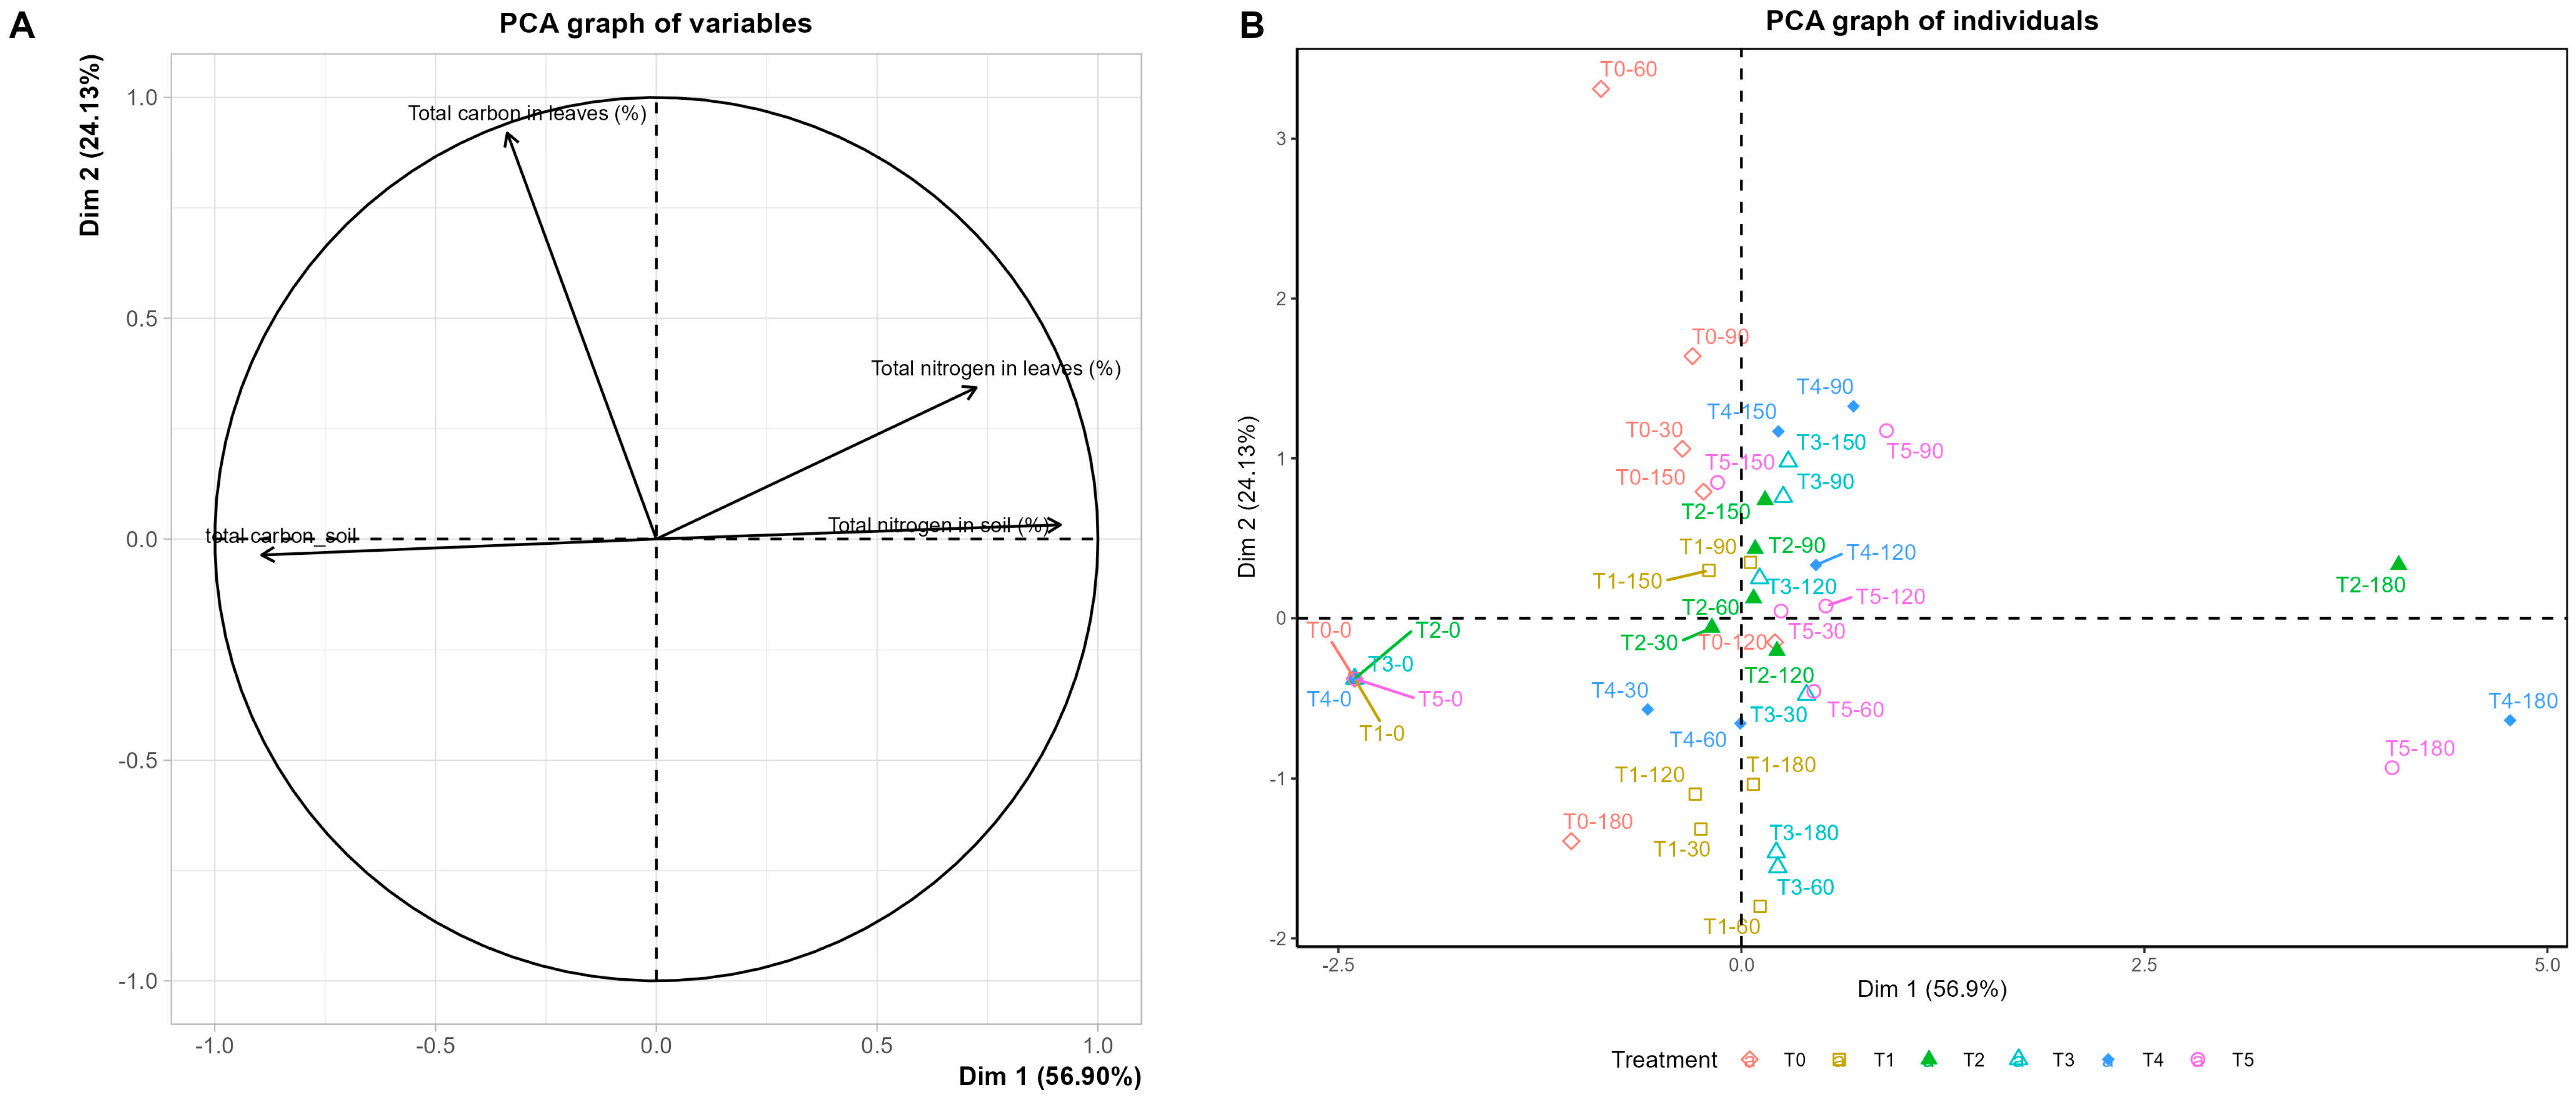
To evaluate the effects of increasing fertilizer inputs on nutrient partitioning, total nitrogen (TN) and total carbon (TC) concentrations in foliage and substrate were monitored over a 180-day cultivation period. Principal component analysis (PCA) was applied to integrate these variables, allowing the identification of dominant nutrient allocation patterns and the separation of treatments and sampling times (Figure 3).
The principal component analysis (PCA) formed the first two main dimensions that together explained 81.03% of the total variance in the dataset. Dimension 1 accounted for 56.90% of the variance, while Dimension 2 explained 24.13%. The remaining dimensions each contributed less than 10% of the variance (Figure 3A).
PCA of variables (Figure 3A), total nitrogen in soil (%), and total nitrogen in leaves (%) loaded positively on Dimension 1, with contributions of 36.81% and 23.06%, respectively. Total carbon in soil (%) loaded negatively along Dimension 1, positioned opposite to the nitrogen variables. Total carbon in leaves (%) was primarily associated with Dimension 2, contributing 87.57% to this axis. The vectors for total nitrogen in soil and foliage were oriented in a similar direction, indicating a positive association between these two variables, while the vector for total carbon in soil was oriented in the opposite direction along Dimension 1. The vector for total carbon in leaves was aligned mainly with the vertical axis (Dimension 2).
PCA for individuals (Figure 3B), treatment-related variation was evident in the distribution of samples. At day 180, samples from T2, T4, and T5 were located on the positive side of Dimension 1, corresponding to higher nitrogen concentrations in both foliage and soil. In particular, T2–180 and T4–180 were positioned at the positive extreme of Dimension 1, with concurrent increases in foliar and soil nitrogen content. T5–180 was also located in the positive sector of Dimension 1 but slightly lower on Dimension 2.
In contrast, samples from the initial stage of the experiment (e.g., T0–0, T3–0, T5–0) were positioned on the negative side of Dimension 1, indicating uniformly low nitrogen content at the start. Early sampling points for T0, T1, and T3 were clustered near the origin or in the negative sector of Dimension 1. Across the experiment, T0 and T1 remained within the negative-to-neutral range of both dimensions, reflecting lower nitrogen accumulation and reduced correspondence between foliar and soil nitrogen levels. Samples positioned in the upper half of the biplot (e.g., T0–60, T0–90, T4–60, T4–90, T4–150, T5–90, T3–150) displayed higher scores on Dimension 2, which corresponded to higher total carbon in leaves. Lower-half samples (e.g., T3–60, T3–180, T1–180) showed negative scores on Dimension 2, indicating comparatively lower foliar carbon content.
Overall, these results demonstrate that fertilization promoted nitrogen enrichment at the expense of carbon accumulation, highlighting a nutrient trade-off between nitrogen uptake and carbon allocation in Sabal palmetto.

4. Discussion

Sabal palmetto is a slow-growing palm with an extended establishment period. In nutrient-poor Florida habitats, height increases average less than 0.5 cm annually over two decades [50], with seedlings often requiring 10–15 years before trunk formation. Mature individuals, aged 50–70 years, elongate trunks at ~15 cm per year [51]. Projected climate-driven distribution shifts for this species remain relatively favorable compared to other southeastern U.S. palms [52], but its slow maturation and limited dispersal ability underscore the importance of early, precise nutrient management to sustain canopy health under changing environmental conditions. Given this conservative growth rate, early detection of nutrient stress is critical for maintaining canopy quality and ecological function. Proximal optical sensors, such as NDVI and chlorophyll meters, offer timely, non-destructive diagnostics that can inform fertilization before irreversible canopy decline [19,20,53]. This study integrated morphological measurements, physiological indicators, and soil–plant nutrient dynamics to evaluate S. palmetto performance under graded fertilization regimes in a containerized system over 180 days (Figure 1, Figure 2 and Figure 3; Supplementary Figure S1). By integrating sensor-based diagnostics with substrate chemical monitoring, this work provides evidence-based recommendations for nutrient management of native ornamentals in salinity-prone urban landscapes [16]. Results demonstrated that nutrient input significantly influenced vegetative traits, with moderate fertilization sustaining growth while reducing nutrient losses—a key outcome for sustainable nutrient management in urban landscapes.

4.1. Nutrient Input Influenced Vegetative Performance

Despite these growth benefits, elevated fertilizer rates (T3, T4, T5) resulted in significant nutrient leaching, particularly within the first 60 days post-application (Figure 2). Leachate analysis revealed sharp peaks in total nitrogen timed with supplemental fertilization, accompanied by concurrent increases in electrical conductivity and salinity—highlighting how nutrient oversupply can overwhelm uptake capacity and destabilize substrate quality [54]. Visually, higher nutrient inputs (T4, T5) resulted in denser canopies and deeper green foliage compared to the control and low-input treatments (T0, T1), reinforcing the well-established link between nitrogen availability, chlorophyll accumulation, and perceived landscape quality (Figure 1C,D). However, these short-term aesthetic gains must be weighed against the environmental and physiological costs of oversupply, which in containerized systems can rapidly induce electrical conductivity buildup, ionic toxicity, and reductions in substrate quality [55].
These insights are particularly relevant for S. palmetto, whose slow nutrient turnover and conservative growth habit limit responsiveness to surplus fertilization, in contrast to fast-growing ornamentals that can temporarily capitalize on higher nutrient availability [56]. Overfertilization in such slow-growing species not only fails to accelerate structural development but also increases the risk of nutrient leaching into surrounding environments—an outcome with direct implications for water quality in urban landscapes [57,58].

4.2. Balance Between Growth Promotion and Reduced Nutrient Losses

The findings highlight the pronounced vulnerability of containerized substrates to rapid nutrient depletion and ionic imbalance when fertilization rates exceed plant uptake capacity—process that accelerates salt accumulation and exacerbates salinity hazards, even in non-saline irrigation contexts [59]. Principal component analysis revealed a strong positive correlation between leachate total nitrogen, electrical conductivity, and salt concentration (Figure 2B), confirming that excessive nutrient loading promotes substrate salinization [60,61]. Similar patterns have been documented in both ornamental and agricultural systems where high fertilizer inputs increased osmotic stress, disrupted cation–anion balance, and reduced root hydraulic conductivity [62]. These chemical shifts can impair root physiological function, diminish microbial diversity, and compromise long-term substrate integrity [63].
In contrast, moderate nutrient inputs—exemplified by treatment T2—maintained high chlorophyll content and foliar nitrogen concentrations (Figure 1C,D) while minimizing leachate nutrient losses (Figure 2B). This outcome aligns with prior containerized palm studies where intermediate fertilizer rates optimized canopy vigor and ornamental quality while reducing nitrogen runoff [64,65]. Nutrient partitioning analyses further revealed that T2-180 and T4-180 retained elevated nitrogen levels in both foliage and substrate (Figure 3B), indicating that targeted fertilization sustains plant metabolic activity without contributing to the rapid ionic accumulation observed under high-input treatments.
Comparatively, the positive association between leachate nitrogen, electrical conductivity, and salinity observed here parallels the patterns reported by Carey et al. [66], who demonstrated that containerized systems are particularly susceptible to nutrient leaching and salt buildup under excessive application regimes. Moreover, the persistence of canopy vigor in moderately fertilized Sabal palmetto parallels findings in other slow-growing ornamentals, where optimized nutrient dosing improved nitrogen-use efficiency and minimized nutrient losses without compromising visual quality [16].
Importantly, emerging evidence indicates that improvements in nutrient efficiency of containerized palms may also be mediated by silicon amendments. In native South Florida landscaping species, including Sabal palmetto, silicon supplementation enhanced NDVI and in some cases sustained chlorophyll content, reflecting a positive influence on nitrogen assimilation and canopy stability under stress conditions [67]. Similar enhancements in chlorophyll a, photosynthetic rate, and nitrogen accumulation have been documented in oil palm seedlings treated with calcium silicate, confirming silicon’s capacity to stimulate nutrient uptake and canopy vigor [68]. Beyond nutrient dynamics, silicon has also been shown to buffer cabbage palm seedlings against moderate saltwater intrusion, maintaining SPAD and NDVI indices and extending resilience thresholds under rising salinity [20]. Furthermore, silicon-enriched fertilizers have effectively suppressed Ganoderma boninense-induced basal stem rot in oil palm and betel nut palm, reducing disease incidence by more than 50% and reinforcing root cell wall defenses [69]. Together, these findings reinforce the concept that sustainable palm production requires not only fertilization but also complementary biostimulant strategies that simultaneously mitigate nutrient losses, enhance resilience to abiotic and biotic stressors, and safeguard substrate integrity.

4.3. Monitoring Nutrient Status Under Non-Destructive Diagnostics

Morphologically, moderate nutrient enhancement—particularly treatment T2—achieved a balanced outcome, promoting increased plant height, leaf number, and canopy density (Figure 1A,B; Supplementary Figure S2) while avoiding the excessive electrical conductivity and nutrient leaching observed in higher-input treatments (Figure 2B). Physiologically, chlorophyll content (measured via atLEAF+) and canopy greenness (NDVI) closely mirrored fertilization intensity (Figure 1C,D) [70], reinforcing the utility of proximal optical sensors for real-time nitrogen status assessment in S. palmetto.
In this study, the correlation among SPAD, atLEAF+, and NDVI values was not intended to estimate absolute chlorophyll concentration but to evaluate cross-sensor consistency and the reliability of low-cost, non-destructive optical diagnostics. The significant correlation between SPAD and atLEAF+ (r = 0.81, p < 0.001) confirmed that both instruments captured similar physiological responses to nitrogen availability, consistent with prior validation work by Markwell et al. [71] and Zhu et al. [72]. Because SPAD and atLEAF+ meters operate under similar optical principles—measuring relative chlorophyll content based on transmittance at 650–660 and 940 nm—their demonstrates their equivalency and practicality for monitoring chlorophyll dynamics in slow-growing palms. Furthermore, the positive relationship between these chlorophyll indices and NDVI indicates that leaf-level pigment changes are reflected at the canopy scale, validating the integration of proximal and canopy sensing for real-time assessment of nutrient status and canopy vigor.
This strong correlation between sensor-derived indices and foliar nitrogen aligns with [73] documented high R2 values (≥0.80) between SPAD/Dualex measurements and leaf nitrogen across multiple woody nursery species, while [74] reviewed the efficacy of optical parameters in estimating plant nitrogen status non-destructively. Moreover, integrated sensor-based monitoring in containerized cocoplum—a Florida native ornamental—demonstrated that moderate fertilization sustained plant health while reducing nutrient runoff, corroborating the value of these tools in similar ecological contexts [32].
The negative relationship observed between total nitrogen inputs and soil carbon concentration (Figure 3A) suggests that repeated nutrient enrichment may disrupt substrate C:N ratios, potentially accelerating the mineralization and depletion of organic matter [75]. While microbial activity was not directly measured in this study, similar declines in substrate carbon pools following chronic fertilization have been reported in ornamental production systems, often linked to shifts in microbial community composition and reduced carbon sequestration potential [1].
From a management perspective, integrating chlorophyll and canopy reflectance sensing (Figure 1C,D) with leachate and substrate chemical diagnostics (Figure 2) provides an effective decision-support framework for adaptive fertilization in ornamental landscapes [30,76]. These tools enable alignment of nutrient supply with plant demand, thereby reducing the risk of overfertilization while sustaining ornamental quality. In the case of S. palmetto, which serves both structural and ecological functions in urban green infrastructure, maintaining optimal nutrient status is essential not only for visual performance but also for long-term resilience—particularly in coastal and salt-affected environments.
Despite these advances, certain limitations must be acknowledged. The experimental setup—a shade-house system with containerized palms—does not fully capture the hydrological complexity, microbial diversity, and nutrient cycling processes present in in-ground or coastal plantings. Nutrient leaching, evapotranspiration rates [77], and salinity accumulation [18] may differ under field conditions due to variable infiltration, drainage, and biotic interactions. Additionally, this study did not quantify microbial activity, organic matter mineralization rates, or root–microbiome associations, factors known to mediate nutrient availability and soil organic carbon retention. Furthermore, although treatments were analyzed as cumulative fertilizer totals, the timing of each application differed, potentially affecting nutrient availability, leaching patterns, and plant uptake dynamics. Due to budgetary constraints, only two replicates per treatment were available for chemical analyses. Consequently, a principal component analysis (PCA) (Figure 2 and Figure 3) was used as an exploratory approach to integrate chemical, leachate, and foliar nutrient data, following the recommendations of Zuur et al. [39] for low-replication datasets. While NDVI and chlorophyll meters proved effective for detecting nutrient stress, species-specific intervention thresholds for S. palmetto under diverse environmental conditions remain to be established.
Future research should validate these findings in field-scale, salt-affected, and urban coastal environments where S. palmetto contributes to both aesthetic and ecological services. Trials combining sensor-based monitoring with adaptive fertilization schedules in in-ground systems would improve understanding of nutrient–salinity trade-offs under real-world conditions. Moreover, adopting a full factorial design that independently evaluates fertilizer rate and application timing could provide more detailed insights into their interactive effects on nutrient dynamics and plant performance. Additionally, integrating microbial and organic matter dynamics into fertilization models could enhance substrate biological health and long-term plant productivity. Such approaches would ultimately support the development of predictive fertilization frameworks that optimize ornamental quality while minimizing nutrient runoff and salinity accumulation—key objectives for sustainable landscape management.

5. Conclusions

This study demonstrates that while higher fertilizer doses can enhance the growth, canopy vigor, and chlorophyll content of Sabal palmetto, they also increase substrate salinity and nutrient leaching, posing risks to long-term plant performance and environmental quality. Moderate fertilization rates, such as those applied in T2, achieved an optimal balance between sustained growth and reduced nutrient losses, emphasizing the need to align fertilizer supply with plant demand. The integration of optical sensing technologies with substrate and leachate analyses provided early, non-destructive diagnostics for nutrient status, offering a practical framework for adaptive fertilization management. As a slow-growing native palm valued for both ecological and ornamental functions, S. palmetto benefits from fertilization strategies that maintain visual quality while protecting soil and water resources. Future research should focus on long-term field validations under variable salinity and soil conditions, incorporate root physiological and microbial analyses, and develop predictive fertilization models integrating sensor-based monitoring to improve nutrient-use efficiency and ensure sustainable management of S. palmetto.

Supplementary Materials

The following supporting information can be downloaded at: https://www.mdpi.com/article/10.3390/soilsystems9040121/s1, Figure S1: Pairwise correlation matrix of morphological, physiological, and substrate-level traits in Sabal palmetto after 180 days under differential nitrogen fertilization. Variables include fertilizer treatment, days after transplant, plant height, leaf count, SPAD-502 and atLEAF+ chlorophyll indices, GreenSeeker™ NDVI, substrate electrical conductivity (EC), soil salinity, nitrogen content in leachate, foliar nitrogen percentage, and nitrogen in the soil. Histograms along the diagonal illustrate variable distributions; scatterplots in the lower triangle display bivariate relationships with 95% confidence ellipses; and the upper triangle reports Pearson correlation coefficients (r), with significance levels denoted by asterisks (p < 0.05 *; p < 0.01 **; p < 0.001 ***). The matrix reveals key associations among sensor-derived indices, growth parameters, and nitrogen dynamics, supporting the use of proximal optical tools for monitoring nitrogen use efficiency in palms grown in salt-impacted substrates. Figure S2: Visual growth responses of Sabal palmetto after 180 days under granular fertilizer (Harrell’s® 8N–3P–9K) treatments. The treatments represent increasing cumulative fertilizer inputs: T0 = 15 g, T1 = 30 g, T2 = 45 g, T3 = 45 g, T4 = 60 g, and T5 = 75 g. These images provide a visual reference for assessing plant performance and substrate response under varying fertilization levels in urban landscape conditions.

Author Contributions

Conceptualization: A.A.K. and B.N.S.C.; Methodology: A.A.K.; Investigation: B.N.S.C. and M.N.M.-S.; Software, data curation, formal analysis, visualization and original draft preparation: M.N.M.-S.; Resources: A.A.K.; Review and editing: A.A.K., B.N.S.C. and M.N.M.-S.; Supervision and project administration: A.A.K.; Funding acquisition: A.A.K. All authors have read and agreed to the published version of the manuscript.

Funding

This research was financially supported by the Agricultural Marketing Service of the United States Department of Agriculture (USDA) under Grant No. AM200100XXXXG037 and Florida Department of Agriculture & Consumer Services (FDACS). The findings and conclusions presented are those of the authors and do not necessarily reflect the views or policies of the USDA.

Data Availability Statement

The datasets generated and analyzed during the current study are available from the corresponding author upon reasonable request. The R code used for statistical analysis is also available, subject to institutional data-sharing policies.

Acknowledgments

The authors gratefully acknowledge Daniel Tucker, Alejandra Carrillo, Amir Sabir, and Regina Gonzalez as well as the staff at FIU’s Conservation and Sustainable Horticulture Lab for their invaluable assistance in field data collection. This is contribution #2073 from the Institute of Environment at Florida International university.

Conflicts of Interest

The authors declare no conflicts of interest.

References

  1. Dincă, L.C.; Grenni, P.; Onet, C.; Onet, A. Fertilization and Soil Microbial Community: A Review. Appl. Sci. 2022, 12, 1198. [Google Scholar] [CrossRef]
  2. Dervash, M.A.; Yousuf, A.; Bhat, M.A.; Ozturk, M. Soil Stress Ecology: Concept, Impacts, and Management Strategies. In Soil Organisms; SpringerBriefs in Microbiology; Springer Nature: Cham, Switzerland, 2024; pp. 25–38. ISBN 978-3-031-66292-8. [Google Scholar]
  3. Lozano-Isla, F.; Campos, M.L.O.; Endres, L.; Bezerra-Neto, E.; Pompelli, M.F. Effects of Seed Storage Time and Salt Stress on the Germination of Jatropha curcas L. Ind. Crops Prod. 2018, 118, 214–224. [Google Scholar] [CrossRef]
  4. Chowdhury, M.; Watson, O.; Samarakoon, U.C.; Altland, J.E.; Moine, J. Evaluation of Liquid Organic Fertilizers for Containerized Production under Controlled Environment. HortScience 2025, 60, 757–764. [Google Scholar] [CrossRef]
  5. Khoddamzadeh, A.A.; Dunn, B.L. Application of Optical Sensors for Nitrogen Management in Chrysanthemum. HortScience 2016, 51, 915–920. [Google Scholar] [CrossRef]
  6. Freidenreich, A.; Barraza, G.; Jayachandran, K.; Khoddamzadeh, A.A. Precision Agriculture Application for Sustainable Nitrogen Management of Justicia Brandegeana Using Optical Sensor Technology. Agriculture 2019, 9, 98. [Google Scholar] [CrossRef]
  7. Kianpoor Kalkhajeh, Y.; Huang, B.; Hu, W.; Ma, C.; Gao, H.; Thompson, M.L.; Bruun Hansen, H.C. Environmental Soil Quality and Vegetable Safety under Current Greenhouse Vegetable Production Management in China. Agric. Ecosyst. Environ. 2021, 307, 107230. [Google Scholar] [CrossRef]
  8. McBride, K.; Henny, R.J.; Chen, J.; Mellich, T.A. Effect of Light Intensity and Nutrition Level on Growth and Flowering of Adenium obesum ‘Red’ and ‘Ice Pink’. HortScience 2014, 49, 430–433. [Google Scholar] [CrossRef]
  9. Padilla, F.M.; Gallardo, M.; Peña-Fleitas, M.T.; De Souza, R.; Thompson, R.B. Proximal Optical Sensors for Nitrogen Management of Vegetable Crops: A Review. Sensors 2018, 18, 2083. [Google Scholar] [CrossRef] [PubMed]
  10. Ravikumar, S.; Vellingiri, G.; Sellaperumal, P.; Pandian, K.; Sivasankar, A.; Sangchul, H. Real-Time Nitrogen Monitoring and Management to Augment N Use Efficiency and Ecosystem Sustainability–A Review. J. Hazard. Mater. Adv. 2024, 16, 100466. [Google Scholar] [CrossRef]
  11. Wang, Z.; Poudyal, S.; Kopp, K.; Zhang, Y. Response of Ornamental Plants to Salinity: Impact on Species-Specific Growth, Visual Quality, Photosynthetic Parameters, and Ion Uptake. Front. Plant Sci. 2025, 16, 1611767. [Google Scholar] [CrossRef]
  12. Argento, F.; Merz, Q.; Perich, G.; Anken, T.; Walter, A.; Liebisch, F. A Comparison of Proximal and Remote Optical Sensor Platforms for N Status Estimation in Winter Wheat. Comput. Electron. Agric. 2025, 232, 110110. [Google Scholar] [CrossRef]
  13. Mitra, B.; Singha, P.; Roy Chowdhury, A.; Sinha, A.K.; Skalicky, M.; Laing, A.M.; Alamri, S.; Hossain, A. Optical Sensor-Based Nitrogen Management: An Environmentally Friendly and Cost-Effective Approach for Sustainable Wheat (Triticum aestivum L.) Production on Eastern Plains of India. Front. Sustain. Food Syst. 2023, 7, 1153575. [Google Scholar] [CrossRef]
  14. Sairam, M. Hand-Held Optical Sensors for Optimizing Nitrogen Application and Improving Nutrient Use Efficiency. Int. J. Bioresour. Sci. 2023, 10, 9–18. [Google Scholar] [CrossRef]
  15. Yu, P.; Qin, K. Exploring a Cost-Effective Way for Nutrient Management with Machine Learning for Container Plants. Technol. Hortic. 2025, 5, e012. [Google Scholar] [CrossRef]
  16. Khoddamzadeh, A.A.; Souza Costa, B.N. Best Nitrogen Management Practices Using Sensor-Based Smart Agriculture in Nursery Production of Cacao. Horticulturae 2023, 9, 454. [Google Scholar] [CrossRef]
  17. Gilman, E.F.; Watson, D.G. Sabal palmetto. Cabbage Palm. In Fact Sheet ST-575; Environmental Horticulture Department, Florida Cooperative Extension Service, Institute of Food and Agricultural Sciences, University of Florida: Gainesville, FL, USA, 1994. [Google Scholar]
  18. Perry, L.; Williams, K. Effects of Salinity and Flooding on Seedlings of Cabbage Palm (Sabal palmetto.). Oecologia 1996, 105, 428–434. [Google Scholar] [CrossRef] [PubMed]
  19. Khoddamzadeh, A.A.; Flores, J.; Griffith, M.P.; Nogueira Souza Costa, B. Saltwater Intrusion Ecophysiological Effects on Pseudophoenix sargentii, Roystonea regia, Sabal palmetto “Lisa,” and Thrinax radiata in South Florida. Front. Ecol. Evol. 2023, 11, 1127679. [Google Scholar] [CrossRef]
  20. Gonzalez, P.D.; Tucker, D.A.; Nageswara-Rao, M.; Griffith, M.P.; Balaji Baskar, M.S.; Ross, M.; Khoddamzadeh, A.A. Enhancing Cabbage Palm Resilience to Saltwater Stress through Silicon Applications. HortScience 2025, 60, 1547–1554. [Google Scholar] [CrossRef]
  21. Broschat, T.K. Fertilization of Field-Grown and Landscape Palms in Florida. EDIS 2006, 2. [Google Scholar] [CrossRef]
  22. Broschat, T.K. Nutrient Deficiencies of Landscape and Field-Grown Palms in Florida: ENH1018/EP273. EDIS 2006, 1. [Google Scholar] [CrossRef]
  23. Ferraz, M.V.; Godoy, L.J.G.D.; Stucchi, G.; Reis, A.G.P.D.; Pacheco, M.A.A. Controlled Release, Organic or Organomineral Fertilizers for Areca Palm Production. Ornam. Hortic. 2022, 28, 332–339. [Google Scholar] [CrossRef]
  24. Carrington, M.E.; Mullahey, J.J.; Krewer, G.; Boland, B.; Affolter, J. Saw Palmetto (Serenoa repens): An Emerging Forest Resource in the Southeastern United States. South. J. Appl. For. 2000, 24, 129–134. [Google Scholar] [CrossRef]
  25. Solanki, K.; Patel, G.; Sindha, M.; Chaudhari, V.; Shivaswamy, C. Palm: Versatile Group of Plant Material for Landscape Gardening. Int. J. Adv. Biochem. Res. 2023, 7, 538–544. [Google Scholar] [CrossRef]
  26. Florida Climate Center Precipitation. Available online: https://climatecenter.fsu.edu/products-services/data/statewide-averages/precipitation (accessed on 28 July 2025).
  27. Sharma, R.; Singh, S.; Pant, K.; Mashiana, H.K.; Dubey, R.K. Protected Cultivation of Floriculture Crops: Innovative Technologies and Future Challenges. In Ornamental Horticulture: Latest Cultivation Practices and Breeding Technologies; Bhargava, B., Kumar, P., Verma, V., Eds.; Springer Nature: Singapore, 2024; pp. 15–43. ISBN 978-981-97-4027-7. [Google Scholar]
  28. Mirbolook, A.; Sadaghiani, M.R.; Keshavarz, P.; Alikhani, M. New Slow-Release Urea Fertilizer Fortified with Zinc for Improving Zinc Availability and Nitrogen Use Efficiency in Maize. ACS Omega 2023, 8, 45715–45728. [Google Scholar] [CrossRef]
  29. Lozano-Isla, F.; Farfan-Vignolo, E.R.; Gutierrez, R.; Blas, R.; Awais, K. Harvest Index Is a Key Trait for Screening Drought-Tolerant Potato Genotypes (Solanum tuberosum). J. Crop Sci. Biotechnol. 2024, 27, 91–103. [Google Scholar] [CrossRef]
  30. Nogueira Souza Costa, B.; Khoddamzadeh, A.A. Data-Driven Nitrogen Application for Satinleaf: Leveraging Optical Sensors in Urban Landscape Management. Front. Plant Sci. 2025, 16, 1522662. [Google Scholar] [CrossRef]
  31. Neupane, K.; Witcher, A.; Baysal-Gurel, F. Evaluation of Physiological Changes in Flowering Dogwood under Drought Conditions in a Container Production System. HortScience 2023, 58, 1077–1084. [Google Scholar] [CrossRef]
  32. Nogueira Souza Costa, B.; Tucker, D.A.; Khoddamzadeh, A.A. Precision Horticulture: Application of Optical Sensor Technology for Nitrogen Monitoring Status in Cocoplum, a Native Landscaping Plant. Plants 2023, 12, 760. [Google Scholar] [CrossRef]
  33. LeBude, A.; Bilderback, T.E. The Pour-through Extraction Procedure: A Nutrient Management Tool for Nursery Crops; North Carolina Cooperative Extension Service: Raleigh, NC, USA, 2009. [Google Scholar]
  34. Landaverde, A.C.; Shreckhise, J.H.; Altland, J.E. Storage Procedures Affect pH, Electrical Conductivity, and Nutrient Concentrations of Pour-through Leachate from Pine Bark and Peat-Based Substrates. HortScience 2020, 55, 1597–1604. [Google Scholar] [CrossRef]
  35. Merriam, J.; McDowell, W.H.; Currie, W.S. A High-Temperature Catalytic Oxidation Technique for Determining Total Dissolved Nitrogen. Soil Sci. Soc. Am. J. 1996, 60, 1050–1055. [Google Scholar] [CrossRef]
  36. Campbell, C. Reference Sufficiency Ranges for Plant Analysis in the Southern Region of the United States; Southern Cooperative Series Bulletin: Athens, GA, USA, 2000. [Google Scholar]
  37. Sharifi, M.; Zebarth, B.J.; Miller, J.J.; Burton, D.L.; Grant, C.A. Soil Nitrogen Mineralization in a Soil with Long-Term History of Fresh and Composted Manure Containing Straw or Wood-Chip Bedding. Nutr. Cycl. Agroecosyst. 2014, 99, 63–78. [Google Scholar] [CrossRef]
  38. R Core Team. R: A Language and Environment for Statistical Computing 2025; R Foundation for Statistical Computing: Vienna, Austria, 2025. [Google Scholar]
  39. Zuur, A.F.; Ieno, E.N.; Elphick, C.S. A Protocol for Data Exploration to Avoid Common Statistical Problems: Data Exploration. Methods Ecol. Evol. 2010, 1, 3–14. [Google Scholar] [CrossRef]
  40. Lozano-Isla, F. Inti: Tools and Statistical Procedures in Plant Science 2025, 0.6.9. Available online: https://cran.r-project.org/web/packages/inti/index.html (accessed on 28 July 2025).
  41. Kozak, M.; Piepho, H. -P. What’s Normal Anyway? Residual Plots Are More Telling than Significance Tests When Checking ANOVA Assumptions. J. Agron. Crop Sci. 2018, 204, 86–98. [Google Scholar] [CrossRef]
  42. Bates, D.; Maechler, M.; Bolker, B.; Walker, S. Lme4: Linear Mixed-Effects Models Using “Eigen” and S4 2003, 1.1-37. Available online: https://cran.r-project.org/web/packages/lme4/lme4.pdf (accessed on 28 July 2025).
  43. Fox, J.; Weisberg, S.; Price, B. Car: Companion to Applied Regression 2001, 3.1-3. Available online: https://cran.r-project.org/web/packages/car/car.pdf (accessed on 28 July 2025).
  44. Lenth, R.V. Emmeans: Estimated Marginal Means, Aka Least-Squares Means 2017, 1.11.2. Available online: https://cran.r-project.org/web/packages/emmeans/emmeans.pdf (accessed on 28 July 2025).
  45. Hothorn, T.; Bretz, F.; Westfall, P. Multcomp: Simultaneous Inference in General Parametric Models 2002, 1.4-28. Available online: https://cran.r-project.org/web/packages/multcomp/vignettes/generalsiminf.pdf (accessed on 28 July 2025).
  46. Husson, F.; Josse, J.; Le, S.; Mazet, J. FactoMineR: Multivariate Exploratory Data Analysis and Data Mining 2006, 2.12. Available online: https://husson.r-universe.dev/FactoMineR (accessed on 28 July 2025).
  47. Revelle, W. Psych: Procedures for Psychological, Psychometric, and Personality Research 2007, 2.5.6. Available online: https://personality-project.org/r/psych/psych-manual.pdf (accessed on 28 July 2025).
  48. Wickham, H.; Chang, W.; Henry, L.; Pedersen, T.L.; Takahashi, K.; Wilke, C.; Woo, K.; Yutani, H.; Dunnington, D.; Van Den Brand, T. Ggplot2: Create Elegant Data Visualisations Using the Grammar of Graphics 2007, 3.5.2. Available online: https://mirrors.huaweicloud.com/cran/web/packages/ggplot2/ggplot2.pdf (accessed on 28 July 2025).
  49. Wilke, C.O. Cowplot: Streamlined Plot Theme and Plot Annotations for “Ggplot2” 2015, 1.2.0. Available online: https://cran.r-project.org/web/packages/cowplot/index.html (accessed on 28 July 2025).
  50. Abrahamson, W.G.; Abrahamson, C.R. Life in the Slow Lane: Palmetto Seedlings Exhibit Remarkable Survival but Slow Growth in Florida’s Nutrient-Poor Uplands. Castanea 2009, 74, 123–132. [Google Scholar] [CrossRef]
  51. Broschat, T.K. Sabal palmetto: Sabal or Cabbage Palm: (ENH-733/ST575). EDIS 2013, 6. [Google Scholar] [CrossRef]
  52. Butler, C.J.; Larson, M. Climate Change Winners and Losers: The Effects of Climate Change on Five Palm Species in the Southeastern United States. Ecol. Evol. 2020, 10, 10408–10425. [Google Scholar] [CrossRef]
  53. Novichonok, E.V.; Novichonok, A.O.; Kurbatova, J.A.; Markovskaya, E.F. Use of the atLEAF+ Chlorophyll Meter for a Nondestructive Estimate of Chlorophyll Content. Photosyntetica. 2016, 54, 130–137. [Google Scholar] [CrossRef]
  54. Birrenkott, B.A.; Craig, J.L.; McVey, G.R. A Leach Collection System to Track the Release of Nitrogen from Controlled-Release Fertilizers in Container Ornamentals. HortScience 2005, 40, 1887–1891. [Google Scholar] [CrossRef]
  55. Gent, M.P.N.; Elmer, W.H.; Macherla, K.; McAvoy, R.J. Effects of Salinity and Irrigation Management on Growth and Nutrient Concentrations in Poinsettia. HortScience 2016, 51, 427–434. [Google Scholar] [CrossRef]
  56. Palms, A. Palmetto. Q. J. Fla. Nativ. Plant Soc. 2016, 33, 1–15. [Google Scholar]
  57. Cardarelli, M.; Rouphael, Y.; Muntean, D.; Colla, G. Growth, Quality Index, and Mineral Composition of Five Ornamental Cabbage Cultivars Grown Under Different Nitrogen Fertilization Rates. HortScience 2015, 50, 688–693. [Google Scholar] [CrossRef]
  58. Majsztrik, J.C.; Ristvey, A.G.; Lea-Cox, J.D. Water and Nutrient Management in the Production of Container-Grown Ornamentals. In Horticultural Reviews; Janick, J., Ed.; Wiley: Hoboken, NJ, USA, 2010; pp. 253–297. ISBN 978-0-470-64470-6. [Google Scholar]
  59. Zhu, H.; Zondag, R.H.; Merrick, J.; Demaline, T.; Krause, C.R. Nutrient Leaching from Container-Grown Ornamental Tree Production. J. Environ. Hortic. 2015, 33, 76–83. [Google Scholar] [CrossRef]
  60. Shaviv, A. Advances in Controlled-Release Fertilizers. In Advances in Agronomy; Elsevier: Amsterdam, The Netherlands, 2001; Volume 71, pp. 1–49. ISBN 978-0-12-000770-7. [Google Scholar]
  61. Arif, Y.; Singh, P.; Siddiqui, H.; Bajguz, A.; Hayat, S. Salinity Induced Physiological and Biochemical Changes in Plants: An Omic Approach towards Salt Stress Tolerance. Plant Physiol. Biochem. 2020, 156, 64–77. [Google Scholar] [CrossRef] [PubMed]
  62. Assouline, S.; Russo, D.; Silber, A.; Or, D. Balancing Water Scarcity and Quality for Sustainable Irrigated Agriculture. Water Resour. Res. 2015, 51, 3419–3436. [Google Scholar] [CrossRef]
  63. Diacono, M.; Montemurro, F. Long-Term Effects of Organic Amendments on Soil Fertility. A Review. Agron. Sustain. Dev. 2010, 30, 401–422. [Google Scholar] [CrossRef]
  64. Broschat, T.K.; Moore, K.K. Release Rates of Ammonium-Nitrogen, Nitrate-Nitrogen, Phosphorus, Potassium, Magnesium, Iron, and Manganese from Seven Controlled-Release Fertilizers. Commun. Soil Sci. Plant Anal. 2007, 38, 843–850. [Google Scholar] [CrossRef]
  65. Yeager, T.; Gardner, T.; Nyhuis, K. Nutrient Loading from Initial Watering of Container Plants. Acta Hortic. 2018, 183–186. [Google Scholar] [CrossRef]
  66. Carey, R.O.; Hochmuth, G.J.; Martinez, C.J.; Boyer, T.H.; Dukes, M.D.; Toor, G.S.; Cisar, J.L. Evaluating Nutrient Impacts in Urban Watersheds: Challenges and Research Opportunities. Environ. Pollut. 2013, 173, 138–149. [Google Scholar] [CrossRef]
  67. Nogueira Souza Costa, B.; Munoz-Salas, M.N.; Gil, K.; Khoddamzadeh, A.A. Effect of Silicon Amendment on Growth and Nitrogen Status of Common Landscaping Plants. Am. J. Plant Sci. 2024, 15, 603–616. [Google Scholar] [CrossRef]
  68. Duangpan, S.; Tongchu, Y.; Hussain, T.; Eksomtramage, T.; Onthong, J. Beneficial Effects of Silicon Fertilizer on Growth and Physiological Responses in Oil Palm. Agronomy 2022, 12, 413. [Google Scholar] [CrossRef]
  69. Mayzaitul-Azwa, N.J.; Shuhada, N.M.T.; Hanafi, M.M.; Huda, N. Impact of Silicon-Enriched Fertilizer on Basal Stem Rot Disease in Palm Species Caused by Ganoderma boninense. J. Trop. Agric. Sci. 2025, 48, 973–990. [Google Scholar] [CrossRef]
  70. Samborski, S.M.; Tremblay, N.; Fallon, E. Strategies to Make Use of Plant Sensors-Based Diagnostic Information for Nitrogen Recommendations. Agron. J. 2009, 101, 800–816. [Google Scholar] [CrossRef]
  71. Markwell, J.; Osterman, J.C.; Mitchell, J.L. Calibration of the Minolta SPAD-502 Leaf Chlorophyll Meter. Photosynth. Res. 1995, 46, 467–472. [Google Scholar] [CrossRef]
  72. Zhu, J.; Tremblay, N.; Liang, Y. Comparing SPAD and atLEAF Values for Chlorophyll Assessment in Crop Species. Can. J. Soil. Sci. 2012, 92, 645–648. [Google Scholar] [CrossRef]
  73. Bracke, J.; Elsen, A.; Adriaenssens, S.; Schoeters, L.; Vandendriessche, H.; Van Labeke, M.-C. Application of Proximal Optical Sensors to Fine-Tune Nitrogen Fertilization: Opportunities for Woody Ornamentals. Agronomy 2019, 9, 408. [Google Scholar] [CrossRef]
  74. Muñoz-Huerta, R.; Guevara-Gonzalez, R.; Contreras-Medina, L.; Torres-Pacheco, I.; Prado-Olivarez, J.; Ocampo-Velazquez, R. A Review of Methods for Sensing the Nitrogen Status in Plants: Advantages, Disadvantages and Recent Advances. Sensors 2013, 13, 10823–10843. [Google Scholar] [CrossRef]
  75. Dai, Y.; Xu, X.; Cuong, L. Effects of Nitrogen and Phosphorus Additions on the Stability of Soil Carbon Fractions in Subtropical Castanopsis Sclerophylla Forests. Forests 2025, 16, 1264. [Google Scholar] [CrossRef]
  76. Li, T.; Bi, G.; Harkess, R.L.; Denny, G.C.; Blythe, E.K.; Zhao, X. Nitrogen Rate, Irrigation Frequency, and Container Type Affect Plant Growth and Nutrient Uptake of Encore Azalea ‘Chiffon’. HortScience 2018, 53, 560–566. [Google Scholar] [CrossRef]
  77. Holbrook, N.M.; Sinclair, T.R. Water Balance in the Arborescent Palm, Sabal palmetto. II. Transpiration and Stem Water Storage. Plant Cell Environ. 1992, 15, 401–409. [Google Scholar] [CrossRef]
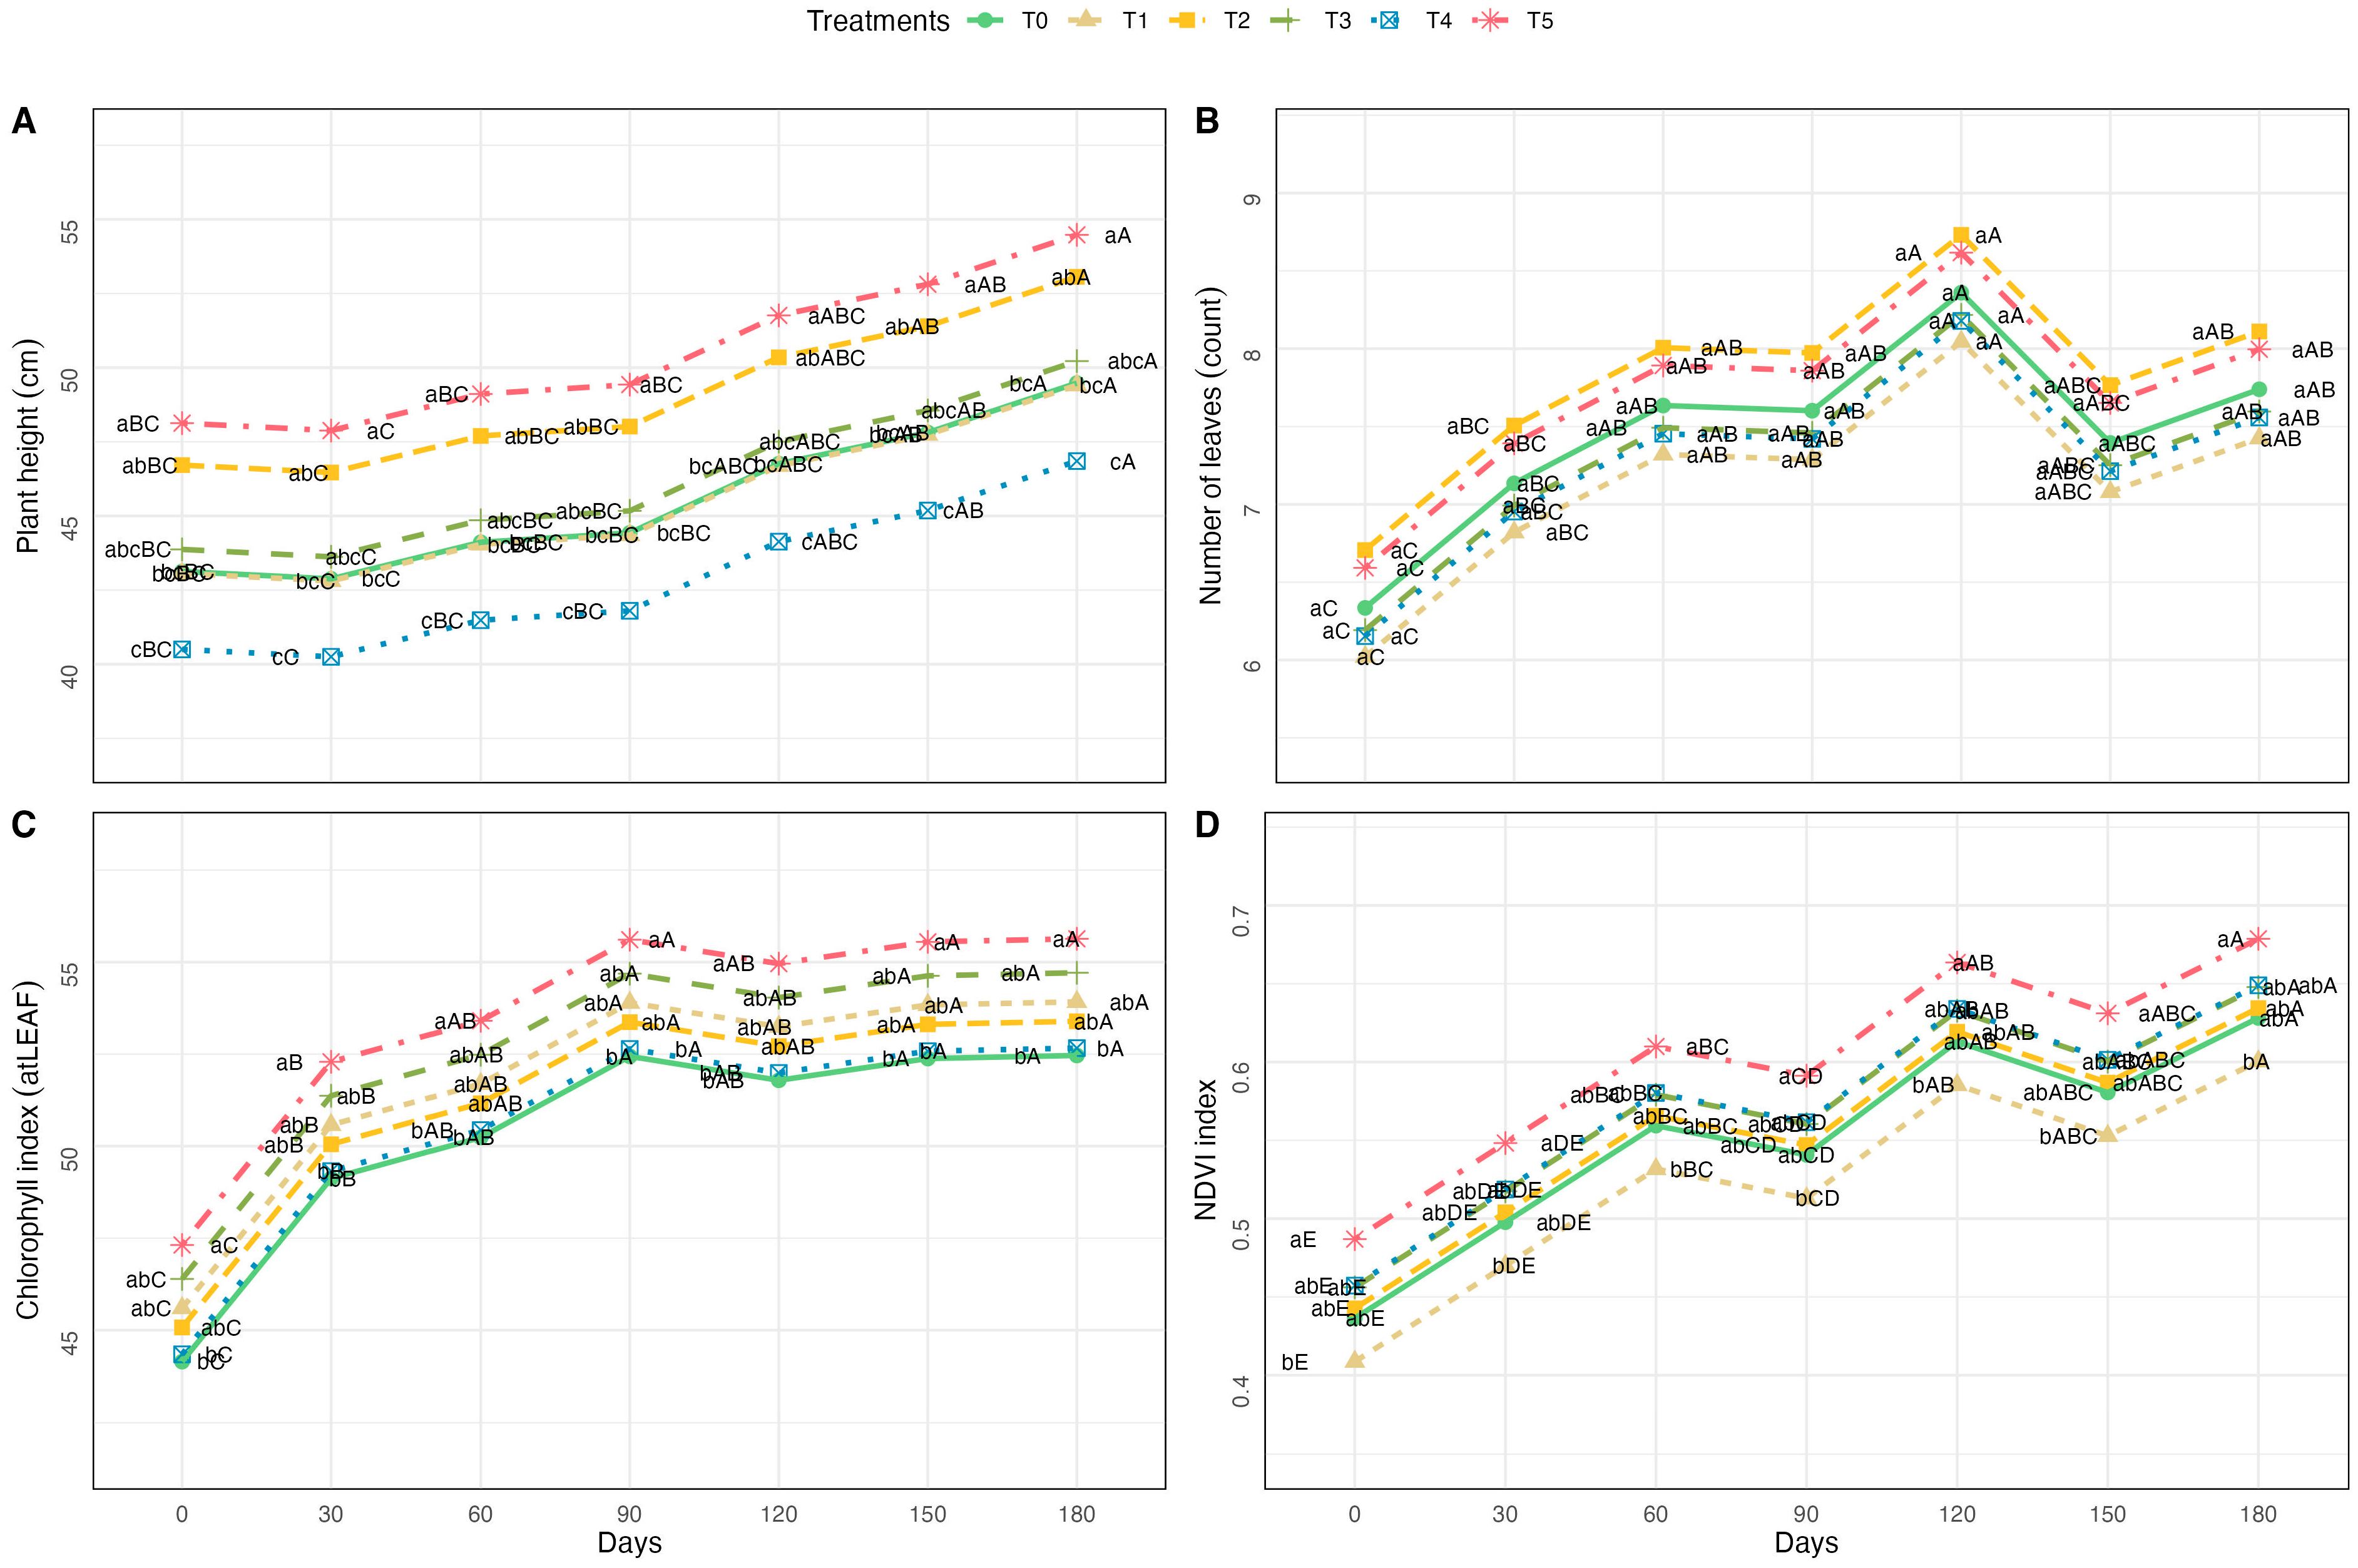
Figure 1. Morphological and physiological responses of Sabal palmetto during a 180-day experimental period under six fertilization treatments with granular fertilizer (Harrell’s® 8N–3P–9K). Parameters measured include (A) plant height (cm), (B) number of leaves, (C) chlorophyll index measured with atLEAF+, and (D) NDVI obtained with the GreenSeeker™. Treatments represent increasing total fertilizer inputs: T0 = 15 g; T1 = 30 g; T2 = 45 g; T3 = 45 g; T4 = 60 g; T5 = 75 g. Values represent means ± standard error (n = 5). Lowercase letters indicate significant differences within treatments over time, and uppercase letters indicate significant differences among treatments at each time point (Tukey’s HSD, p < 0.05).
Soilsystems 09 00121 g001
Figure 2. Principal component analysis (PCA) of substrate chemical properties and nitrogen leaching in Sabal palmetto over a 180-day experimental period under six fertilization treatments with granular fertilizer (Harrell’s® 8N–3P–9K). (A) Variable correlation plot showing loadings for total nitrogen in leachate (ppm), electrical conductivity (µS cm−1), and salt concentration (ppm). (B) Individual sample distribution by treatment and sampling day. Fertilizer inputs per treatment: T0 = 15 g; T1 = 30 g; T2 = 45 g; T3 = 45 g; T4 = 60 g; T5 = 75 g.
Soilsystems 09 00121 g002
Figure 3. Principal component analysis (PCA) of nutrient partitioning between foliage and substrate in Sabal palmetto over a 180-day cultivation period under six fertilization treatments with granular fertilizer (Harrell’s® 8N–3P–9K). (A) PCA for variables, total nitrogen in soil (%), total nitrogen in leaves (%), total carbon in leaves (%), and total carbon in soil (%). (B) PCA for Individuals with treatment–time combinations. Treatments reflect increasing fertilizer inputs: T0 = 15 g; T1 = 30 g; T2 = 45 g; T3 = 45 g; T4 = 60 g; T5 = 75 g.
Soilsystems 09 00121 g003
Table 1. Fertilization regimes applied to Sabal palmetto during the 180-day trial.
TreatmentsFT (g)SF (g)NovemberMarchTotal (g)
T01500015
T1151515030
T21530151545
T3301515045
T43030151560
T54530151575
Note: FT = baseline fertilizer application (g per plant); SF = total supplemental fertilizer applied (g per plant).
Disclaimer/Publisher’s Note: The statements, opinions and data contained in all publications are solely those of the individual author(s) and contributor(s) and not of MDPI and/or the editor(s). MDPI and/or the editor(s) disclaim responsibility for any injury to people or property resulting from any ideas, methods, instructions or products referred to in the content.