Abstract
Olive groves (Olea europaea L.) are highly susceptible to soil degradation, particularly water erosion, due to sparse canopy cover and wide inter-row spacing. This study evaluated the effect of different vegetation cover management practices on soil quality and erosion control in a tropical olive grove in southeastern Brazil. The experiment followed a randomized block design with five treatments: exposed soil (BS), olive trees on exposed soil (OB), olive trees with spontaneous vegetation managed with herbicide (OVH), with mowing (OVM), and with mowing + localized weeding (OVMC). Physical, chemical, and biological indicators and losses due to water erosion were analyzed. The OVM and OVMC treatments promoted an increase in soil organic matter (up to 39 g kg−1), microbial biomass carbon (40% higher than BS), enzymatic activity, and glomalin, improving aggregate stability (WMD of 4.9 mm) and reducing soil and water losses by more than 99% compared to exposed soil. The BS and OB treatments, on the other hand, showed higher acidity, lower microbial activity, and greater susceptibility to erosion. The study reinforces that maintaining vegetation cover improves soil quality, mitigates erosion, and promotes the sustainability of olive groves in tropical regions.
1. Introduction
The olive tree (Olea europaea L.), native to the Mediterranean region, plays a vital economic and cultural role, particularly in southern Europe, where its cultivation has spanned centuries. In recent decades, olive farming has expanded into subtropical and tropical regions, including southern Brazil, due to its market potential and favorable climate conditions [1]. However, successful olive cultivation in Brazil faces distinct challenges related to soil suitability, climate variability, and appropriate management practices [1,2].
In Brazil, the selection and preparation of soils with suitable physical and chemical attributes—such as depth, drainage, texture, and fertility—are critical prerequisites for successful olive cultivation [2]. According to recommendations by Vieira Neto et al. [3], olive orchards in the country are often established in areas with slopes of up to 50%, provided that the soils are well-drained. Moreover, plant spacing protocols typically involve 4 m between trees and 6 m between rows, aiming to balance tree vigor with mechanization efficiency [4,5].
Nonetheless, the olive tree is inherently susceptible to soil degradation by water erosion, primarily due to its sparse canopy architecture, which provides limited ground cover, combined with periodic pruning and wide inter-row spacing. These characteristics reduce soil surface protection and intensify raindrop impact, thereby compromising agroecosystem sustainability and leading to significant environmental degradation, especially in shallow, naturally acidic, and poorly developed soils. In this context, the adoption of soil conservation practices that promote continuous vegetative cover becomes essential not only to minimize erosion but also to enhance crop productivity under tropical and subtropical conditions [6].
The intensification of erosion processes in olive orchards is driven by both the geographic expansion of cultivation and suboptimal land management strategies. These dynamics are further influenced by site-specific factors such as slope gradient, rainfall intensity, and land use practices [7,8]. To quantify erosion risk and support informed decision making, Rodríguez Sousa et al. [9] applied erosion models such as the Universal Soil Loss Equation (USLE) to assess the long-term impacts of various management practices, demonstrating that vegetation cover is a critical determinant of soil retention and landscape sustainability.
Furthermore, maintaining permanent or semi-permanent soil cover has been shown to provide multiple ecosystem services, including the regulation of hydrological cycles, the conservation of biodiversity, and the stabilization of soil structure. These benefits are particularly evident in hilly landscapes, where vegetative cover significantly reduces runoff and nutrient loss [7,10]. In this context, bioindicators such as microbial biomass, soil respiration, and enzyme activities have emerged as sensitive tools to detect rapid changes in soil quality, given their strong correlation with organic matter content, soil texture, and pH under tropical conditions [11].
Therefore, a holistic evaluation of soil quality requires the integration of physical, chemical, and biological indicators that respond to changes in land management. Among these, biological indicators often respond earlier to anthropogenic disturbances and may reveal degradation trends before they are reflected in structural properties.
Scientific evidence increasingly confirms that land management practices are pivotal in protecting soil and reducing water erosion, particularly in sloping agroecosystems [12,13,14,15]. In these vulnerable areas, the loss of essential soil components such as organic carbon, nutrients, and extracellular enzymes undermines soil functionality and productivity [16,17,18,19]. Consequently, investigating how vegetative cover influences soil aggregate stability and erosion control is essential for selecting sustainable management strategies. In addition, exploring the distribution of enzymatic activity within soil aggregate classes may offer novel insights into the functional integrity of soil microhabitats.
Thus, we hypothesize that cover management practices that maintain continuous soil cover enhance the physical, chemical, and biological properties of the soil and reduce water erosion in olive groves. In this study, we aim to assess how different vegetation cover management systems influence soil quality indicators and water erosion in a tropical olive orchard. Specifically, we investigate the effects of cover management, plot position, and aggregate size on soil quality parameters and explore their interrelationships with erosion dynamics.
2. Materials and Methods
2.1. Study Area, Experimental Design, and Olive Cultivation History
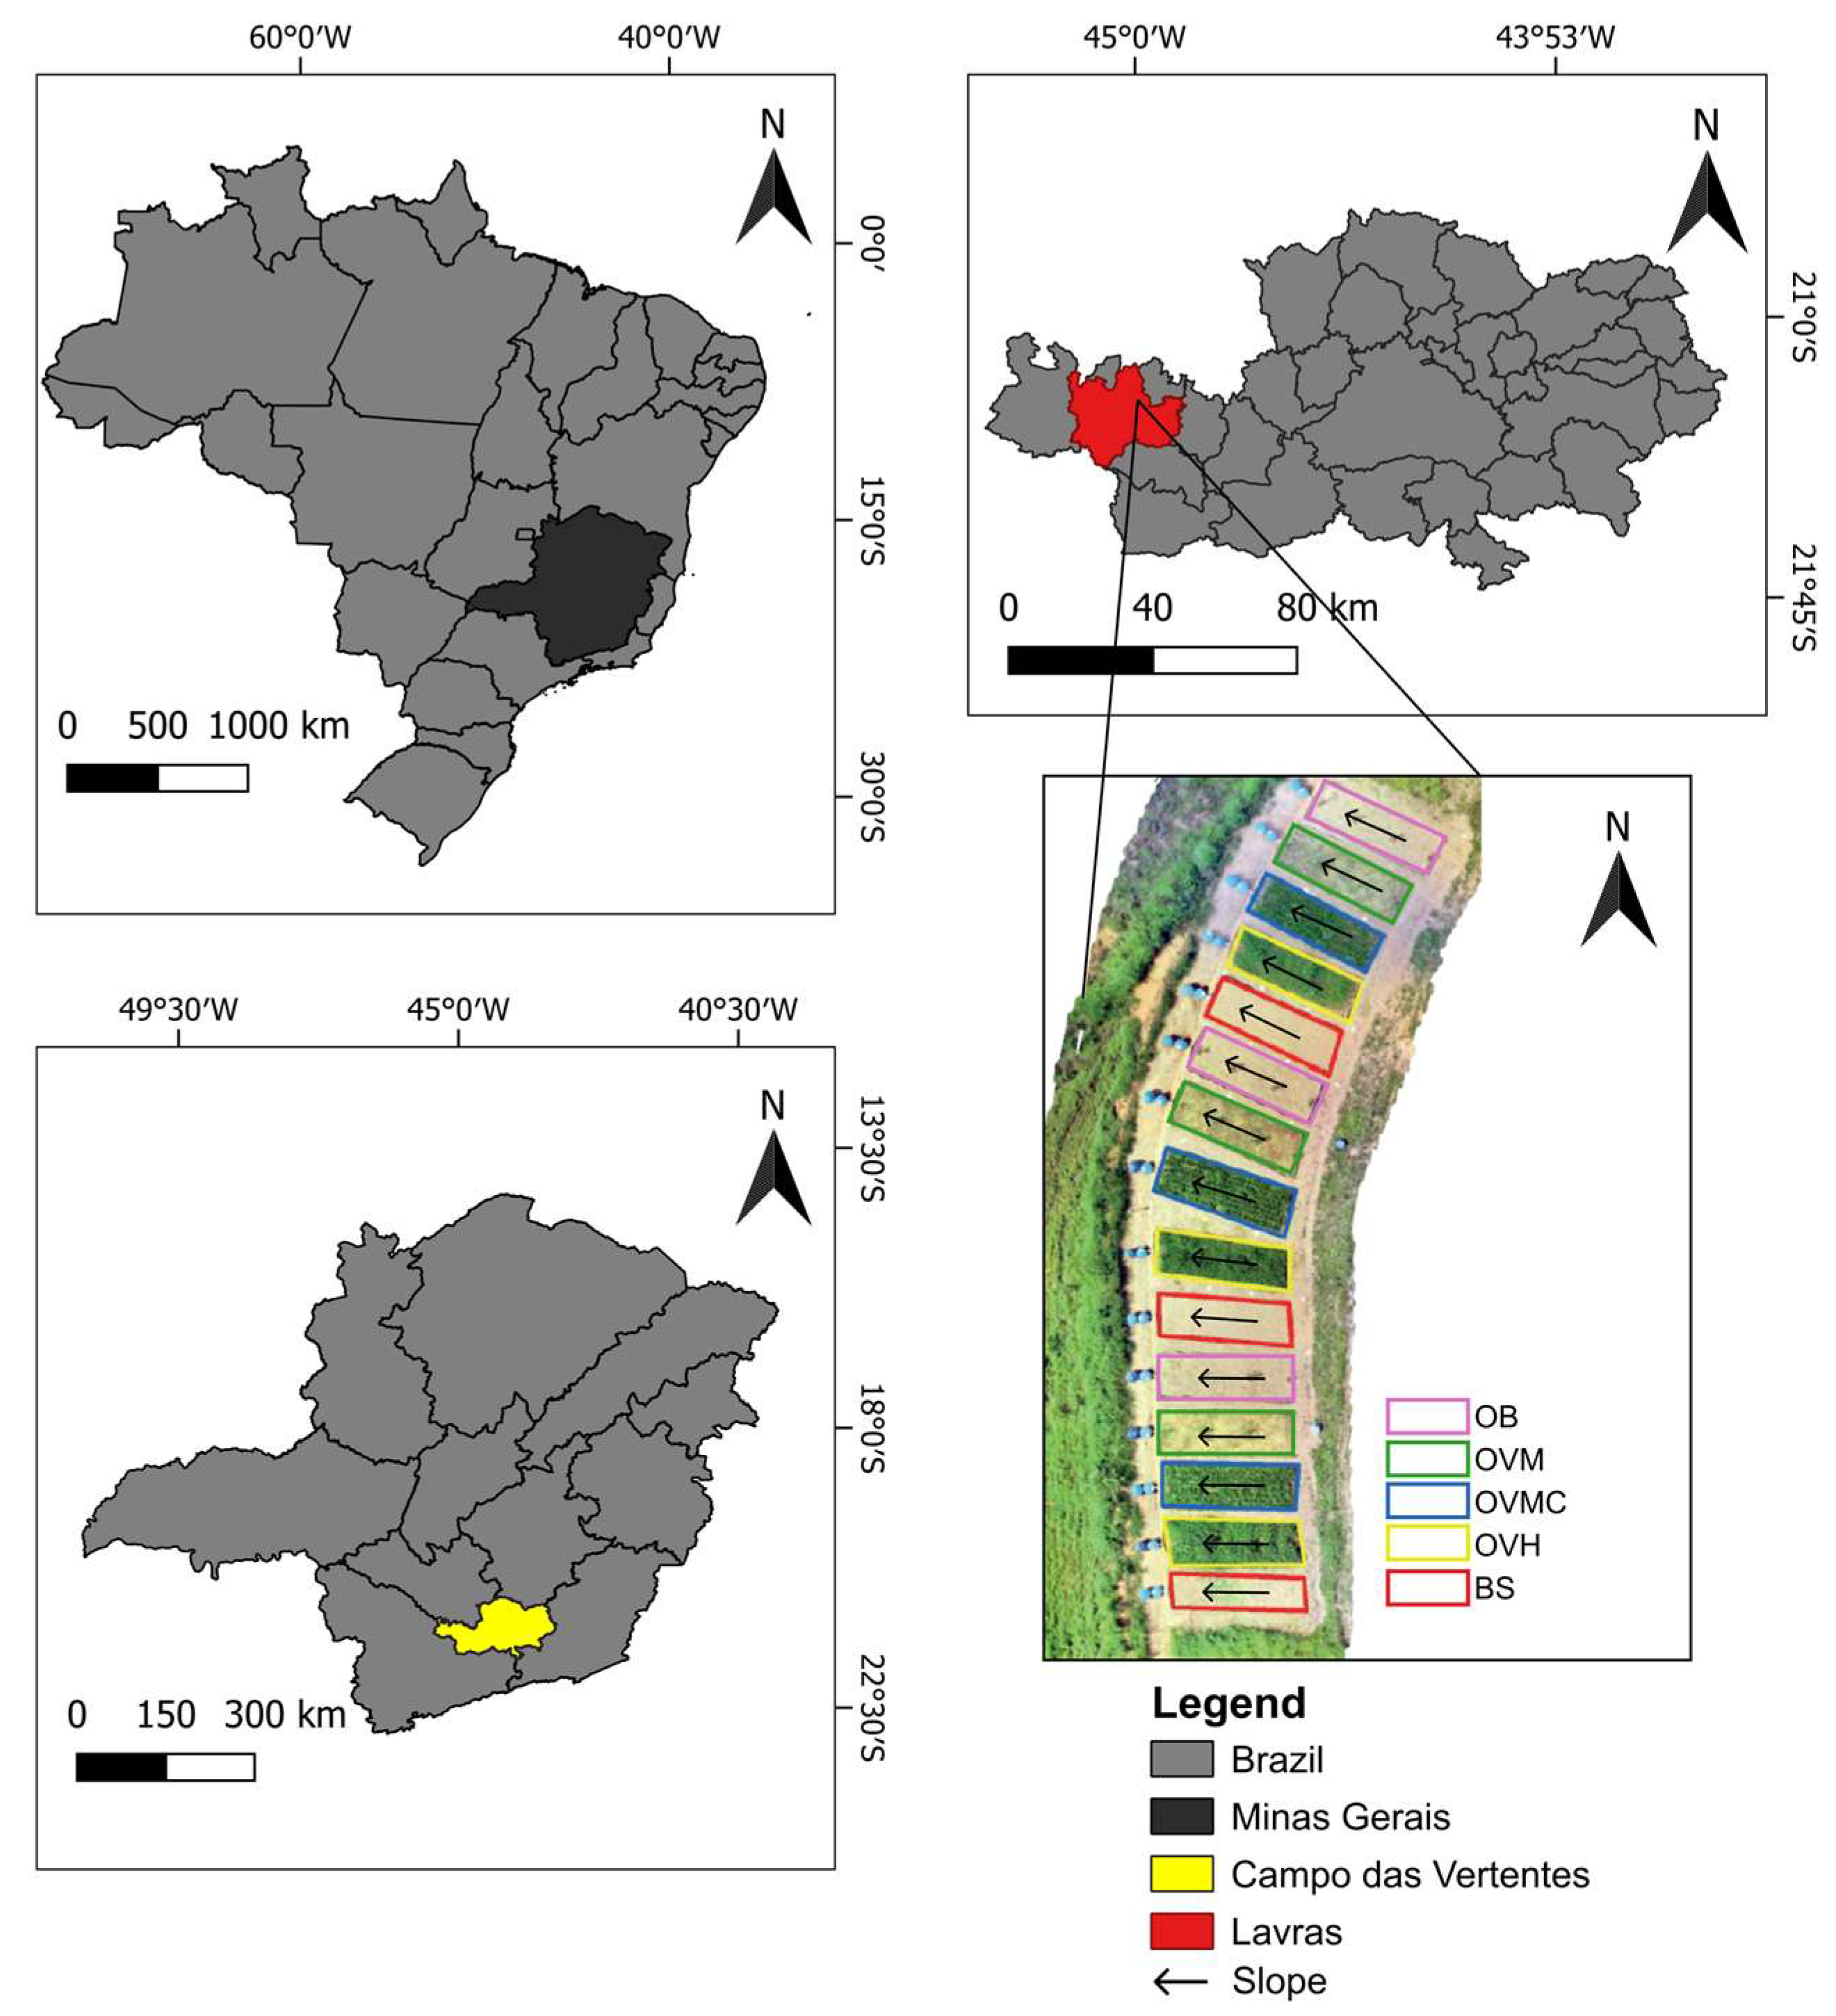
This study was conducted in the Fruit Growing Sector of the Federal University of Lavras (UFLA), located in the municipality of Lavras, southern Minas Gerais, Brazil (21°13′20″ S, 44°58′17″ W), at an elevation of 910 m (Figure 1). The soil at the experimental site is classified as Cambissolo Háplico Tb Distrófico, according to the Brazilian Soil Classification System [20] corresponding to a Dystrudept in the Soil Taxonomy [21]. It has characteristics of shallow soil, with low activity clay and a base saturation < 50%. The plots are situated on a slope with an average inclination of 23%.
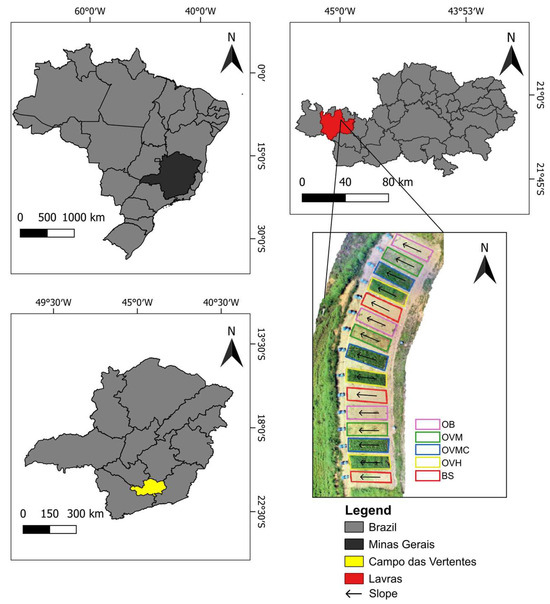
Figure 1.
Location of the study area in Lavras, southern Minas Gerais, Brazil.
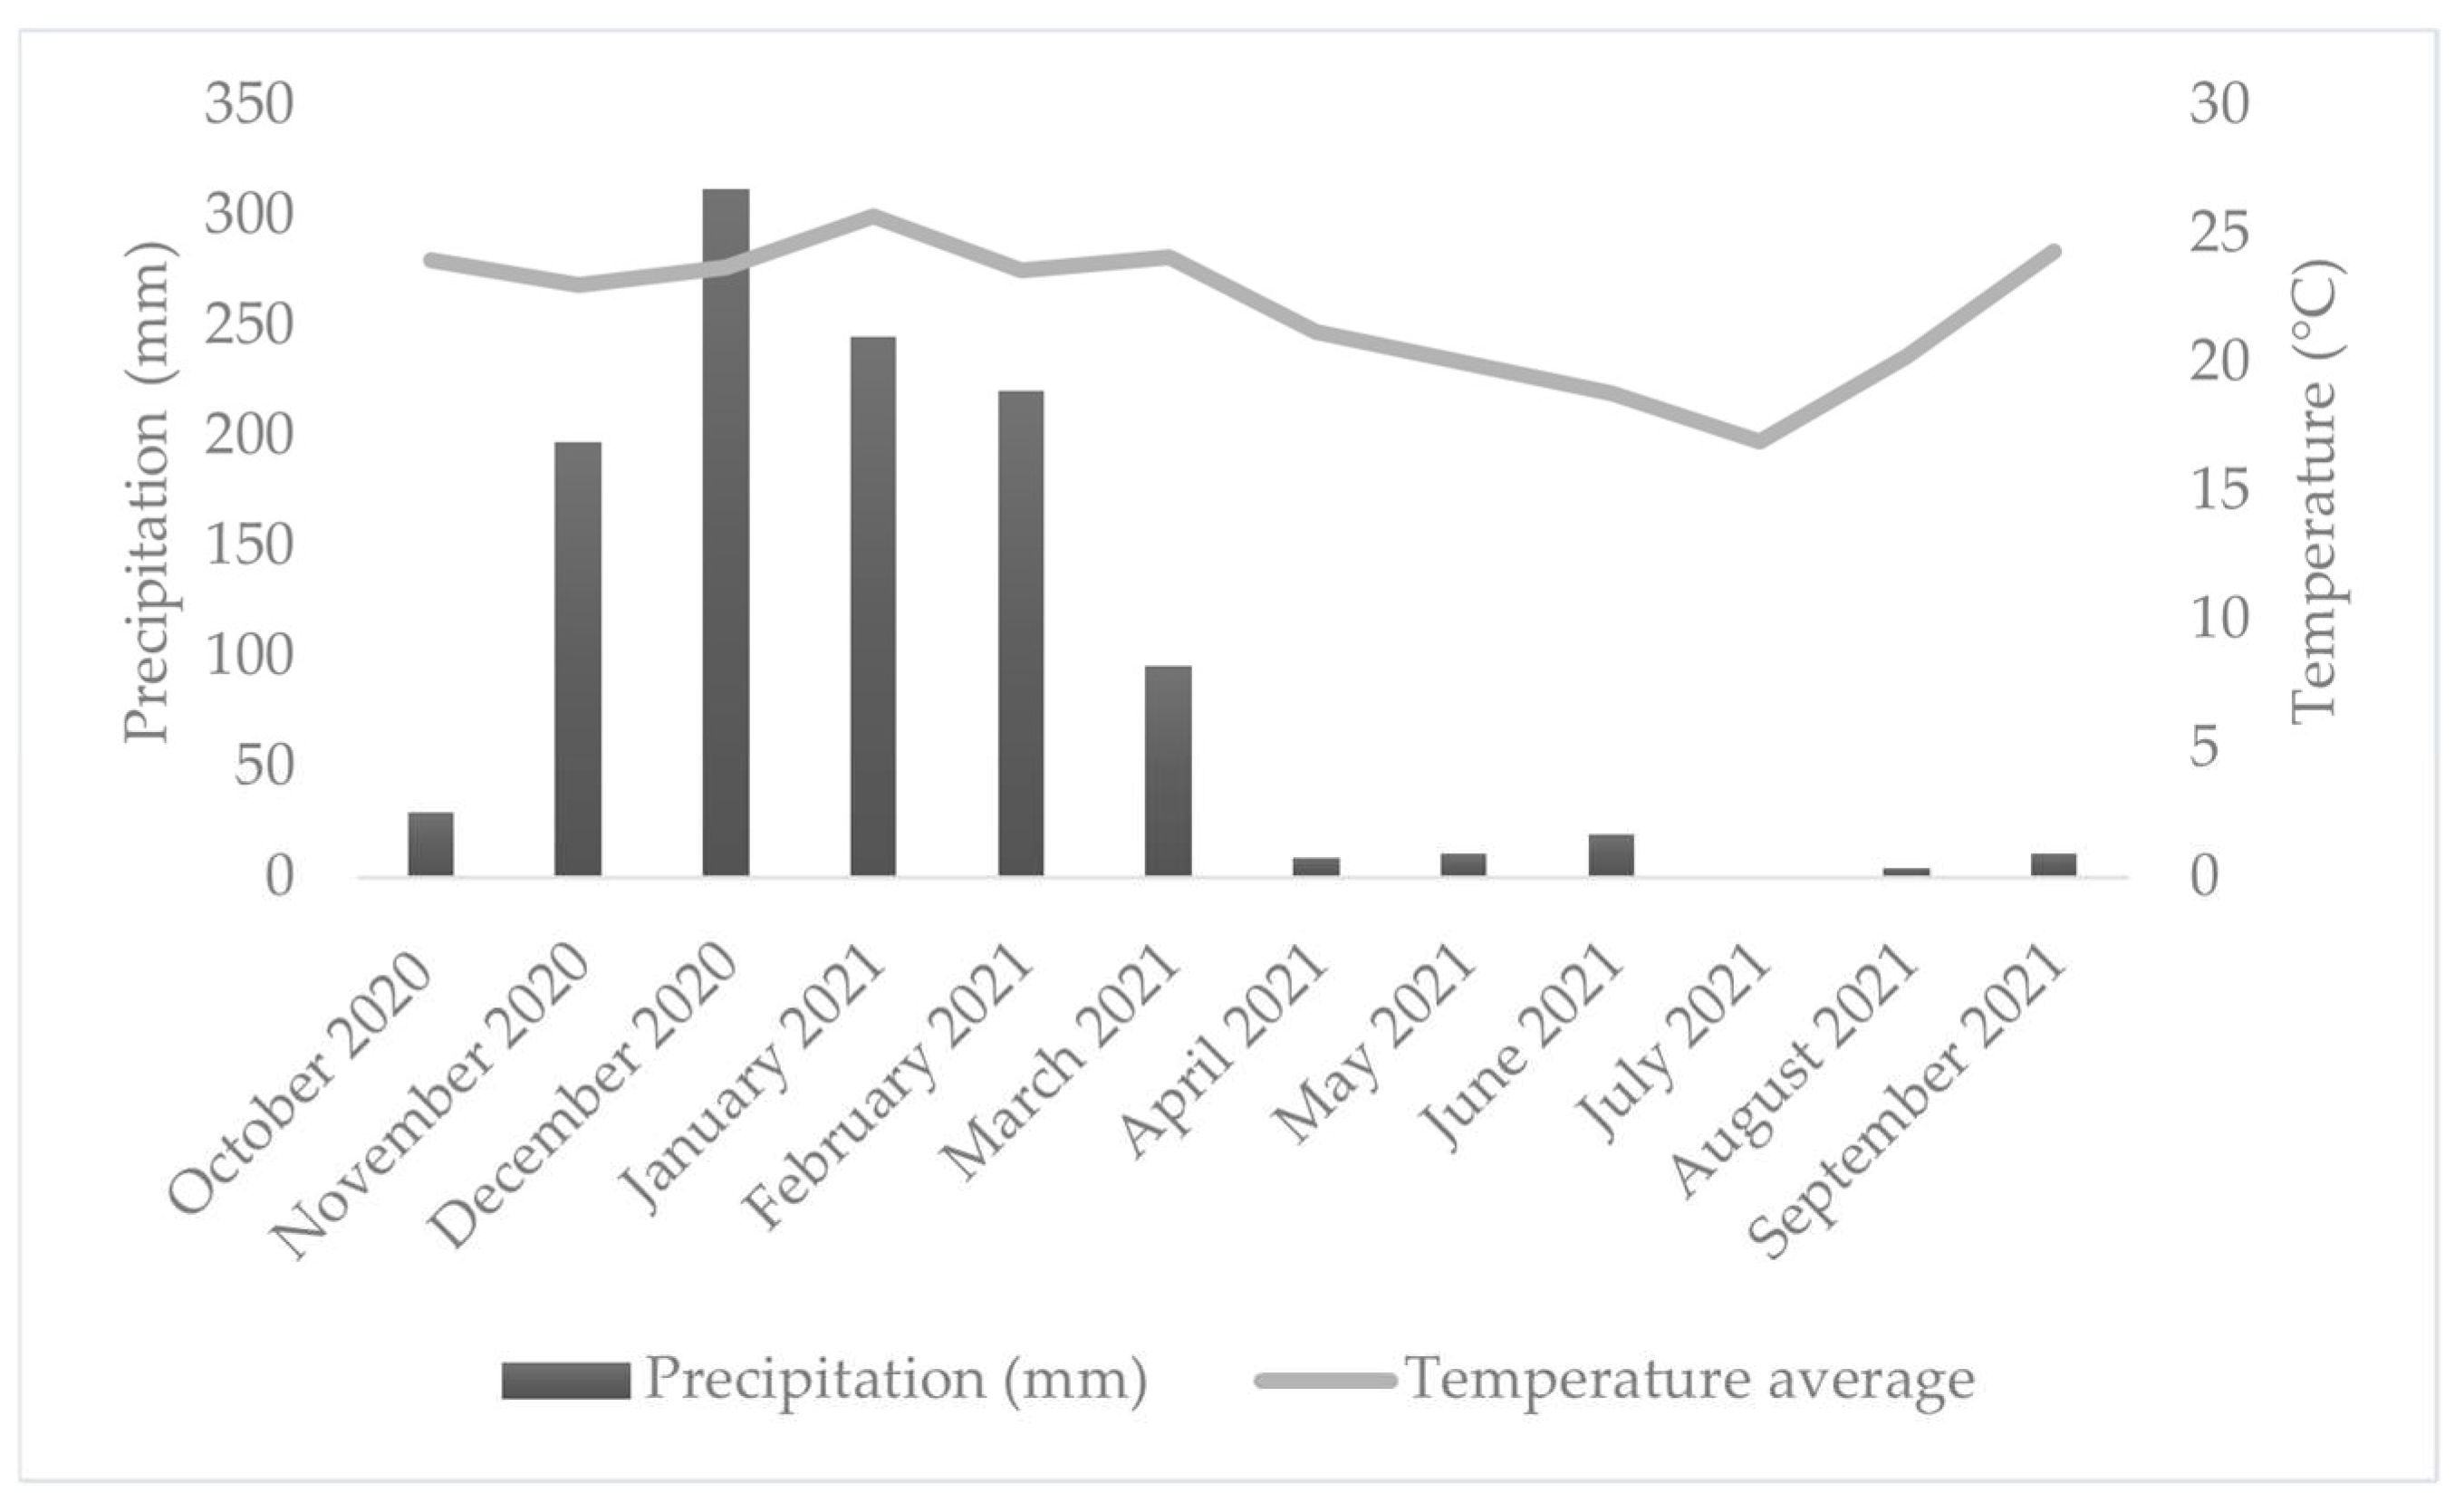
The regional climate is classified as Cwb—temperate with dry winters and wet summers—according to the Köppen classification adapted by Peel et al. [22]. The mean annual temperature is 19.3 °C, and annual precipitation averages 1.411 mm, with the rainy season occurring primarily between October and March (Figure 2).
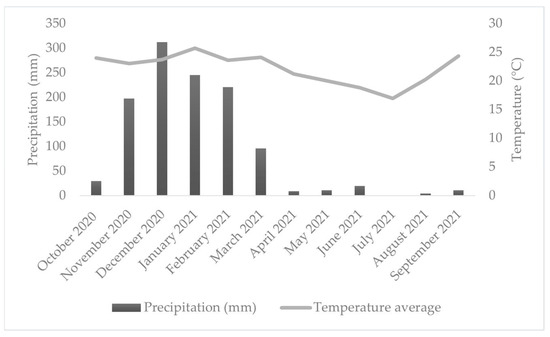
Figure 2.
Average daily temperature and total monthly rainfall during the monitoring period.
The experiment was arranged in a randomized block design with a 5 × 2 × 3 factorial structure and three replications, totaling 30 experimental units. The experimental factors consisted of (i) five soil cover management systems: bare soil (BS), olive trees on bare soil (OB), olive trees, with herbicide-managed spontaneous vegetation (OVH), olive trees with mowed spontaneous vegetation (OVM), and olive trees with mowed vegetation and localized weeding around the tree base (OVMC); (ii) two slope positions: upper and lower thirds of the plot; and (iii) three soil aggregate size classes: 8–4 mm, 4–2 mm, and <2 mm [23].
This factorial design was chosen to evaluate the interactive effects of vegetation management, slope position, and aggregate structure on physical, chemical, and biological soil quality indicators, as well as erosion losses. A schematic representation of the plot layout, topographic configuration, and treatment arrangement is provided in Figure 1.
In 2015, 15 experimental plots were established over a total area of approximately 720 m2 to evaluate water erosion. Each plot measured 4 m × 12 m (48 m2) and contained four olive trees planted 3 × 5 m apart and interspersed with spontaneous vegetation. In addition to this treatment, plots with olive trees on bare soil and plots with bare soil only were also included. The composition of the spontaneous vegetation changed over time, as detailed in Table 1.

Table 1.
The history of management of the standard plots of soil and water losses of the experimental area, Lavras, MG, Brazil.
Olive seedlings were transplanted into 50 dm3 planting holes, each fertilized with 500 g of single superphosphate, 200 g of potassium chloride (KCl), 10 L of well-decomposed cattle manure, and 100 g of agricultural limestone. Post-planting fertilization adhered to protocols outlined by Vieira Neto et al. [3].
Between 2015 and 2017, the spontaneous vegetation was mainly dominated by Brachiaria decumbens, especially during the spring and summer seasons. In contrast, during the fall and winter, other species became more prevalent, including Ipomoea acuminata, Bidens pilosa, Oxalis corniculata, Digitaria sanguinalis, Emilia fosbergii Nicolson, Melinis minutiflora, Conyza bonariensis, Euphorbia heterophylla, and Eleusine indica and in 2021, a new floristic survey showed a change in species composition. The most dominant species at that time were Brachiaria decumbens Stapf and Desmodium incanum DC., while Amaranthus viridis L., Bidens pilosa L., Emilia fosbergii Nicolson, and some individuals of Vernonia polyanthes (Spreng.) Less. were present in smaller proportions [24].
2.2. Soil Sampling and Preparation
Soil samples were collected in March 2021. A single sample was taken from each plot at a depth of 0–5 cm, totaling 30 field samples. In the laboratory, each sample was air-dried and sieved to separate the soil into aggregate size classes of 8–4 mm, 4–2 mm, and <2 mm. The subsamples were then allocated for physical, chemical, and microbiological analyses; the latter were stored in a cold room at 4 °C until analysis. Considering the combination of cover management, the plot position (upper and lower thirds), and aggregate size, a total of 90 samples were analyzed.
2.3. Investigation of Soil Physical, Chemical, and Biological Indicators
Soil quality was assessed using physical, chemical, and biological indicators in the 0–5 cm soil layer, which is most sensitive to management practices due to its higher organic matter content and microbial activity. The indicators and corresponding analytical methods are summarized in Table 2.

Table 2.
Physical, chemical, and biological indicators of the soil that were evaluated and the methodologies used.
2.4. Rainfall Erosivity Estimation
Rainfall erosivity was estimated using the EI30 index, expressed in MJ mm ha−1 h−1 year−1, based on an empirical equation developed for the southern region of Minas Gerais, Brazil [37].
where p is the monthly mean precipitation (mm) and P is the 30-year average annual precipitation (mm).
EI30 = 85.672 × (p2/P)0.6557
2.5. Soil and Water Loss Assessment
Erosion plots of 48 m2 (4 m width × 12 m length) were set up for each treatment, arranged lengthwise in the direction of the slope. The erosion plots were delimited by galvanized zinc metal sheeting inserted 0.20 m into the soil with 0.20 m above the soil surface. A collection trough at the lower end of the plot directed the runoff to 250 L tanks for the storage of runoff water and sediments and transported soil particles. Sediments were collected in the containers for the determination of soil losses (SLs), and the water level was measured in the containers for the calculation of water losses (WLs) in a 12-month interval [38].
The water and sediment volume lost by surface runoff, previously homogenized, were quantified in a complete manner by collection, in 250 mL containers. Three drops of HCl at 50% concentration were added to each container to bring about flocculation and the settling of suspended particles. The weight of the sediment was quantified after drying for 48 h in a laboratory oven at 105 °C [39].
2.6. Statistical Analysis
Prior to analysis, the assumptions of normality, homoscedasticity, and the independence of residuals were tested through residual plots and validated using the global validation of linear model assumptions (GVLMAs) [40]. When necessary, data transformations were applied: logarithmic for qCO2 and Al3+, quadratic for P, and generalized least squares (GLS) for Ca2+, SB, t, V, and m, following Menke [41].
Subsequently, the analysis of variance (ANOVA) was performed using the F-test at a significance level of p < 0.05. When significant effects were detected, treatment means were compared using Tukey’s test. To explore the multivariate associations among soil indicators, principal component analysis (PCA) was performed for each experimental factor, and clustering patterns were visualized through biplots with confidence ellipses.
All statistical procedures were performed using RStudio (RStudio Team, 2025), where several packages were used for analysis procedures.
3. Results
3.1. Interactions Between Factors
An analysis of variance revealed that soil chemical indicators were significantly influenced by vegetation cover factors, plot position, and aggregate size, as well as some of their interactions (Table 3, Supplementary Material S1). Biological indicators showed high sensitivity to the interactions between factors, highlighting the complexity of the microbial response to management changes. The indicators of soil, for the most part, responded only to the vegetation cover, with less variability due to the other factors.

Table 3.
Summary mean squares of analysis of variance (ANOVA) for soil quality indicators as a function of the factors: cover system (CS), position in the plot (PP), aggregate size (AS), and their interactions.
3.2. Soil Chemical Indicators and Soil Texture
Soil cover management significantly influenced several chemical indicators (p < 0.05), with the exception of phosphorus content and aluminum saturation (Table 4). The BS treatment exhibited the lowest pH value (4.94), reflecting the natural acidity of the soil, characterized by high concentrations of Al3+ and a saturation index of 15.13% (Table 4). Although BS differed significantly from the OVH and OB treatments, these also exhibited high acidity levels. No significant differences in pH were observed between the OVM and OVMC treatments (Table 4).

Table 4.
The chemical indicators and soil texture as a function of soil cover plant management (CPM).
Regarding the effect of the plot position, pH and K+ were the only chemical indicators that varied significantly (p < 0.05), with higher values observed in the lower third compared to the upper third of the slope (Table 5).

Table 5.
Chemical indicators as a function of positions in the standard plot of the experimental area.
Unlike the previous table, despite subtle numerical variations between aggregate classes, chemical indicators were not significantly influenced by aggregate size, showing relative homogeneity in the distribution of nutrients and acidity between soil fractions. (Table 6).

Table 6.
Chemical indicators as a function of aggregate size in the experimental area.
Among the interactions evaluated, only H + Al exhibited a significant response (p < 0.05) to the combined effects of cover crop management, plot position, and aggregate size. Specifically under the BS treatment at the upper third of the plot, potential acidity values were higher across all aggregate size classes—2.70, 3.03, and 3.10 cmolc kg−1 for the 8–4 mm, 4–2 mm, and <2 mm fractions, respectively (Table 7). Within the OVM treatment at the upper third position, a significant difference was observed only in the 8–4 mm aggregates, with a potential acidity of 3.07 cmolc kg−1 (Table 7).

Table 7.
Potential acidity affected by the interaction of the soil cover plant management, position in the plot, and aggregate size factors.
In the lower third of the plot, the 8–4 mm and <2 mm aggregates under OVH and BS treatments exhibited the highest acidity levels: 2.57 and 2.37 cmolc kg−1 in OVH, and 2.53 and 2.10 cmolc kg−1 in BS, respectively (Table 7). No significant differences were found among treatments in the 4–2 mm aggregate size. However, under the OVMC treatment in the lower third, the 4–2 mm aggregates exhibited a significantly higher potential acidity of 2.60 cmolc kg−1 compared to the other treatments (Table 7).
3.3. Soil Biological Indicators
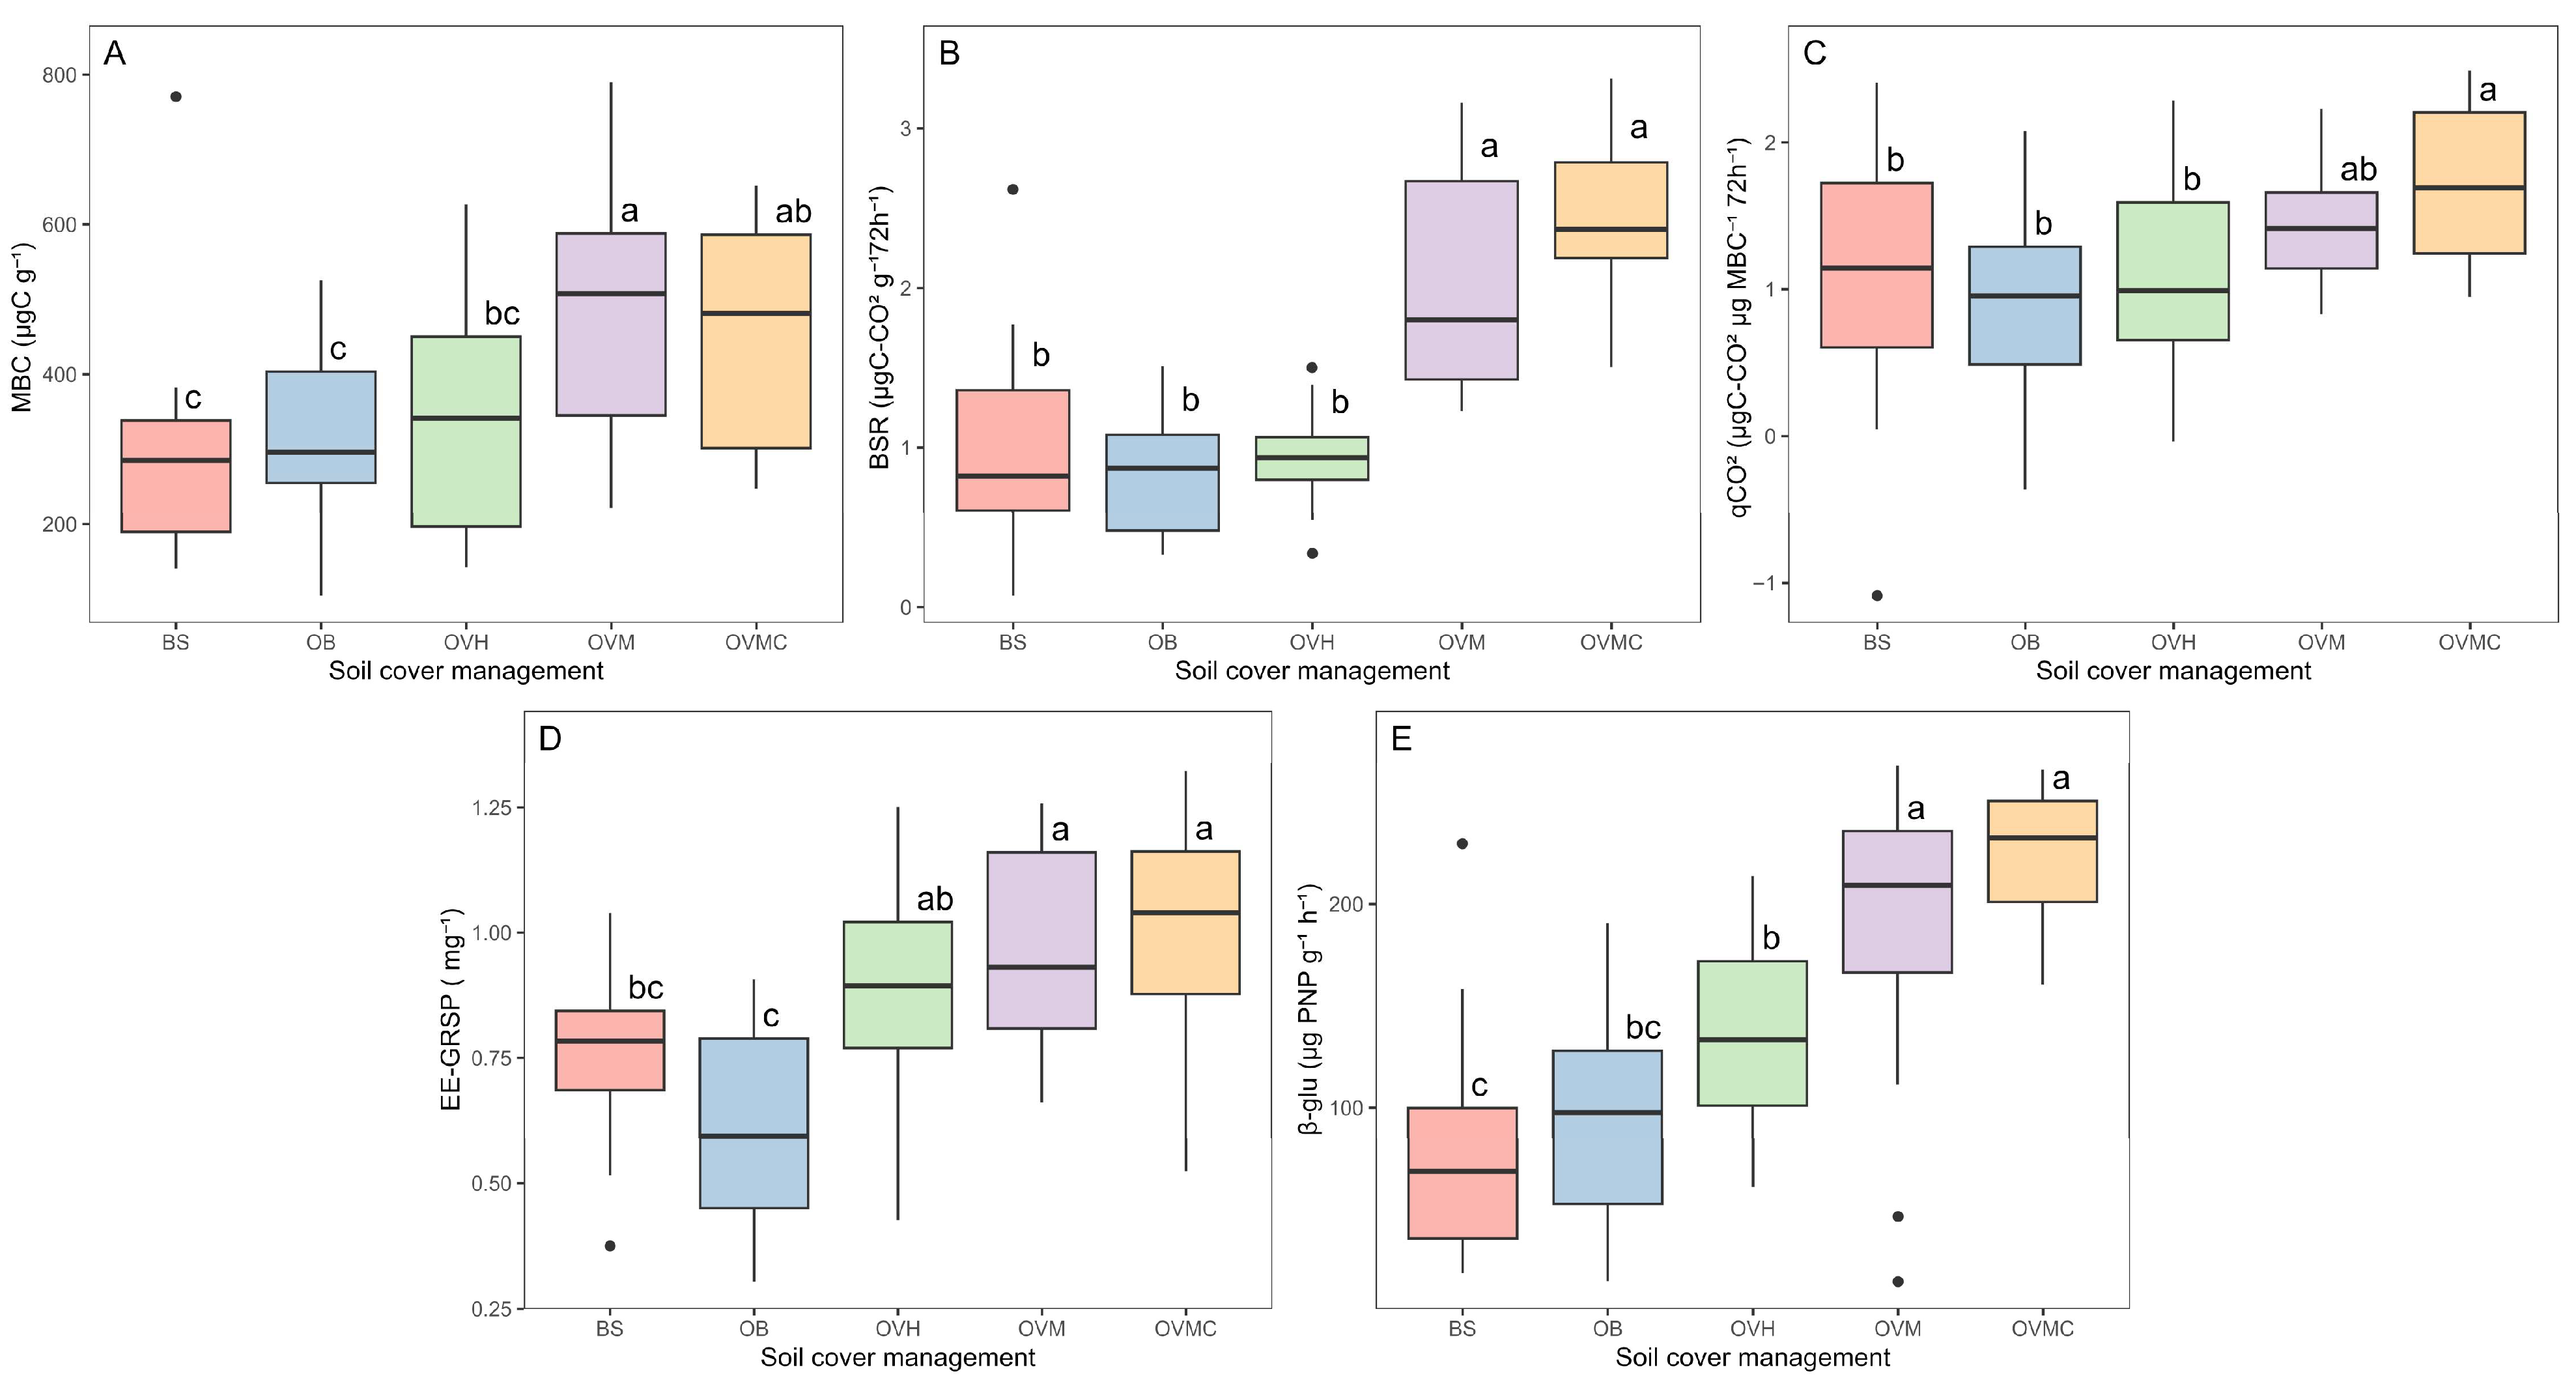
MBC, BSR, and qCO2 were significantly affected by cover plant management (p < 0.05) (Figure 3A–C). MBC was highest under OVM and OVMC and lowest in BS, with a ~40% reduction. In OVH, herbicide use negatively impacted microbial activity, with MBC, BSR and qCO2 levels similar to BS and OB.
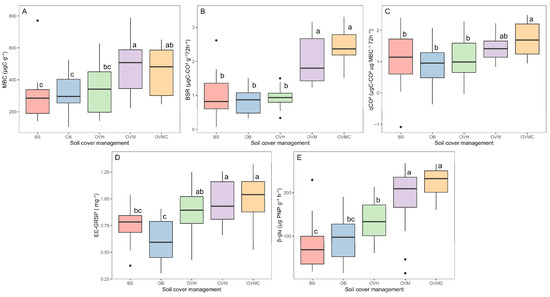
Figure 3.
Different letters differ by Tukey’s test (p < 0.05). Microbial activity indicators under different soil cover management treatments: (A) microbial biomass carbon (MBC); (B) basal soil respiration (BSR); (C) metabolic quotient (qCO2); (D) Easily extractable glomalin-related soil protein (EE-GRSP); and (E) β-glucosidase (β-glu) activity. BS: bare soil; OB: olive trees on bare soil; OVH: olive trees with spontaneous vegetation managed by herbicide; OVM: olive trees with mowed spontaneous vegetation; and OVMC: olive trees with mowed spontaneous vegetation and weed control around trees.
EE-GRSP also varied significantly among treatments (p < 0.05), ranging from 0.6 mg g−1 in OB to 1.0 mg g−1 in OVMC (Figure 3D). Higher EE-GRSP concentrations were observed in OVM and OVMC, following the same trend as MBC and SOM.
The β-glu activity differed significantly among cover management treatments (p < 0.05) (Figure 3E). Highest enzymatic activities occurred in OVM and OVMC, while OB, OVH and BS showed the lowest. The absence of soil cover reduced the enzymatic activity by up to 64%.
The plot position influenced BSR and qCO2, both of which were higher in the lower third compared to the upper third. No significant differences were observed in MBC, β-glu, or EE-GRSP by plot position (Table 8).

Table 8.
Microbiological indicators of the soil as a function of the positions of the standard plot of the experimental area.
The aggregate size significantly influenced biological indicators, with the exception of MBC, the BSR, and qCO2, the β-glu activity also increased as the aggregate size decreased (p < 0.05), with higher activity in the <2 mm fraction. EE-GRSP followed the same trend, with higher concentrations in smaller aggregates (Table 9).

Table 9.
Microbiological indicators of the soil as a function of the soil aggregate sizes of the experimental area.
3.4. Aggregate Stability and Soil and Water Losses
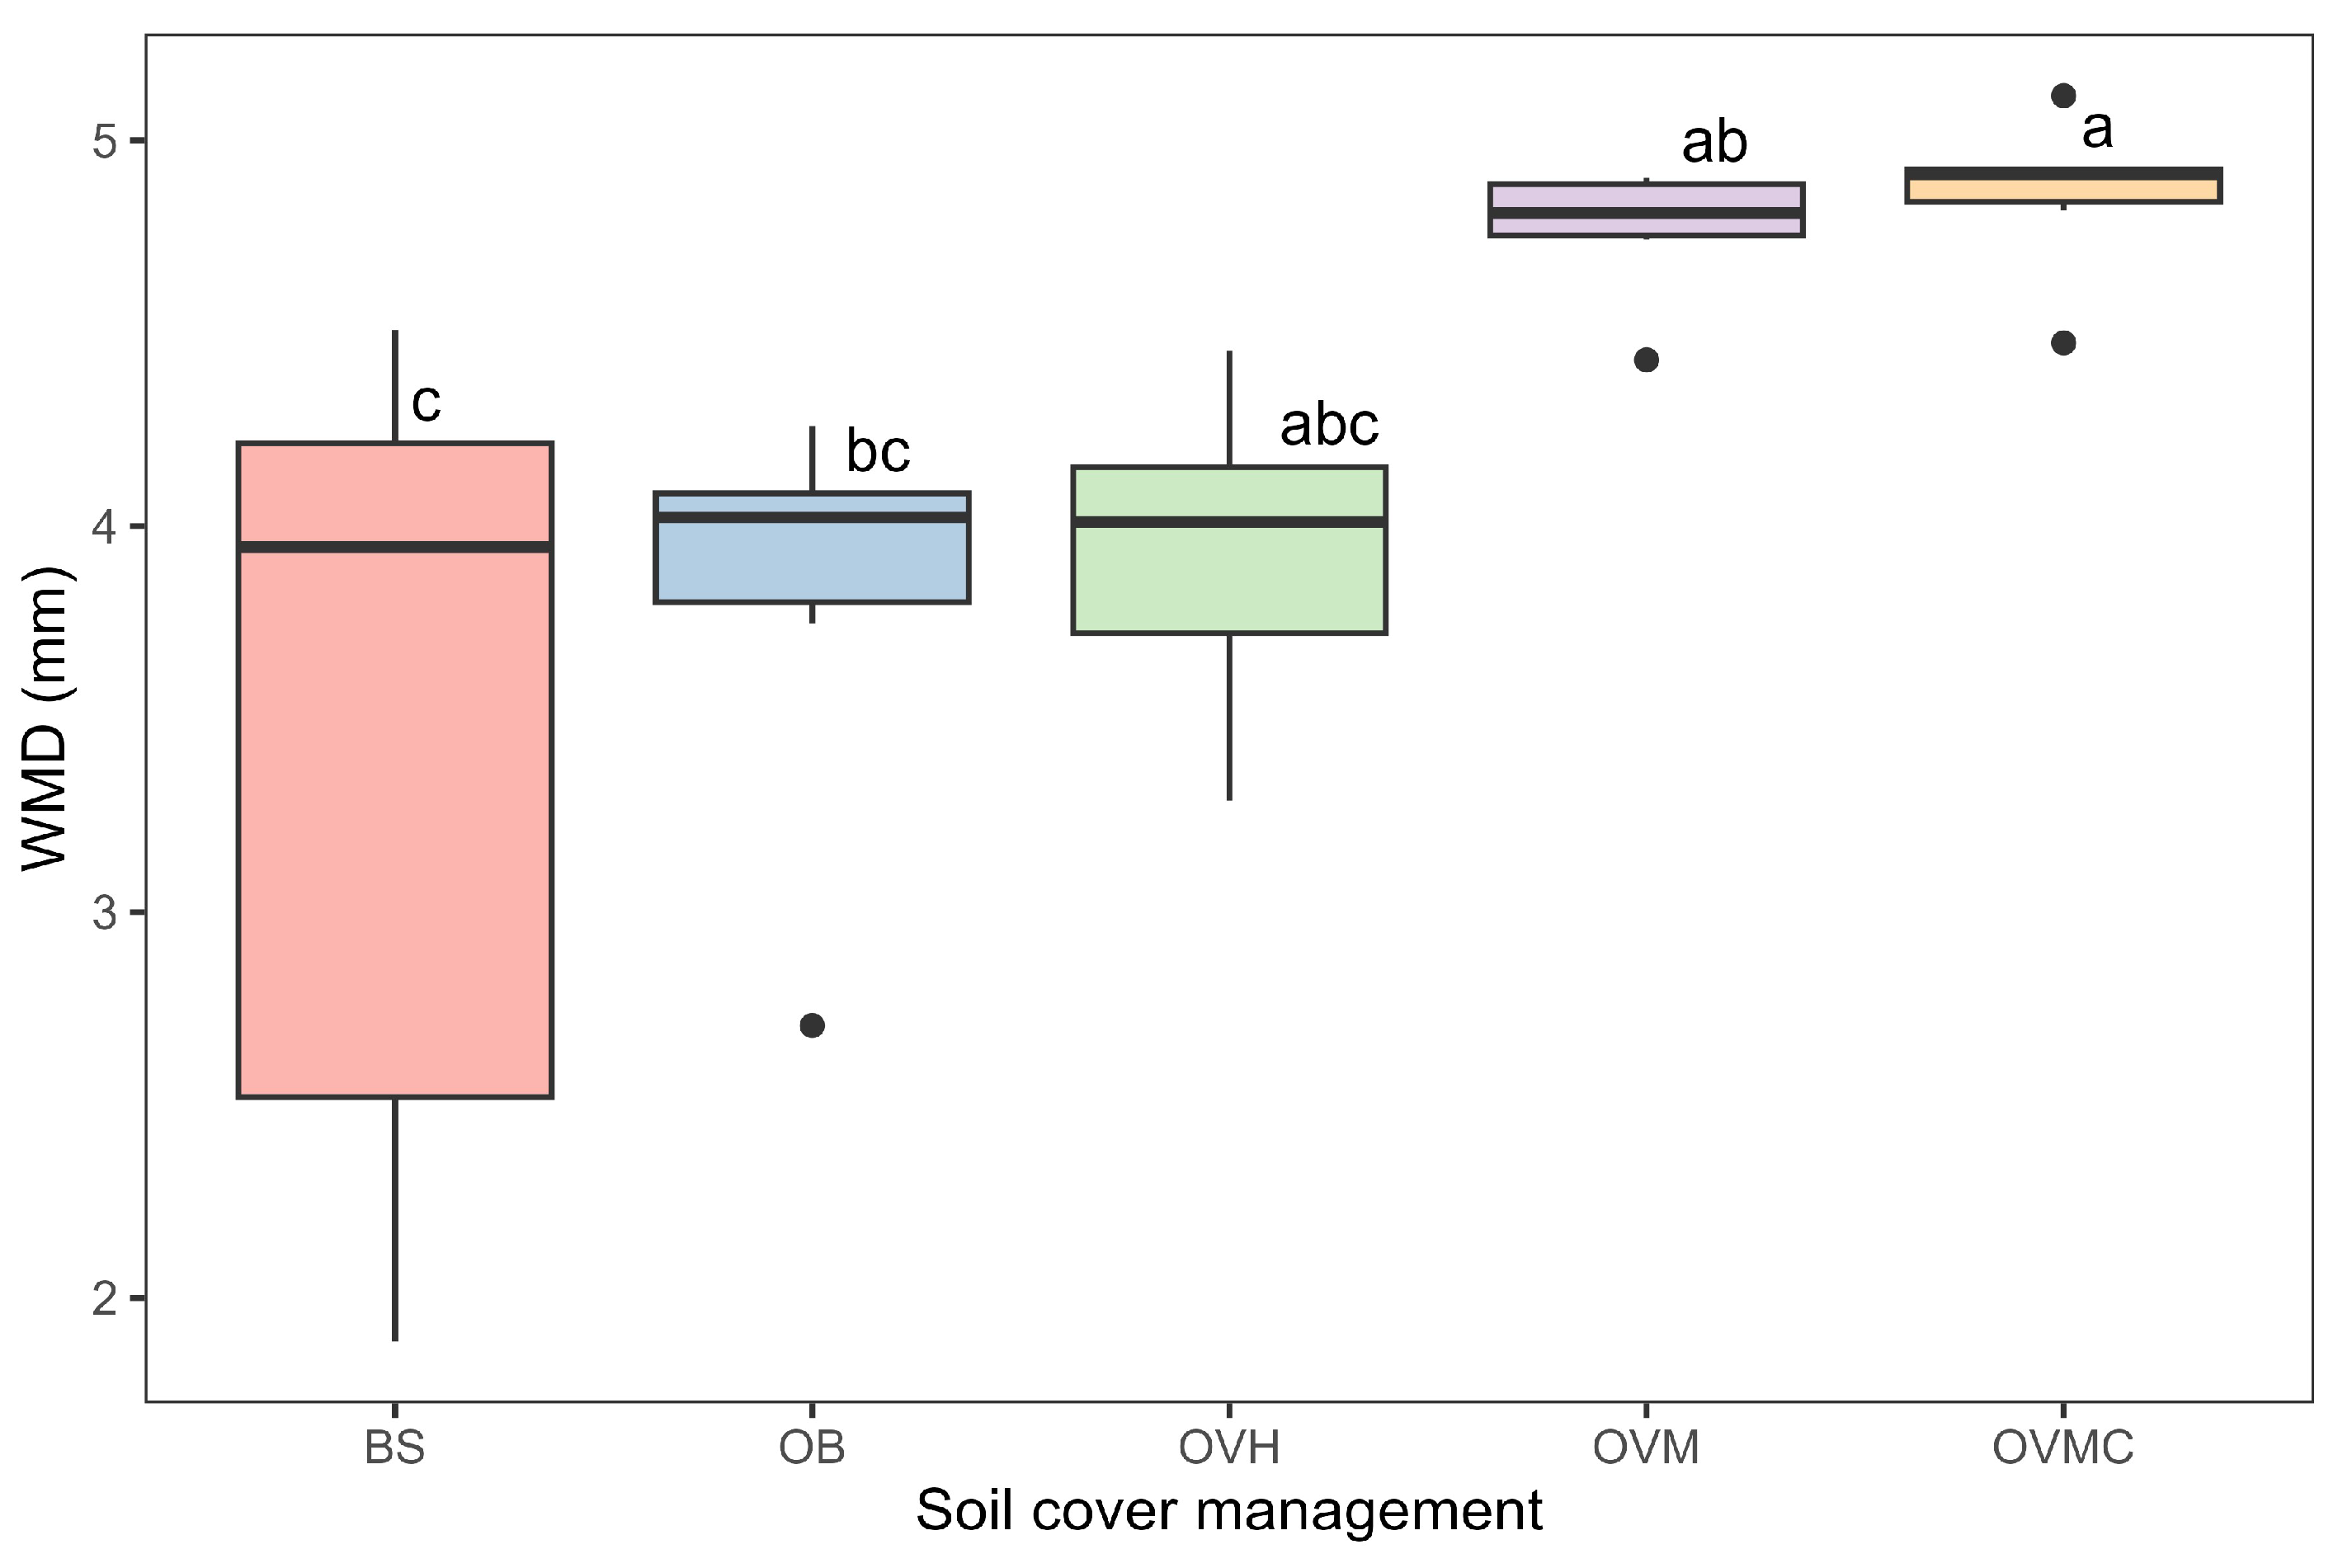
Aggregate stability, assessed by WMD, ranged from 3.4 to 4.9 mm (Figure 4). The OVM and OVMC treatments provided the highest aggregate stability values, while the BS treatment resulted in the lowest stability, indicating greater susceptibility to water erosion.
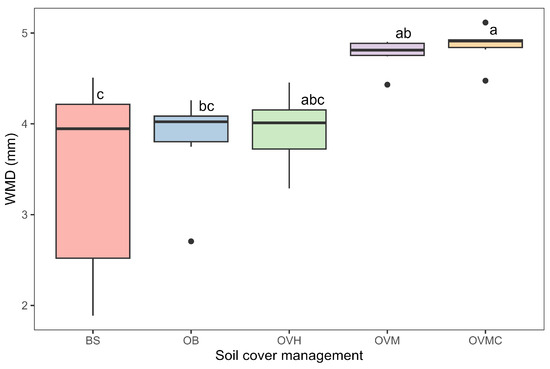
Figure 4.
Aggregate stability, as influenced by soil cover management treatments, expressed as weighted mean diameter (WMD). Mean values followed by different letters differ significantly according to Tukey’s test (p < 0.05). BS: bare soil; OB: olive trees on bare soil; OVH: olive trees with spontaneous vegetation managed by herbicide; OVM: olive trees with mowed spontaneous vegetation; and OVMC: olive trees with mowed spontaneous vegetation and weed control around trees.
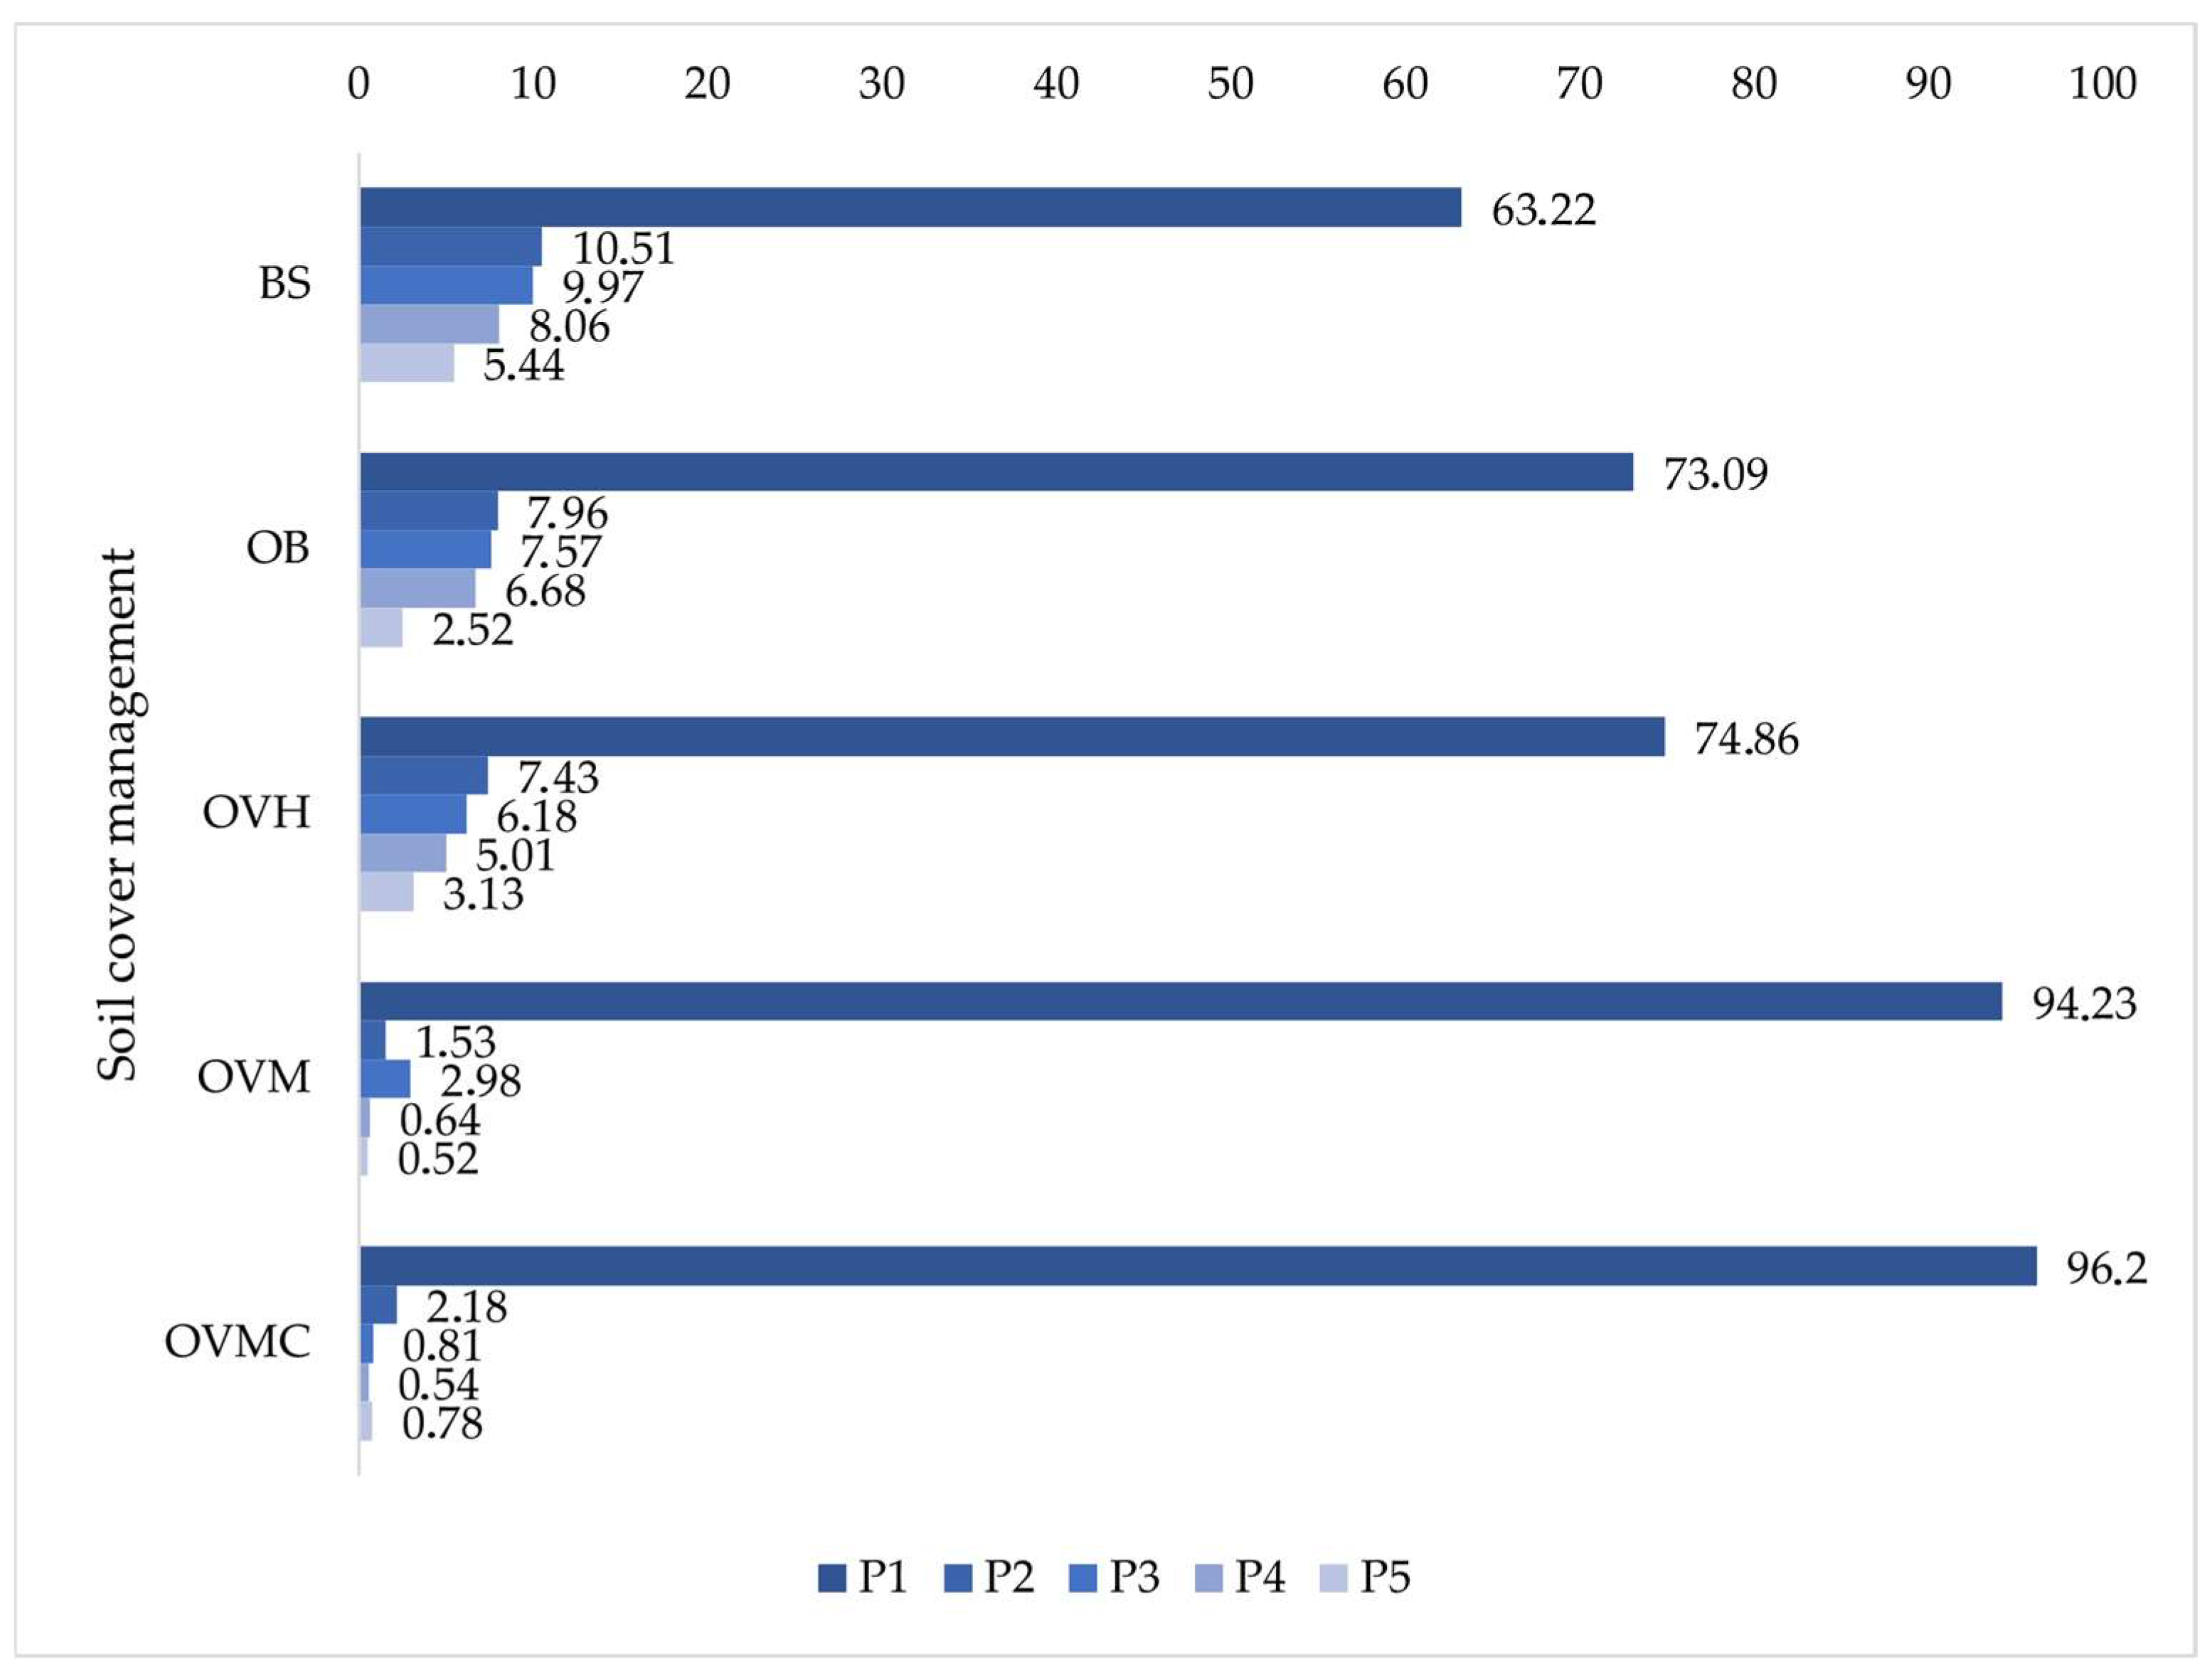
Aggregate size distribution (Figure 5) revealed that more than 90% of aggregates in OVM and OVMC were concentrated in the 8.00–2.00 mm class (P1) under WM. In contrast, BS, OB, and OVH had less than 75% in this stable fraction. Confirming reduced structural stability under these conditions.
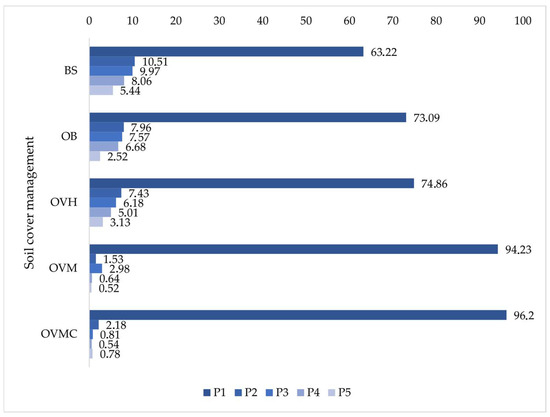
Figure 5.
Distribution percentage of soil aggregate size classes (0.0–0.5 cm depth layer) under different soil cover management treatments. BS: bare soil; OB: olive trees on bare soil; OVH: olive trees with spontaneous vegetation managed by herbicide; OVM: olive trees with mowed spontaneous vegetation; and OVMC: olive trees with mowed spontaneous vegetation and weed control around trees. P1: 8.00–2.00 mm; P2: 2.00–1.00 mm; P3: 1.00–0.50 mm; P4: 0.50–0.25 mm; P5: 0.25–0.105 mm.
3.5. Rainfall Erosivity
Table 10 shows the monthly and total annual distribution of rainfall and rainfall erosivity for the 2020/2021 period. According to the data, the months from November to March were the most erosive, with 96.2% of the total annual rainfall erosivity.

Table 10.
Monthly and total annual rainfall and erosivity (EI30).
High variance was found in soil loss and water loss (Table 11), which restricted the evidence of differences among the treatments. However, it can be affirmed that the lack of plant cover is directly related to high soil losses in OB management, and water losses in BS management. The treatments where the soil cover was OVM, OVMC, and OVH showed the lowest losses in the two variables studied, because these management treatments have greater coverage and protection against erosion agents (Table 11).

Table 11.
Soil and water losses in the different cover plant management systems of the experimental area.
3.6. Principal Component Analysis (PCA)
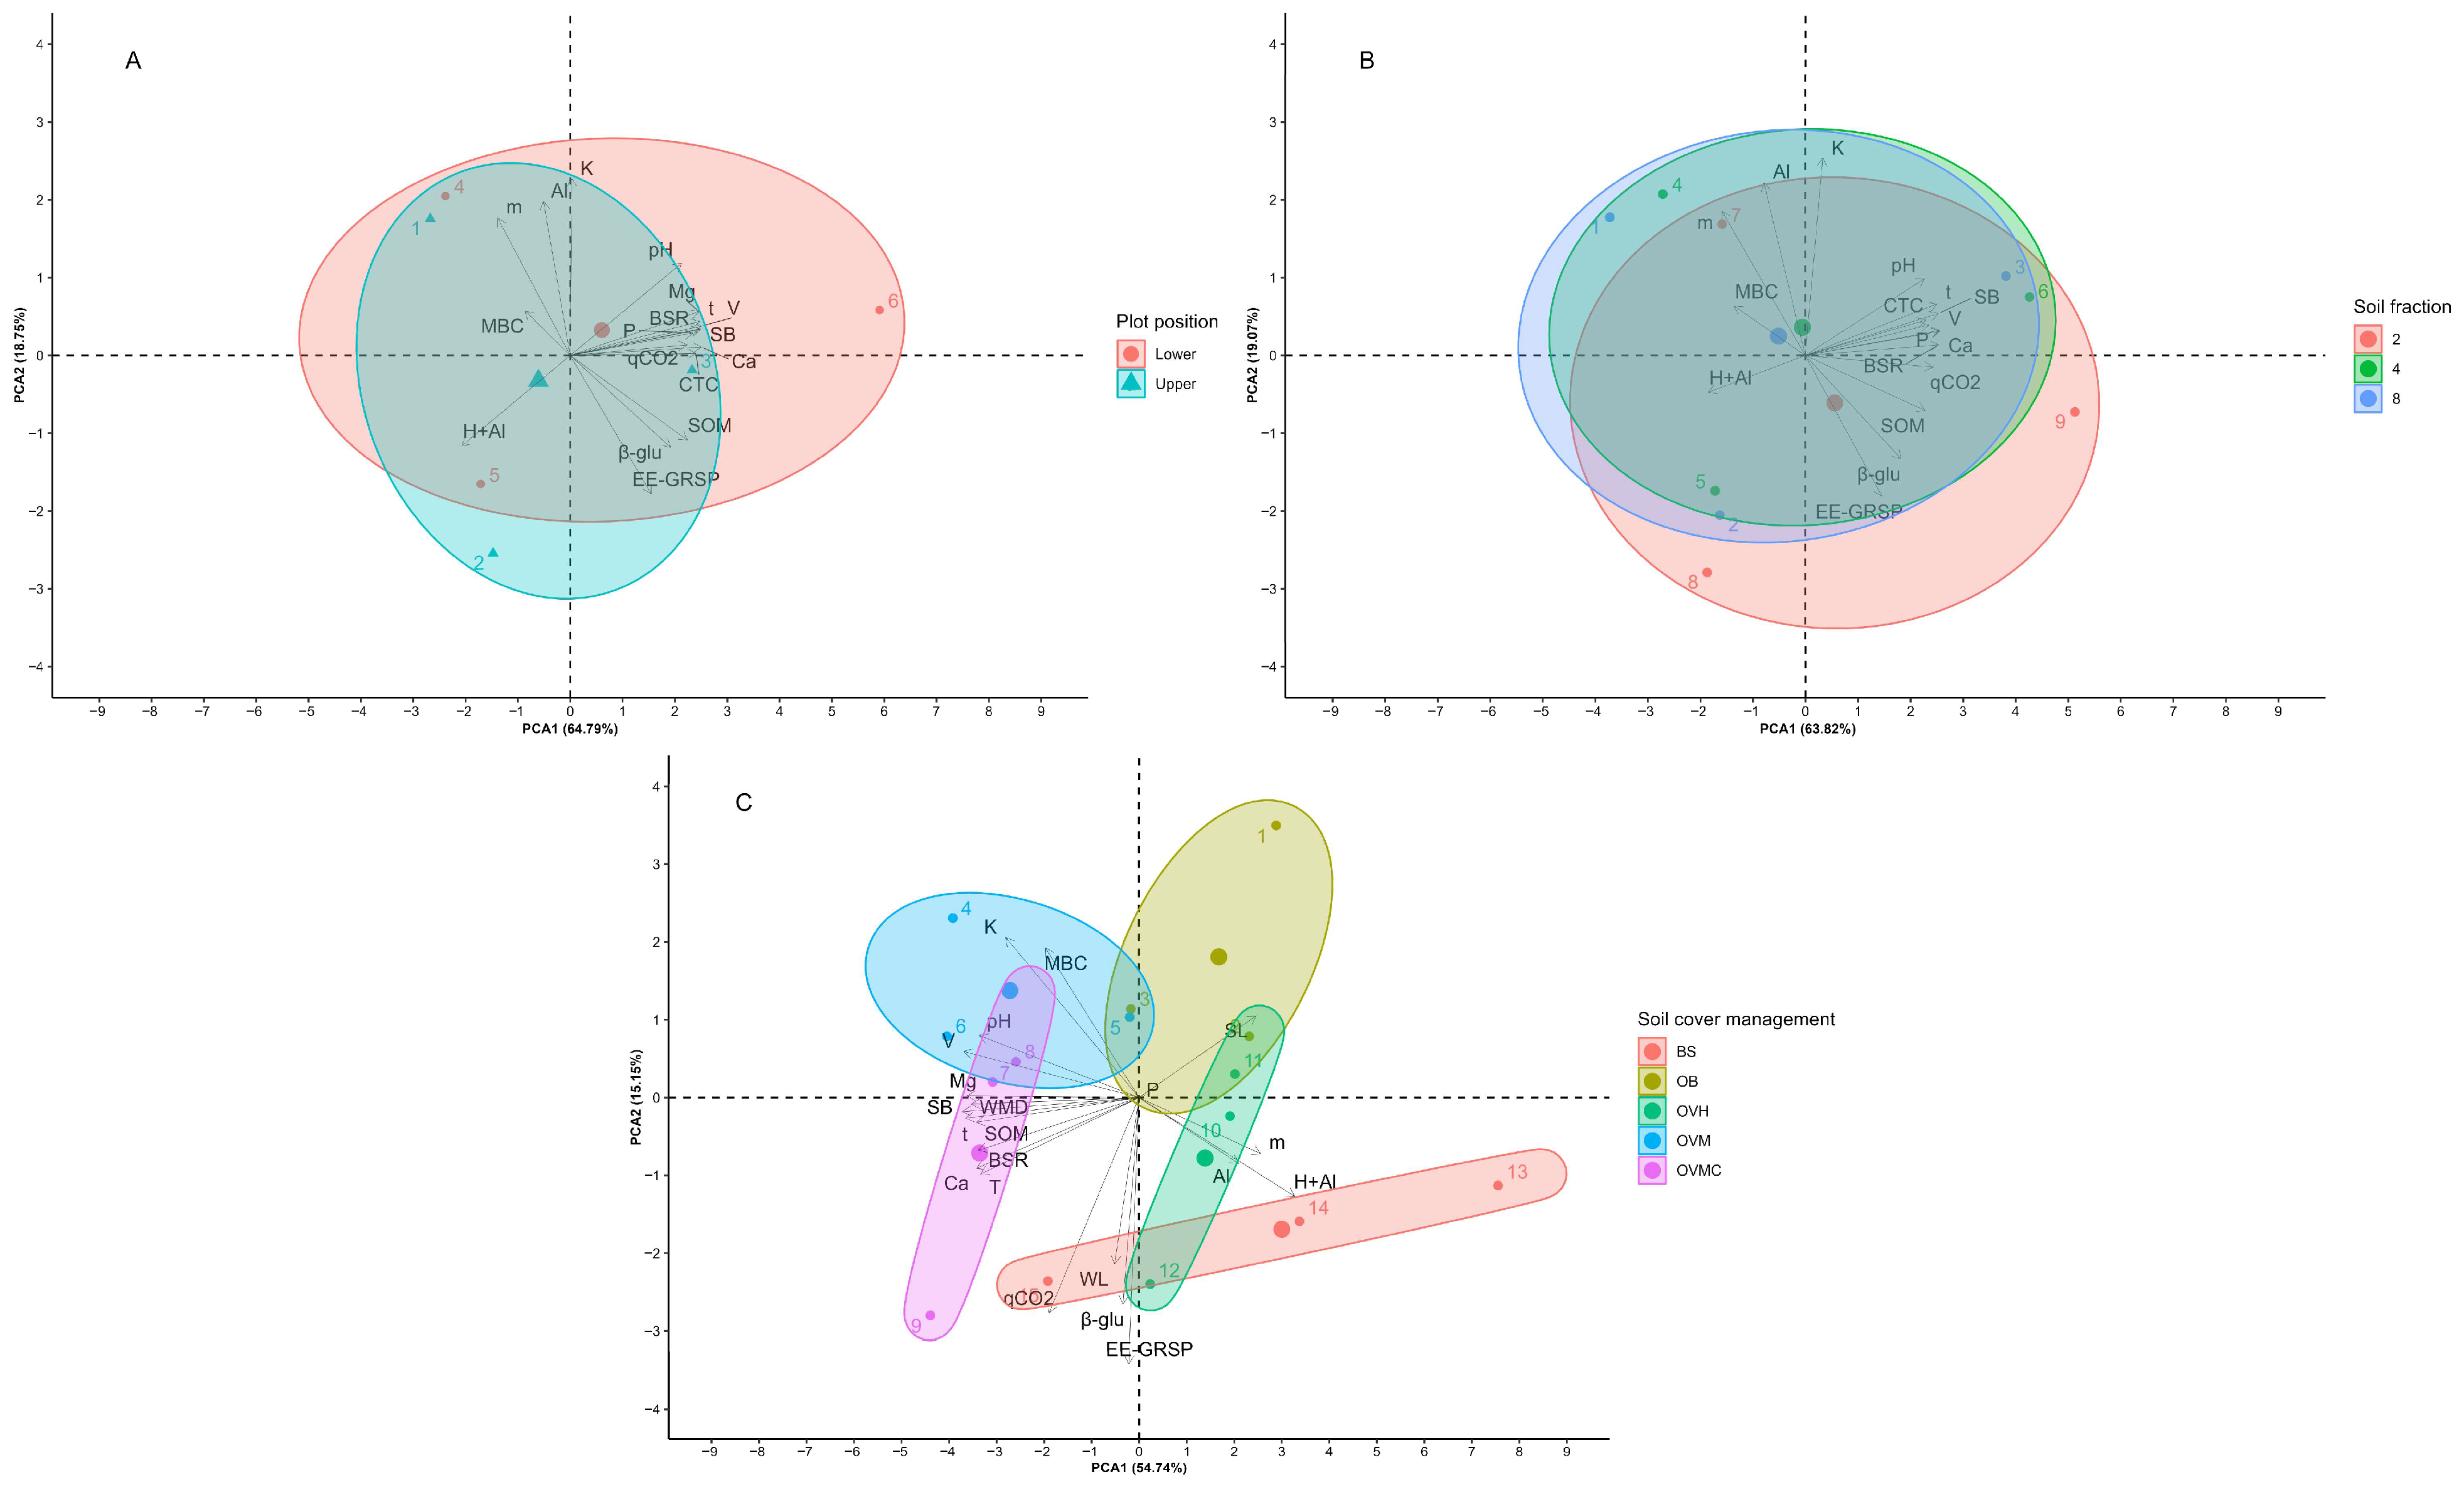
Multivariate analysis showed significant differences in the three factors regarding the physical, chemical, and biological indicators (Figure 6). The first two components resulting from the PCA under the effect of the position in the plot represented 83.54% of the total variation of the indicators. The upper part showed higher values in most of the indicators, except for pH, which was more expressive in the lower third of the plots.
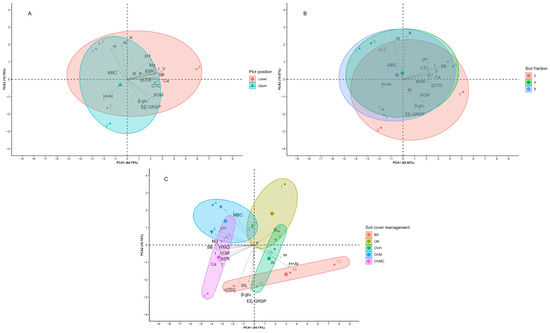
Figure 6.
Principal component analysis (PCA) of the chemical, physical, and biological soil quality indicators according to (A) plot position; (B) soil aggregate size; and (C) soil cover management treatments. BS: bare soil; OB: olive trees on bare soil; OVH: olive trees with spontaneous vegetation managed by herbicide; OVM: olive trees with mowed spontaneous vegetation; and OVMC: olive trees with mowed spontaneous vegetation and weed control around trees.
The first two components resulting from the PCA under the effect of the soil fraction represented 82.89% of the variation of the indicators; however, they did not allow differentiation regarding soil fractionation due to the wide dispersion of the data (Figure 6).
The principal components resulting from the PCA affected by cover plant management represented 69.89%, and were quite effective in discriminating the management treatments. SL was highly correlated with OB; and the indicators H + Al, WL, and qCO2 were highly correlated with BS, consequently, by the lack of plant cover in these treatments. The other indicators, most notably MBC, WMD, BSR, and SOM, showed high correlation with the cover plant management treatments that maintained the soil covered (Figure 6).
4. Discussion
4.1. Soil Chemical Indicators Influenced by Cover Management, Plot Position, and Aggregate Size
The cover plant management practices involving mowing and manual weeding around olive trees (OVM and OVMC) exhibited higher concentrations of exchangeable cations (K+. Ca2+. Mg2+), base saturation (V%), and sum of bases (SB) compared to the other treatments (Table 4). In contrast, the bare soil (BS) treatment presented a substantial decline—approximately 41% in soil organic matter (SOM)—due to the absence of vegetative cover and the reduced input of plant residues, leading to lower SOM accumulation. This pattern aligns with the findings by Rodrigues et al. [42], who observed that herbicide use, grazing, and tillage in olive orchards diminished soil fertility by limiting organic residue deposition, and consequently impeding SOM formation and nutrient cycling.
SOM is a pivotal component of soil fertility as it contributes to the availability of essential nutrients (e.g., N, P, S, Ca2+, Mg2+) and plays a critical role in buffering soil acidity [43,44]. Moreover, nutrient depletion through water erosion, particularly in uncovered soils, exacerbates fertility losses [45,46]. In the present study, the surface horizon (0–5 cm) exhibited pH values ranging from 4.9 to 5.4. indicating a strongly acidic condition that is suboptimal for olive cultivation.
Although the olive tree is considered nutritionally undemanding, it is native to neutral to alkaline soils, and its growth can be hindered by acidic environments [47], where nutrient availability declines sharply, and the solubility of toxic metals increases, further impairing plant development. Despite the differences observed across treatments and aggregate size classes, the soil pH remained consistently acidic (Table 4), which is typical of tropical and subtropical soils. These soils, influenced by intense weathering and high precipitation, often develop a kaolinitic to oxidic mineralogy, contributing to their natural acidity and reduced nutrient reserves [20].
The higher accumulation of SOM in the treatments with mowing and crowning was likely due to enhanced residue deposition and biological activity on the soil surface, which also promoted soil structure stabilization. Consequently, soil cover management in olive orchards plays a crucial role in the formation of stable aggregates, improving erosion resistance, particularly under sloped topography, as observed in this study.
4.2. Soil Biological Indicators in Response to Cover Crop Management, Plot Position, and Aggregate Size Distribution
The cover crop management strategies, specifically OVM and OVMC, promoted significant increases in microbial biomass carbon (MBC) by 40% and 37%, respectively, compared to the bare soil treatment (BS) (Figure 3A). These strategies not only enhance soil surface protection but also favor increased plant diversity in the inter-row. Enhanced plant diversity results in increased root exudation and litter deposition, thereby enriching the substrate availability for soil microorganisms and fostering a more active microbial community [48].
Notably, in 2016 and 2017, the plots received leguminous species characterized by a low C/N ratio. These legumes, in symbiotic association with nitrogen-fixing bacteria, contributed to the biological fixation of atmospheric nitrogen, enhancing the input of easily decomposable residues and further stimulating microbial activity [49].
Soil cover plays a fundamental role in maintaining microbial activity and ensuring the sustainability of agroecosystems. The absence of cover in OB, BS, and OVH treatments resulted in lower microbial biomass and activity (Figure 3A), attributable to the diminished inputs of soil organic matter (SOM) (Table 4), which is a primary energy and nutrient source for the microbial community. Microbial biomass, a sensitive indicator of changes in land use and management, proliferates in response to organic inputs, including decomposable residues and root exudates [50,51].
The increased input of organic substrates through surface litter, dead roots, and especially rhizodeposition in the rhizosphere, supports heterotrophic microbial populations and is reflected in enhanced SOM accumulation [48,52]. This is corroborated by the observed increase in soil basal respiration in OVM and OVMC treatments—50% and 60% higher than in OB—indicating elevated heterotrophic activity and associated gains in MBC and SOM (Figure 3A, Table 4).
The glycoprotein EE-GRSP. secreted primarily by arbuscular mycorrhizal fungi (AMF), is a critical component for soil aggregate stability [35,52,53]. The action of AMF in aggregate stabilization highlights their potential as a biological input in agroecosystems. particularly due to their role in increasing EE-GRSP levels and thus improving soil structural stability [54,55]. Although AMF inoculation remains a developing biotechnology, cover crop management in olive grove inter-rows demonstrated effectiveness in enhancing EE-GRSP concentrations (Figure 3D).
In covered soils, macroaggregates are stabilized through biological interactions involving fine roots and fungal hyphae. However, aggregate formation in surface horizons is highly dynamic. At the hierarchical level, macroaggregates (0.25–5 mm) encompass numerous microaggregates (2–250 µm), which are formed by the interplay of physical, chemical, and biological mechanisms [53,56]. Microbial mucilages and extracellular polysaccharides, produced by soil bacteria and fungi, play essential roles in this stabilization process [57]. In particular, EE-GRSP, together with microbial biomass and organic carbon, functions as a key binding agent enhancing aggregate integrity [58]. These biological processes are stimulated by conservation-oriented practices that increase SOM inputs and rhizodeposition.
Basal soil respiration (BSR) and metabolic quotient (qCO2) varied with the position within the plot, showing greater microbial activity in the lower third. This trend can be attributed to sediment accumulation and higher moisture availability in the lower sections, irrespective of the management system [59]. Microtopographic factors such as slope can influence these patterns by modifying water and organic matter distribution and indirectly affecting microbial dynamics [60,61]. However, the β-glucosidase (β-glu) activity was not significantly influenced by plot position, unlike MBC and EE-GRSP (Table 8).
In contrast, β-glu activity was markedly enhanced in treatments with plant cover (Figure 5), particularly in those managed with mowing and targeted weed control, which showed a nearly three-fold higher enzymatic activity compared to bare soil treatments. Soil enzymatic activity is directly influenced by SOM and rhizodeposition [48,52,62]. These enzymes, produced by soil macro- and microorganisms as part of the metabolic processes, also originate from the lysis of senescent cells, linking their activity to both living biomass and detrital inputs. β-glu in particular catalyzes the mineralization of organic matter during decomposition, indicating its relevance in carbon cycling [36,53,63].
β-glu activity also differed according to aggregate size (Table 9), with smaller aggregates (<2 mm) exhibiting higher enzymatic activity. This suggests that microhabitats within fine aggregates facilitate the enzymatic cleavage of glycosidic bonds [62,64]. However, contrasting findings by Perez-Mateos and Gonzalez [65] and Busto and Perez-Mateos [66] suggest that larger aggregates may host more enzymatic activity when pre-moistening is not applied during fractionation, likely due to the greater retention of organic substrates. Furthermore, Bach and Hofmockel [67] found that wet sieving during aggregate isolation may artificially stimulate extracellular enzyme activity, emphasizing that laboratory methodologies can influence measurements. Soil aggregates are inherently dynamic, undergoing continuous transformations in their biological, chemical, and physical attributes, which directly influence plant growth and nutrient availability [57]. Understanding the biological underpinnings of aggregate formation and their modulation by management systems is critical for optimizing agroecosystem functionality.
Given that β-glu acts on organic substrates in the process of humification and indirectly relates to the formation of EE-GRSP—a stable recalcitrant carbon fraction—which follows that the increased values of these two indicators reflect enhanced carbon conservation and sequestration in the soil. Even when total SOM and MBC do not yet exhibit marked changes, the elevated β-glu and EE-GRSP point to ongoing improvements in carbon dynamics under conservation-oriented management. These two biological indicators proved more sensitive than others in detecting the improvements in soil quality associated with different cover crop management strategies in olive orchards.
In general, the cover management was the preponderant factor in modifying the soil properties with olive groves, and it was the management with plants between the rows that led to an increase in the microbiological quality indicators of these soils.
4.3. Effects of Soil Cover Management on Erosion Losses and Aggregate Stability
The high coefficient of variation observed, especially for soil loss, is explained by the highly punctual and sensitive nature of the erosion process, associated with marked differences between treatments. Furthermore, the extremely low loss values in systems with effective vegetation cover (<0.05 Mg ha−1) mathematically increase the CV, even when there is low absolute dispersion between replicates. These high rates of soil and water loss observed under the OB treatment highlight the low sustainability and high vulnerability of olive groves managed without plant cover, particularly on sloping terrains such as those characterized by Cambisols (Table 11). These losses are comparable to those recorded in the bare soil (BS) treatment, underscoring the role of vegetative cover in erosion control. The absence of surface phytomass exposes the soil directly to the raindrop impact and surface runoff, intensifying the detachment and transport of soil particles [38]. Furthermore, the intrinsic properties of Cambisols—characterized by a silty texture, blocky structure, shallow depth, and low water permeability—exacerbate their natural susceptibility to water erosion, particularly in hilly landscapes [20].
The implementation of cover crops proved effective in mitigating the erosive processes, reinforcing the importance of adopting conservationist strategies in olive orchards, especially given the increasing expansion of this crop and the limited data on erosion dynamics under different management systems [68,69]. Beyond their environmental benefits, these practices contribute to agronomic efficiency by enhancing productivity and reducing the losses of topsoil, water, organic carbon, and nutrients [70].
Aggregate stability, assessed through the weighted mean diameter (WMD) and aggregate size distribution, further corroborated the positive influence of plant cover. Plots managed with mowing and localized weed control promoted improved soil structure and enhanced sustainability when compared to uncovered areas (Figure 4). In bare soils, the lack of protective vegetation leads to structurally weaker aggregates that are more susceptible to disintegration under external mechanical forces [71]. In contrast, vegetated systems support the formation of larger, more stable aggregates, which facilitate greater rainfall infiltration and reduce surface runoff [38].
Additionally, the presence of plant cover enhances the input of organic matter, stimulating microbial activity and the synthesis of humic substances. This biotic activity contributes to the development of stable soil aggregates, reinforcing structural resilience and promoting long-term soil functionality. Thus, soil cover not only mitigates erosion but also plays a crucial role in improving soil physical quality and maintaining ecosystem services in olive groves established on erosion-prone soils.
5. Conclusions
Soil cover management in olive groves exerts a direct influence on the deposition of organic residues and their subsequent transformation into soil organic matter (SOM). thereby promoting improvements in soil aggregation processes. These structural enhancements lead to the formation of more stable aggregates. Which, in turn, increase the soil’s resistance to erosive forces—even under sloping conditions such as those present in the study area.
The spatial positioning of plots, particularly in erosion-prone upper slopes and sediment-accumulating lower slopes, highlights the greater susceptibility of olive groves without vegetative cover to soil degradation. This vulnerability is primarily due to the lower SOM content and reduced microbial biomass carbon, both of which are critical indicators of soil quality.
Aggregate size distribution proved to be sensitive to soil chemical properties, especially potential acidity. Larger aggregates exhibited higher acidity levels, whereas smaller aggregates were associated with elevated β-glucosidase enzymatic activity and greater concentrations of soil proteins related to easily extractable glomalin—both of which are essential for microbial functionality and aggregate stability.
Overall, mulch-based management emerged as the most effective practice for enhancing soil quality in olive orchards. Systems that maintain vegetative cover between tree rows significantly improved microbiological indicators, particularly when spontaneous vegetation was managed through mowing and selective crowning. These practices contributed to higher carbon inputs into the soil, improving the surface layer quality by enhancing SOM preservation, reducing soil and water losses, and promoting aggregate stability—factors that are indispensable for ensuring the long-term sustainability of olive cultivation in tropical and subtropical environments.
Ultimately, a deeper understanding of the biological mechanisms underlying aggregate formation and how they are modulated by soil management practices is essential for guiding the selection of optimal soil cover strategies. Such insight is critical for maximizing ecosystem functions and advancing sustainable land use in perennial cropping systems.
Supplementary Materials
The following supporting information can be downloaded at: https://www.mdpi.com/article/10.3390/soilsystems9030096/s1, Supplementary Material S1: Full results of the analysis of variance (ANOVA) corresponding to Table 3 of the manuscript.
Author Contributions
Conceptualization: L.d.C.B. and M.L.N.S.; methodology: L.d.C.B.; software: L.d.C.B.; validation: L.d.C.B., A.O.S. and E.M.S.; formal analysis: L.d.C.B. investigation: L.d.C.B.; resources: M.L.N.S. and M.A.C.C.; data curation: L.d.C.B. and E.M.S.; writing—original draft preparation: L.d.C.B., M.L.N.S., J.C.A. and M.A.C.C.; writing—review and editing: L.d.C.B., P.A.J.J. and M.L.N.S.; visualization: L.d.C.B., D.S. and M.L.N.S.; supervision: M.L.N.S.; project administration: L.d.C.B. and M.L.N.S.; funding acquisition: M.L.N.S. and M.A.C.C. All authors have read and agreed to the published version of the manuscript.
Funding
This research was funded by the Coordination for the Improvement of Higher Education Personnel (CAPES) (code 001), the National Council for Scientific and Technological Development (CNPq) (processes: 307950/2021-2), and the Foundation for Research Support of the State of Minas Gerais (FAPEMIG) (processes: APQ 00802-18).
Data Availability Statement
The raw data supporting the conclusions of this article will be made available by the authors upon request.
Acknowledgments
We would like to thank CAPES. CNPQ. FAPEMIG and Department of Soil Science Federal University of Lavras (UFLA).
Conflicts of Interest
The authors declare no conflicts of interest.
Abbreviations
The following abbreviations are used in this manuscript:
| OB | Olive trees grown on bare soil |
| OVM | Olive trees within spontaneous vegetation managed by mowing |
| OVMC | Olive trees within spontaneous vegetation managed by mowing and weed control around olive trees |
| OVH | Olive trees within spontaneous vegetation managed by herbicide |
| BS | Bare soil |
| PCA | Principal component analysis |
| WMD | Weighted mean diameter |
| SOM | Soil organic matter |
| MBC | Microbial biomass carbon |
| qCO2 | Metabolic quotient |
| EE-GRSP | Easily extractable glomalin-related soil protein |
| β-glu | β-glucosidase |
References
- Villa, F.; Oliveira, A.F. De Origem e expansão da oliveira na América Latina. In Oliveira no Brasil Tecnologias de Produção; de Oliveira, A.F., Ed.; EPAMIG: Belo Horizonte, Brazil, 2012; pp. 21–38. [Google Scholar]
- Costa, S.M.L.; Melloni, R.; dos Reis Ferreira, G.M. Biotechnological potential of soil microorganisms in olive trees in Brazil: A Review. Rev. Agronegocio Meio Ambiente 2019, 12, 723–747. [Google Scholar] [CrossRef]
- Neto, J.V.; Oliveira, A.F.; Oliveira, N.C.; Duarte, H.S.S.; Gonçalves, E.D. Aspectos Técnicos da Cultura da Oliveira; EPAMIG: Belo Horizonte, Brazil, 2008; pp. 1–56. [Google Scholar]
- Coutinho, E.F.; Cappellaro, T.H.; Ribeiro, F.C.; Haerter, J.A. Introdução e importância econômica. In Sistemas de Produção: Cultivo de Oliveira (Olea europaea L.); Embrapa Clima Temperado: Pelotas, Brazil, 2009; pp. 17–20. [Google Scholar]
- Larbi, A.; Ayadi, M.; Ben Dhiab, A.; Msallem, M.; Caballero, J.M. Planting density affects vigour and production of ‘Arbequina’ olive. Span. J. Agric. Res. 2012, 10, 1081–1089. [Google Scholar] [CrossRef]
- Kavvadias, V.; Koubouris, G. Sustainable soil management practices in olive groves. In Soil Fertility Management for Sustainable Development; Panpatte, D., Jhala, Y., Eds.; Springer: Singapore, 2019; pp. 167–188. ISBN 9789811359040. [Google Scholar]
- Gómez, J.; Infante-Amate, J.; De Molina, M.; Vanwalleghem, T.; Taguas, E.; Lorite, I. Olive cultivation, its impact on soil erosion and its progression into yield impacts in southern spain in the past as a key to a future of increasing climate uncertainty. Agriculture 2014, 4, 170–198. [Google Scholar] [CrossRef]
- Beaufoy, G. The olive oil regime. In CAP Regimes and the European Countryside: Prospects for Integration Between Agricultural, Regional and Environmental Policies, 1st ed.; Brouwer, F., Lowe, P., Eds.; CABI Publishing: Wallingford, UK, 2000; pp. 155–177. [Google Scholar]
- Rodríguez Sousa, A.A.; Muñoz-Rojas, J.; Brígido, C.; Prats, S.A. Impacts of agricultural intensification on soil erosion and sustainability of olive groves in Alentejo (Portugal). Landsc. Ecol. 2023, 38, 3479–3498. [Google Scholar] [CrossRef]
- Daryanto, S.; Fu, B.; Wang, L.; Jacinthe, P.A.; Zhao, W. Quantitative synthesis on the ecosystem services of cover crops. Earth Sci. Rev. 2018, 185, 357–373. [Google Scholar] [CrossRef]
- Barbosa, G.M.d.C.; Melo, T.R.d.; Menoncin, A.S.; Colozzi Filho, A.; Telles, T.S. No-tillage participatory quality index reflects the condition of soil management. Rev. Ciênc. Agron. 2023, 54, e20218312. [Google Scholar] [CrossRef]
- Dominchin, M.F.; Verdenelli, R.A.; Aoki, A.; Meriles, J.M. Soil microbiological and biochemical changes as a consequence of land management and water erosion in a semiarid environment. Arch. Agron. Soil Sci. 2020, 66, 763–777. [Google Scholar] [CrossRef]
- Han, C.; Zhou, W.; Gu, Y.; Wang, J.; Zhou, Y.; Xue, Y.; Shi, Z.; Siddique, K.H.M. Effects of tillage regime on soil aggregate-associated carbon, enzyme activity, and microbial community structure in a semiarid agroecosystem. Plant Soil 2024, 498, 543–559. [Google Scholar] [CrossRef]
- Jiang, X.; Wright, A.L.; Wang, J.; Li, Z. Long-term tillage effects on the distribution patterns of microbial biomass and activities within soil aggregates. Catena 2011, 87, 276–280. [Google Scholar] [CrossRef]
- Liao, Z.; Ye, S.; Wang, S. Large macro-aggregate formation improves soil bacterial metabolic activity and diversity in a chronosequence of chinese fir plantations. J. Soil Sci. Plant Nutr. 2024, 24, 3749–3761. [Google Scholar] [CrossRef]
- Fang, H.; Zhai, Y.; Li, C. Evaluating the impact of soil erosion on soil quality in an agricultural land, northeastern China. Sci. Rep. 2024, 14, 15629. [Google Scholar] [CrossRef]
- Li, M.; Li, X.; Shi, Y.; Jiang, Y.; Xue, R.; Zhang, Q. Soil enzyme activity mediated organic carbon mineralization due to soil erosion in long gentle sloping farmland in the black soil region. Sci. Total Environ. 2024, 929, 172417. [Google Scholar] [CrossRef] [PubMed]
- Wei, S.; Ding, S.; Li, Y.; Zhang, E.; Duan, X. Differential responses of soil cellulase enzymes and oxidative enzymes to soil erosion. Catena 2024, 241, 108015. [Google Scholar] [CrossRef]
- Zhang, Y.; Liu, X.; Li, P.; Xiao, L. Response of carbon acquisition enzyme activity and organic carbon mineralization to soil erosion and deposition. Soil Tillage Res. 2024, 243, 106169. [Google Scholar] [CrossRef]
- Santos, H.G.; Jacomine, P.K.T.; dos Anjos, L.H.C.; de Oliveira, V.A.; Lumbreras, J.F.; Coelho, M.R.; de Almeida, J.A.; Filho, J.C.A.; Oliveira, J.B.; Cunha, T.J.F. Sistema Brasileiro de Classificação de Solos, 5th ed.; Embrapa: Brasília, Brazil, 2018; pp. 175–200. [Google Scholar]
- Soil Survey Staff. Keys to Soil Taxonomy, 13th ed.; USDA-Natural Resources Conservation Service: Washington, DC, USA, 2022. Available online: https://www.nrcs.usda.gov/resources/guides-and-instructions/keys-to-soil-taxonomy#keys (accessed on 25 August 2025).
- Peel, M.C.; Finlayson, B.L.; McMahon, T.A. Updated world map of the Köppen-Geiger climate classification. Hydrol. Earth Syst. Sci. 2007, 11, 1633–1644. [Google Scholar] [CrossRef]
- Mitton, R.V.; Melo, V.F.; Pauletti, V. Do aggregate size classes of the subsurface soil horizon have different chemical/mineralogical properties? Rev. Bras. Ciênc. Solo 2019, 43, e0180041. [Google Scholar] [CrossRef]
- Oliveira, E.M.; Hermógenes, G.M.; Brito, L.d.C.; Silva, B.M.; Avanzi, J.C.; Beniaich, A.; Silva, M.L.N. Cover crop management systems improves soil quality and mitigate water erosion in tropical olive orchards. Sci. Hortic. 2024, 330, 113092. [Google Scholar] [CrossRef]
- Bouyoucos, G.J. Hydrometer method improved for making particle size analyses of soils. Agron. J. 1962, 54, 464–465. [Google Scholar] [CrossRef]
- Salton, J.C.; Silva, W.M.; Tomazi, M.; Hernani, L.C. Agregação do solo e estabilidade de agregados. In Manual de Métodos de Análise de Solo, 3rd ed.; Teixeira, P.C., Donagemma, G.K., Fontana, A., Teixeira, W.G., Eds.; Embrapa: Brasília, Brazil, 2017; pp. 129–138. [Google Scholar]
- Teixeira, P.C.; de Campos, D.V.B.; Saldanha, M.F.C. pH do solo. In Manual de Métodos de Análise de Solo, 3rd ed.; Teixeira, P.C., Donagemma, G.K., Fontana, A., Teixeira, W.G., Eds.; Embrapa: Brasília, Brazil, 2017; pp. 200–203. [Google Scholar]
- Walkley, A.; Black, I.A. An examination of the Degtjareff method for determining soil organic matter, and a proposed modification of the chromic acid titration method. Soil Sci. 1934, 37, 29–38. [Google Scholar] [CrossRef]
- Teixeira, P.C.; de Campos, D.V.B.; Bianchi, S.R.; Pérez, D.V.; Saldanha, M.F.C. Cátions Trocáveis. In Manual de Métodos de Análise de Solo, 3rd ed.; Teixeira, P.C., Donagemma, G.K., Fontana, A., Teixeira, W.G., Eds.; Embrapa: Brasília, Brazil, 2017; pp. 209–232. [Google Scholar]
- Teixeira, P.C.; de Campos, D.V.B.; Saldanha, M.F.C. Fósforo Disponível. In Manual de Métodos de Análise de Solo, 3rd ed.; Teixeira, P.C., Donagemma, G.K., Fontana, A., Teixeira, W.G., Eds.; Embrapa: Brasília, Brazil, 2017; pp. 203–208. [Google Scholar]
- Alef, K.; Nannipieri, P. Methods in Applied Soil Microbiology and Biochemistry; Academic Press: London, UK, 1995; pp. 463–490. [Google Scholar]
- Vance, E.D.; Brookes, P.C.; Jenkinson, D.S. An extraction method for measuring soil microbial biomass C. Soil Biol. Biochem. 1987, 19, 703–707. [Google Scholar] [CrossRef]
- Anderson, T.H.; Domsch, K.H. The metabolic quotient for CO2 (qCO2) as a specific activity parameter to assess the effects of environmental conditions, such as pH, on the microbial biomass of forest soils. Soil Biol. Biochem. 1993, 25, 393–395. [Google Scholar] [CrossRef]
- Bradford, M.M. A rapid and sensitive method for the quantitation of microgram quantities of protein utilizing the principle of protein-dye binding. Anal. Biochem. 1976, 72, 248–254. [Google Scholar] [CrossRef] [PubMed]
- Wright, S.F.; Upadhyaya, A. A survey of soils for aggregate stability and glomalin, a glycoprotein produced by hyphae of arbuscular mycorrhizal fungi. Plant Soil 1998, 198, 97–107. [Google Scholar] [CrossRef]
- Eivazi, F.; Tabatabai, M.A. Glucosidases and galactosidases in soils. Soil Biol. Biochem. 1988, 20, 601–606. [Google Scholar] [CrossRef]
- Aquino, R.F.; Silva, M.L.N.; Freitas, D.A.F.; Curi, N.; Mello, C.R.; Avanzi, J.C. Spatial variability of the rainfall erosivity in southern region of Minas Gerais state, Brazil. Cienc. Agrotec. 2012, 36, 533–542. [Google Scholar] [CrossRef]
- Beniaich, A.; Silva, M.L.N.; Guimarães, D.V.; Bispo, D.F.A.; Avanzi, J.C.; Curi, N.; Pio, R.; Dondeyne, S. Assessment of soil erosion in olive orchards (Olea europaea L.) under cover crops management systems in the tropical region of Brazil. Rev. Bras. Ciência Solo 2020, 44, e0190088. [Google Scholar] [CrossRef]
- Cogo, N.P.; Levien, R.; Schwarz, R.A. Perdas de solo e água por erosão hídrica influenciadas por métodos de preparo, classes de declive e níveis de fertilidade do solo. Rev. Bras. Ciênc. Solo 2003, 27, 743–753. [Google Scholar] [CrossRef]
- Peña, E.A.; Slate, E.H. Global validation of linear model assumptions. J. Am. Stat. Assoc. 2006, 101, 341–354. [Google Scholar] [CrossRef]
- Menke, W. Review of the generalized least squares method. Surv. Geophys. 2015, 36, 1–25. [Google Scholar] [CrossRef]
- Rodrigues, M.Â.; Raimundo, S.; Nanvaro, C.; Moutinho-Pereira, J.; Correia, C.M.; Arrobas, M. Gestão da vegetação em olivais de sequeiro com pastoreio. In Livro de Resumos 40a Reunião de Primavera da SPPF; Borda, A., Gomes, A., Abreu, J.M., Rodrigues, M.A., Patanita, M., Farinha, N., Eds.; Sociedade Portuguesa de Pastagens e Forragens: São Miguel, Portugal, 2019; pp. 31–32. [Google Scholar]
- Rodrigues, M.Â.; Cabanas, J.; Lopes, J.; Pavão, F.; Aguiar, C.; Arrobas, M. Ground cover and dynamic of weeds after the introduction of herbicides as soil management system in a rainfed olive orchard. Rev. Ciênc. Agrárias 2009, 32, 30–42. [Google Scholar]
- Hakoomat, A.; Arooj, M.; Sarwar, N.; Areeb, A.; Shahzad, A.N.; Hussain, S. Application of pre and post emergence herbicide under improved field irrigation system proved a sustainable weed management strategy in cotton crop. Planta Daninha 2017, 35, e017158976. [Google Scholar] [CrossRef]
- Kuncheva, G.S.; Dimitrov, P.D. Loss of nutrients by soil water erosion. In Proceedings of the 2020 7th International Conference on Energy Efficiency and Agricultural Engineering (EE&AE), Ruse, Bulgaria, 12–14 November 2020; IEEE: Ruse, Bulgaria, 2020; pp. 1–5. [Google Scholar] [CrossRef]
- Bertol, I.; Mello, E.L.; Guadagnin, J.C.; Zaparolli, A.L.V.; Carrafa, M.R. Nutrient losses by water erosion. Sci. Agric. 2003, 60, 581–586. [Google Scholar] [CrossRef]
- Nicolodi, M.; Coutinho, E.F.; Capellaro, T.H.; Ribeiro, F.C.; Araújo, F.A. Solos. In Sistemas de Produção: Cultivo de Oliveira (Olea europaea L.); Embrapa Clima Temperado: Pelotas, Brazil, 2009; pp. 29–40. [Google Scholar]
- Kuzyakov, Y.; Razavi, B.S. Rhizosphere size and shape: Temporal dynamics and spatial stationarity. Soil Biol. Biochem. 2019, 135, 343–360. [Google Scholar] [CrossRef]
- Yang, Y.; Xu, N.; Zhang, Z.; Lei, C.; Chen, B.; Qin, G.; Qiu, D.; Lu, T.; Qian, H. Deciphering microbial community and nitrogen fixation in the legume rhizosphere. J. Agric. Food Chem. 2024, 72, 5659–5670. [Google Scholar] [CrossRef]
- Melloni, R.; Cardoso, E.J.B.N. Microbiome associated with olive cultivation: A review. Plants 2023, 12, 897. [Google Scholar] [CrossRef]
- dos Santos, J.V.; Bento, L.R.; Bresolin, J.D.; Mitsuyuki, M.C.; Oliveira, P.P.A.; Pezzopane, J.R.M.; Bernardi, A.C.C.; Mendes, I.C.; Martin-Neto, L. The long-term effects of intensive grazing and silvopastoral systems on soil physicochemical properties, enzymatic activity, and microbial biomass. Catena 2022, 219, 106619. [Google Scholar] [CrossRef]
- Wang, F.; Zhang, L.; Zhou, J.; Rengel, Z.; George, T.S.; Feng, G. Exploring the secrets of hyphosphere of arbuscular mycorrhizal fungi: Processes and ecological functions. Plant Soil 2022, 481, 1–22. [Google Scholar] [CrossRef]
- Tótola, M.R.; Chaer, G.M. Microrganismos e processos microbiológicos como indicadores da qualidade do solo. In Tópicos em Ciência do Solo; Alvarez, V.H., Schaefer, C.E.G.R., Barros, N.F.d., Mello, J.W.V.d., Costa, L.M.d., Eds.; Sociedade Brasileira de Ciência do Solo: Viçosa, Brazil, 2002; Volume 2, pp. 195–276. [Google Scholar]
- Kalamulla, R.; Karunarathna, S.C.; Tibpromma, S.; Galappaththi, M.C.A.; Suwannarach, N.; Stephenson, S.L.; Asad, S.; Salem, Z.S.; Yapa, N. Arbuscular mycorrhizal fungi in sustainable agriculture. Sustainability 2022, 14, 12250. [Google Scholar] [CrossRef]
- Akter, S.; Kamruzzaman, M.; Sarder, M.P.; Amin, M.S.; Joardar, J.C.; Islam, M.S.; Nasrin, S.; Islam, M.U.; Islam, F.; Rabbi, S.; et al. Mycorrhizal fungi increase plant nutrient uptake, aggregate stability and microbial biomass in the clay Soil. Symbiosis 2024, 93, 163–176. [Google Scholar] [CrossRef]
- Brady, N.C.; Weil, R.R. Elementos da Natureza e Propriedades dos Solos, 3rd ed.; Bookman: Porto Alegre, Brazil, 2013; pp. 106–145. [Google Scholar]
- Gupta, V.V.S.R.; Germida, J.J. Soil Aggregation: Influence on microbial biomass and implications for biological processes. Soil Biol. Biochem. 2015, 80, A3–A9. [Google Scholar] [CrossRef]
- Zhang, X.; Wu, X.; Zhang, S.; Xing, Y.; Wang, R.; Liang, W. Organic amendment effects on aggregate-associated organic C, microbial biomass C and glomalin in agricultural soils. Catena 2014, 123, 188–194. [Google Scholar] [CrossRef]
- Sun, Q.; Wang, R.; Hu, Y.; Yao, L.; Guo, S. Spatial variations of soil respiration and temperature sensitivity along a steep slope of the semiarid Loess Plateau. PLoS ONE 2018, 13, e0195400. [Google Scholar] [CrossRef]
- Long, L.; Cang, Q.; Xueling, Y.; Lina, J.; Yu, D.; Tong, R. Relationship between the slope microtopography and the spatial redistribution pattern of soil organic carbon under water erosion. J. Soil Water Conserv. 2021, 76, 435–445. [Google Scholar] [CrossRef]
- Xiaojun, N.; Jianhui, Z.; Zhengan, S. Dynamics of soil organic carbon and microbial biomass carbon in relation to water erosion and tillage erosion. PLoS ONE 2013, 8, e64059. [Google Scholar] [CrossRef] [PubMed]
- Zhang, B.; Cai, Y.; Hu, S.; Chang, S.X. Plant mixture effects on carbon-degrading enzymes promote soil organic carbon accumulation. Soil Biol. Biochem. 2021, 163, 108457. [Google Scholar] [CrossRef]
- Tejada, M.; Garcia, C.; Gonzalez, J.L.; Hernandez, M.T. Use of organic amendment as a strategy for saline soil remediation: Influence on the physical, chemical and biological properties of soil. Soil Biol. Biochem. 2006, 38, 1413–1421. [Google Scholar] [CrossRef]
- Bharti, P.; Das, A.; Kumar, S.; Rakshit, R. Assessment of soil specific enzyme activities in aggregates size fractions: A case study from subtropical agro-ecosystem. Eurasian Soil Sci. 2024, 57, 646–656. [Google Scholar] [CrossRef]
- Perez Mateos, M.; Gonzalez Carcedo, S. Effect of fractionation on the enzymatic state and behaviour of enzyme activities in different structural soil units. Biol. Fertil. Soils 1987, 4, 151–154. [Google Scholar] [CrossRef]
- Busto, M.D.; Perez-Mateos, M. Characterization of β-D-glucosidase extracted from soil fractions. Eur. J. Soil Sci. 2000, 51, 193–200. [Google Scholar] [CrossRef]
- Bach, E.M.; Hofmockel, K.S. Soil Aggregate Isolation Method Affects Measures of Intra-Aggregate Extracellular Enzyme Activity. Soil Biol. Biochem. 2014, 69, 54–62. [Google Scholar] [CrossRef]
- Gómez, J.A.; Battany, M.; Fereres, E.; Renschler, C.S. Evaluating the impact of soil management on soil loss in olive orchards. Soil Use Manag. 2003, 19, 127–134. [Google Scholar] [CrossRef]
- Arias-Giraldo, L.F.; Guzmán, G.; Montes-Borrego, M.; Gramaje, D.; Gomez, J.A.; Landa, B.B. Going beyond soil conservation with the use of cover crops in mediterranean sloping olive Orchards. Agronomy 2021, 11, 1387. [Google Scholar] [CrossRef]
- Fortini, R.M.; Braga, M.J.; Freitas, C.O. Impact of conservation agricultural practices in the land of productivity and profit of farms brazilian. Rev. Econ. Sociol. Rural 2020, 58, e199479. [Google Scholar] [CrossRef]
- Salton, J.C.; Mielniczuk, J.; Bayer, C.; Boeni, M.; Conceição, P.C.; Fabrício, A.C.; Macedo, M.C.M.; Broch, D.L. Soil aggregation and aggregate stability under crop-pasture systems in Mato Grosso do Sul state, Brazil. Rev. Bras. Ciênc. Solo 2008, 32, 11–21. [Google Scholar] [CrossRef]
Disclaimer/Publisher’s Note: The statements, opinions and data contained in all publications are solely those of the individual author(s) and contributor(s) and not of MDPI and/or the editor(s). MDPI and/or the editor(s) disclaim responsibility for any injury to people or property resulting from any ideas, methods, instructions or products referred to in the content. |
© 2025 by the authors. Licensee MDPI, Basel, Switzerland. This article is an open access article distributed under the terms and conditions of the Creative Commons Attribution (CC BY) license (https://creativecommons.org/licenses/by/4.0/).

