Article

Advancing Sustainable Practices: Integrated Pedological Characterization and Suitability Assessment for Enhanced Irish Potato Production in Tsangano and Angónia Districts of Tete Province, Mozambique

by
Tamara José Sande
1,2,*,
Balthazar Michael Msanya
2,
Hamisi Juma Tindwa
2,
Alessandra Mayumi Tokura Alovisi
3,
Johnson M. Semoka
2 and
Mawazo Shitindi
2
1
Department of Agrarian Sciences, Faculty of Agrarian Sciences, Zambeze University, Ulongue P.O. Box 2306, Tete Province, Mozambique
2
Department of Soil and Geological Sciences, College of Agriculture, Sokoine University of Agriculture, Morogoro P.O. Box 3008, Tanzania
3
Department of Agrarian Sciences, Faculty of Agrarian Sciences, Grande Dourados Federal University, Dourados 79804-970, Brazil
*
Author to whom correspondence should be addressed.
Soil Syst. 2025, 9(2), 53; https://doi.org/10.3390/soilsystems9020053
Submission received: 13 March 2025 / Revised: 24 April 2025 / Accepted: 29 April 2025 / Published: 19 May 2025
(This article belongs to the Special Issue Land Use and Management on Soil Properties and Processes: 2nd Edition)

Abstract

:
Irish potato (Solanum tuberosum) is a critical crop for food security and economic growth in Tsangano and Angónia Districts, Central Mozambique. Challenges like inconsistent yields and variable quality are often linked to suboptimal soil conditions, which limit production. This study aimed to classify and evaluate the suitability of soils for potato cultivation in Tete Province, where detailed soil assessments remain limited. Four pedons—TSA-P01 and TSA-P02 in Tsangano and ANGO-P01 and ANGO-P02 in Angónia—were examined for bulk density, texture, pH, organic carbon, and nutrient content using a combination of pedological methods and laboratory soil analysis. To determine each site’s potential for growing Irish potatoes, these factors were compared to predetermined land suitability standards. The pedons were very deep (>150 cm) and had textures ranging from sandy clay loam to sandy loam. TSA-P02 had the lowest bulk density (0.78 Mg m−3) and the highest available water capacity (182.0 mm m−1). The soil pH ranged from 5.6 to 7.9, indicating neutral to slightly acidic conditions. Nutrient analysis revealed low total nitrogen (0.12–0.22%), varying soil organic carbon (0.16–2.73%), and cation exchange capacity (10.1–11.33 cmol(+) kg−1). Pedons TSA-P01, ANGO-P1, and ANGO-P02 were characterized by eluviation and illuviation as dominant pedogenic processes, while in pedon TSA-P02, shrinking and swelling were the dominant pedogenic processes. Weathering indices identified ANGO-P01 as most highly weathered, while TSA-P02 was least weathered and had better fertility indicators. According to USDA Taxonomy, the soils were classified as Ultisols, Vertisols, and Alfisols, corresponding to Acrisols, Alisols, Vertisols, and Luvisols in the WRB for Soil Resources. All studied soils were marginally suitable for potato production (S3f) due to dominant fertility constraints, but with varying minor limitations in climate, topography, and soil physical properties. The findings hence recommended targeted soil fertility management to enhance productivity and sustainability in potato cultivation.

Graphical Abstract

1. Introduction

Irish potato (Solanum tuberosum) is a critical crop in global agriculture due to its high nutritional value and role as a staple food. In Mozambique, it holds particular importance in the Tsangano and Angónia Districts of Central Mozambique, which collectively contribute approximately 90% of the nation’s production [1]. Beyond its dietary significance, Irish potato cultivation underpins local economies, supporting food security and household income in these regions [2,3]. Despite its potential, productivity in Mozambique remains low, with average yields of 9 t ha−1 [4] compared to global averages. Key constraints include declining soil fertility, inadequate precipitation, limited access to improved seed varieties, and poor fertilizer management. These challenges, combined with the crop’s vulnerability to diseases, lead to inconsistent yields and quality [4,5].
Soil quality is fundamental to addressing these constraints, as it directly influences agricultural productivity and crop health. High-quality soils fulfill essential functions, such as providing a reservoir for nutrients and water, promoting root development, and supporting soil microbial activity, which are critical for sustainable Irish potato cultivation [2,6]. However, achieving sustainable productivity requires a thorough understanding of the specific physical, chemical, and biological properties of soils, alongside their interactions with climatic and management factors.
Pedological description and soil classification play a pivotal role in this context. A detailed analysis of soil morphology, texture, organic matter, nutrient content, and pH can identify specific limitations to crop growth and guide interventions tailored to enhance soil health. This is particularly critical for Irish potato production, as the crop is highly sensitive to soil drainage, nutrient availability, and moisture-retentive properties [7]. Proper soil classification provides the foundation for selecting suitable management practices, determining appropriate fertilizer regimes, and mitigating soil constraints through targeted interventions.
The degradation of soil quality, driven by unsustainable land use practices, poor soil management, and the expansion of cultivation into marginal areas, has led to extensive nutrient depletion and structural deterioration, especially in semi-arid regions [8,9,10].
In Mozambique, this issue poses a critical challenge to agricultural sustainability, threatening both productivity and food security. The situation is further aggravated by limited access to the resources and technologies required to mitigate soil degradation and restore soil functionality. Addressing this challenge requires a comprehensive assessment of soil physico-chemical properties, as highlighted in recent studies, which emphasize the importance of these evaluations in guiding strategies to enhance soil health and support sustainable agricultural systems [11,12,13].
The concept of land suitability provides a framework for evaluating the soil’s capacity to meet the requirements of specific crops, such as Irish potatoes. It involves assessing how well soil properties align with crop needs under defined levels of input and management [14,15,16]. The [17,18] classification systems categorize land suitability into four levels: orders (e.g., suitable [S] and not suitable [N]), classes (e.g., highly suitable [S1] and moderately suitable [S2]), subclasses indicating specific limitations (e.g., soil fertility or moisture constraints), and units, reflecting minor variations within subclasses. These classifications provide actionable insights into the constraints affecting soil performance and potential pathways for optimization.
Despite the relevance of these tools, a significant gap remains in applying detailed pedological evaluations to improve potato cultivation in Mozambique. Limited research has focused on how specific soil properties, including drainage, nutrient content, and physical structure, influence potato yields in the districts of Tsangano and Angónia. This lack of localized data limits the formulation of effective recommendations for managing soil fertility and achieving optimal productivity. The present study addresses this gap by classifying soils in Tsangano and Angónia according to the USDA Soil Taxonomy [19] and to tier-2 of the FAO World Reference Base for Soil Resources [20]. Additionally, it evaluates the suitability of these soils for Irish potato cultivation using methodologies established in [17,18]. By providing specific recommendations for soil fertility management and the adoption of sustainable agricultural practices, this study seeks not only to enhance Irish potato yields but also to promote sustainability and long-term agricultural productivity in these strategic districts of Tete Province, Mozambique.

2. Materials and Methods

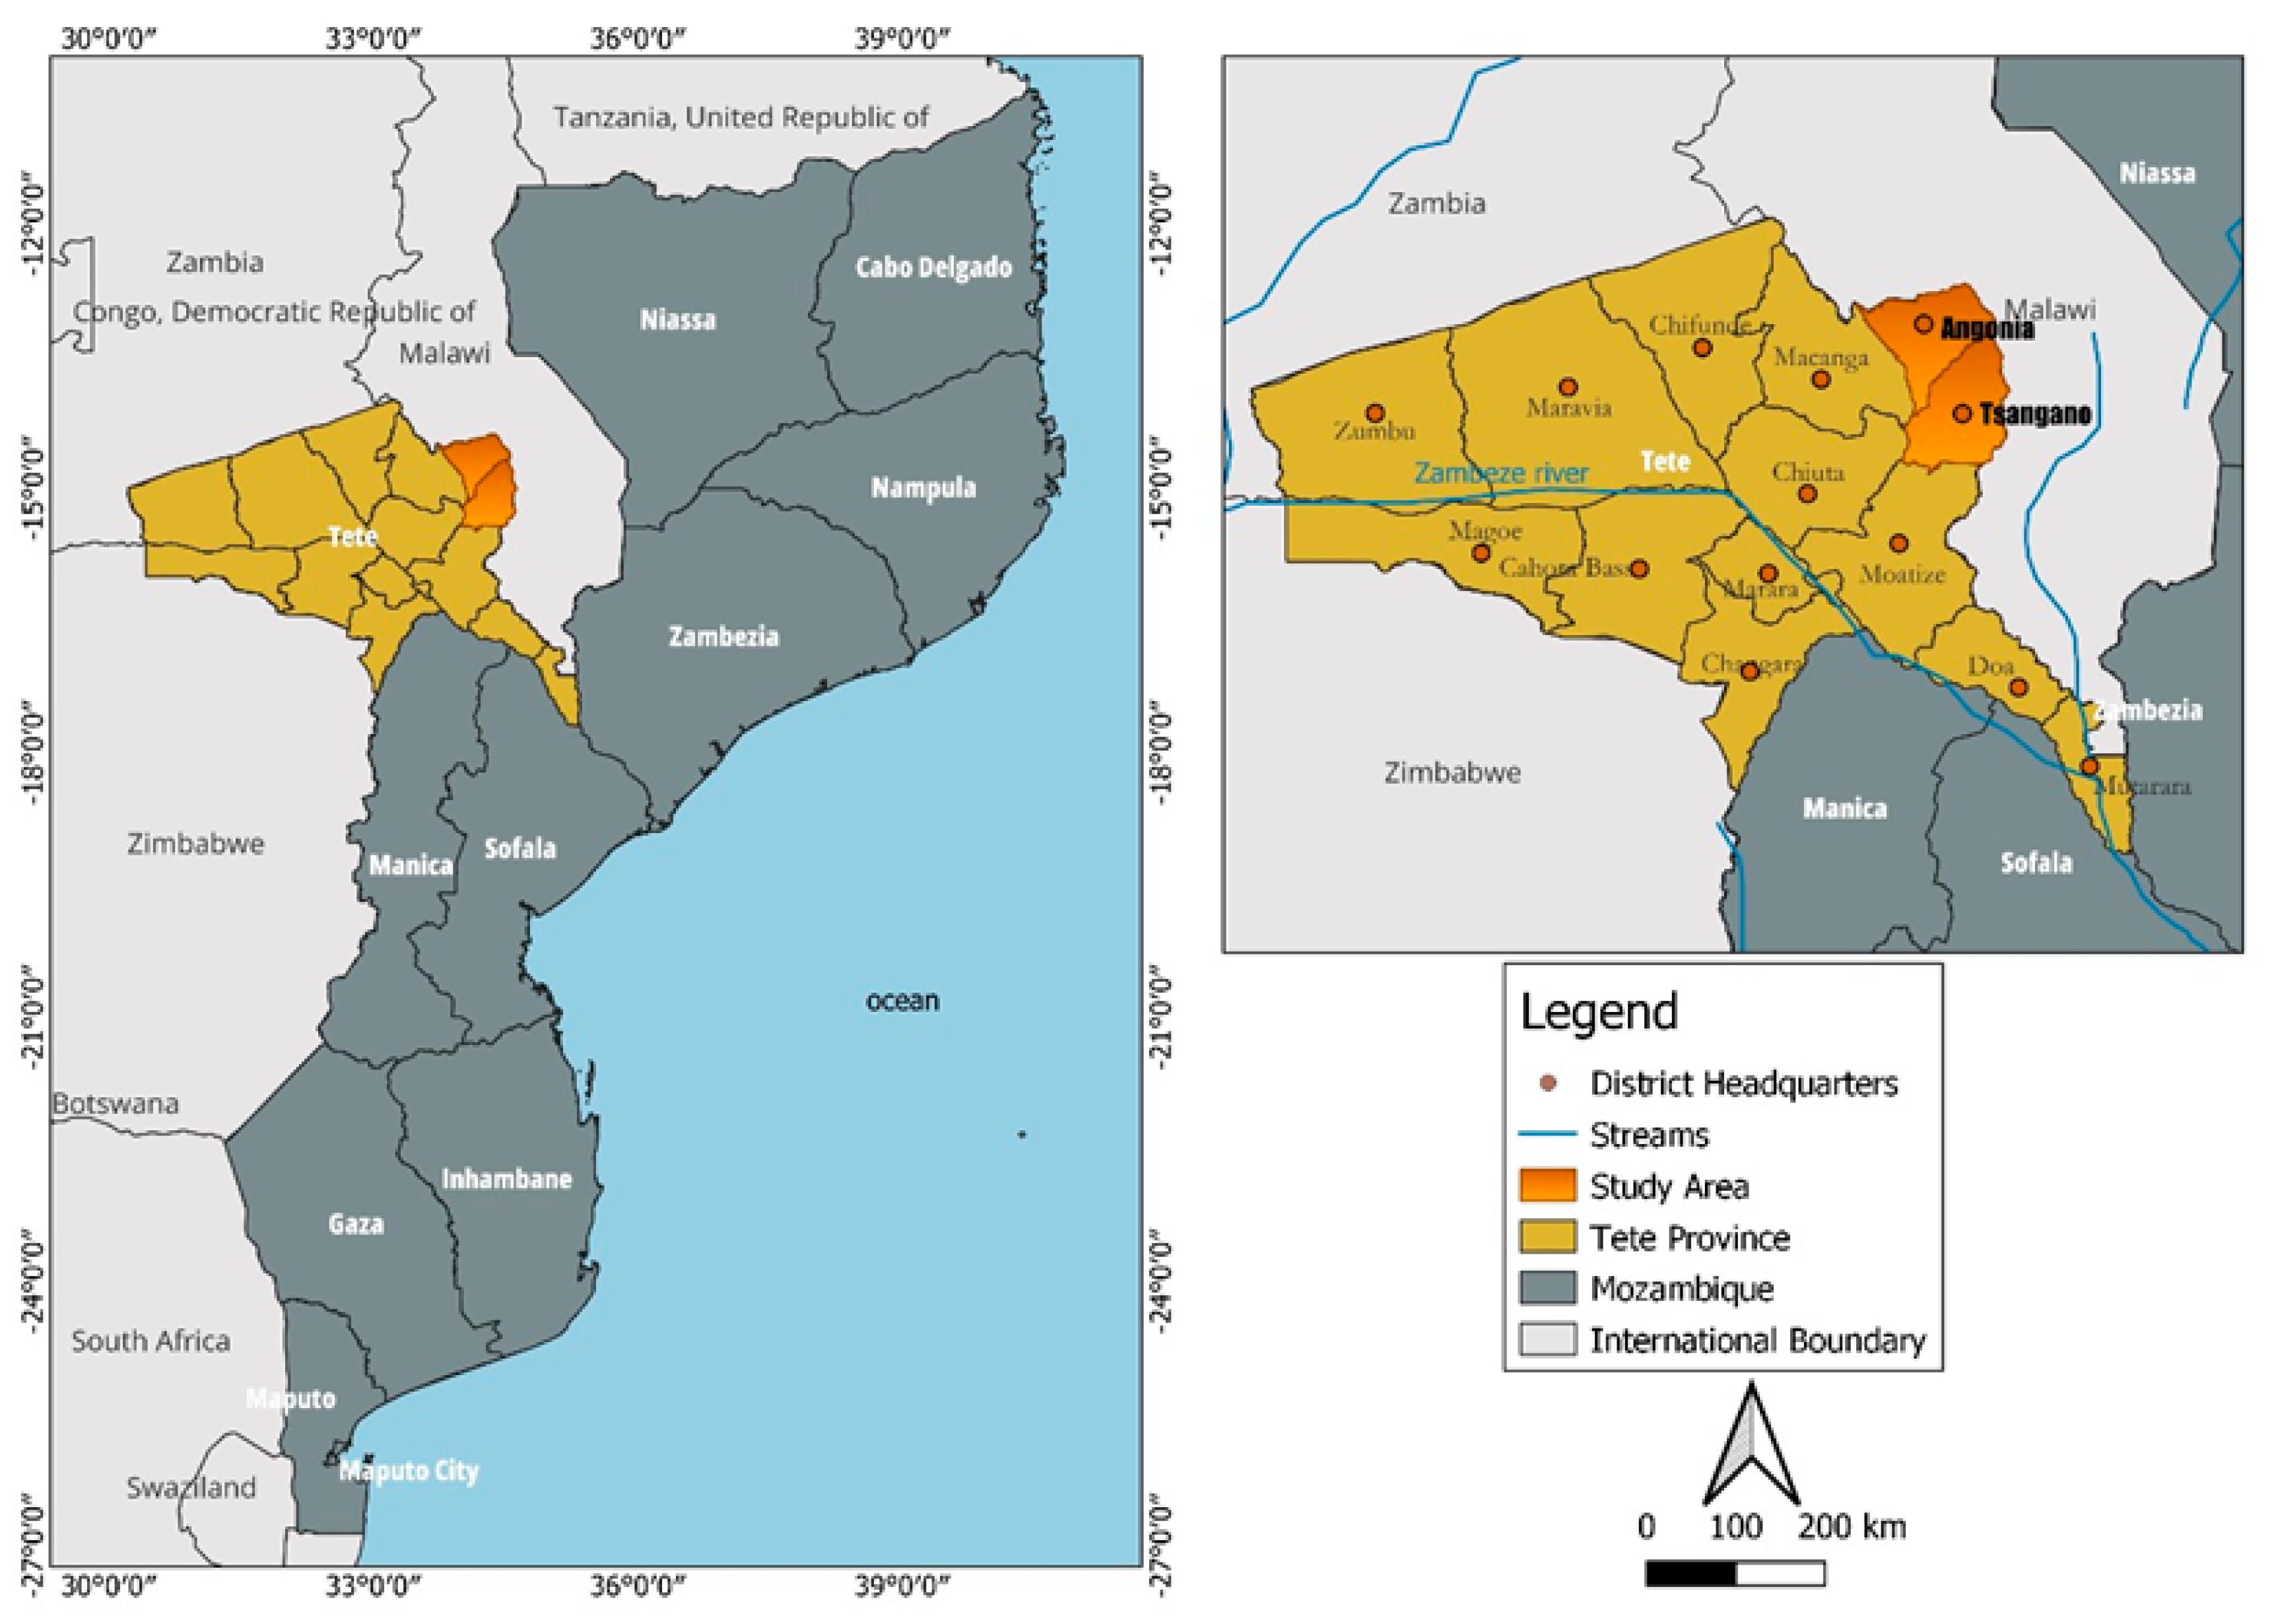
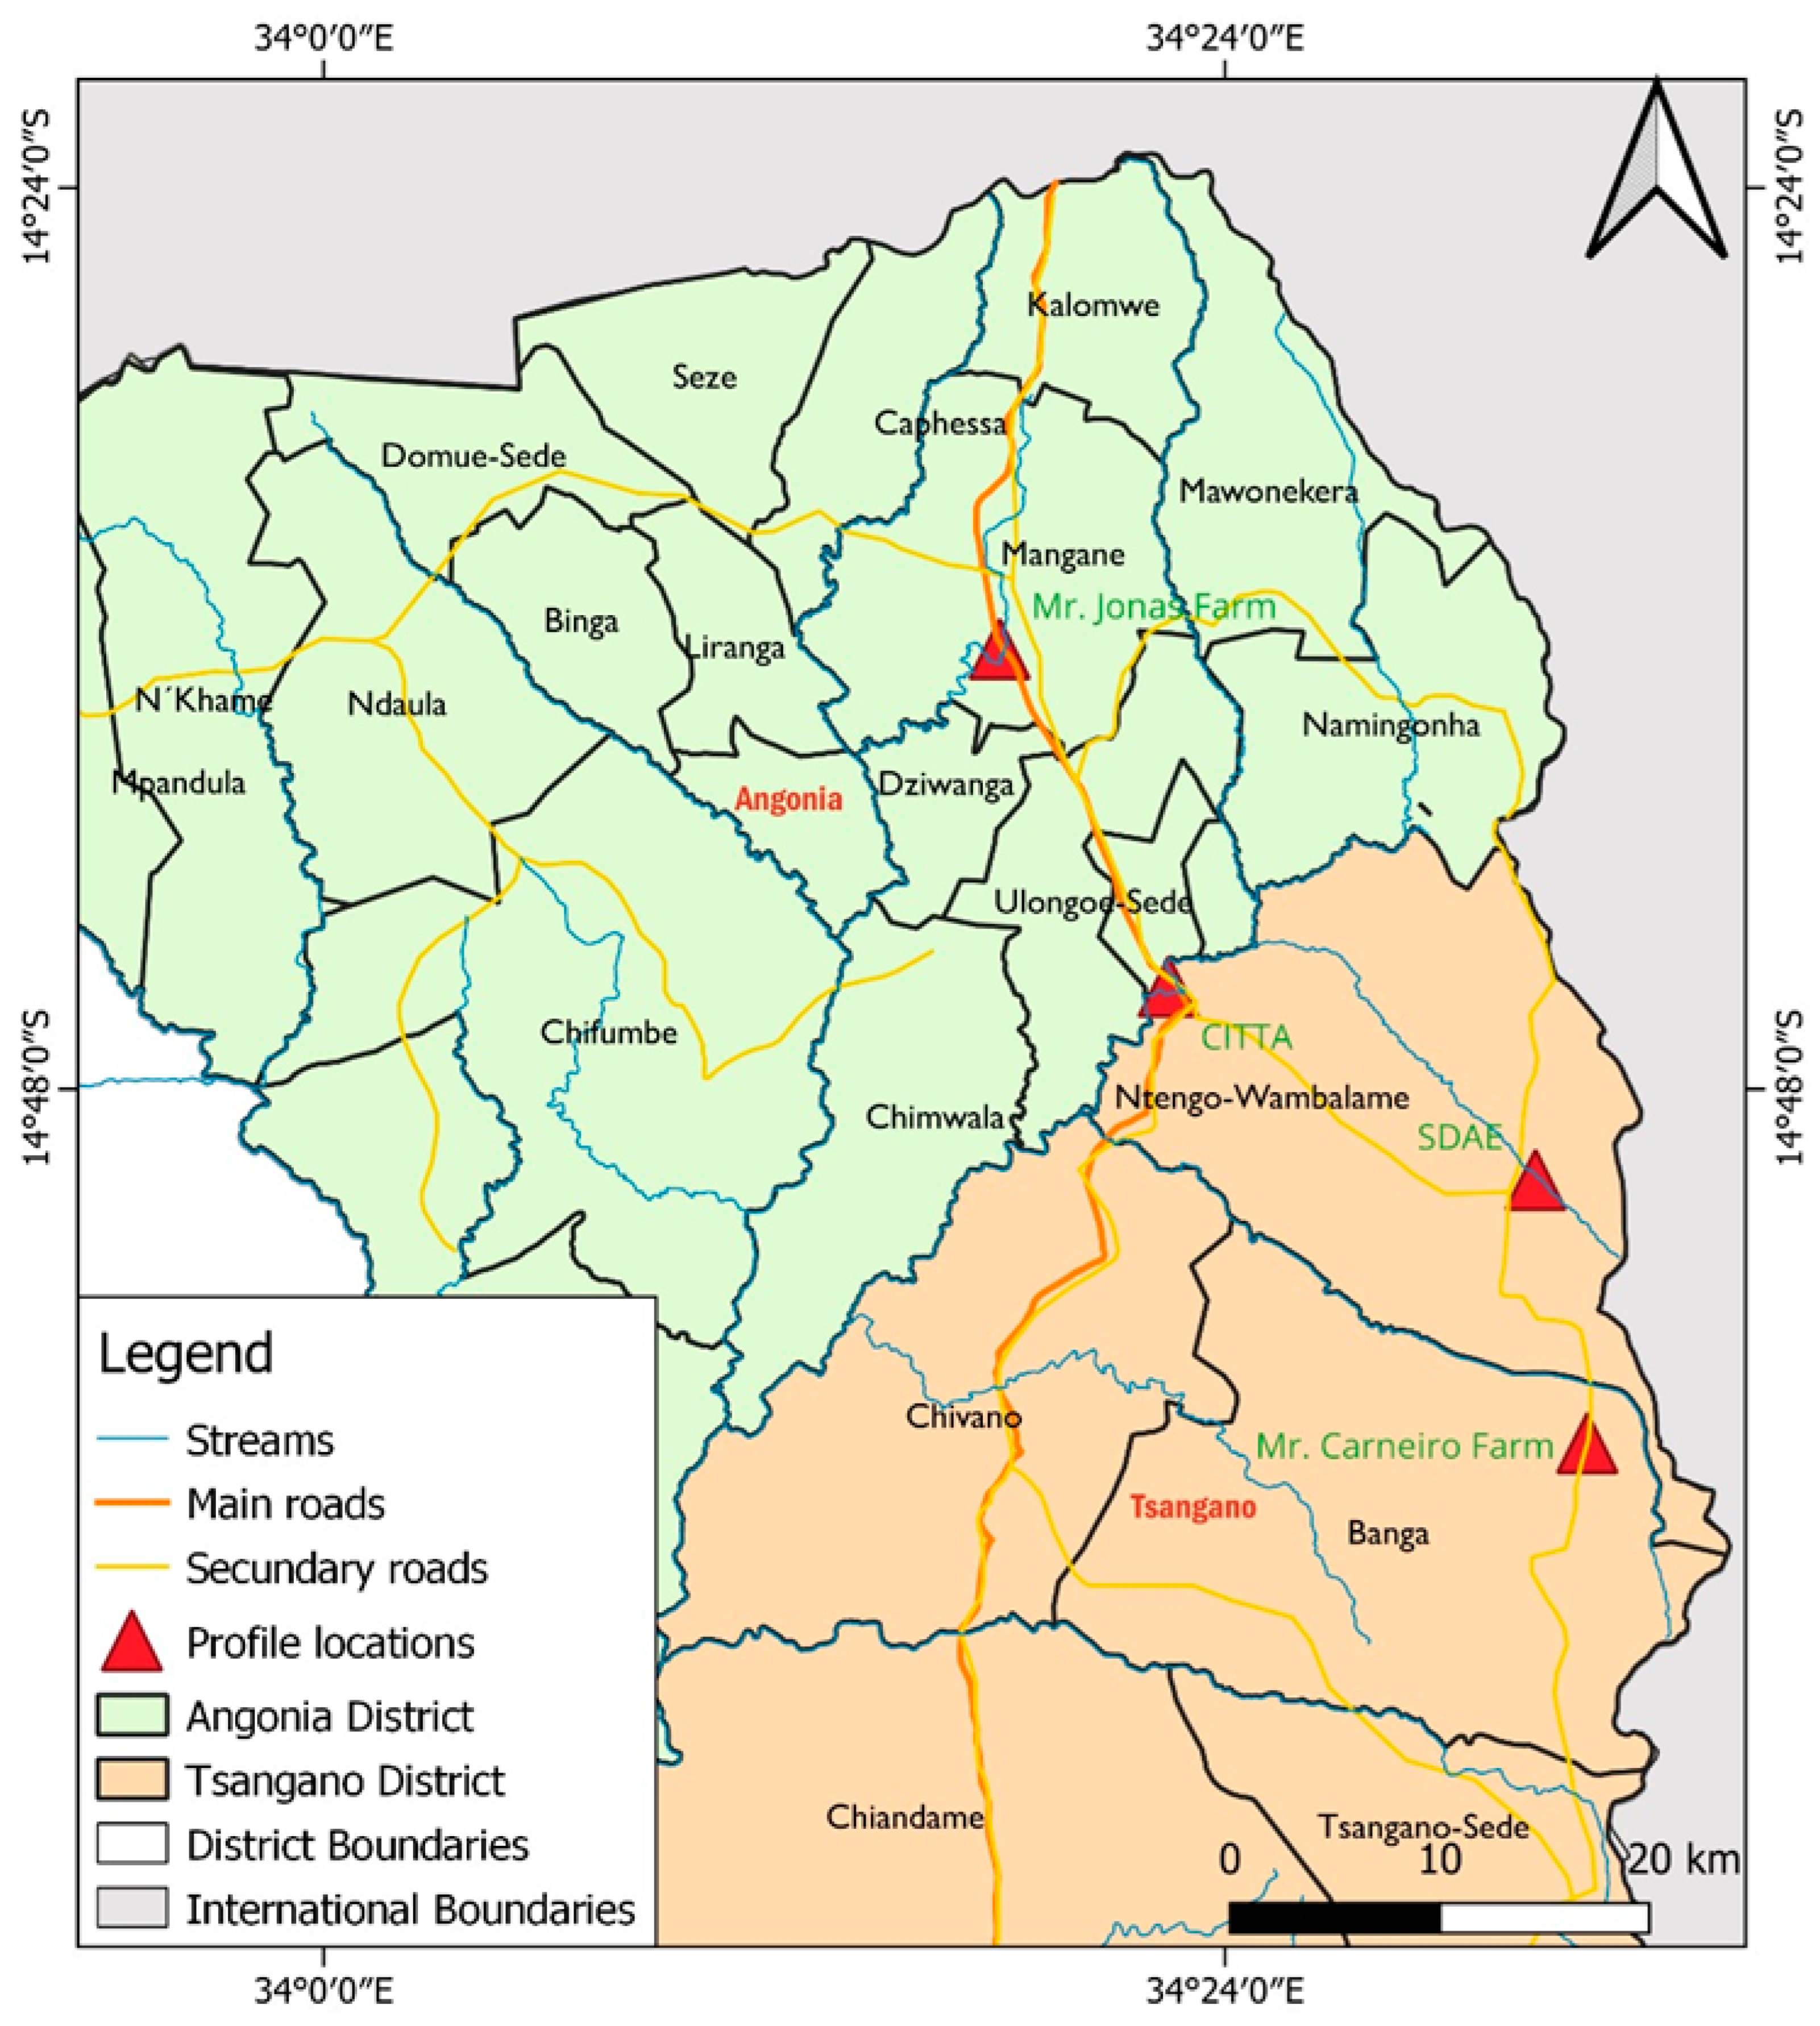
2.1. Description of the Study Areas

Tete Province is situated in the far northwest of Mozambique, sharing borders with three countries: the Republic of Malawi to the north and east, Zambia to the west, and Zimbabwe to the south. It also borders three other Mozambican provinces: Zambezia to the east and Manica and Sofala to the south [21]. Geographically, Tete lies between the coordinates 14°00′ S and 17°42′01″ S latitude and 30°13′ E and 35°20′07″ E longitude. Spanning a total area of 100.742 km2, the province consists of 98.230 km2 of land and 2.494 km2 of inland waters. This makes Tete the third largest province in Mozambique, following Niassa and Zambezia in terms of size [21]. The province is divided into 15 administrative districts (Angónia, Moatize, Mutarara, Tsangano, Zumbu, Chifunde, Chiúta, Macanga, and Marávia), as well as four districts in the southern area of the Zambezi River: Cahora-Bassa, Changara, Mágoè, and Tete (see Figure 1).
This study was conducted in agricultural areas dedicated to Irish potato cultivation by examining four farms in Tsangano and Angónia Districts in Tete Province, Mozambique. Tsangano District covers 3670 km2, with altitudes ranging from 500 to 1900 m.a.s.l., situated at approximately 15°37′17″ S and 34°44′47″ E. Angónia District spans 3277 km2, with altitudes ranging from 700 to 1700 m.a.s.l., located near 14°42′57″ S and 34°22′23″ E [22,23]. Representative study sites included Mr. Manuel Carneiro’s farm and the SDAE farm in Ligowe and Ntengo-wa-mbalame villages, respectively, in Tsangano, and Mr. Jonas’ farm and the CITTA farm in Rinze and Ulónguè villages, respectively, in Angónia.
Both districts fall within Agro-Ecological Zone 10, characterized as high rainfall zones receiving annual precipitation of 800–1200 mm [22,24]. The region has a unimodal rainfall distribution, primarily from November to April, and a humid tropical climate with mean annual temperatures ranging from 15 to 22 °C [25,26]. The landforms in Tsangano range from hilly to peneplain, while in Angónia, they include plains and old alluvial plains with slopes between 5 and 16%. The geology comprises Precambrian Meso- and Neoproterozoic lithology dominated by quartz–feldspathic gneiss and amphibolic gneiss in Tsangano and basic rocks, migmatitic gneisses, and granulites in Angónia [26,27]. The primary soil types include Lixisols in Tsangano, known for moderate fertility but erosion susceptibility, and Ferralsols and Luvisols in Angónia, which vary in nutrient retention and degradation potential [22]. Irish potato cultivation, alongside maize, beans, soybeans, and vegetables, is prominent in both districts under rain-fed agriculture [21]. Specific site attributes, including coordinates, altitudes, soil and temperature regimes, and land use, are summarized in Table 1.
Table 1 highlights four representative sites, TSA-P01 and TSA-P02 in Tsangano and ANGO-P01 and ANGO-P02 in Angónia. These sites feature varied altitudes (1200–1427 m.a.s.l.), geological formations, and natural vegetation types, with land uses ranging from grazing and fallow to active agricultural cultivation. Despite their similarities in rainfall patterns and climatic conditions, differences in soil moisture regimes (Ustic vs. Aquic) and drainage characteristics influence the soil formation processes and their suitability for crop production.

2.2. Field Work

A reconnaissance survey was conducted using transect walks, auger sampling, and descriptions to identify representative study sites based on landforms and physiographic features. The forms adapted from the FAO Soil Description Guidelines by the National Soil Service of Tanzania [28] were used to record site data at each observation point on landform, soil morphological characteristics (soil color, texture, consistency, structure, porosity, effective depth, parent material, natural vegetation, drainage, slope, altitude, erosion, and land use). Munsell color charts [29] were used to determine soil color. This aided in the selection of representative research sites for the design of experimental trials, soil sampling, and excavation of soil profile pits.
Following reconnaissance field inspections at each research site, the location for soil profile excavation was found and georeferenced using global coordinates using the Global Positioning System (GPS) (Figure 2).
Each representative research site had a single soil profile pit dug, measuring 150 cm in width, 200 cm in length, and between 155 and 200 cm in depth. The profiles were named TSA-P01 in Ligowe Village, TSA-P02 at District Service of Agriculture and Economic Activities farm (SDAE) in Ntengo-wa-mbalame Village in Tsanagno District, ANGO-P01 and ANGO-P02 in Rinze Village, and the Angónia Research Centre and Technologies Transfer (CITTA) in Ulongue Village, Angonia District, respectively (Figure 3).
Following the demarcation of the genetic soil layers in each soil profile pit, undisturbed soil samples (core samples) from three soil horizons at depths of 0–10, 45–50, and 95–100 cm were collected, packaged, and properly labeled for laboratory analysis.
A pocket cone penetrometer (Daiki Rika Kogyo penetrometer Model DIK-5551, Kōnosu City, Saitama Prefecture, Japan) was used to assess the resistance to soil penetration in each soil horizon [30]. One mean penetration resistance value per horizon was obtained by averaging five distinct sites inside the corresponding horizon. This value was then compared to a value of 3 MPa, which was determined to be a critical value for plant development [30,31,32,33]. After being air-dried, crushed, and sieved through a 2 mm sieve, the disturbed soil samples were carefully packed in paper bags and labeled for laboratory physical and chemical determinations of characteristics of the soil.

2.3. Laboratory Soil Analysis

Soil samples were analyzed at the LUANAR Soil Science Laboratory in Malawi to determine physical and chemical properties. Bulk density (BD) was determined gravimetrically by drying undisturbed core samples at 105 °C for 24 h, then calculating BD from the soil and core weights [34]. Total porosity was calculated as Total porosity (%) = (1−BD/Particle density) ×100 [16]. Moisture content at field capacity (FC) and permanent wilting point (PWP) was determined using a pressure plate apparatus at −3 bar (300 kPa) and −15 bar (1500 kPa), respectively. These values were converted to volume percent (Vol%) using BD, and available water content (AWC) was calculated as the difference between FC and PWP, expressed in mm/m [34]. Particle size distribution was determined using the Bouyoucos hydrometer method after dispersing soil with sodium hexametaphosphate, and soil texture was classified using the USDA textural triangle [35]. Soil pH and electrical conductivity (EC) were measured potentiometrically in a 1:2.5 soil–water suspension [35]. Organic carbon (OC) was determined using the Walkley–Black method [34] and converted to organic matter (OM) using a factor of 1.724 [36,37]. Total nitrogen (TN) was quantified using the micro-Kjeldahl [35,38]. Available phosphorus (P) and exchangeable bases (Ca2+, Mg2+, K+, and Na+) were extracted with the Mehlich 3 extractant [39] and analyzed using a UV spectrophotometer Helios Alpha, manufactured by Thermo Spectronic in New York, USA (P), atomic absorption spectrometer PG990 model, manufactured by PG Instruments Limited in Lutterworth, Leicestershire UK for (Ca2+ and Mg2+), and flame photometer PG990 for (K+ and Na+). Cation exchange capacity (CEC) was determined using the ammonium acetate method at pH 7 [35]. The cation exchange capacity of clay (CECclay) was calculated as follows [40]:
C E C c l a y = { ( C E C s o i l ( O M % × 2 ) } × 100
The total exchangeable bases (TEB) were calculated as the sum of Ca2+, Mg2+, K+, and Na+ [41], while base saturation (BS%), the C:N ratio, and silt:clay ratio was also calculated using the formula in [42].
Twelve selected horizon samples were analyzed at the GST Laboratory in Tanzania for total elemental composition using X-Ray Fluorescence Spectrometry (XRF), model Rigaku NEX CG, manufactured by Rigaku Corporation, Tokyo, Japan [43]. Samples were dried, ground to ≤177 µm, and pressed into pellets. Magnesium (Mg) and sodium (Na) oxides were quantified using atomic absorption spectroscopy, while other oxides were determined using a PANalytical Minipal 4 ED-XRF model PANalytical Minipal 4, manufactured by Malvern PANalytical, Almelo, the Netherland. Weathering indices, including silica/alumina and silica/sesquioxide ratios, were used to assess weathering potential.

2.4. Data Interpretation and Soil Classification

The results obtained from laboratory analysis of soil physical and chemical properties were interpreted and compared to established standards for soil classification. The studied soils were classified according to family level of the USDA Soil Taxonomy and to tier-2 of the FAO World Reference Base for Soil Resources [20] using field data collected (site characteristics, climate, and soil morphological characteristics).

2.5. Soil Suitability Assessment

In this study, the suitability assessment of experimental sites for Irish potato production was conducted using the simple limitation method proposed in [44], where the observed land characteristics, including rainfall, temperature, slope, drainage, soil texture, effective soil depth, and soil nutrient content, were compared with the ecological requirements of Irish potato crops to determine the suitability of the studied pedons [45]. According to the [17,44] framework, the land suitability orders are categorized as suitable (S) and not suitable (N). Within each order, suitability classes define the degree of suitability: highly suitable (S1), moderately suitable (S2), marginally suitable (S3), currently not suitable (N1), and permanently not suitable (N2). Subclasses indicate specific limitations or recommended improvement measures (e.g., S2c for climatic limitations, S2f for soil fertility issues, and S3me for constraints related to moisture availability and erosion), while units further differentiate minor variations in management needs within the subclasses, where the first letter of the suffix generally represents the most critical limitation, and the other suffixes denote subordinate or less severe limitations. (e.g., S2e-1, S2e-2, or S3(e,s,c).
To evaluate the suitability of the studied soils for Irish potato cultivation, limits were established based on the crop’s agronomic requirements, as outlined in [32,45,46,47,48,49], Table 2.

3. Results

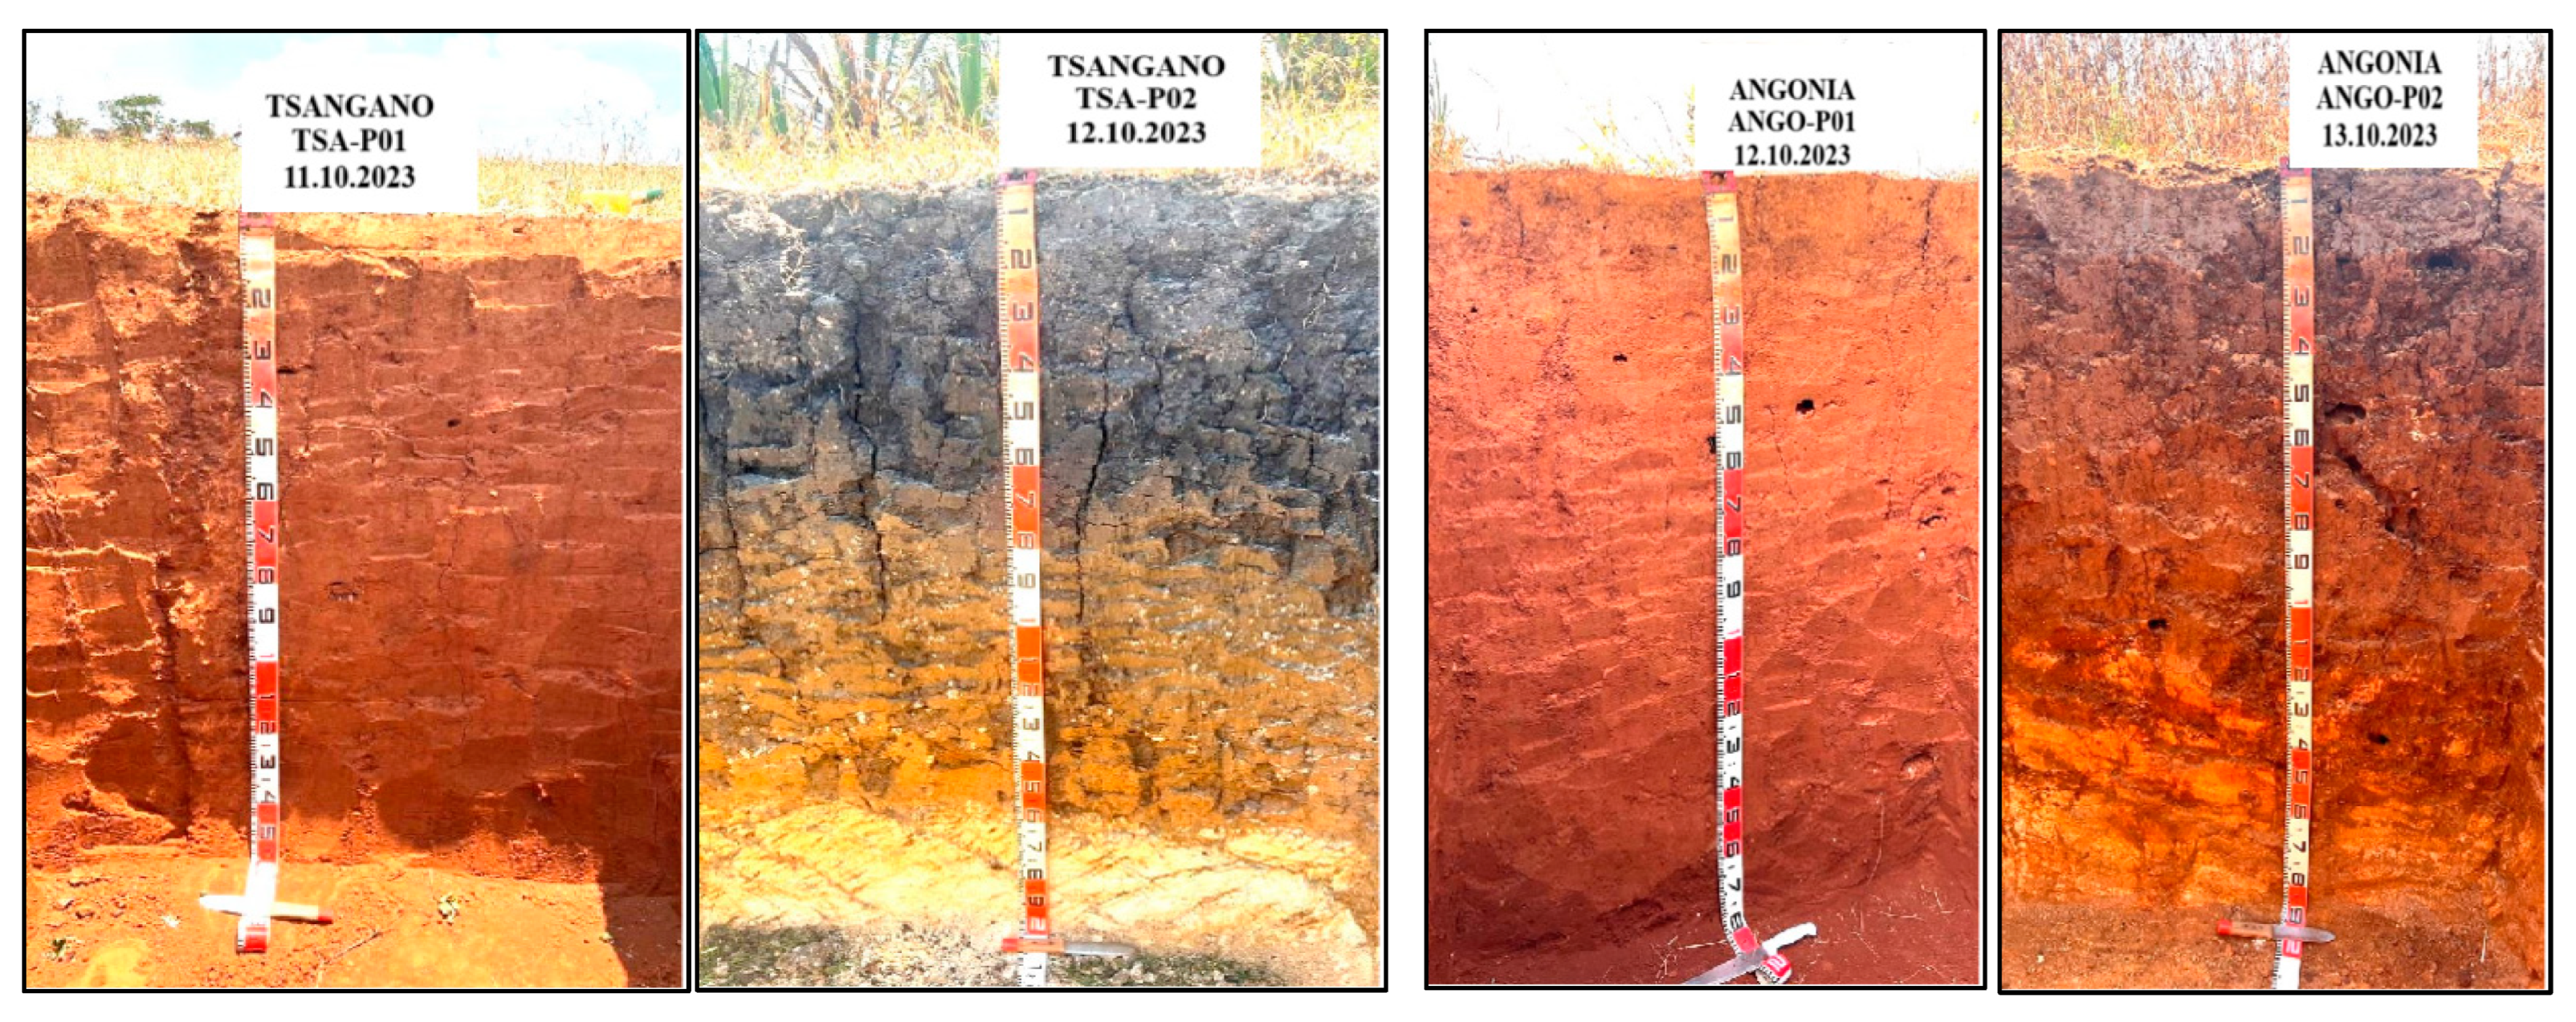
3.1. Soil Morphological Characteristics of the Studied Pedons

The studied pedons were named TSA-P01 and TSA-P02 for Tsangano District and Ango-P01 and Ango-P02 for Angónia District. According to [16], the effective soil depths of the studied soils were categorized as very deep, being at least 150 cm deep (Table 3). Their morphological characteristics reveal distinct differences and similarities, offering insights into their formation processes, environmental influences, and suitability for agricultural use.
The drainage patterns exhibited slight variations across the pedons. ANGO-P01 and ANGO-P02 were well-drained, while TSA-P01 ranged from well to excessively well-drained, and TSA-P02 was well to moderately well-drained. Soil color serves as an important indicator of organic matter content, drainage status, and mineral composition [50]. Among the studied pedons, TSA-P02 had darker dry and moist topsoil colors (e.g., very dark grey and black), suggesting a higher organic matter accumulation compared to TSA-P01, ANGO-P01, and ANGO-P02, which exhibited brown, dark brown, and dark reddish-brown hues [50]. Subsoil colors varied significantly. TSA-P01 displayed reddish to yellowish-red hues, indicative of oxidized iron compounds and better drainage, whereas TSA-P02 showed black to olive-yellow subsoil, reflecting reducing conditions and potential waterlogging [50]. The Angónia pedons also demonstrated darker subsoils, with ANGO-P02 tending toward dark brown and ANGO-P01 displaying reddish tones, indicative of better aeration compared to TSA-P02. These color variations underscore the impact of drainage on soil properties, distinguishing the well-drained TSA-P01, ANGO-P01, and ANGO-P02 from the moderately well-drained TSA-P02.
Consistency ratings reflect soil strength and plasticity, which are critical for understanding soil workability and root penetration [51]. TSA-P01 exhibited firm consistency in the topsoil, transitioning to very hard and slightly hard subsoils, implying moderate resistance to cultivation [50]. Conversely, TSA-P02’s extremely hard subsoils indicate significant challenges for root growth and mechanization (Table 3). Angónia pedons displayed slightly hard to very hard consistencies, with ANGO-P01 being firmer than ANGO-P02, suggesting differences in compaction, organic matter contents, and soil moisture retention [50]. These differences in consistency help to distinguish TSA-P02 as having less favorable physical properties for crop production compared to the other pedons.
The observed soil structures ranged from subangular blocky to massive (structureless), indicating variations in soil stability, porosity, and water infiltration [51]. TSA-P01 and ANGO-P01 exhibited weak to moderate subangular blocky structures, conducive to moderate permeability, while TSA-P02 showed angular blocky to massive structures in the subsoil, which could impede root growth and water movement [50]. ANGO-P02 exhibited a mix of subangular blocky and slightly massive structures, suggesting variability in drainage and porosity. These differences in structural development emphasize the contrasting pedogenetic processes and environmental conditions between Tsangano and Angónia pedons. The presence of clay cutans in TSA-P01, ANGO-P01, and ANGO-P02 provides strong evidence of eluviation and illuviation processes [20]. These features signify the downward translocation of clay and sesquioxides, which are typical of pedogenic development in well-drained environments. In contrast, TSA-P02 was characterized by shrinking and swelling as the dominant pedogenic processes responsible for the typical morphological features of deep, wide cracking, extremely hard consistency, and angular to subangular structural blocks.

3.2. Soil Physical and Chemical Characteristics of the Studied Pedons

3.2.1. Soil Texture, Silt:Clay Ratio

The analytical results of soil texture, silt:clay ratio, and penetrometer resistance are given in Table 4. Soil texture plays a crucial role in agricultural productivity, influencing crop growth and yield, soil moisture availability, root penetration, erodibility, and nutrient and water movement. Additionally, it affects the soil structure, consistency, and overall workability [52].
The topsoils of TSA-P01, TSA-P02, and ANGO-P01 are sandy clay loam (SCL) and sandy clay (SC). In contrast, ANGO-P02 has a clayey (C) topsoil texture [16,53]. The subsoils of TSA-P01 and ANGO-P01 exhibit heavier clay textures. TSA-P02 has sandy subsoils, whereas ANGO-P02 transitions to sandy loam (SL) [50]. The silt–clay ratio provides insights into soil susceptibility to erosion and the degree of weathering. A lower ratio (<0.5) indicates higher weathering and greater erosion susceptibility [16]. While soil erosion is also influenced by other factors, such as bulk density, soil organic matter, and climatic conditions [52], the topsoil silt–clay ratios of the studied pedons reveal notable differences. TSA-P02 (0.44) and ANGO-P01 (0.47) exhibit moderate resistance to erosion, whereas TSA-P01 (0.29) and ANGO-P02 (0.25) appear more prone to erosion.

3.2.2. Soil Bulk Density, Porosity, Penetration Resistance, and Available Water Capacity (AWC)

Bulk density (BD) is a key indicator of soil quality and ecosystem function [16]. The analytical results of BD, porosity, and penetration resistance are provided in Table 4. Topsoil BD across the studied pedons ranges from 0.78 to 1.58 kg m3, whereas subsoil BD varies from 1.25 to 1.58 kg m3. Notably, BD increases with depth in TSA-P02 but decreases with depth in ANGO-P01 and TSA-P01. In ANGO-P02, BD exhibits a non-linear trend, increasing from the Ap to BA horizons before decreasing in the CR horizon.
Porosity ranges from 37.3% to 66.5% in the topsoil and from 30.0% to 49.0% in the subsoil. TSA-P02 exhibits the highest topsoil porosity (66.54%), reflecting its greater OM content and better granulation, which support root proliferation and crop growth [50]. In contrast, TSA-P01 has the lowest topsoil porosity (37.3%), which is associated with compaction and lower OM levels. The depth-dependent porosity trends vary, with declines observed in TSA-P02 and ANGO-P01, while TSA-P01 and ANGO-P02 exhibit inconsistent patterns.
Penetration resistance follows BD trends, increasing with depth in TSA-P02 and ANGO-P02 while decreasing in TSA-P01 and ANGO-P01. The higher BD in the subsoils of TSA-P02 and ANGO-P02 corresponds to increased penetration resistance (1.68–1.79 MPa and 1.28–1.54 MPa, respectively), largely influenced by a high clay content [54]. In contrast, TSA-P01 and ANGO-P01 exhibit higher topsoil penetration resistance (>1.76 MPa).
The results of the available water capacity are presented in Table 4. AWC values range from 84.9 to 128.6 mm m1 in TSA-P01, 132.0 to 166.6 mm m1 in TSA-P02, 101.0 to 182.0 mm m1 in ANGO-P01, and 94.0 to 173.4 mm m1 in ANGO-P02. Topsoil AWC values generally fall within the low to medium range (84.9 mm m1–182.0 mm m1), offering moderate suitability for crop production [32,55].

3.2.3. Soil pH and Electrical Conductivity (EC)

The analytical results on soil pH and electrical conductivity are presented in Table 5. The soil pH of the studied pedons ranged from medium acid (5.6) to slightly acid (6.7) [16,32]. In the TSA-P01 pedon, pH ranged from medium acid (5.6) to slightly acid (6.4); in TSA-P02, pH ranged from slightly acid (6.7) to slightly alkaline (7.9); in ANGO-P01, pH values were slightly acidic, ranging from 6.1 to 6.6; and in ANGO-P02, pH ranged from moderately acidic (5.7) to slightly acidic (5.9).
The electrical conductivity (EC) of the studied pedons was very low (0.01 dS m−1) to medium (0.28 dS m−1) [33] throughout the soil profile and was not considered problematic for crop production [55].

3.2.4. Soil Organic Carbon (SOC), Total Nitrogen (TN), and Available Phosphorus

SOC is a critical component of the global carbon cycle and influences several soil properties, including water infiltration, nutrient availability, and microbial activity [56,57]. In the studied pedons, topsoil SOC ranged from medium (1.35%) to high (2.73%), while subsoil SOC varied from extremely low (0.02%) to medium (1.58%) [33]. Total nitrogen (TN) levels ranged from low (0.12%) to medium (0.22%) in the topsoil and declined with depth in all pedons [16,32,55]. The C/N ratio ranged from 11.07 to 12.4 in the topsoil, reflecting an equilibrated range for agricultural soils [17]. All pedons showed a decreasing C/N ratio with depth, consistent with the decline in SOC relative to TN.
Analytical results for available phosphorus are given in Table 5. The available phosphorus (P) levels in the studied pedons varied from low (<22 mg kg−1) to medium (23–35 mg kg−1) [58,59]. A consistent trend of decreasing available P with increasing depth was observed in all pedons, except in TSA-P02, which showed an irregular pattern due to phosphorus leaching.

3.2.5. Exchangeable Bases, Cation Exchange Capacity, and Nutrient Balance

The analytical results on soil exchangeable bases and related properties of the studied pedons are presented in Table 6. Calcium (Ca2+) concentrations varied widely, ranging from very low (0.65 cmol(+) kg1) to very high (13.18 cmol(+) kg1). Magnesium (Mg2+) ranged from very low (0.2 cmol(+) kg1) to very high (3.08 cmol(+) kg1), while potassium (K+) ranged from low (0.08 cmol(+) kg1) to very high (1.19 cmol(+) kg1). Sodium (Na+) was consistently low, varying from very low (0.04 cmol(+) kg1) to low (0.14 cmol(+) kg1) [58,60]. Generally, Mg2+ content increased with depth in all profiles, while K+ levels decreased.
Cation exchange capacity (CEC) values ranged from low (8.8 cmol(+) kg1) to high (32.5 cmol(+) kg1) [16,55]. Pedon TSA-P02 had the highest topsoil CEC of 32.5 cmol(+) kg−1, reflecting high soil fertility, while pedon TSA-P01 had a CEC of 23.0 cmol(+) kg−1; both pedons, ANGO-P01 and ANGO-P02, had topsoil CEC values of 18.0 cmol(+) kg−1, indicating medium fertility. CEC clay values, reflecting the clay mineralogy, ranged from 19.22 cmol(+) kg−1 to 135.38 cmol(+) kg−1, with TSA-P02 showing a notably high value (135.38 cmol(+) kg−1). Exchangeable sodium percentage (ESP) values remained below 15% across all pedons, classifying these soils as non-sodic [32,55]. The base saturation percentage (PBS) ranged from 0.38 to 1.15 in topsoils and 0.37 to 1.30 in subsoils, classified as non-sodic (ESP < 15) [32,55]. A general trend of increasing values with depth was observed, likely due to the leaching and accumulation of exchangeable bases [61]. The nutrient balance analysis of the studied pedons, presented in Table 6, revealed notable variations. The Ca/Mg ratio in TSA-P01, ANGO-P01, and ANGO-P02 was below 4:1, which could potentially limit Ca and P availability for crops [16]. The Mg/K ratios ranged from 2.4 to 38.0, with ANGO-P02 displaying the highest values, indicating a potential risk of K deficiency [55]. The K/TEB ratios for TSA-P01, TSA-P02, and ANGO-P01 were favorable (>2%), supporting adequate K availability. However, ANGO-P02 exhibited lower values, signaling potential nutrient imbalances that may impact crop growth and soil fertility.
Table 6. Exchangeable bases and related properties of the studied pedons in Tsangano and Angonia Districts, Mozambique.
Exchangeable BasesCECsoilCECclayTEB Nutrient Balance (Nutrient Ratios)
CaMgNaKPBSESPCa/MgCa/TEBMg/K% (K/TEB)
PedonsHorizonDepth (cm)cmol(+) kg−1
TSA-P01Ap0–80.65 0.98 0.06 0.4 23.0 53.962.0919.3 0.55 0.66 UF0.31 UF2.4 F3.69 F
Bt18–450.83 1.03 0.05 0.25 23.5 47.002.1620.0 0.46 0.81 UF0.38 F4.2 UF2.31 F
Bt245–1120.97 1.17 0.04 0.12 28.0 44.712.1419.7 0.37 0.83 UF0.45 F10.0 UF1.10 UF
Bt3112–155+1.19 1.66 0.04 0.15 16.0 24.443.0430.0 0.39 0.72 UF0.39 F11.2 UF1.48 UF
TSA-P02Ap0–217.84 2.51 0.13 1.19 32.5 64.1311.67103.0 1.15 3.12 F0.67 UF2.1 F10.50 F
BA121–414.63 1.78 0.14 0.47 22.0 39.417.0264.9 1.30 2.60 UF0.66 UF3.7 F4.35 F
BA2k41–75/919.17 2.55 0.08 0.75 23.535.0512.54117.0 0.753.60 UF0.73 UF3.4 F7.00 F
BCgk75/91–155/16513.18 3.08 0.07 0.22 22.5 31.2216.54153.7 0.65 4.28 F0.80 UF13.6 UF2.04 F
CRgk155/165–2001.5 0.64 0.08 0.13 11.4 135.382.3323.2 0.80 2.34 UF0.64 UF4.6 UF1.29 UF
ANGO-P01Ap0–25/302.2 2.44 0.06 0.53 18.0 34.305.2351.8 0.59 0.90 UF0.42 F4.6 UF5.25 F
Bt125/30–701.53 1.91 0.05 0.22 25.5 35.683.7134.6 0.47 0.80 UF0.41 F8.5 UF 2.05 F
Bt270–1201.51 2.26 0.05 0.28 17.5 19.924.139.20.48 0.67 UF0.37 F8.0 UF2.68 F
Bt3120–1811.792.66 0.06 0.22 24.5 30.644.7344.3 0.56 0.67 UF0.38 F11.7 UF2.06 F
ANGO-P02Ap0–292.37 1.92 0.04 0.12 18.0 23.504.4542.8 0.38 1.23 UF0.53 UF15.0 UF1.15 UF
BA29–502.39 0.2 0.04 0.11 18.5 25.063.130.7 0.40 11.95 UF0.77 UF1.8 F1.09 UF
Bt50–86/1183.66 2.46 0.05 0.09 25.5 35.436.2659.6 0.48 1.49 UF0.58 UF24.7 UF0.86 UF
CR86/118–1814.01 3.08 0.05 0.08 8.841.837.2266.9 0.46 1.30 UF0.56 UF38.0 UF0.74 UF
TSA-P01 = Tsangano pedon 1; TSA-P02 = Tsangano pedon 2; ANGO-P01 = Angónia pedon 1; ANGO-P02 = Angónia pedon 2; chemical property: Ca = calcium; Mg = magnesium; K = potassium; Na = sodium; CEC = cation exchange capacity; ESP = exchangeable sodium percentage; BS = base saturation. Rating: Soilsystems 09 00053 i004 = very low, Soilsystems 09 00053 i005 = low, Soilsystems 09 00053 i006 = moderate, Soilsystems 09 00053 i007 = high, Soilsystems 09 00053 i008 = very high; F = favorable; UF = unfavorable, [17,33,43,47,49,57,62].

3.2.6. Micronutrient Contents of the Studied Pedons

Iron (Fe) levels are consistently low (<12 mg kg1) across all pedons, decreasing with depth [63,64]. TSA-P02 exhibits relatively higher Fe levels in the Ap horizon (10.96 mg kg1). Zinc (Zn) content remains consistently low across all horizons (<1 mg kg1), and manganese (Mn) levels are high (>1 mg kg1), ranging from 1.44 to 3.22 mg kg1 across pedons [39,63], decreasing with depth. Copper (Cu) remains within the high range (>1 mg kg1) [39,63], with concentrations between 0.981 and 2.098 mg kg1 (Table 7).

3.2.7. Total Elemental Composition and Weathering Indices of the Studied Pedons

The results of the total elemental composition and weathering indices of the studied pedons are given in Table 8. The concentrations of elemental oxides were in the following order: SiO2 > Al2O3 > Fe2O3 > MgO > P2O5 > TiO2 > SO3 > K2O > CaO for pedon TSA-P01; SiO2 > Al2O3 > Fe2O3 > CaO > MgO > P2O5 > SO3 > TiO2 > K2O for pedon TSA-P02; SiO2 > Al2O3 > Fe2O3 > P2O5 > TiO2 > MgO > K2O > SO3 > CaO for pedon ANGO-P01; and SiO2 > Al2O3 > Fe2O3 > P2O5 > MgO > TiO2 > K2O > SO3 > CaO for pedon ANGO-P02.
The pattern reveals a consistent dominance of SiO2 (silica) across all profiles, indicating a high proportion of quartz or quartz-rich minerals [40]. The SiO2 concentrations in the studied pedons ranged from 38.5 to 69.12%, with TSA-P02 having the highest content and ANGO-P01 the lowest. The Al2O3 content in the studied pedons ranged from 26.36 to 27.55% in TSA-P01, from 16.26 to 31.2% in TSA-P02, from 25.44 to 27.98% in ANGO-P01, and from 21.96 to 26.68% in ANGO-P02. The Fe2O3 content of TSA-P01 pedon ranged from 8.44 to 10.59%, in TSA-P02 from 1.15 to 6.49%, in ANGO-P01 from 10.69 to 13.95%, and in ANGO-P02 from 10.23 to 12.95%.
The level of SiO2/Al2O3 ranged from 1.67 to 2.26 in TSA-P01, from 1.08 to 4.25 in TSA-P02, from 1.41 to 1.81 in ANGO-P01, and from 1.44 to 2.51 in TSA-P02. In the TSA-P01 pedon, the SiO2/(Al2O3 + Fe2O3) ratio was 1.68, 1.21, and 1.26; in TSA-P02, it was 1.16, 1.08, and 3.97; in ANGO-P01, it was 1.28, 0.94, and 1.02; and in ANGO-P02, it was 0.98, 1.05, and 1.71 in the top, middle, and bottom horizons, respectively.

3.2.8. Concentrations of Barium (Ba), Zirconium (Zr), Strontium (Sr), and Lead (Pb) in the Studied Pedons

Table 9 presents results on Ba, Zr, Sr, and Pb concentrations in the study area. Ba concentrations are high in surface horizons and generally decrease with depth, except in ANGO-P02. ANGO-P01 exhibits unusually high Ba levels, up to 1075 mg dm−3, well above the typical range of 330 to 520 mg dm−3 [65], likely due to its sandy texture retaining weathering-resistant silicates [66].
Zr concentrations were higher (>300 mg dm−3) [67] in the topsoil than in subsoil across all pedons, suggesting their immobility and resistance to weathering. Sr levels were relatively high in deeper horizons of TSA-P02 and ANGO-P02 (>300 mg dm−3) [68], indicating percolation, whereas in TSA-P01 and ANGO-P01, Sr levels decreased with depth, behaving similarly to calcium in the soil. The average Pb concentration in topsoils of the studied pedons was lower than the levels reported for arable soils (10–67 mg dm−3) [68].

3.2.9. Classification of the Studied Pedons

Soil morphological and laboratory analytical data were used to define diagnostic horizons and other features for classifying the soils. Summaries of the classification according to the USDA Soil Taxonomy and the World Reference Base (WRB) [20,69] for Soil Resource Schemes are presented in Table 10 and Table 11.
According to USDA Soil Taxonomy [19], the soils of the study area were classified as Ultisols (Pedons TSA-P01 and ANGO-P01), Vertisols (Pedon TSA-P02), and Alfisols (Pedon ANGO-P02). According to the WRB for soil resources [20], the soils of the study area were classified at TIER-1 as Acrisols (Pedon TSA-P01), Vertisols (Pedon TSA-P02), Alisols (ANGO-P01), and Luvisols (ANGO-P02). At the first level of both classification systems, the taxa correspond well with their pedogenetic definitions. Soils that are well developed and have clay-enriched B-horizons were classified as Ultisols (TSA-P01 and ANGO-P01) and Alfisols (ANGO-P02), while the deep-cracking soils with material turnover were classified as Vertisols (TSA-P02). In the WRB system, these taxa translate to Acrisols, Alisols, Luvisols, and Vertisols, respectively.

3.2.10. Suitability Assessment Based on Ecological Requirements of Irish Potato and Field Conditions of the Studied Pedons

The assessment results, which consider field conditions and the ecological requirements of Irish potatoes, are presented in Table 12. In this study, all pedons were classified as marginally suitable (S3) for Irish potato cultivation, aligning with findings in [70] on the Angónia Plateau. The overall suitability classes (OSC) were determined as follows: TSA-P01: S3f(ct), TSA-P02: S3f(cs), ANGO-P01: S3f(cts), and ANGO-P02: S3f(ct).

4. Discussion

4.1. Soil Morphological Characteristics

The variations in soil color, consistency, and structure observed across the studied pedons suggest differences in organic matter content, drainage status, and mineral composition [50]. The well-drained TSA-P01, ANGO-P01, and ANGO-P02 are more favorable for agricultural use compared to the moderately well-drained TSA-P02, which exhibits features indicative of waterlogging and reduced aeration. The presence of clay cutans in TSA-P01, ANGO-P01, and ANGO-P02 provides strong evidence of eluviation and illuviation processes, signifying downward translocation of clay and sesquioxides, typical of well-drained environments [20]. The structure and consistency of TSA-P02 highlight the presence of shrinking and swelling as the dominant pedogenic processes responsible for the observed deep, wide cracking; extremely hard consistency; and angular to subangular structural blocks. This makes TSA-P02 less favorable for crop production compared to the other pedons, which have more friable and well-aggregated structures. The four soil profiles were selected to represent distinct landform features (e.g., upland, mid-slope, footslope, and valley bottom), thus capturing major landscape variability relevant to land suitability assessment. Although limited in number, their representativeness was established by rigorous soil auger observations, consistent with semi-detailed survey standards [17,44]. Based on these findings, future land management in TSA-P02 should prioritize improving aeration and alleviating compaction to enhance its agricultural potential.

4.2. Soil Physical and Chemical Characteristics

Soil texture and structure play a vital role in determining soil fertility, water movement, and erosion potential. The observed sandy clay loam and sandy clay textures in TSA-P01, TSA-P02, and ANGO-P01 favor root penetration and water infiltration, making them more suitable for agricultural use compared to the clayey texture in ANGO-P02, which restricts drainage and aeration [16,53]. The presence of eluviation–illuviation processes in TSA-P01 and ANGO-P01, as indicated by their clay–sesquioxide cutans, supports their classification as highly weathered soils [51]. TSA-P02 has sandy subsoils, whereas ANGO-P02 transitions to sandy loam (SL), which enhances water movement compared to clay-dominated subsoils [50]. The silt:clay ratios further confirm that TSA-P01, ANGO-P01, and ANGO-P02 exhibit significant weathering, while TSA-P02 retains moderate weathering characteristics. With increasing depth, the ratio decreases across all profiles, reflecting advanced weathering in the subsoils. The higher silt:clay ratio in the topsoils than in the subsoils suggests clay accumulation in the deeper horizons due to eluviation and illuviation processes, a trend observed in other studies [71,72,73]. Among the pedons, TSA-P01, ANGO-P01, and ANGO-P02 appear highly weathered, while TSA-P02 displays moderate weathering characteristics.
The trends in BD, porosity, and penetration resistance highlight the importance of soil organic matter in maintaining soil structure and workability. TSA-P02 and ANGO-P02, which have higher OM, exhibit lower BD and greater porosity, promoting better root growth and moisture retention, while the higher BD in TSA-P01 and ANGO-P01 topsoils is linked to lower OM and compaction from grazing [74,75,76]. Subsoil compaction, as indicated by higher BD, generally results from reduced OM, less aggregation, and limited pore space [32].
Tsa-P01 and ANGO-P01 profiles exhibit higher topsoil penetration resistance, primarily due to compaction and low OM, consistent with higher BD values. Despite these variations, all studied pedons have penetration resistance values below the critical threshold (>3.0 MPa) that would significantly restrict root growth, indicating generally favorable conditions for plant development [32], suggesting that these soils generally provide a favorable rooting environment. AWC trends indicate that subsoils with higher clay content (166.6 mm m1 and 156.0 mm m1) retain more water, as seen in TSA-P02 and ANGO-P02 [54]. AWC trends with depth are consistent with findings by [77], indicating that soils with higher clay content tend to retain more water in deeper layers. This highlights the potential for these soils to support crops under varying moisture conditions, if drainage and aeration issues are managed effectively.
The observed variations in soil pH and electrical conductivity (EC) across the pedons reflect differences in organic matter content, leaching intensity, and base accumulation. TSA-P02 exhibited the highest pH range, which can be attributed to the increased content of Ca2+ and Mg2+ in the subsoil, helping to neutralize acidity. These pH variations across the pedons are consistent with findings by the authors of [43,76], who observed that increased pH with depth is typically linked to leaching and the accumulation of basic cations. The pH variations suggest that soil amendments may be necessary to optimize conditions for crop production. The electrical conductivity values indicate that salinity is not an issue in these soils, making them suitable for agriculture. Soil organic carbon (SOC) and TN levels varied across the pedons, with TSA-P02 having the highest SOC and TN contents, likely due to the incorporation of organic residues and nitrogen-fixing legumes [78]. In contrast, TSA-P01, ANGO-P01, and ANGO-P02 had lower SOC and TN levels, possibly due to continuous cropping and residue removal [78]. The SOC and TN trend, with higher topsoil levels and a decline with depth, is consistent across all pedons, reflecting surface accumulation of plant residues [79,80], highlighting the importance of organic matter management to sustain soil fertility.
The low levels of available phosphorus (P) suggest that phosphorus fertilization is necessary across all pedons, particularly in TSA-P01 and ANGO-P02, where P deficiency is more pronounced. The general decrease in available P content with soil depth aligns with similar findings in [73,77,81], which suggested that higher available P near the surface compared to subsurface horizons is attributed to higher SOC values in topsoils and to applied phosphatic fertilizers and manure. Additionally, higher SOC and frequent fertilizations also contribute to P leaching, particularly as the soil approaches its capacity limit for phosphorus sorption, as the soil silt:clay ratio decreases [82]. Favorable conditions, such as the presence of clay and OM, enhance P availability in deep layers in contrast to the surface layers, where P tends to bind more strongly to iron and aluminum minerals [73]. Similar trends have been reported by researchers in other regions [79,83]. According to [58], crops are very likely to respond to P fertilization when the soil test indicates that P-Mehlich is below 16 mg kg−1, and likely when P is above 16.1 mg kg−1. Therefore, for better crop yields, applications of phosphorus-containing fertilizers are deemed necessary in all studied pedons, particularly in pedons TSA-P02 and ANGO-P02.
The distribution of exchangeable bases across the pedons reveals variability in soil fertility. The relatively low Ca2+ and Mg2+ levels in TSA-P01 and ANGO-P01 suggest leaching effects, which are typical of highly weathered tropical soils. Conversely, TSA-P02 exhibited higher Ca2+ levels, likely due to the presence of calcareous materials that enhance base retention. CEC values indicate that TSA-P02 has a greater capacity for nutrient retention compared to the other pedons, which aligns with its high clay content and montmorillonitic mineralogy. CEC generally increased with depth in all pedons, except TSA-P02, likely due to higher clay content in the sublayers of the B horizon and the leaching of Ca2+ and Mg2+ from the topsoil of these pedons [84]. The observed CECclay values in pedons TSA-P01, ANGO-P01, and ANGO-P02 (19.92–53.06 cmol(+) kg−1) reflect a mixed clay mineralogy predominantly composed of kaolinite, with possible trace amounts of 2:1 silicate clay mineral (most probably illite), which commonly has CECclay values between 30 and 40 cmol(+) kg−1 [16]. The prevalence of kaolinite clay minerals in the studied pedons, except pedon TSA-P02 is typical of advanced weathering [43,84]. However, the CECclay value (135.5 cmol(+) kg−1) in the CRgk horizon of TSA-P02 profile suggests the presence of 2:1 clay minerals, most likely smectite, which contributes to higher reserves of Mg, K, and Fe according to [40,85], typical of younger and less weathered soils [16,42], neo-formed when the soil solution has a relatively higher pH [52].
The increasing percentage base saturation (PBS) values with depth reflect base redistribution through leaching, contributing to the observed fertility differences across horizons. In soils with a high calcium content, exchangeable cations saturate all accessible sites on the soil absorption complex, resulting in values of PBS greater than 100 [86], as seen in the TSA-P02 pedon. PBS greater than 100 suggests the existence of free cations that are not bound to the soil complex, as well as soluble salts or lime. In the studied pedons, PBS values increased with depth, likely due to leaching of cations such as Ca2+, Mg2+, and K+ [32]. This trend aligns with findings from [79], who reported that exchangeable bases tend to accumulate in lower slopes due to water and organic material migration, which also increases soil pH. Additionally, the high nitrogen and phosphorus concentrations in the upper layers of the studied pedons may have reduced exchangeable base levels in those regions, as documented by [87,88]. The non-sodic nature of all pedons, indicated by their low exchangeable sodium percentage (ESP), suggests that sodium does not pose a risk to soil structure or crop productivity.
The Ca/Mg and Mg/K ratios provide valuable insights into nutrient availability [89]. The low Ca/Mg ratios in TSA-P01, ANGO-P01, and ANGO-P02 suggest potential calcium and phosphorus deficiencies, which could hinder plant growth [16,71]. The high Mg/K ratios in ANGO-P02 may cause potassium deficiency due to competition between these cations for plant uptake [55]. The favorable K/total exchangeable bases (TEB) ratios in TSA-P01, TSA-P02, and ANGO-P01 indicate sufficient potassium availability, while the lower values in ANGO-P02 highlight the need for potassium fertilization.
Micronutrient analysis reveals deficiencies in iron (Fe) and zinc (Zn), which could impact plant metabolism. Decreasing Fe pattern reflects the effects of the parent material, organic matter, and leaching intensity in the studied area, which depletes Fe from the upper soil layers, in accordance with the findings in [61,90]. The TSA-P02 pedon demonstrates relatively higher Fe levels in the Ap horizon (10.96 mg kg1), likely due to limited leaching or organic matter cycling in the surface soil. The critical low Zn levels across all horizons are typical of tropical soils where Zn is lost through leaching or bound in forms unavailable to plants [91]. The slightly higher Zn levels in the Ap horizon of ANGO-P01 (0.383 mg kg1) may result from surface additions from Zn-containing fertilizers and organic matter. Manganese (Mn) levels are consistently high (>1 mg kg−1) [63], with values ranging from 1.446 to 3.223 mg kg1 across pedons. Mn availability generally decreases with depth [92], reflecting pedogenic depletion due to leaching and potential secondary mineral formation [73]. Copper (Cu), on the other hand, consistently falls within the high range (>1 mg kg1) across all horizons, as categorized in [59,63], with concentrations ranging from 0.981 to 2.098 mg kg1. This indicates that Cu is less prone to leaching compared to Fe, Zn, and Mn, likely due to the contribution of the parent rocks and minerals in the soil [93] and its strong affinity for organic matter and clay minerals [68]. Higher Cu levels suggest that it is unlikely to be a limiting factor for crop production in these soils.

4.3. Total Elemental Composition and Weathering Indices of the Studied Pedons

The total elemental composition analysis confirms that the studied pedons have undergone varying degrees of weathering, with SiO2 (silica) dominance consistent with intense leaching and quartz enrichment [40,94,95]. This suggests the soils are derived from materials with limited clay formation, typical of more weathered soils, often found in tropical and subtropical climates [96]. The presence of Al2O3 (alumina: 25% to 35%) and Fe2O3 (iron oxide: 5% to 10%) further supports this, reflecting the influence of aluminosilicate and iron-bearing minerals, which are common in tropical soils and indicative of advanced weathering processes [51,85]. The Fe2O3 content increased with depth in pedons TSA-P01 and ANGO-P01. In pedon ANGO-P02, the Fe2O3 content decreased with depth, similar to observations in [97], while in pedon TSA-P02, there was an increase from the first to the third horizon, followed by a decrease from the third to the last horizon. The high levels of Al2O3 and Fe2O3 in ANGO-P01 and TSA-P01 indicate substantial weathering, while higher concentrations of CaO and TiO2 in TSA-P02 indicate the presence of calcareous minerals, suggesting it is less weathered than other pedons, where Al2O3, P2O5, and Fe2O3 dominate, pointing to more advanced weathering [42,98]. These findings align with studies on tropical soils where kaolinite, iron oxides, and aluminum hydroxides predominate in highly weathered environments [99,100]. The SiO2/Al2O3 and SiO2/(Fe2O3 + Al2O3) ratios further illustrate the weathering intensity, with TSA-P01 and ANGO-P02 showing the most advanced weathering stages. These ratios indicate that pedons with lower SiO2/Al2O3 and SiO2/(Fe2O3 + Al2O3) proportions have undergone significant desilication, resulting in more acidic and nutrient-depleted soils, necessitating soil fertility management interventions.

4.4. Concentrations of Barium (Ba), Zirconium (Zr), Strontium (Sr), and Lead (Pb) in the Studied Pedons

The observed Ba and Zr concentrations confirm variations in parent material composition and soil development. The exceptionally high Ba levels in ANGO-P01 suggest localized enrichment due to resistant silicate minerals [66], while the higher Zr levels in ANGO-P02 reflect the persistence of zirconium-bearing minerals in weathered profiles [67], consistent with the findings of [101]. Sr mobility varies across pedons, with TSA-P02 and ANGO-P02 showing Sr accumulation in deeper horizons, possibly due to leaching processes [68]. In contrast, TSA-P01 and ANGO-P01 exhibit decreasing Sr trends with depth, indicating a closer association with calcium cycling [65].
Pb concentrations in TSA-P01 exceed safe limits in the Bt2 horizon, raising concerns about potential contamination sources [68]. Generally, Pb concentrations decrease with depth, which is consistent with findings by [102,103]. While Pb is typically found at concentrations of 10–67 mg dm−3, values exceeding 100 mg dm−3 may indicate contamination from anthropogenic inputs [68]. Levels above 300 mg dm−3 suggest severe pollution [104], posing risks of root growth inhibition and potential toxicity if Pb enters the food chain. The higher Pb levels in pedon TSA-P01, particularly in the Bt2 horizon, are likely influenced by the parent material, consisting of quartz–feldspathic and amphibolic gneiss, which may have naturally higher lead content [61]. The increased OM and clay content in the Bt2 horizon promote metal retention [60,105], while the acidic pH enhances Pb mobility within the soil profile [105].

4.5. Classification of the Studied Pedons

The classification of the studied pedons based on USDA Soil Taxonomy and WRB systems aligns with their pedogenetic characteristics. The identification of Ultisols and Alfisols in TSA-P01, ANGO-P01, and ANGO-P02 is consistent with the presence of argillic horizons and their relatively high degree of weathering. These pedons exhibit low base saturation and clay illuviation, which are typical features of highly leached tropical soils [27,70]. The classification of TSA-P02 as a Vertisol corresponds with its high clay content, shrink–swell properties, and deep-cracking characteristics, which significantly influence soil management and land use practices. The WRB classification further refines soil interpretation by incorporating key diagnostic properties. The Acrisols and Alisols identified in TSA-P01 and ANGO-P01 confirm the presence of low base saturation and clay illuviation, whereas the classification of ANGO-P02 as a Luvisol aligns with its relatively higher base status. TSA-P02, classified as a Vertisol with calcic and pellic properties, highlights the presence of montmorillonitic clays and seasonal moisture fluctuations.

4.6. Suitability Assessment for Irish Potato Cultivation

The land suitability assessment indicates that all studied pedons are marginally suitable (S3) for Irish potato cultivation due to significant fertility constraints. Low levels of organic carbon, total nitrogen, and available phosphorus, combined with unfavorable cation exchange capacity (CEC) and base saturation, pose major challenges for crop production. TSA-P02, despite its high clay content, has slightly better fertility conditions than the other pedons due to its greater nutrient retention capacity.
Topographic constraints, particularly in ANGO-P01 and ANGO-P02, further limit agricultural potential due to steep slopes (>12%), which increase erosion risks. Climate-related factors, such as temperature, also contribute to marginal suitability, as noted in previous studies on Irish potato cultivation in tropical highland regions [28,72]. The primary limitation across all pedons is soil fertility (f), with additional minor constraints related to climate (c), topography (t), and soil physical properties (s). TSA-P01 is affected by low organic carbon, total nitrogen, and exchangeable bases, leading to reduced CEC and base saturation, while TSA-P02 is constrained by low zinc levels, total nitrogen, and limited CEC. However, TSA-P02 exhibits fewer limitations than the other pedons, indicating moderate to significant constraints overall. Although the fertility assessment focuses on the 0–60 cm rooting zone (where Irish potato roots absorb the majority of nutrients and water), deeper soil layers also play a supporting role, especially under drought conditions and when nutrients migrate below the surface horizon. Therefore, the evaluation of full soil profiles, as undertaken in this study, is essential for identifying not only surface fertility limitations but also potential subsurface constraints or nutrient reserves. This broader perspective is consistent with land evaluation standards [17,18,45] and reinforces the recommendation for targeted fertility management to improve productivity across all pedons classified as marginally suitable (S3).

5. Conclusions and Recommendations

5.1. Conclusions

The study sites in Tsangano and Angónia districts are characterized by high annual rainfall (800–1200 mm) and temperatures ranging from 15 to 22 °C. Soil profiles exhibit considerable variation in depth, texture, and fertility. The studied pedons (TSA-P01, TSA-P02, ANGO-P01, and ANGO-P02) show different drainage classes, colors, consistencies, and structures, affecting their suitability for Irish potato cultivation. The pedons displayed varying soil textures, bulk densities, and porosities, influencing root growth and water retention. Pedons TSA-P01 and ANGO-P02 are more susceptible to erosion due to higher sand content (44–56%) and a lower topsoil silt/clay ratio (0.25–0.29). TSA-P02 has the highest SOC in the topsoil, while ANGO-P02 has the lowest. Available P ranged from 5.2 to 25.1 mg kg−1, with TSA-P02 having the highest available P and ANGO-P01 having the lowest. Potassium levels ranged from 0.08 to 1.19 cmol(+) kg−1, with TSA-P01 and TSA-P02 exhibiting higher K contents compared to ANGO-P01 and ANGO-P02. CEC ranged from 7.29 to 12.52 cmol(+) kg−1, with TSA-P02 having the highest CEC, indicating better nutrient retention capacity. ANGO-P01 is the most weathered pedon, with lower SiO2/Al2O3 (1.41–1.81) and SiO2/(Al2O3 + Fe2O3) (0.94–1.28) ratios, indicating significant leaching and clay formation. In contrast, TSA-P02, with higher SiO2/Al2O3 (1.30–4.25) and SiO2/(Al2O3 + Fe2O3) (1.08–3.97) ratios, shows less weathering and greater silica retention. Pedons TSA-P01 and ANGO-P02 were both classified as “Typic Haplustults” and “Ultic Haplustalfs”, respectively, according to USDA Soil Taxonomy, and as “Haplic Acrisols” and “Chromic Luvisols”, respectively, according to FAO World Reference Base for Soil Resources. Pedon TSA-P02 and ANGO-P01 were classified as “Typic Calciusterts” and “Typic Paleustults”, respectively, according to USDA Soil Taxonomy, and as “Pellic Calcic Vertisols” and “Chromic Abruptic Alisols”, respectively, according to FAO World Reference Base for Soil Resources. The evaluated pedons were classified as marginally suitable (S3) for Irish potato cultivation due to significant soil fertility limitations (f) and minor constraints related to climate (c), topography (t), and physical properties (s).

5.2. Recommendations

To enhance the suitability of soils in Tsangano and Angónia Districts for Irish potato cultivation and address soil degradation issues, the following recommendations are made:
Incorporating organic amendments, such as compost or manure, and practicing crop rotation with legumes (especially in TSA-P01 and AGO-P01) can improve soil health and promote nitrogen fixation. TSA-P01 and ANGO-P01 present the greatest challenges due to low organic carbon and nitrogen levels. Fertilization focusing on these deficiencies, particularly nitrogen and zinc, will be critical to improving nutrient availability, and regular soil testing, especially for these profiles, is recommended. Improving CEC and BS is crucial, particularly in TSA-P01, where these factors are most limiting. Strategies like adding organic matter, using mulch, and employing cover crops will help improve soil structure and water and nutrient retention. Soil conservation practices, such as contour plowing, terracing, and maintaining ground cover, should be implemented in all profiles, with special focus on TSA-P01 and ANGO-P01 due to higher erosion risks in the hilly areas.
Regarding climate, adjusting planting dates in TSA-P01 and ANGO-P01 to avoid critical heat periods and adopting drought- and heat-tolerant potato varieties is essential. In TSA-P02, where climatic conditions are more favorable, prioritizing the use of areas with similar characteristics can improve productivity.
Finally, continuous monitoring of soil conditions through regular testing is essential, especially for TSA-P02, which showed fewer limitations. Adaptive management, adjusted based on monitoring results, will ensure soil health is maintained, and more suitable practices are implemented according to the needs of each profile. By addressing these recommendations, the potential for Irish potato production in Tsangano and Angónia districts can be significantly improved, contributing to enhanced food security and economic development in Central Mozambique.

Author Contributions

Conceptualization, T.J.S. and B.M.M.; methodology, T.J.S. and B.M.M.; validation, T.J.S., A.M.T.A. and H.J.T.; formal analysis, T.J.S.; investigation, T.J.S. and B.M.M.; resources, T.J.S.; data curation, T.J.S.; writing—original draft preparation, T.J.S. and A.M.T.A.; writing—review and editing, T.J.S., B.M.M., A.M.T.A., H.J.T., J.M.S. and M.S.; visualization, T.J.S., B.M.M., A.M.T.A., H.J.T., J.M.S. and M.S.; supervision, B.M.M., A.M.T.A., H.J.T., J.M.S. and M.S.; funding acquisition, T.J.S. All authors have read and agreed to the published version of the manuscript.

Funding

This study was funded by the Regional Scholarship and Innovation Fund (RSIF) of the Partnership for Skills in Applied Sciences, Engineering and Technology (PASET) (project grant No. P165581) grant to SACIDS Africa Centre of Excellence for Infectious Diseases of Humans and Animals in Southern and East Africa (SACIDS-ACE) at the Sokoine University of Agriculture (SUA), as well as DOCTAS from Carnegie Corporation (grant number is G-22-59858) and Zambeze University, Mozambique. Tamara José Sande is a recipient of an RSIF-PASET doctoral scholarship at SUA.

Institutional Review Board Statement

Not applicable.

Informed Consent Statement

Not applicable.

Data Availability Statement

The raw data supporting the conclusions of this article will be made available by the authors upon request.

Acknowledgments

We sincerely acknowledge the local authorities, the extension, and the farmers of Tsangano and Angónia Districts for their invaluable support during fieldwork.

Conflicts of Interest

The authors declare no conflicts of interest. The funders had no role in the design of the study; in the collection, analyses, or interpretation of data; in the writing of the manuscript; or in the decision to publish the results.

References

  1. Demo, P.; Dominguez, S.; Cumbi, S.; Walker, T. The Potato Sub-Sector and Strategies for Sustainable Seed Production in Mozambique Report of a TWO-week Potato Sub-Sector Study Conducted from 21 November to 4 December of 2005, Maputo, Moçambique. Maputo, March 2006. Available online: https://www.yumpu.com/en/document/view/37547166/the-potato-sub-sector-and-strategies-for-sustainable-seed-production- (accessed on 14 January 2025).
  2. Amede, T.; Desta, L.T.; Harris, D.; Kizito, F.; Cai, X. The Chinyanja Triangle in the Zambezi River Basin, Southern Africa: Status of, and Prospects for, Agriculture, Natural Resources Management and Rural Development; International Water Management Institute (IWMI): Colombo, Sri Lanka, 2014. [Google Scholar] [CrossRef]
  3. Ántónio, J.; Favero, L.A.; Cabral, R.M. Análise Da Cadeia Produtiva Da Batata Reno Da Região Do Vale Zambeze (Moçambique): Governança E Coordenação. Contextus—Revista Contemporânea de Economia e Gestão 2008, 9, 97–115. [Google Scholar] [CrossRef]
  4. Schelling, N. Horticulture and Potato Market Study in Mozambique. Pretoria, 2015. Available online: http://agriprofocus.com/upload/HorticultureandPotatoMarketStudyinMozambique1417448632.pdf (accessed on 1 May 2022).
  5. Harahagazwe, D.; Condori, B.; Barreda, C.; Bararyenya, A.; Byarugaba, A.A.; Kude, D.A.; Lung’aho, C.; Martinho, C.; Mbiri, D.; Nasona, B.; et al. How big is the potato (Solanum tuberosum L.) yield gap in Sub-Saharan Africa and why? A participatory approach. Open Agric. 2018, 3, 180–189. [Google Scholar] [CrossRef]
  6. Karlen, D.L.; Andrews, S.S.; Doran, J.W. Soil quality: Current concepts and applications. Adv. Agron. 2001, 74, 1–40. [Google Scholar]
  7. Estrada-Herrera, I.R.; Hidalgo-Moreno, C.; Guzmán-Plazola, R.; Almaraz Suárez, J.J.; Navarro-Garza, H.; Etchevers-Barra, J.D. Soil quality indicators to evaluate soil fertility. Agrociencia 2017, 51, 813–831. [Google Scholar]
  8. Hatfield, J.L. Soil degradation, land use, and sustainability. In Convergence of Food Security, Energy Security and Sustainable Agriculture; Springer: Berlin/Heidelberg, Germany, 2014; pp. 61–74. [Google Scholar] [CrossRef]
  9. Vlek, P.L.G. The incipient threat of land degradation. J. Indian Soc. Soil Sci. 2008, 56, 1–13. [Google Scholar]
  10. Zhang, J. Soil Environmental Deterioration and Ecological Rehabilitation. Study Ecol. Eng. Hum. Settl. 2020, 41–82. [Google Scholar] [CrossRef]
  11. Osman, K.T.; Osman, K.T. Soil resources and soil degradation. In Soils: Principles, properties and management; Springer: Dordrecht, The Netherlands, 2013; pp. 175–213. [Google Scholar] [CrossRef]
  12. Veum, K.S.; Goyne, K.W.; Kremer, R.J.; Miles, R.J.; Sudduth, K.A. Biological indicators of soil quality and soil organic matter characteristics in an agricultural management continuum. Biogeochemistry 2014, 117, 81–99. [Google Scholar] [CrossRef]
  13. Li, J.; Nie, M.; Powell, J.R.; Bissett, A.; Pendall, E. Soil physico-chemical properties are critical for predicting carbon storage and nutrient availability across Australia. Environ. Res. Lett. 2020, 15, 094088. [Google Scholar] [CrossRef]
  14. Manikandan, K.; Kannan, P.; Sankar, M.; Vishnu, G. Concepts on land evaluation. Earth Sci. India 2013, VI, 20–26. [Google Scholar]
  15. Rossiter, D.G. Land evaluation: Towards a revised framework. Geoderma 2009, 148, 428–429. [Google Scholar] [CrossRef]
  16. Landon, J.R. Booker Tropical Soil Manual: A Handbook for Soil Survey and Agricultural Land Evaluation in the Tropics and Subtropics; Paperback, J.R., Ed.; John Wiley & Sons: New York, NY, USA, 2013; p. 531. [Google Scholar]
  17. FAO. A Framework for Land Evaluation, Soil Bulletin; FAO Rome: Rome, Italy, 1976; Volume 32. [Google Scholar]
  18. Sys, C.; Van Ranst, E.; Debaveye, J. Land Evaluation. Part I: Principles in Land Evaluation and Crop Production Calculations; Agricultural Publication No 7: Brussels, Belgium, 1991; p. 280. [Google Scholar]
  19. Soil Survey Staff. Keys to Soil Taxonomy, 13th ed.; United States Department of Agriculture, Natural Resources Conservation Service: Washington, DC, USA, 2022; p. 410. [Google Scholar]
  20. IUSSWorking Group. World Reference Base for Soil Resources 2014, Update 2015 International Soil Classification System for Naming Soils and Creating Legends for Soil Maps, 106th ed.; Food and Agriculture Organization of the United Nations (FAO): Rome, Italy, 2015; Volume 106, p. 203. [Google Scholar]
  21. Ministério Da Indústria E Comércio Direcção Nacional Do Comércio Interno. DNCI Plano Operacional Da Comercialização Agrícola, Tete; Direcção Nacional Do Comércio Interno (DNCI): Maputo, Mozambique, 2018. Available online: https://www.mic.gov.mz/por/content/download/6731/47986/version/1/file/POCA++Tete+2018.pdf (accessed on 3 August 2024).
  22. MITADER. Avaliação Ambiental Estratégica, Plano Multissectorial, Plano Especial de Ordenamento Territorial do Vale do Zambeze e Modelo Digital de Suporte a Decisões; Perfil Ambiental Distrital de Tsangano: Maputo, Mozambique, 2015. [Google Scholar]
  23. Mitader. Perfil Ambiental Distrital de Angónia Plano Multissectorial, Plano Especial de Ordenamento Territorial do Vale do Zambeze e Modelo Digital de Suporte a Decisões Ministério da Economia E Finanças. Agência de Desenvolvimento do Vale do Zambe, 2005th ed.; Mitader, Ed.; MEF: Maputo, Mozambique, 2015; p. 97. Available online: https://biblioteca.biofund.org.mz/biblioteca_virtual/avaliacao-ambiental-estrategica-plano-multissectorial-plano-especial-de-ordenamento-territorial-do-vale-do-zambeze-e-modelo-digital-de-suporte-a-decisoes-perfil-ambiental-distrital-de-angonia/ (accessed on 5 August 2024).
  24. JICA. The Study on the Integrated Development Master Plan of the Angonia Region in the Republic of Mozambique. Final Report. Master Plan Report. 2001. Available online: https://openjicareport.jica.go.jp/pdf/11668704.pdf (accessed on 19 June 2022).
  25. Nkoka, F.; Veldwisch, G.J.A.; Bolding, J.A. Organisational modalities of farmer-led irrigation development in Tsangano District, Mozambique. Water Altern. 2014, 7, 414–433. [Google Scholar]
  26. Maereka, E.K.; Makate, C.; Chataika, B.Y.; Mango, N.; Zulu, R.M.; Munthali, G.; Amane, M.I.; Chirwa, R.M. Estimation and Characterization of Bean Seed Demand in Angonia District of Mozambique. 2015. Available online: https://cgspace.cgiar.org/server/api/core/bitstreams/1295ee00-901f-4eeb-8c46-2921997fcaff/content (accessed on 16 September 2024).
  27. Voortman, R.L.; Spiers, F.B. Landscape Ecological Survey and Land Evaluation, For Rural Development Planning, Angonia District, Tete Province. Climate, Agro-Climatic Zones and Agro-Climatic Suitability; Instituto Nacional de Investigacao Agronomica: Maputo, The Republic of Mozambique, 1986; Volume 5. [Google Scholar]
  28. Amerling, R.; Winchester, J.F.; Ronco, C. Guidelines for Soil Description; Food and Agriculture Organization of the United Nations (FAO): Rome, Italy, 2006; pp. 36–38. [Google Scholar]
  29. Kipfer, B.A. Munsell Soil Color Chart. In Encyclopedic Dictionary of Archaeology; Macbeth: Windsor, Australia, 1994; p. 29. [Google Scholar]
  30. Klute, A. Methods of soil analysis. In Part 1: Physical and Mineralogical Methods; American Society of Agronomy and Soil Science Society of America: Madison, WI, USA, 1986; p. 1358. [Google Scholar]
  31. Cho, S.E. Effects of spatial variability of soil properties on slope stability. Eng. Geol. 2007, 92, 97–109. [Google Scholar] [CrossRef]
  32. Hazelton, P.; Murphy, B. Interpreting Soil Test Results: What do the Numbers Mean? 3rd ed.; CSIRO Publishing: Clayton South, Autralia, 2016; p. 201. [Google Scholar]
  33. Moraes, M.T.D.; Debiasi, H.; Carlesso, R.; Franchini, J.C.; Silva, V.R.D. Critical limits of soil penetration resistance in a rhodic Eutrudox. Rev. Bras. Ciência Do Solo 2014, 38, 288–298. [Google Scholar] [CrossRef]
  34. Okalebo, J.R.; Gathua, W.K.; Woomer, L.P. Laboratory Methods of Soil and Plant Analysis: A Working Manual, 2nd ed.; Sacred Africa: Nairobi, Kenya, 2002; p. 131. [Google Scholar]
  35. Estefan, G.; Sommer, R.; Ryan, J. Methods of Soil, Plant, and Water Analysis: A manual for the West Asia and North Africa Region, 3rd ed.; International Centre for Agricultural Research in the Dry Areas (ICARDA), Beirut: References—Scientific Research Publishing: Colombo, Sri Lanka, 2013; pp. 1–243. [Google Scholar]
  36. ASTM D 2974-8; Standard Test Methods for Moisture, Ash, and Organic Matter of Peat and Other Organic Soils. American Society for Testing and Materials: Philadelphia, PA, USA, 1987; p. 3.
  37. Rayment, G.E.; Lyons, D.J. Soil Chemical Methods; CSIRO Publishing: Collingwood, Australia, 2011; Volume 3. [Google Scholar]
  38. Parkinson, J.A.; Allen, S.E. A wet oxidation procedure suitable for the determination of nitrogen and mineral nutrients in biological material. Commun Soil Sci Plant Anal. 1975, 6, 1–11. [Google Scholar] [CrossRef]
  39. Mehlich, A. Mehlich 3 soil test extractant: A modification of Mehlich 2 extractant. Commun. Soil Sci. Plant Anal. 1984, 15, 1409–1416. [Google Scholar] [CrossRef]
  40. Baize, D. Soil Science Analyses: A Guide to Current Use; John Wiley & Sons Ltd.: Hoboken, NJ, USA, 1993; p. 187. [Google Scholar]
  41. Tiecher, T.; Gatiboni, L.; Rheinheimer dos Santos, D.; Alberto Bissani, C.; Posselt Martins, A.; Gianello, C.; Dick, D.P.; Bortoluzzi, E.C.; Escosteguy, P.A.V.; da Silva, L.S.; et al. Base saturation is an inadequate term for Soil Science. Bras. J. Soil Sci. 2022, 46, e0220125. [Google Scholar] [CrossRef]
  42. Nile, C.B. (Ed.) The Nature and Properties of Soils; Macmillan Publishing Company: New York, NY, USA, 1984; p. 780. [Google Scholar]
  43. Kalala, A.M.; Msanya, B.M.; Amuri, N.A.; Semoka, J.M. Pedological characterization of some typical alluvial soils of Kilombero District, Tanzania. Am. J. Agric. For. 2017, 5, 1–11. [Google Scholar]
  44. Sys, C.; Van Ranst, E.; Debaveye, J. Land Evaluation. Part 2: Methods in Land Evaluation; Agricultural Publications: Brussels, Belgium, 1991. [Google Scholar]
  45. Iliquín Trigoso, D.; Salas López, R.; Rojas Briceño, N.B.; Silva López, J.O.; Gómez Fernández, D.; Oliva, M.; Huatangari, L.Q.; Murga, R.E.T.; Castillo, E.B.; Gurbillón, M.Á.B. Land suitability analysis for potato crop in the Jucusbamba and Tincas Microwatersheds (Amazonas, NW Peru): AHP and RS–GIS approach. Agronomy 2020, 10, 1898. [Google Scholar] [CrossRef]
  46. Mugo, J.N.; Karanja, N.N.; Gachene, C.K.; Dittert, K.; Nyawade, S.O.; Schulte-Geldermann, E. Assessment of soil fertility and potato crop nutrient status in central and eastern highlands of Kenya. Sci. Rep. 2020, 10, 7779. [Google Scholar] [CrossRef]
  47. Asfaw, M.; Asfaw, D. Agricultural Land Suitability Analysis for Potato Crop by Using Gis and Remote Sensing Technology, in the Case of Amhara Region, Ethiopia. J. Resour. Dev. Manag. 2017, 33, 30–40. Available online: https://www.iiste.org (accessed on 5 October 2024).
  48. Enang, R.K.; Yerima, B.P.K.; Kome, G.K. Soil physico-chemical properties and land suitability evaluation for maize (Zea mays), beans (Phaseolus vulgaris) and Irish potatoes (Solanum tuberosum) in tephra soils of the western slopes of mount Kupe (Cameroon). Afr. J. Agric. Res. 2016, 11, 4571–4583. [Google Scholar]
  49. Martinho, C.A.; Lung, C.; Roda, F.A.; Pereira, R.; Mofate, O.A.; Naconha, A.E. Manual de Maneio da Cultura de Batata Reno. 2017, 1–26. Available online: https://pt.scribd.com/document/454072314/Manual-da-Batata-reno-versao-2018 (accessed on 30 July 2024).
  50. Peverill, K.I.; Sparrow, L.A.; Reuter, K.I. (Eds.) Soil Analysis: An Interpretation Manual; SCIRO Publishing: Collingwood, ON, Canada, 1999; p. 369. [Google Scholar]
  51. Buol, S.W.; Southard, R.J.; Graham, R.C.; McDaniel, P.A. Soil Genesis and Classification., 6th ed.; Madison Wis Buol, S.W., Hole, F.D., McCracken, R.J., Eds.; John Wiley & Sons: West Sussex, UK, 2011; p. 543. [Google Scholar]
  52. Wang, L.; He, Z.; Zhao, W.; Wang, C.; Ma, D. Fine soil texture is conducive to crop productivity and nitrogen retention in irrigated cropland in a desert-oasis ecotone, Northwest China. Agronomy 2022, 12, 1509. [Google Scholar] [CrossRef]
  53. Jones Jr, B. Laboratory Guide For Conducting Soil Tests Plant Analysis; CRC Press: New York, NY, USA, 2001; p. 382. [Google Scholar]
  54. Lardy, J.M.; DeSutter, T.M.; Daigh, A.L.M.; Meehan, M.A.; Staricka, J.A. Effects of soil bulk density and water content on penetration resistance. Agric. Environ. Lett. 2022, 7, e20096. [Google Scholar] [CrossRef]
  55. Msanya, B.M.; Kimaro, D.N.; Kimbi, G.G.; Kileo, E.P.; Mbogoni, J.J.D.J. Soils and Land Resources OF Morogoro Rural and Urban Districts. In Land Resources Inventory and Suitability Assessment for the Major Land Use Types In Morogoro Urban District, Tanzania; Sokoine University of Agriculture: Tanzania, Morogoro, 2001; Volume 4, ISBN 9987 605 29 X. [Google Scholar]
  56. Kononova, M.M. Soil Organic Matter: Its Nature, Its Role in Soil Formation and in Soil Fertility; Elsevier: Amsterdam, The Netherlands, 2013. [Google Scholar]
  57. Lehmann, J.; Kleber, M. The contentious nature of soil organic matter. Nature 2015, 528, 60–68. [Google Scholar] [CrossRef]
  58. Heckman, J.R. Soil Fertility Test Interpretation Phosphorus, Potassium, Magnesium, and Calcium. 2004. Available online: https://s3.amazonaws.com/assets.cce.cornell.edu/attachments/10623/Rutgers_fs719_soil_fertility.pdf?1441295901 (accessed on 3 August 2024).
  59. Mumbach, G.L.; Oliveira, D.A.D.; Warmling, M.I.; Gatiboni, L.C. Phosphorus extraction by Mehlich 1, Mehlich 3 and Anion Exchange Resin in soils with different clay contents. Rev. Ceres. 2018, 65, 546–554. [Google Scholar] [CrossRef]
  60. Savoy, H. Interpreting Mehlich 1 and 3 Soil Test Extractant Results for P and K in Tennessee. University of Tennessee, Institute of Agriculture, W229 08/09 10-0043. 2009. Available online: https://trace.tennessee.edu/utk_agexcrop/63/ (accessed on 20 August 2024).
  61. da Silva, R.J.A.B.; da Silva, Y.J.A.B.; van Straaten, P.; do Nascimento, C.W.A.; Biondi, C.M.; da Silva, Y.J.A.B.; de Araújo Filho, J.C. Influence of parent material on soil chemical characteristics in a semi-arid tropical region of Northeast Brazil. Environ. Monit. Assess. 2022, 194, 331. [Google Scholar] [CrossRef] [PubMed]
  62. Maria, R.M.; Yost, R. A survey of soil fertility status of four agroecological zones of Mozambique. Soil Sci. 2006, 171, 902–914. Available online: https://journals.lww.com/soilsci/Fulltext/2006/11000/A_SURVEY_OF_SOIL_FERTILITY_STATUS_OF_FOUR.8.aspx (accessed on 20 July 2022). [CrossRef]
  63. Havlin, J.L. Soil: Fertility and nutrient management. In Landscape and Land Capacity; CRC Press: Boca Raton, FL, USA, 2020; pp. 251–265. [Google Scholar]
  64. Soil and Plant Analysis Council. Soil Analysis Handbook of Reference Methods; CRC Press: Boca Raton, FL, USA, 1992; p. 265. [Google Scholar]
  65. Andreasen, R.; Thomsen, E. Strontium is released rapidly from agricultural lime–implications for provenance and migration studies. Front. Ecol. Evol. 2021, 8, 588422. [Google Scholar] [CrossRef]
  66. Gregorauskienė, V.; Kadunas, V. Vertical distribution patterns of trace and major elements within soil profile in Lithuania. Geol. Q. 2006, 50, 229–237. [Google Scholar]
  67. Shahid, M.; Ferrand, E.; Schreck, E.; Dumat, C. Behavior and impact of zirconium in the soil–plant system: Plant uptake and phytotoxicity. Rev. Environ. Contam. Toxicol. 2012, 221, 107–127. [Google Scholar]
  68. Kabata-Pendias, A. Trace Elements in Soils and Plants; CRC Press: Boca Raton, FL, USA, 2000. [Google Scholar]
  69. Soil Survey Staff. Keys to Soil Taxonomy, 12th ed.; Soil Conservation Service, United States Department of Agriculture, Natural Resources Conservation Service: Washington, DC, USA, 2014; Volume 12, p. 360. [Google Scholar]
  70. Voortman, R.L.; Spires, B. FAO Landscape Ecological Survey And Land Evaluation, For Rural Development Planning, Angonia District, Tete Province. In Land Evaluation, Land Suitability and Recommended Land Use; Instituto de Investigacao Agraria de: Maputo, Mocambique, 1986; Volume 6. [Google Scholar]
  71. Dinssa, B.; Elias, E. Characterization and classification of soils of bako tibe district, west shewa, Ethiopia. Heliyon 2021, 7, 1–13. [Google Scholar] [CrossRef] [PubMed]
  72. Mohamed, S.H.; Msanya, B.M.; Tindwa, H.J.; Semu, E. Pedological characterization and classification of selected soils of morogoro and mbeya regions of Tanzania. Int. J. Nat. Resour. Ecol. Manag. 2021, 6, 79–92. [Google Scholar] [CrossRef]
  73. Uwingabire, S.; Msanya, B.M.; Mtakwa, P.W.; Uwitonze, P.; Sirikare, S. Pedological Characterization of soils developed on gneissic granites in the Congo Nile Watershed Divide and Central Plateau zones, Rwanda. Int. J. Curr. Res. 2016, 8, 39489–39501. Available online: http://www.journalcra.com (accessed on 10 December 2024).
  74. Blanco-Canqui, H.; Stone, L.R.; Schlegel, A.J.; Lyon, D.J.; Vigil, M.F.; Mikha, M.M.; Stahlman, P.W.; Rice, C.W. No-till induced increase in organic carbon reduces maximum bulk density of soils. Soil Sci. Soc. Am. J. 2009, 73, 1871–1879. [Google Scholar] [CrossRef]
  75. Chichongue, O.; van Tol, J.; Ceronio, G.; Du Preez, C. Effects of tillage systems and cropping patterns on soil physical properties in Mozambique. Agriculture 2020, 10, 448. [Google Scholar] [CrossRef]
  76. Takele, L.; Chimdi, A.; Abebaw, A. Dynamics of soil fertility as influenced by different land use systems and soil depth in West Showa Zone, Gindeberet District, Ethiopia. Agriculture. Agric. For. Fish. 2014, 3, 489–494. [Google Scholar]
  77. Hailu, A.H.; Kibret, K.; Gebrekidan, H. Characterization and classification of soils of kabe subwatershed in south wollo zone, northeastern Ethiopia. Afr. J. Soil Sci. 2015, 3, 134–146. [Google Scholar]
  78. Pereira, M.J.S.L.; Esteves da Silva, J. Environmental Stressors of Mozambique Soil Quality. Environments 2024, 11, 125. [Google Scholar] [CrossRef]
  79. Dessalegn, D.; Beyene, S.; Ram, N.; Walley, F.; Gala, T.S. Effects of topography and land use on soil characteristics along the toposequence of Ele watershed in southern Ethiopia. Catena 2014, 115, 47–54. [Google Scholar] [CrossRef]
  80. Alemayehu, Y.; Gebrekidan, H.; Beyene, S. Pedological characteristics and classification of soils along landscapes at Abobo, southwestern lowlands of Ethiopia. J. Soil Sci. Environ. Manag. 2014, 5, 72–82. [Google Scholar]
  81. Gebrehanna, B.; Beyene, S.; Abera, G. Impact of Topography on Soil Properties in Delboatwaro Subwatershed, Southern Ethiopia. Asian J. Soil Sci. Plant Nutr. 2022, 8, 34–50. [Google Scholar] [CrossRef]
  82. Condron, L.M.; Sinaj, S.; McDowell, R.W.; Dudler-Guela, J.; Scott, J.T.; Metherell, A.K. Influence of long-term irrigation on the distribution and availability of soil phosphorus under permanent pasture. Soil Res. 2006, 44, 127–133. [Google Scholar] [CrossRef]
  83. Ortiz, C.; Pierotti, S.; Molina, M.G.; Bosch-Serra, À.D. Soil Fertility and Phosphorus Leaching in Irrigated Calcareous Soils of the Mediterranean Region. Environ. Monit. Assess. 2023, 195, 1376. [Google Scholar] [CrossRef]
  84. Solly, E.F.; Weber, V.; Zimmermann, S.; Walthert, L.; Hagedorn, F.; Schmidt, M.W.I. A critical evaluation of the relationship between the effective cation exchange capacity and soil organic carbon content in Swiss forest soils. Front. For. Glob. Chang. 2020, 3, 98. [Google Scholar] [CrossRef]
  85. Kumaragamage, D.; Warren, J.; Spiers, G. Soil Chemistry. In Digging into Canadian Soils; Canadian Society of Soil Science: Pinawa, MB, Canada, 2021. [Google Scholar]
  86. Tomašic, M.; Zgorelec, Ž.; Jurišic, A.; Kisic, I. Cation exchange capacity of dominant soil types in the Republic of Croatia. J. Cent. Eur. Agric. 2013, 14, 84–98. [Google Scholar] [CrossRef]
  87. Lu, X.; Mao, Q.; Gilliam, F.S.; Luo, Y.; Mo, J. Nitrogen deposition contributes to soil acidification in tropical ecosystems. Glob. Change Biol. 2014, 20, 3790–3801. Available online: https://onlinelibrary.wiley.com/doi/full/10.1111/gcb.12665 (accessed on 13 March 2025). [CrossRef] [PubMed]
  88. Niu, G.; Wang, R.; Hasi, M.; Wang, Y.; Geng, Q.; Wang, C.; Jiang, Y.; Huang, J. Availability of soil base cations and micronutrients along soil profile after 13-year nitrogen and water addition in a semi-arid grassland. Biogeochemistry 2021, 152, 223–236. Available online: https://link.springer.com/article/10.1007/s10533-020-00749-5 (accessed on 13 March 2025). [CrossRef]
  89. Hodges, S.C. Soil Fertility Basics; Soil Science Extension North Carolina State University, Academic Press: Cambridge, MA, USA, 2007; p. 75. Available online: https://www.online-pdh.com/file.php/562/FER_SG.pdf (accessed on 6 December 2024).
  90. Dhaliwal, S.S.; Sharma, V.; Kaur, J.; Shukla, A.K.; Hossain, A.; Abdel-Hafez, S.H.; Gaber, A.; Sayed, S.; Singh, V.K. The Pedospheric Variation of DTPA-Extractable Zn, Fe, Mn, Cu and Other Physicochemical Characteristics in Major Soil Orders in Existing Land Use Systems of Punjab, India. Sustainability 2021, 14, 29. Available online: https://www.mdpi.com/2071-1050/14/1/29/htm (accessed on 8 December 2024). [CrossRef]
  91. Liang, B.; Han, G.; Zhao, Y. Zinc isotopic signature in tropical soils: A review. Sci. Total Environ. 2022, 820, 153303. [Google Scholar] [CrossRef]
  92. Walna, B.; Spychalski, W.; Ibragimow, A. Fractionation of iron and manganese in the horizons of a nutrient-poor forest soil profile using the sequential extraction method. Pol. J. Environ. Stud. 2010, 19, 1029–1037. [Google Scholar]
  93. Uwitonze, P.; Msanya, B.M.; Mtakwa, P.W.; Uwingabire, S.; Sirikare, S. Pedological Characterization of Soils Developed from Volcanic Parent Materials of Northern Province of Rwanda. Agric. For. Fish. 2016, 5, 225–236. [Google Scholar] [CrossRef]
  94. Abdoulaye, O.D.M.; Yao, B.K.; Ahmed, A.M.; Adouby, K.; Abro, D.M.K.; Drogui, P. Mineralogical and morphological characterization of a clay from Niger. J. Mater. Environ. Sci. 2019, 10, 582–589. [Google Scholar]
  95. Nguetnkam, J.P.; Kamga, R.; Villiéras, F.; Ekodeck, G.E.; Yvon, J. Altération différentielle du granite en zone tropicale. Exemple de deux séquences étudiées au Cameroun (Afrique Centrale). Comptes Rendus Géosci. 2008, 340, 451–461. [Google Scholar] [CrossRef]
  96. Miranda-Trevino, J.C.; Coles, C.A. Kaolinite properties, structure and influence of metal retention on pH. Appl. Clay Sci. 2003, 23, 133–139. [Google Scholar] [CrossRef]
  97. Msanya, B.; Munishi, J.; Amuri, N.; Semu, E.; Mhoro, L.; Malley, Z. Morphology, Genesis, Physico-chemical Properties, Classi-fication and Potential of Soils Derived from Volcanic Parent Materials in Selected Districts of Mbeya Region, Tanzania. Int. J. Plant Soil Sci. 2016, 10, 1–19. [Google Scholar] [CrossRef]
  98. Khawmee, K.; Suddhiprakarn, A.; Kheoruenromne, I.; Singh, B. Surface charge properties of kaolinite from Thai soils. Geoderma 2013, 192, 120–131. [Google Scholar] [CrossRef]
  99. Abaga, N.O.Z.; Nfoumou, V.; M’voubou, M. Influence of the parent rock nature on the mineralogical and geochemical composition of ferralsols used for sedentary agriculture in the Paleoproterozoic Franceville sub-basin (Gabon). Int. J. Biol. Chem. Sci. 2023, 17, 1778–1789. [Google Scholar] [CrossRef]
  100. Ofem, K.I.; John, K.; Ediene, V.F.; Kefas, P.K.; Ede, A.M.; Ezeaku, V.I.; Pawlett, M. Pedological data for the study of soils developed over a limestone bed in a humid tropical environment. Environ. Monit. Assess. 2023, 195, 628. [Google Scholar] [CrossRef]
  101. Anda, M.; Chittleborough, D.J.; Fitzpatrick, R.W. Assessing parent material uniformity of a red and black soil complex in the landscapes. Catena 2009, 78, 142–153. [Google Scholar] [CrossRef]
  102. Kabała, C.; Szerszeń, L. Profile distributions of lead, zinc, and copper in Dystric Cambisols developed from granite and gneiss of the Sudetes Mountains, Poland. Water Air Soil Pollut. 2002, 138, 307–317. [Google Scholar] [CrossRef]
  103. Teutsch, N.; Erel, Y.; Halicz, L.; Banin, A. Distribution of natural and anthropogenic lead in Mediterranean soils. Geochim. Cosmochim. Acta 2001, 65, 2853–2864. [Google Scholar] [CrossRef]
  104. Nieder, R.; Benbi, D.K.; Reichl, F.X.; Nieder, R.; Benbi, D.K.; Reichl, F.X. Role of potentially toxic elements in soils. Soil Compon. Hum. Health 2018, 3, 375–450. [Google Scholar]
  105. Zhang, J.; Wu, Y.; Xu, Y. Factors Affecting the Levels of Pb and Cd Heavy Metals in Contaminated Farmland Soils. In International Conference on Biological Engineering and Pharmacy; Atlantis Press: Dordrecht, The Netherlands, 2016. [Google Scholar] [CrossRef]
Figure 1. Map showing the geographic location of Tete Province and the district headquarters, Mozambique.
Soilsystems 09 00053 g001
Figure 2. Location of profile excavation sites, Mr. Carneiro Farm = Profile 1 (TSA-P01), SDAE = Profile 2 (TSA-P02), Mr. Jonas Farm = Profile 1 (ANGO-P01), and CITTA = Profile 2 (ANGO-P02).
Soilsystems 09 00053 g002
Figure 3. Soil profiles excavated at Ligowe (TSA-P01), Ntengo-Wambalame at SDAE (TSA-P02), amd Rinze (ANGO-P01) and Ulongue-CITTA (ANGO-P02) in Tsangano and Angonia Districts, respectively.
Soilsystems 09 00053 g003
Table 1. Key characteristics of the selected study sites in Tsangano and Angónia Districts, Mozambique.
DistrictTsanganoAngónia
VillageLigoweNtengo-WambalameRinzeUlónguè
LocationMr. M. Carneiro’s FarmSDAE farmMr. Jonas’ farmCITTA farm
AttributesDescription
Pedon symbol TSA-P01TSA-P02ANGO-P01ANGO-P02
Agro-Ecological Zone 10high rainfall zonehigh rainfall zonehigh rainfall zonehigh rainfall zone
Coordinates14°52′47″ S/34°21′30″ E14°50′ 25″ S/34°32′16″ E14°36′17″ S/34°18′0″ E14°45′17″ S/34°22′30″ E
Altitudes (m.a.s.l.)1427134012601200
Landformhillyplainhillyhilly
Geology/LithologyPrecambrian Meso- and Neoproterozoic geological eons dominated by
quartz–feldspathic gneiss and amphibolic gneiss
Precambrian Meso- and Neoproterozoic geological eons dominated by
quartz–feldspathic gneiss and amphibolic gneiss
Precambrian Meso- and Neoproterozoic geological eons dominated by basic rocks, migmatitic gneisses, and granulitesPrecambrian Meso- and Neoproterozoic geological eons dominated by basic rocks, migmatitic gneisses, and granulites
Slope gradient (%)162–51612
Land use/vegetationAgriculture but currently under grazing and fallow for 4 yearsAgriculture and area under maize, conservation strategy (matuto)Agriculture for maize, soybean, potatoes, and vegetablesAgriculture and area under fallow for 4 years
Natural vegetationVarious grassesEucalyptus, mangoes, sisal boundary, legume shrubs, vinegar grass, Mexican sunflower (Tithonia diversifolia)Mangoes, legumes, shrubsVarious grasses
Natural drainagewell to excessively well-drainedwell to moderately well-drainedwell-drainedwell-drained
FloodingNoneNoneNoneNone
Erosionwater, slight sheet (interill)water, slight sheet (interill)water, slight sheet (interill)water, slight sheet
Annual rainfall (mm)1000–12001000–1200800–1200800–1200
Soil moisture regime (SMR)usticaquicusticustic
Mean annual temperature (°C) 15–2015–2015–2215–22
Soil temperature regime (STR)thermicthermicthermicthermic
SDAE = District Service of Agriculture and Economic Activities, CITTA = Angónia Research Centre and Technologies Transfer. TSA-P01 = Tsangano pedon 1; TSA-P02 = Tsangano pedon 2; ANGO-P01 = Angonia pedon 1; ANGO-P02 = Angonia pedon 2.
Table 2. Classification of climatic, topographic, and soil physical and chemical parameters for land suitability assessment for Irish potato cultivation in Tsangano and Angónia Districts, Mozambique.
ParameterUnitS1S2S3NReference
Annual rainfallmm1000–1500800–1000 or 1500–2000700–800 or 2000–2600<700 or >2600[46,48,49,50]
Mean temperature °C9–1111–1515–18<8 or >18[46,48,49,50]
Slope %0–1213–1818–25>25[46,50]
Altitude m1500–25001200–1500 or 2500–32001000–1200<1000 or >3200[46,48]
Soil texture-L, SL, SiLSCL, CL, SiCLSC, CLoose sands or extreme heavy clays[46]
Effective soil depth cm>10075–10040–75<40[33,50]
Drainage-Well-drainedModerately drainedPoorly drainedVery poorly drained or waterlogged[33,50]
Electrical conductivity (EC) dS/m<22–44–6>6[33,46,49]
Exchangeable Sodium (ESP)%<66–1010–15>15[17,33]
Soil pH (H2O) -5.5–6.55–5.5 or 6.5–74.5–5 or 7–7.5<4.5 or >7.5[47,49]
Cation Exchange Capacity (CEC) cmol(+) kg130–5050–60/30–2060–70/20–10<10 or > 70[46,49]
Organic Carbon (OC) %2.9–5.82.9–1.21.45–0.58<0.58[46,47,49]
Total Nitrogen (TN) %>0.30.2–0.30.1–0.2<0.1[46,47,49]
Available Phosphorus (P)mg/dm320–4015–20/>4015–10<10[33,46,47,49]
Potassium (K)cmol(+) kg1>0.890.5–0.890.2–0.5<0.2[46]
Calcium (Ca)cmol(+) kg110–205–102–5<2[47,49]
Magnesium (Mg) cmol(+) kg13–81.5–30.5–1.5<0.5[49]
Base saturation (BS)%61–8040–6120–40<20[47]
Copper (Cu) mg/kg>0.20.1–0.20.05–0.1<0.05[47]
Manganese (Mn)mg/kg>1.10.5–1.10.3–0.5<0.3[33]
Iron (Fe)mg/kg>2.51.5–2.50.5–1.5<0.5[33]
Zinc (Zn)mg/kg>0.60.3–0.60.1–0.3<0.1[47]
Table 3. Morphological characteristics of studied pedons in Tsangano and Angonia Districts, Mozambique.
LocationPedonHorizonDepth (cm)Dry Color (1)Moist Color (2)Consistency (3)Structure (4)Cutans (5)Slickensides (6)Pores (7)Roots (8)Horizon Boundary (9)
LigoweTSA-P01Ap0–8b(7.5YR4/4)db(2.5YR3/3)sha, fi, ss&spw-m&c,sbk--cff-c&f-mc&w
Bt18–45r(5YR4/4)drb(5YR3/4)vha, fi, splw-m, m&c, sbkm-f, cs-cff-fg-d&s
Bt245–112yr(5Y4/6)drb(5YR3/4)vha, vfr, splm-m, sbkm-f, cs-cff-fg-d&s
Bt3112–155+yr(5YR5/8)yr(5 YR4/6)sha, vfr, splm,f&m, sbkm-f&m, cs-cfvf-fNA
Ntengo-wa-mbalameTSA-P02Ap0–21vdg(5YR3/1) bl(5YR2.5/1)ha, fr, splm&m, sbk--m-f&m, f-cm-f, c-m&f-cc&s
BA121–41bl(7.5YR2.5/1)bl(2.5YR2.5/1)eha, fr, vst&vplm,m&c, ab-sbk-mdsc-f&mc-f&fmc&s
BA2k41–75/91bl(2.5YR2.5/1)bl(5YR2.5/1)eha, fi, vst&vplm-s, m&c, ab-sbk-mdsc-f&mf-fc&w
BCgk79/91–155/165g(7.5YR6/1)lob(2.5Y5/4)vha, fi, vst&vplm,m&c, ab&sbk--f-f&mvf-fa&w
CRgk155/165–200w(5Y2/1)oy(2.5Y6/6)sha, fr, ns&npsg--m-f, c&mnNA
RinzeANGO-P01Ap0–25/30db(7.5YR3/4)db(7.5YR3/2)sha, vfr, ss&spw-f&m, sbk--m-f&mc-fc&w
Bt125/30–70b(7.5YR4/4)vdb(7.5YR2.5/3)sha, vfr, st&plm-m, sbkf-vf, c-m-f&mf-fd&s
Bt270–120r(2.5YR4/6)dr(2.5YR3/6)sha, vfr, st&pls-f&m, sbkm-f&m, cs-m-f&mf-vfd&s
Bt3120–181r(2.5YR4/8)r(2.5 YR4/6)ha, fi, st&pls-f&m, sbkm-vf, cs-m-f&mvf-vfNA
CITTAANGO-P02Ap0–29drb(5YR3/2)bl(5YR2.5/1)vha, vfr, ss&spm,m&c, sbk--f-m&m-fm-fc&s
BA29–50drb(5YR3/3)drb(5YR3/2)vha, fr, splm,m&c, sbk--m-f&c-mc-fc&s
Bt50–86/118drb(5YR3/4)drb(5YR3/3)vha, fr, splw-m&c, sbkm-f, cs-m-f&c-mf-fc&w
CR86/118–181sb(7.5YR5/8)sb(7.5 YR5/6)so, vfr, ns&npsg--m-f, m-m&cnNA
TSA-P01 = Tsangano profile 1; TSA-P02 = Tsangano profile 2; ANGO-P01 = Angonia profile 1; ANGO-P02 = Angonia profile 2. (1); (2) Soil color: g = gray; bl = black; b = brown; yr = yellowish red; sb = strong brown, db = dark brown; vdb = very dark brown; lob = light olive brown; oy = olive-yellow; drb = dark reddish brown, r = red, dr = dark red, vdg = very dark grey, w = white. (3) Consistency: sha = slightly hard; ha = hard; vha = very hard; eha = extremely hard; fr = friable; vfr = very friable; fi = firm; ns&np = non-sticky and non-plastic; ss&sp = slightly sticky and slightly plastic; st&pl = sticky and plastic, vst&vpl = very sticky and very plastic; spl = sightly plastic. (4) Structure: m,f&m = moderate, fine and medium; m&m = moderate medium; w-f&m = weak, fine and medium; m,m&c = moderate, medium and coarse; w-m&c = weak medium and coarse; w-m, m&c = weak to moderate, medium and coarse, sg = single grain; s-f&m = strong, fine and medium; m-s, m&c = moderate to strong medium and coarse; ab = angular; sbk = subangular blocky. (5) Cutans: m-f, cs = many fine clay sesquioxides; m-vf, cs = many very fine clay sesquioxides, m-f&m, cs = many fine and medium clay sesquioxides; f-vf, c = few very fine clays. (6) Slickensides: mds = many distinct slickensides. (7) Pores: m-f, m-m&c = many fine, and may medium and coarse; m-f&c-m = many fine and common medium; m-f&m = many fine and medium; m-f&m, f-c = many fine and medium, few coarse; cf = comon fine; m-f = many fine; f-m&m-f = few medium and many fine; m-f, c&m = many fine, coarse and medium, f-f&m = few fine and medium; c-f&m = common fine and medium. (8) Roots: f-c&f-m = few common and few medium; f-f = few fine; vf-f = very few fine; m-f, c-m&f-c = many fine, common medium and few coarse; c-f&fm = common fine and few medium, n = none; c-f = common fine; f-vf = few very fine; vf-vf = verry few very fine; m-f = many fine. (9) Horizon boundary: a&w = abrupt and wavy; c&w = clear and wavy; c&s = clear and smooth; g-d&s = gradual to difuse and smooth; d&s = diffuse and smooth; NA = not applicable.
Table 4. Selected physical properties of the studied pedons in Tsangano and Angonia Districts, Mozambique.
PedonHorizonDepth (cm)TextureSilt/Clay RatioBulk Density
(kg m−3)
Porosity (%)AWC (mm m−1)Penetration Resistance (MPa)
Clay %Silt %Sand %Texture Class
TSA-P01Ap0–8341056SCL0.291.5837.3184.91.75
Bt18–45421048SC0.231.5538.71110.51.64
Bt245–112581032C0.171.4737.03128.61.63
Bt3112–155+581032C0.17ndndnd1.56
TSA-P02Ap0–21361648SC0.440.7867.54132.11.68
BA121–41421444SC0.33ndndnd1.74
BA2k41–75/91581428C0.241.5434.84149.51.79
BCgk75/91–155/165661420C0.211.5836.82166.61.53
CRgk155/165–2008686S0.75ndndnd1.36
ANGO-P01Ap0–25/30381844SC0.471.4446.71101.01.67
Bt125/30–70621424C0.221.4141.82132.91.61
Bt270–12078148C0.171.3143.73182.61.58
Bt3120–18174188C0.24ndndnd1.50
ANGO-P02Ap0–29541432C0.251.2647.6994.71.28
BA29–50621424C0.221.3842.14156.01.67
Bt50–86/118641620C0.25ndndnd1.54
CR86/118–18116876SL0.51.2549.72173.41.18
TSA-P01 = Tsangano profile 1; TSA-P02 = Tsangano profile 2; ANGO-P01 = Angónia profile 1; ANGO-P02 = Angónia profile 2; S = Sandy; SCL = sandy clay loam; SL = sandy loam; SC = sandy clay; C = clay; nd = not determined, AWC = available water capacity.
Table 5. Some chemical properties of the studied pedons in Tsangano and Angonia Districts, Mozambique.
PedonHorizonDepth (cm)pHwaterpH CaCl2EC dS m−1Organic C (%)Total N (%)C/NAvail. P Mehlich-3
(mg kg−1)
TSA-P01Ap0–85.64.40.061.350.12 11.320.94
Bt18–455.54.10.031.090.1 10.915.54
Bt245–1126.04.90.020.60.07 8.614.18
Bt3112–155+6.45.20.020.530.06 8.813.37
TSA-P02Ap0–216.75.40.102.730.22 12.415.00
BA121–417.15.90.101.580.14 11.313.10
BA2k41–75/917.36.10.130.920.09 10.228.51
BCgk75/91–155/1657.96.60.280.550.06 9.217.83
CRgk155/165–2007.96.50.090.160.04 4.019.05
ANGO-P01Ap0–25/306.15.00.041.440.13 11.117.56
Bt125/30–706.24.60.010.980.09 10.914.18
Bt270–1206.64.90.010.570.07 8.114.05
Bt3120–1816.45.10.010.530.06 8.815.67
ANGO-P02Ap0–295.74.70.031.540.13 11.814.59
BA29–506.04.70.020.860.09 9.614.32
Bt50–86/1186.15.00.030.820.08 10.314.32
CR86/118–1815.95.10.050.620.03 0.714.86
TSA-P01 = Tsangano pedon 1; TSA-P02 = Tsangano pedon 2; ANGO-P01 = Angónia pedon 1; ANGO-P02 = Angónia pedon 2; chemical properties: OC = organic carbon; TN = total nitrogen; C/N = carbon: nitrogen ratio; Avail. P Mehlich-3 = Mehlich-3 phosphorus; EC = electrical conductivity; Rating: Soilsystems 09 00053 i001 = very low, Soilsystems 09 00053 i002 = low, Soilsystems 09 00053 i003 = moderate.
Table 7. Selected extractable micronutrient contents of the studied pedons of Tsangano and Angónia sites, Mozambique.
PedonsHorizonDepth (cm)Micronutrients (mg kg−1)
FeZnMnCu
TSA-P01Ap0–86.24 0.154 3.194 1.649
Bt18–454.28 0.103 3.108 1.965
Bt245–1123.44 0.038 2.978 1.569
Bt3112–155+3.48 0.023 2.863 1.316
TSA-P02Ap0–2110.960.202 3.144 2.098
BA121–416.32 0.065 3.173 1.930
BA2k41–75/913.84 0.091 2.007 1.836
BCgk75/91–155/1654.52 0.058 2.691 1.593
CRgk155/165–2001.88 0.035 1.446 1.403
ANGO-P01Ap0–25/308.40 0.383 3.223 1.548
Bt125/30–704.44 0.058 3.144 1.204
Bt270–1202.88 0.023 2.763 1.148
Bt3120–1813.56 0.083 3.050 1.068
ANGO-P02Ap0–294.72 0.096 2.957 1.262
BA29–503.44 0.048 2.367 1.187
Bt50–86/1183.00 0.065 2.317 0.981
CR86/118–1814.40 0.098 3.072 0.981
TSA-P01 = Tsangano pedon 1; TSA-P02 = Tsangano pedon 2; ANGO-P01 = Angónia pedon 1; ANGO-P02 = Angónia pedon 2. Rating: Soilsystems 09 00053 i009 = low, Soilsystems 09 00053 i010 = high.
Table 8. Total elemental composition and weathering indices in the studied pedons of Tsangano and Angónia sites, Mozambique.
ProfileHorizonDepth (cm) Total Elemental Composition % Weathering Indices
L.O.I.SiO2Al2O3Fe2O3MgOP2O5CaOTiO2SO3K2OTotalSiO2/Al2O3SiO2/(Al2O3 + Fe2O3)
TSA-P01Ap0–89.3954.6024.138.440.370.680.430.660.370.3399.42.261.68
Bt245–11210.1645.9627.5510.491.681.060.320.840.500.3798.931.671.21
Bt3112–155+10.1546.6726.3610.592.781.310.250.850.440.3599.751.771.26
TSA-P02Ap0–2115.8440.7829.675.412.561.731.370.751.090.5299.721.371.16
BA2k41–75/9114.3140.5331.26.491.631.111.020.861.280.799.131.301.08
CRgk155/165–2003.1769.1216.261.151.230.985.860.090.770.0998.724.253.97
ANGO-P01Ap0–25/309.6946.1225.4410.690.873.760.491.210.560.9499.771.811.28
Bt270–12014.6339.4027.9813.760.650.570.271.080.300.4499.081.410.94
Bt3120–18114.2841.1126.513.951.310.540.271.130.350.4399.871.551.02
ANGO-P02Ap0–2914.9538.5026.6812.481.382.970.421.040.70.599.621.440.98
Bt50–186/11814.2140.7025.6412.951.032.770.310.920.520.4399.481.591.05
CR86/118–1817.6255.1621.9610.230.660.660.680.590.651.1399.342.511.71
Tsangano pedon 1 = TSA-P01; Tsangano pedon 2 = TSA-P02; Angónia pedon 1 = ANGO-P01; Angónia pedon 2 = ANGO-P02; L.O.I. = Loss on Ignition.
Table 9. Abundances of barium (Ba), zirconium (Zr), strontium (Sr), and lead (Pb) in the studied pedons of Tsangano and Angonia Sites, Mozambique.
ProfileHorizonDepthBaZrSrPb
mg dm−3
TSA-P01Ap0–820920691129
Bt245–11223714167443
Bt3112–155+1901515639
TSA-P02Ap0–2138025824762
BA2k41–75/9157935829551
CRgk155/165–200189534241
ANGO-P01Ap0–25/30107578338985
Bt270–12060029516466
Bt3120–18153537015822
ANGO-P02Ap0–29761105632832
Bt50–186/11867765028433
CR86/118–181101144857350
TSA-P01 = Tsangano pedon 1; TSA-P02 = Tsangano pedon 2; ANGO-P01 = Angónia pedon 1; ANGO-P02 = Angónia profilepedon 2; Ba = barium; Zr = zirconium; Sr = strontium; Pb = lead.
Table 10. Summary of morphological and diagnostic features of the studied pedons in Tsangano and Angónia Districts, in Mozambique, and classification according to USDA Soil Taxonomy [19].
PedonDiagnostic HorizonsOther Diagnostic FeaturesOrderSuborderGreat GroupSub-GroupFamily
TSA-P01Ochric epipedon; argillic subsurface horizon Moderately steep, very deep, highly weathered clayey subsoil, ustic SMR, medium acid to slightly acid, thermic STR, mixed to dominantly kaolinitic, many clay + sesquioxide cutansUltisolsUstultsHaplustultsTypic HaplustultsModerately steep, very deep, clayey, medium acid to slightly acid, mixed to dominantly kaolinitic, thermic, Typic Haplustults
TSA-P02Ochric epipedon.
Calcic horizon in the subsoil (strongly effervescent)
Almost flat to gently sloping mbuga (slope about 3%), very deep, black clayey soil (heavy clay), ustic SMR, mildly alkaline, thermic STR, presence of deep, wide cracks, wedge-shaped and extremely hard prismatic aggregates, many distinct slickensides, presence of gilgai micro-reliefVertisolsUstertsCalciustertsTypic CalciustertsAlmost flat to gently sloping, very deep, clayey,
mildly alkaline, mixed to dominantly montimorrilonitic; thermic, Typic Calciusterts
ANGO-P01Mollic epipedon; argillic subsurface horizon Moderately steep, very deep, highly weathered clayey subsoil, ustic SMR, slightly acidic, thermic STR, mixed to dominantly kaolinitic, many clay + sesquioxide cutansUltisolsUstultsPaleustultsTypic PaleustultsModerately steep, very deep, clayey, slightly acid, mixed to dominantly kaolinitic, thermic, Typic Paleustults
ANGO-P02Umbric epipedon; argillic subsurface Strongly sloping, very deep, highly weathered clayey subsoil, ustic SMR, medium acid, thermic STR, mixed to dominantly kaolinitic, many clay + sesquioxide cutansAlfisolsUstalfsHaplustalfsUltic HaplustalfsStrongly sloping, very deep, clayey, medium acid, mixed to dominantly kaolinitic, thermic, Ultic Haplustalfs
TSA-P01 = Tsangano pedon 1; TSA-P02 = Tsangano pedon 2; ANGO-P01 = Angónia pedon 1; ANGO-P02 = Angónia pedon 2.
Table 11. Diagnostics horizons and classification of the studied pedons in Tsangano and Angónia Districts, Mozambique, according to WRB for soil resources [20].
PedonDiagnostic Horizons, Properties, and MaterialsReference Soil Group (RSG)—TIER-1Principal QualifiersSupplementary QualifiersWRB Soil Name—TIER-2
TSA-P01Ochric horizon; argic horizon with CEC of ≥24 cmol(+) kg−1 and low BS of <50%)AcrisolsHaplic Clayic, Cutanic, Hyperdystric, Humic, ProfondicHaplic Acrisols (Clayic, Cutanic, Hyperdystric, Humic, Profondic)
TSA-P02Vertic horizon, ≥30% clay between the soil surface and
the vertic horizon, shrink–swell cracks, gilgai
microrelief
VertisolsCalcic, PellicCalcaric, Hypereutric, Gilgaic, Mazic, HumicPellic Calcic Vertisols (Calcaric, Hypereutric, Gilgaic, Mazic, Humic)
ANGO-P01Mollic horizon; argic horizon with CEC of greater part of argic ≥ 24 cmol(+) kg−1 and low BS < 50%)AlisolsAbruptic, ChromicClayic, Cutanic, Hyperdystric, Humic, ProfondicChromic Abruptic Alisols (Clayic, Cutanic, Hyperdystric, Humic, Profondic)
ANGO-P02Mollic horizon; argic horizon with CEC of argic ≥ 24 cmol(+) kg−1 and high BS ≥ 50%)LuvisolsChromicClayic, Cutanic, Humic, ProfondicChromic Luvisols (Clayic, Cutanic, Humic, Profondic)
TSA-P01 = Tsangano pedon 1; TSA-P02 = Tsangano pedon 2; ANGO-P01 = Angónia pedon 1; ANGO-P02 = Angónia pedon 2.
Table 12. Suitability assessment based on ecological requirement of Irish potato and actual field conditions of the studied pedons in Tsangano and Angónia Districts, Mozambique.
Land QualityDiagnostic FactorRequired Range (S1)Actual Field RangeRating
TSA-P01TSA-P02ANGO-P01ANGO-P02TSA-P01TSA-P02ANGO-P01ANGO-P02
Climate (c)Annual rainfall1000–15001000–12001000–1200800–1200800–1200S1S1S2S2
Temperature9–1115–2015–2015–2215–22S3S3S3S3
Topography (t)Slope (%)0–121651612S2S1S2S1
Elevation1500–25001427134012601200S2S2S2S3
Soil physical property (s)Soil textureL, SL, SiLC, SC, SCLC, SCC, SCC, SLS2S3S3S2
Effective depth>40 cm>181 cm>181 cm>151 cm>200 cmS1S1S1S1
Soil drainageWell-drainedWell-drainedWell-drainedWell to excessively well-drainedWell to moderately well-drainedS1S1S1S1
Soil toxicity (n)EC (dSm−1)<2.00.02–0.060.09–0.280.01–0.040.02–0.05S1S1S1S1
ESP<60.37–0.550.65–1.300.47–0.590.38–0.48S1S1S1S1
Soil fertility (f)Soil pH water5.5–6.55.5–6.46.7–7.96.1–6.45.9–6.1S1S2S1S1
(CEC cmol(+) kg−1)30–5010.15–10.8510.06–10.8110.1–10.7210.1–10.8S3S3S3S3
OC (%)2.9–5.80.53–1.350.16–2.730.53–1.440.62–1.54S3S2S3S3
TN (%)> 0.30.06–0.120 04–0.220 06–0.130 03- 0.3S3S3S3S3
Avail. P mg dm−320–4013.3–20.913.1–28.514.0–17.5614.31–14.86S2S2S3S3
K (cmol(+) kg−1)>0.890.12–0.40.13–1.190.22–0.530.08–0.12S2S1S2S3
Ca (cmol(+) kg−1)10–200.65–1.191.5–13.181.51–2.22.37–4.01S3S1S3S2
Mg (cmol(+) kg−1)3–80.98–1.660.64–3.081.91–2.660.2–3.08S3S2S2S2
BS (%)61–8019.3–30.023.2–153,734.6–51.830.7–66.9S3S1S2S2
Cu (mg kg−1)>0.21.31–1.961.40–2.091.06–1.540.98–1.26S1S1S1S1
Mn (mg kg−1)>1.12.86–3.191.44–3.142.76–3.222.31–3.07S1S1S1S1
Fe (mg kg−1)>2.53.44–6.241.88–10.962.88–8.403.00–4.72S1S1S1S1
Zn (mg kg−1)>0.60.02–0.150.03–0.200.05–0.380.04–0.09S3S3S3S3
Overall suitability class (OSC)S3f(ct)S3f(cs)S3f(cts)S3f(ct)
Note: The rating ranges for each suitability criterion (S1, S2, S3, and N) were defined based on the agronomic requirements of the potato crop and adapted from relevant references. A detailed description of the evaluated parameters, their suitability classes, and corresponding values is provided in the Methods section. TSA-P01 = Tsangano pedon 1; TSA-P02 = Tsangano pedon 2; ANGO-P01 = Angónia pedon 1; ANGO-P02 = Angónia pedon 2; Zn = zinc; Fe = iron; Mn = manganese; Cu = copper; Ca = calcium; Mg = magnesium; K = potassium; OC = organic carbon; TN = total nitrogen; P = phosphorus, EC = electrical conductivity. Suitability classes: S1 = highly suitable; S2 = moderately suitable; S3 = marginally suitable.
Disclaimer/Publisher’s Note: The statements, opinions and data contained in all publications are solely those of the individual author(s) and contributor(s) and not of MDPI and/or the editor(s). MDPI and/or the editor(s) disclaim responsibility for any injury to people or property resulting from any ideas, methods, instructions or products referred to in the content.

