Article

Blending Potassium Rocks with KCl Fertilizer to Enhance Crop Biomass and Reduce K Leaching in Sandy Soil

by
Cristiane Prezotto Silveira
,
Johnny Rodrigues Soares
,
Rafael Marangoni Montes
,
Julia Savieto
and
Rafael Otto
*
Soil Science Department, Luiz de Queiroz College of Agriculture, University of Sao Paulo, Av. Padua Dias, 11, Piracicaba 13418-900, SP, Brazil
*
Author to whom correspondence should be addressed.
Soil Syst. 2025, 9(3), 83; https://doi.org/10.3390/soilsystems9030083
Submission received: 23 May 2025 / Revised: 15 July 2025 / Accepted: 21 July 2025 / Published: 23 July 2025
(This article belongs to the Special Issue Soil Fertility Evaluation and Precision Fertilization)

Abstract

Combining potassium-containing rocks with conventional KCl may improve the agronomic use of K rock and reduce leaching from high-soluble sources. The aim of this study was to evaluate K rocks (phonolite and alkaline) and the mixture with KCl at different K rates on the biomass production of maize and rice (residual effect), K uptake, and K leaching. The experiment was conducted in greenhouse columns with sandy soil. The experimental design included four K sources: PR (phonolite rock), PR + KCl in an 86:14 mass ratio, AR (alkaline rock), and KCl; three K rates (100, 200, and 400 mg kg−1); and a control (no K), with five replicates. PR + KCl resulted in similar maize biomass (120 g column−1) and K uptake (18 mg g−1) compared to KCl, and it was higher than the PR, the AR, and the control, which produced 86, 48, and 32 g column−1, respectively. The residual effect of PR, PR + KCl, and KCl generated similar rice biomass. K leaching reached 15% of K applied with KCl and was reduced by 50% with K rocks. Thus, the mixture of PR + KCl can improve K fertilization compared to KCl, enhancing maize and rice biomass while reducing K leaching.

1. Introduction

Potassium (K) represents 2.1% to 2.3% of the Earth’s crust and is the seventh most abundant element. K is the first or second nutrient most required for cultivated crops [1]. However, the large arable areas used in agriculture have low K levels [2]. This occurs more frequently in sandy, acidic, and highly weathered soils [3]. Most soils in Brazil are classified as Oxisols, which are generally well drained, acidic, and have a low cation exchange capacity and exchangeable K content (<1.5 mmolc dm−3). Oxisols, therefore, require a high amount of K application and carry risks of K leaching.
Brazil is one of the largest agricultural producers worldwide, but 80% of its fertilizer is imported from international markets [4]. Recently, fertilizer prices have been markedly higher due to the COVID-19 pandemic, the Russia–Ukraine war, high gas prices in Europe, and Chinese sanctions on, for example, potash production in Belarus [5]. Russia and Belarus account for 41% of global potash production. Fertilizer prices have increased, from USD 300 to USD 1200 per ton, which has in turn increased food prices [5]. Alternative K fertilizers composed of native rock materials may present the opportunity to reduce Brazil’s dependency on the international market.
Crops demand high amounts of K, with K fertilization usually applied two times during plant development to reduce losses in the soil–plant system and avoid the saline stress of conventional K fertilizers, such as KCl. For example, in Brazil, the farmer guidance for the K fertilization of maize (Zea mays L.) and upland or paddy rice (Oryza sativa L.) is to apply no more than 50–80 kg ha−1 of K2O at sowing for a K rate higher than 120–140 kg ha−1 [6]. K leaching below a 1 m soil depth can be significant, reaching 16% of total K in clay loam and 52% in sandy soils, as reported in a maize–soybean rotation system with potassium fertilizer applied up to 150 kg ha−1 [7].
Several rock materials have been tested as alternative K sources, such as feldspars, nepheline, micas, gneiss, glauconite, and others. Some materials have yielded promising results, while others have shown no agronomic benefits [8]. The most common K rock source used is alkaline feldspars, which contain approximately 11% K. Alkaline feldspar is highly resistant to the weathering process and then is not promptly released to plants. Studies have reported similar or even higher crop yields from K rock materials or the mixture of K rock and conventional fertilizers compared to KCl or K2SO4 sources [9,10,11,12,13,14]. On the other hand, some studies have reported lower yields from K rock or the mixture of K sources compared to conventional KCl, with a relative efficiency ranging from 27% to 64% compared to KCl [9,15,16,17].
The dissolution of K rock materials applied to soils can be mediated via soil pH, organic acids from plant roots, microorganisms, and soil organic matter [8,18,19,20]. The use of K rock combined with conventional fertilizers can supply soluble and slow-release K. In a study on phonolite combined with KCl (30% KCl + 70% phonolite) in palisadegrass biomass, the phonolite had a relative efficiency of 29%, whereas the mixture of KCl with phonolite presented 63% efficiency [15]. Thus, different K rock sources achieve different efficiencies, depending on the material and interaction with the soil type.
K rock sources offer an alternative for K fertilization, but they must maintain a high crop yield and K fertilization efficiency and avoid K leaching. The mixture of K rock materials with conventional KCl can be advantageous, combining a soluble K source with slow release; however, few studies have been conducted. To our knowledge, this is the first study evaluating a blended K fertilizer (K rock + K soluble) with a low amount of synthetic fertilizer (14%). The aim of this study was to evaluate K-containing rocks and the mixture with KCl at different K rates on biomass production of maize and rice (residual effect), K uptake, and K leaching compared to KCl. The following hypotheses are proposed: (i) phonolite (feldspar with different composition) achieves a higher efficiency than common feldspar alkaline rock for biomass production; (ii) K rock sources have lower efficiency than conventional KCl, requiring a higher K rate; (iii) blending K rocks with KCl (86:14 mass ratio) results in similar biomass productions compared to KCl; (iv) K rock sources and mixture with KCl have a higher residual effect for subsequent crops than KCl alone; and (v) K rock sources and the mixture with KCl reduce K leaching compared to KCl alone.

2. Materials and Methods

2.1. Greenhouse Column Experiment

The experiment was conducted in a greenhouse at the Luiz de Queiroz College of Agriculture (ESALQ/USP). The greenhouse has natural sunlight incidence, forced-air ventilation, and an evaporative cooling pad system. The air temperature during the experiment varied between 19 °C and 39 °C (minimum and maximum means), and the relative humidity was between 21% and 64% (Supplemental Figure S1). The soil was sampled from 0–20 cm and 20–40 cm depths of a Latossolo Vermelho-Amarelo (Brazilian classification) [21], corresponding to a Typic Hapludox [22], with sandy loam texture. The soil sample was air-dried and analyzed for chemical and physical properties (Table 1). The soil had low content of available K [6,7]. Lime was applied to the soil samples to increase the base saturation to 70% and the soil pH-CaCl2 to 6.0, which is the regional recommendation [6]. A PVC column of 45 cm in height and 15 cm in diameter was used for plant growth, and it contained 9 kg of soil (4.5 kg of each soil layer).
The experiment consisted of a factorial design with four K sources (PR—phonolite, PR + KCl, KCl, and AR—alkaline rock), three K rates (100, 200, and 400 mg kg−1), and one additional treatment (control) with five replicates in a completely randomized design, totaling 65 columns. The K sources were applied to maize, and their residual effects were evaluated using rice. The K rates of 100, 200, and 400 mg kg−1 correspond to 50, 100, and 200 kg ha−1 of K2O (0–20 cm depth), considering that K fertilizer is applied in a band that represents around 15–20 cm of crop rows spaced 45–90 cm in a field. The K rocks and PR + KCl were produced by Yoorin Fertilizantes® (Poços de Caldas, Brazil) and are commercially available. PR and AR were alkaline feldspar of volcanic origin but with different compositions and formation processes. The K rocks were from Poços de Caldas, MG, Brazil. The PR was obtained by milling a phonolite rock, and the AR was derived from milled alkaline K-silicate rocks. The PR + KCl consisted of 86% PR and 14% KCl (86:14 mass ratio), yielding a granulated fertilizer with 54% K2O from KCl and 46% from PR. KCl is the conventional K fertilizer, and it contains 60% K2O.
The K sources materials were analyzed for K2O content and solubility (total, citric acid, and water), following procedures [25] in which the soluble source KCl has 100% of the K content available for plant uptake (Table 2). The K soluble in water was extracted from fertilizer (2.5 g) with water (210 mL) + ammonium oxalate 40 g L−1 (40 mL). The K soluble in citric acid 2% was extracted from fertilizer (1 g) with C6H8O7 0.02 g L−1 (100 mL). The total K content was extracted from fertilizer (1 g) with HClO4 (5 mL) and HF (5 mL). The K content in each extractant was determined via photometry [25]. The K rates were applied based on the total K content of the fertilizers.
For plant cultivation, the nutrients N, P, S, B, Mn, Zn, Mo, and Cu were applied at rates of 150, 200, 50, 1.05, 3, 5, 0.1, and 1.5 mg kg−1 following the soil analyses [26]. Before the columns were filled with soil, the sources of K, P (ammonium monophosphate), and S (gypsum) were homogeneously mixed in the soil corresponding at the 0–20 cm soil layer. The N and micronutrients were applied as a solution on the soil surface after sowing, and they were reapplied at the same rate 15 days after plant emergence.
Maize (cultivar MG545 PW) was grown for 60 days after emergence (R1: silking stage) at a density of two plants per column, corresponding to a distance of around 10 cm between plants and a plant density higher than the field, considering a recommended sowing density of four seeds per meter [27]. Upland rice (cultivar IAC 202) was sown after the maize harvest and grown for 60 days (R0: panicle initiation stage) at a density of four plants per column. All plant nutrients, with the exception of potassium, were applied at the same rate for both rice and maize cultivation in order to evaluate the residual effect of K sources. Rice cultivation was also used to evaluate the release of K from K rock materials over a longer period of time.
Soil moisture was maintained at nearly 70% of its maximum water retention capacity during plant growth (1800 mL in 9 kg soil). Water loss (evapotranspiration) was replaced daily with weighting plots, and a simulation of 25 mm of rainfall was conducted weekly, corresponding to 442 mL per column. The volume leached was collected after the simulated precipitation events using flasks connected with plastic tubes below the columns. The flasks were replaced weekly.

2.2. Biomass, Nutrient Uptake, Soil K Content, and Leaching Analyses

The plant height, tillering, and the chlorophyll index were evaluated at 15, 30, 45, and 60 days after emergence. The plant height was measured in maize plants from the soil surface up to the tallest leaf node. The number of tillers per column was counted in rice cultivation.
The chlorophyll index was measured via soil–plant analysis development (SPAD), which captures the relative chlorophyll content using a chlorophyll meter (SPAD-502 Konica Minolta, Singapore). The values usually ranged between 20 and 50, with higher values meaning greener and lower plant stress. The chlorophyll meter was calibrated before measurements by holding the measurement head of the equipment with no sample. The measurements were performed at the central part of the first or second totally developed leaf, avoiding the veins. The chlorophyll index of each plot corresponded to the average of three measurements in two plants of maize and rice, for a total of six reads per pot.
The biomass production of maize and rice was evaluated 60 days after emergence. The plants were cut close to the soil surface, and 1 cm aboveground biomass was weighed after being oven-dried at 65 °C for 72 h. The relative efficiency (RE%) of K sources (BKsource) compared to KCl (BKCl) on biomass production was calculated with the following equation: RE% = Biomass(Ksource)/Biomass(KCl) × 100. The dry biomass was ground in a Willey mill, and K content was analyzed using nitric–perchloric acid digestion and flame photometry [28]. K uptake was calculated with a consideration of the total biomass production and K content.
The K, Ca, and Mg leached were evaluated weekly after the simulated rainfall. The amount of water leached per column was on average 140 ± 50 mL, which was collected in 18 events during the 126 days of the experiment. After the leachate was filtered to avoid contamination with soil particles and organic matter, the K content in the leachate was determined through flame photometry (Micronal B262, São Paulo, Brazil), and Ca and Mg were determined using atomic absorption spectroscopy (Varian AA 24 CPS, Burladingen, Germany) [23]. The accumulated K, Ca, and Mg that had leached were calculated for the period of maize and rice growth.
The soil-exchangeable K content was evaluated after rice harvest at soil depths of 0–20 and 20–40 cm. The soil of each layer was removed from the columns and homogenized, and a soil sample was collected. Soil K was extracted with Mehlich solution and determined using flame photometry (Micronal B262) [23].
The data were analyzed in a factorial design with an additional treatment; the treatment means were compared via two-way ANOVA (p < 0.05) using the Tukey test (p < 0.05) for K sources and linear regression (p < 0.05) for the K rate. The comparisons were analyzed for each K rate or each source when the interaction between K source and K rate was significant. The treatments were also compared with orthogonal contrasts (p < 0.05) for specific effects, such as the difference between each K source and the control plot. Statistical analyses were performed using the R software, version 4.2.3 [29], with the ExpDes [30] and gmodels [31] R packages, and the graphics were plotted in Sigmaplot, version 12.5 [32].

3. Results

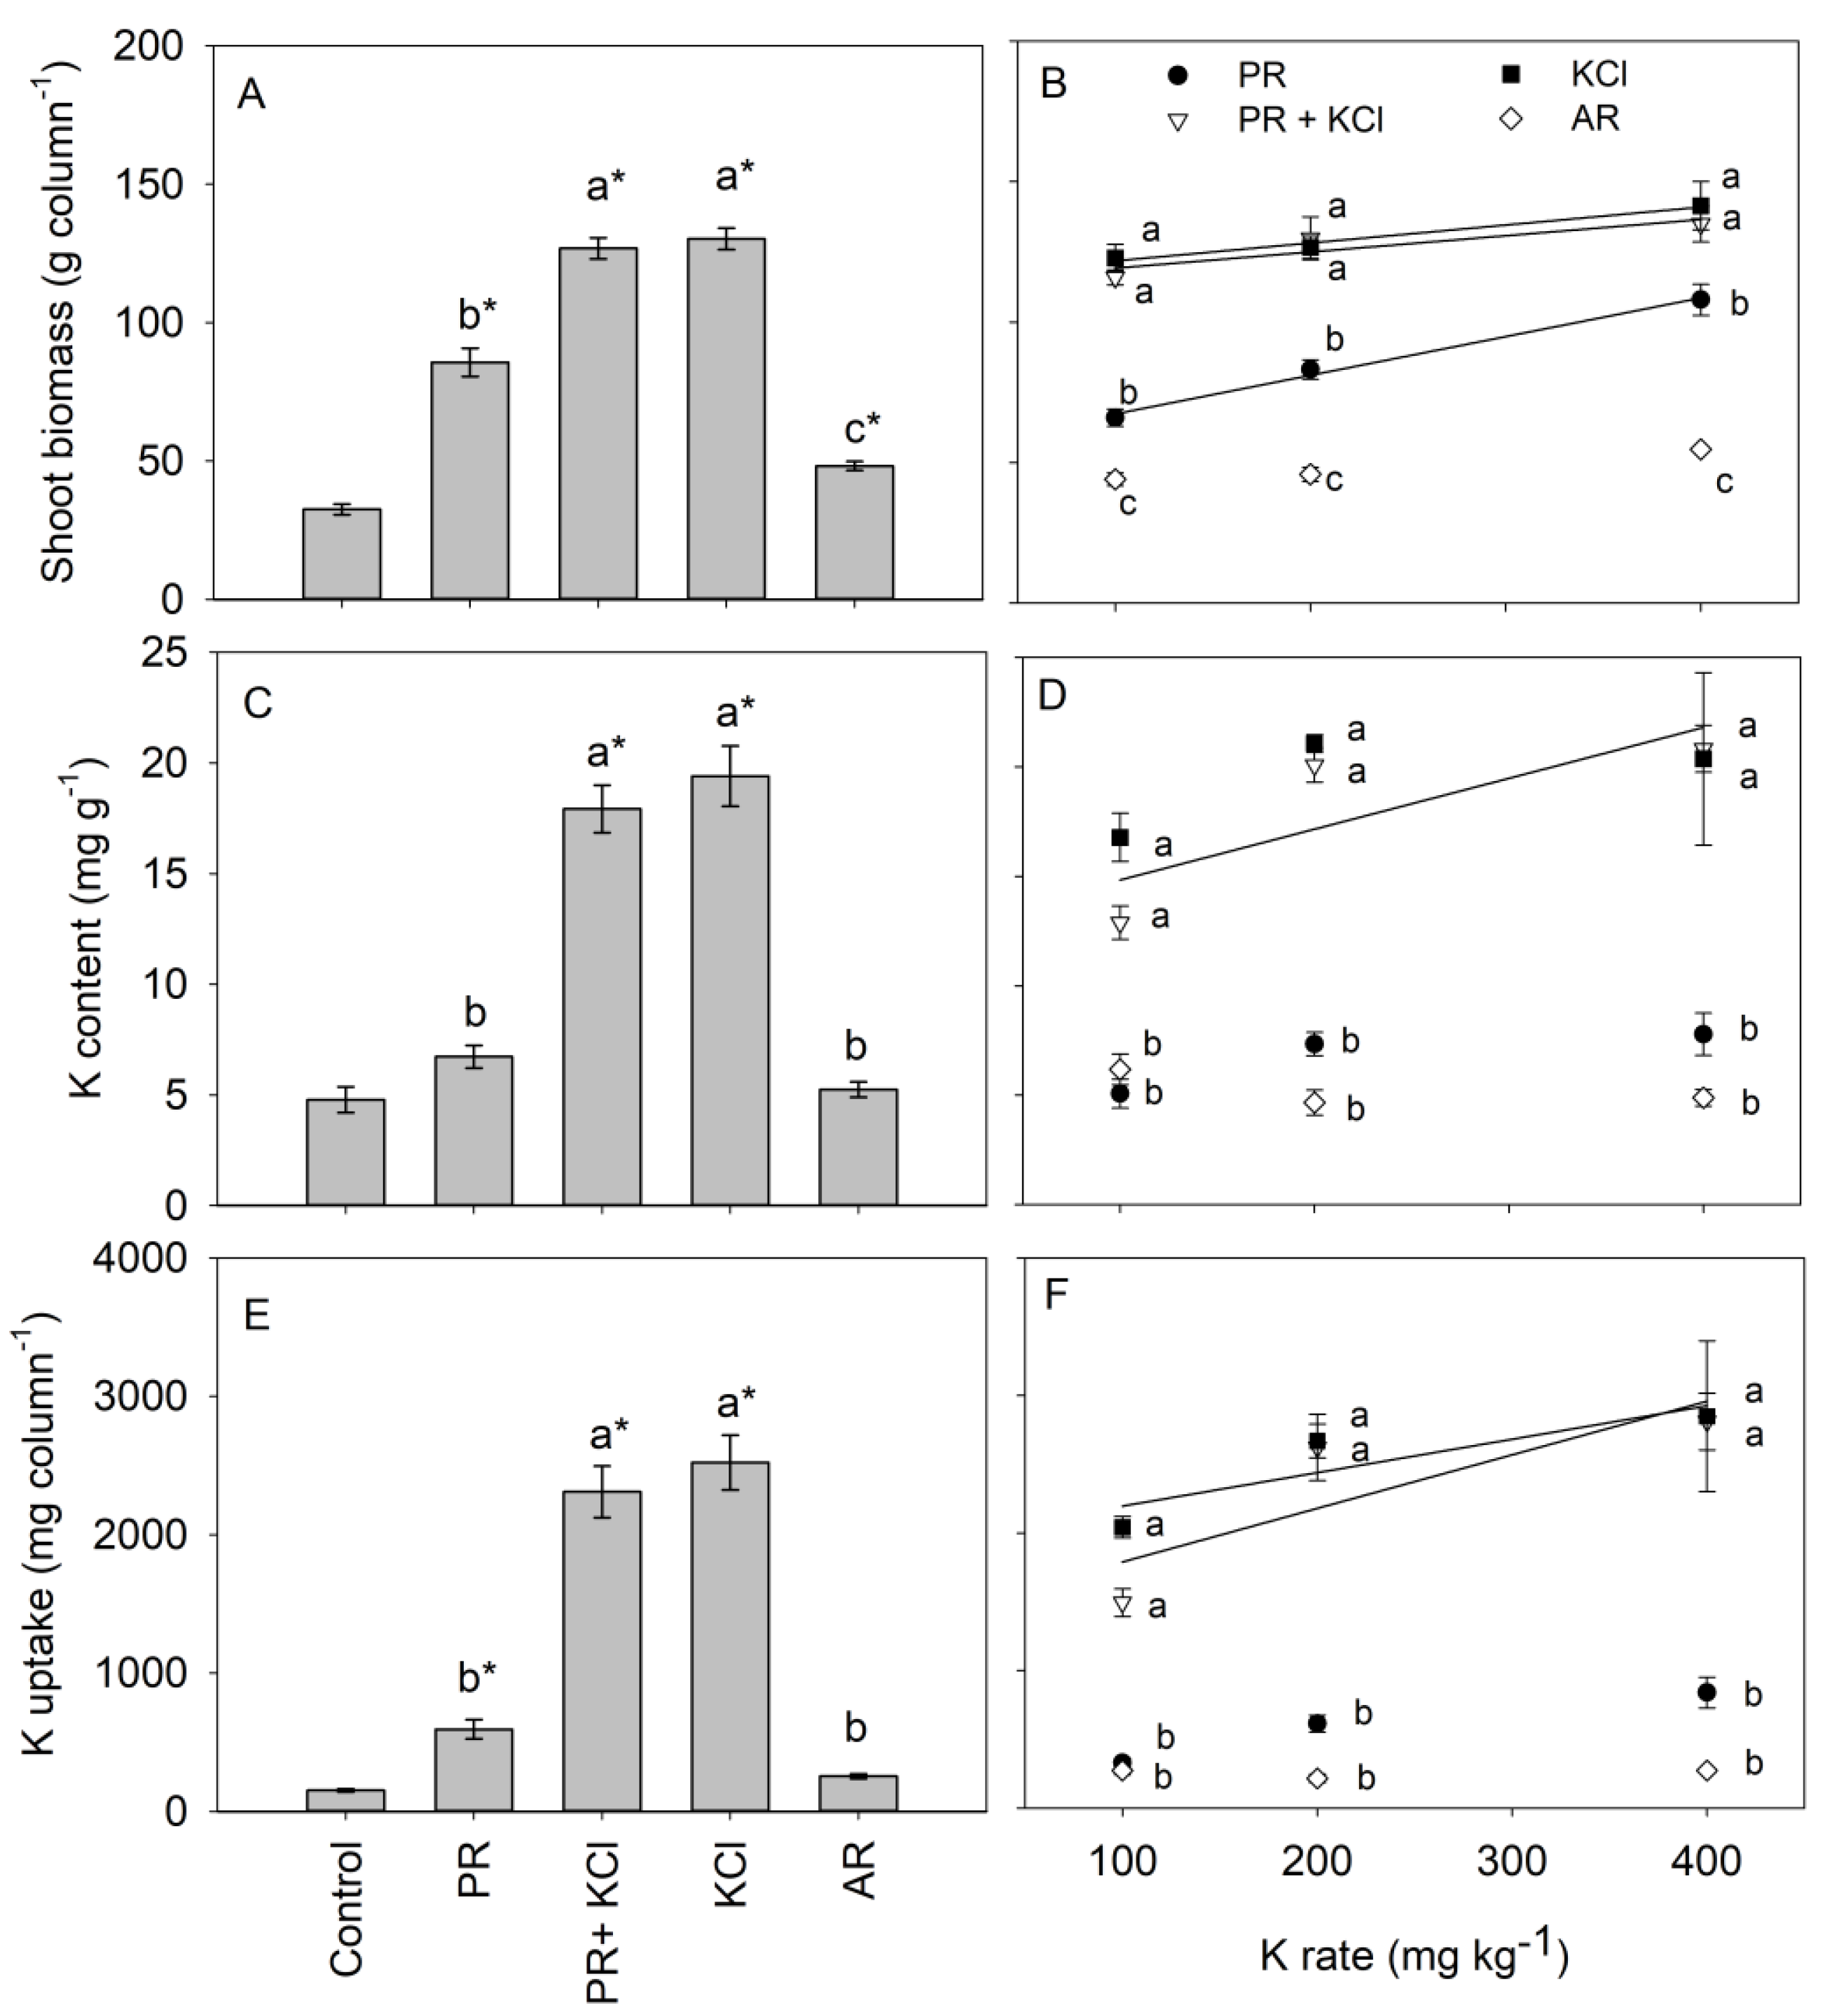
3.1. Maize Biomass and K Uptake

The chlorophyll index in maize was influenced by K sources in the evaluation periods, with the highest values at 30 days and the lowest at 60 days after emergence (Supplemental Table S1). At 15 and 30 days, the K sources had a higher chlorophyll index than the control plots; at 45 days, PR had a higher chlorophyll index than the control (40.1 and 36.9, respectively); and at 60 days, KCl and PR + KCl had a lower chlorophyll index than the control. In general, KCl and PR + KCl presented a higher chlorophyll index compared to PR and AR, except at 60 days, when the values were lower. The chlorophyll index underwent a linear decrease according to the K rate (100 to 400 mg kg−1) at 45 and 60 days, and it was not significant at 15 or 30 days (Supplemental Table S1).
The K sources evaluated increased the height of maize plants in the present study (Supplemental Table S1). At 15 and 30 days after emergence, all sources resulted in a higher maize height than control plots. At 45 and 60 days, AR was the only source that did not differ from the control plots (Supplemental Table S1). The KCl and PR + KCl plots had higher heights compared to the other K sources; for example, at 60 days, these sources resulted in heights of around 120 cm, compared to 98 cm for PR, 58.7 cm for AR, and 48.8 cm for the control plots. Increasing the K rate from 100 to 400 mg kg−1 showed a linear increase in maize height at 15 days, and increased from 33.8 to 36.2 cm at 30 days (Supplemental Table S1).
The biomass production of maize increased with all K sources compared to the control treatment, which presented K deficiency symptoms affecting plant growth and biomass production (Figure 1A). The KCl and PR + KCl treatments resulted in biomass productions of approximately 120 g column−1, which were higher than other treatments and corresponded to an increase of 400% compared to control plots. The biomass production was equivalent to 3.6 Mg ha−1 at a plant density of 60,000 plants ha−1 in the field. The PR source generated higher biomass production than the AR source, corresponding to 86 g column−1 and 48 g column−1, respectively, representing 72% and 40% of biomass production with KCl, while biomass production from the control plot was 32 g column−1 (Figure 1A).
The K contents of the maize biomass were 19 mg g−1 and 18 mg g−1 for KCl and PR + KCl, respectively, and they were higher than for other K sources and control plots; PR and AR did not differ from the controls and had a K content of 5–7 mg g−1 (Figure 1C). The K uptake had a similar response, with higher values for KCl and PR + KCl sources, reaching a total accumulated K of 2300–2500 mg column−1 in the biomass; PR had a higher K uptake of 594 mg column−1 than control plots, at 155 mg column−1. The K content in the AR source did not differ from the control (Figure 1E).
In general, the biomass, K content, and K uptake were higher in PR + KCl and KCl than in other sources in the K rates evaluated (Figure 1). Increasing the K rate from 100 to 400 mg kg−1 increased maize biomass in PR, PR + KCl, and KCl but not in AR (Figure 1B and Table S3). PR + KCl produced a linear effect of K rate application on the K content in biomass, while the K rate had no effect on the other K sources (Figure 1D and Supplemental Table S3). The K uptake in PR + KCl increased from 1494 mg column−1 to 2810 mg column−1 at a K rate of 100–400 mg kg−1; and in KCl, it increased from 2042 mg column−1 to 2849 mg column−1 at the K rate of 100–400 mg kg−1 (Figure 1F and Table S3).

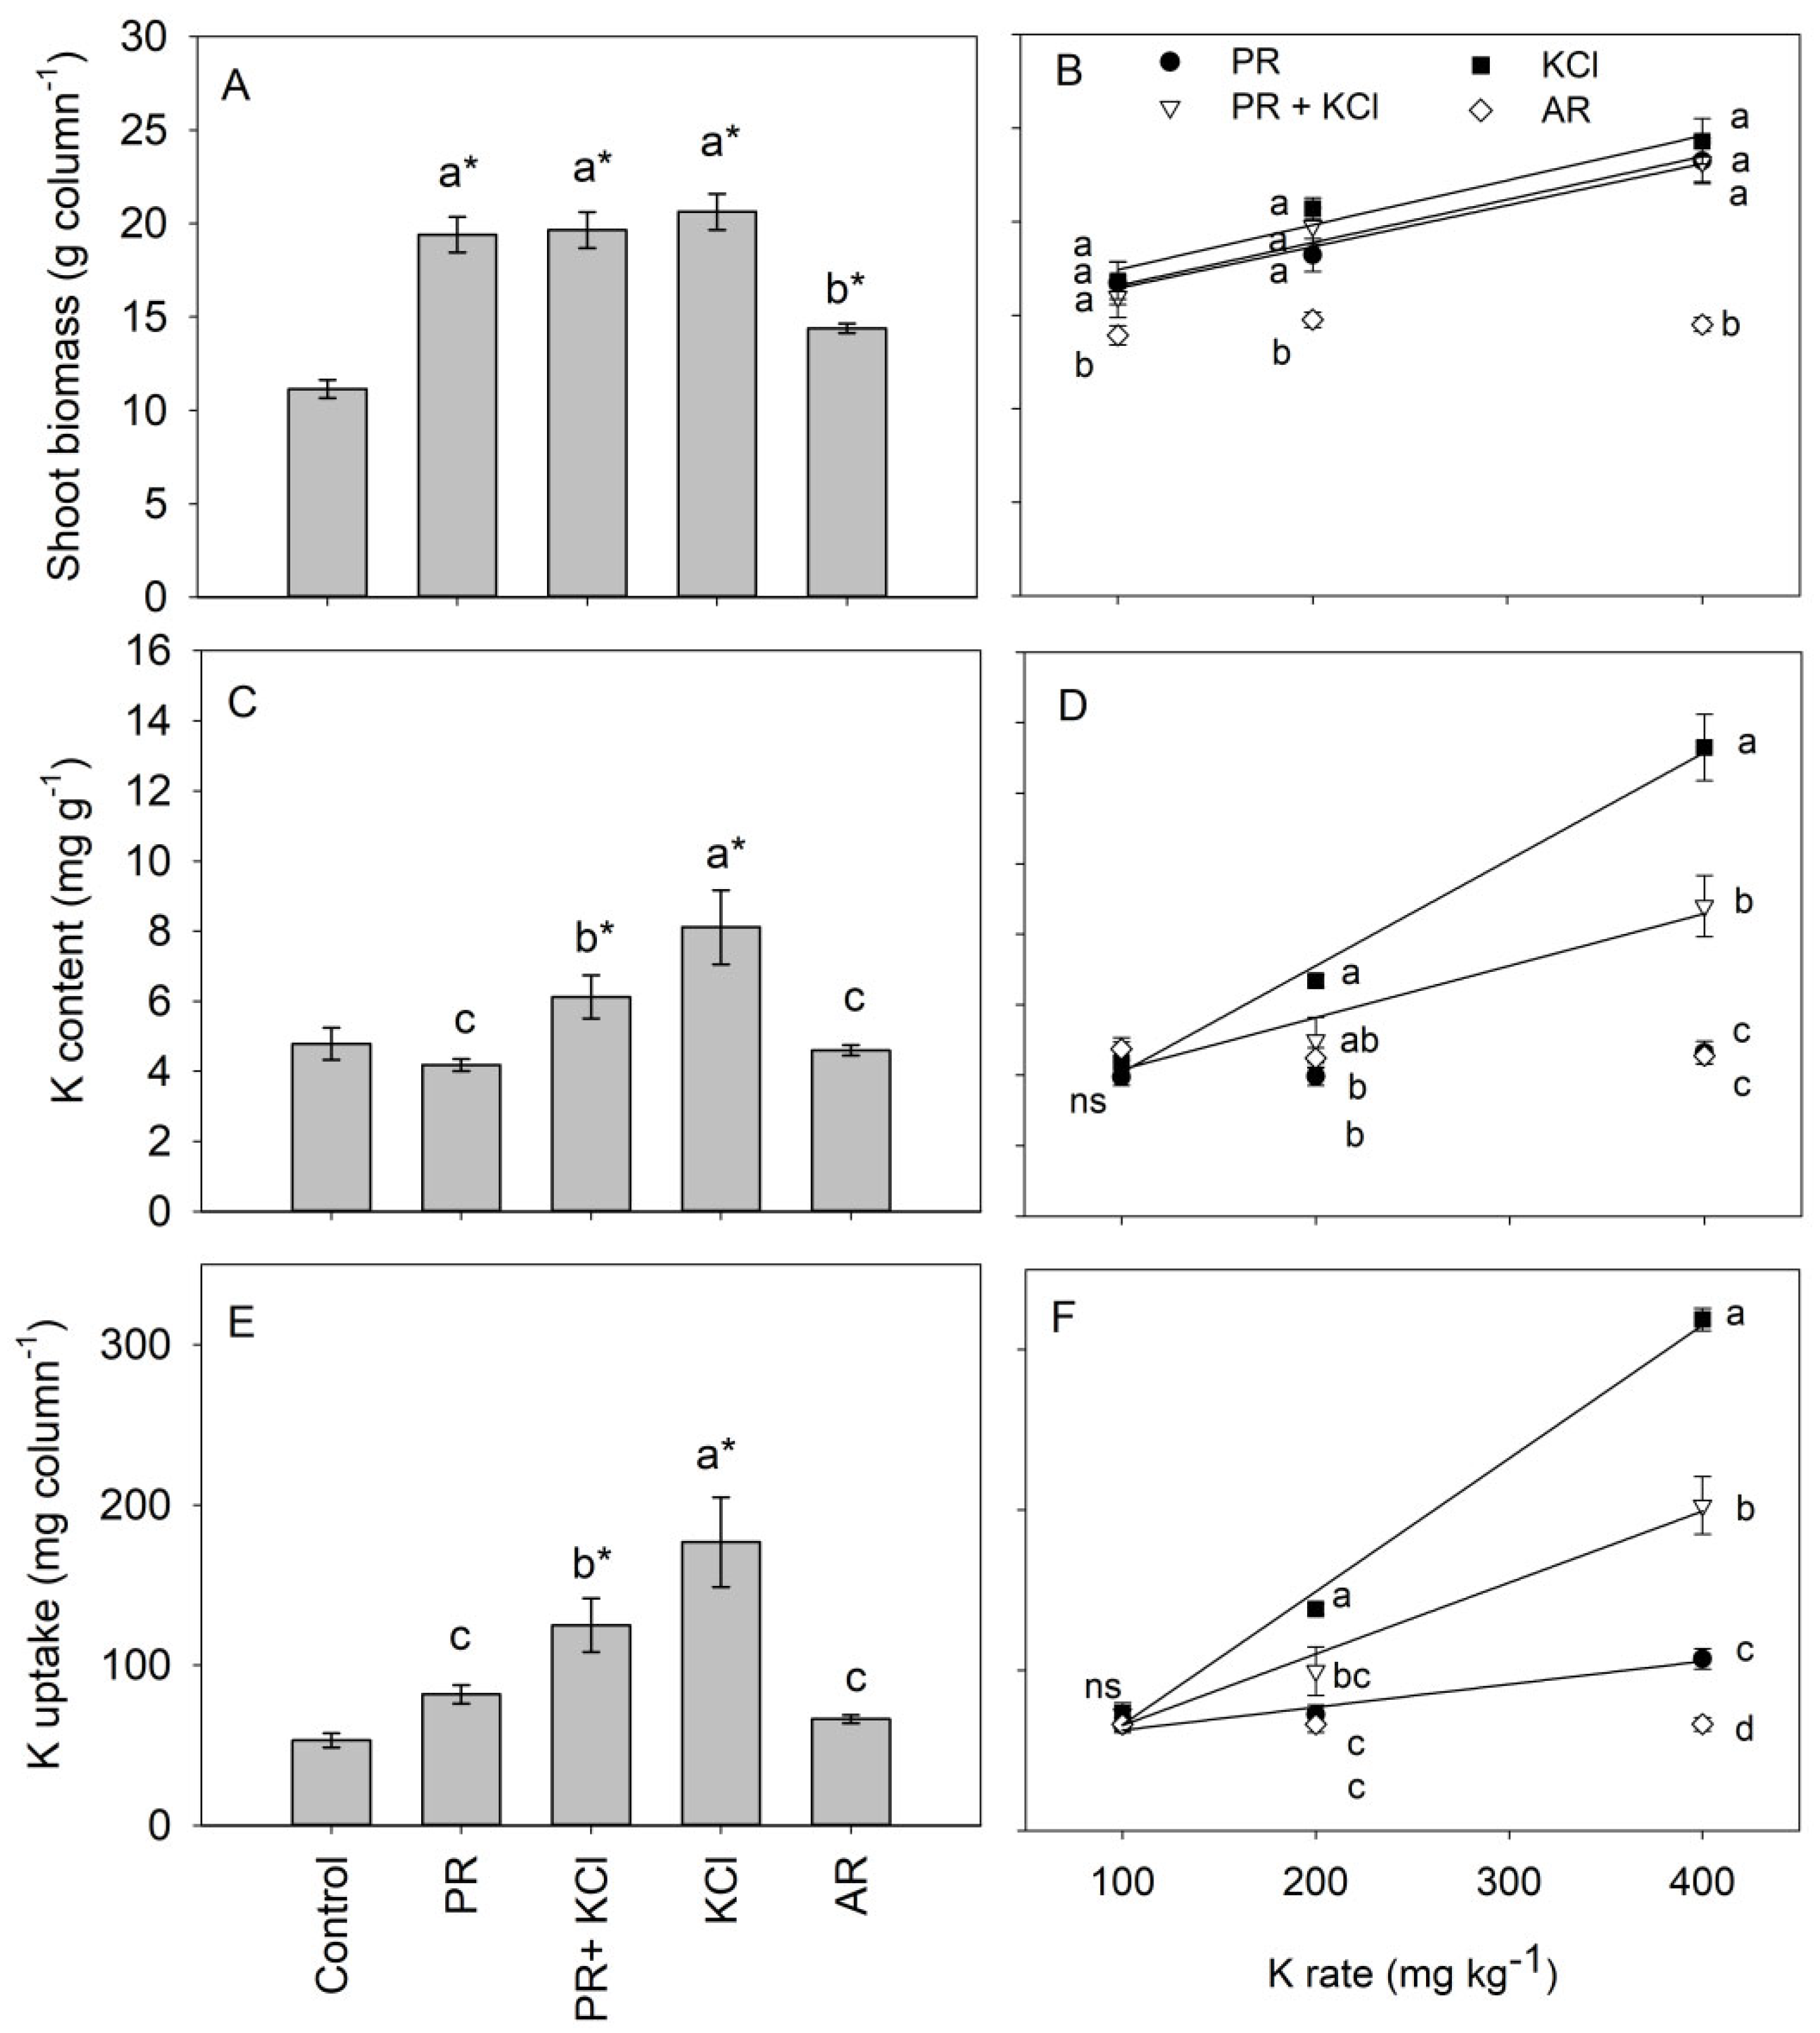
3.2. Rice Biomass and K Uptake

The chlorophyll index was not influenced by the residual effect of K source application, and there was no difference between control plots in terms of K rate (Supplemental Table S2). The number of tillers was higher with PR + KCl and KCl than the control plots at 15 and 30 days after emergence. At 60 days, all K sources promoted higher tillering than the control plots. KCl resulted in a higher number of tillers than AR at 15 and 30 days after emergence. The residual effect of K rates underwent a linear increase in tillers, except at 60 days, which was not significant (p < 0.05) (Supplemental Table S2).
The K sources had a residual effect of increasing the rice biomass compared to the control (Figure 2A). The residual effects of PR, PR + KCl, and KCl resulted in similar biomass production, corresponding to 20 g column−1, which was higher than AR with 14 g column−1 (Figure 2A). The K content in biomass and total K uptake were higher in PR + KCl and in KCl compared to other treatments (Figure 2C,E).
The residual effect of PR, PR + KCl, and KCl underwent a linear increase according to K rate application and increased the biomass production of rice equally. AR showed no effect of K rate addition and lower biomass production compared to PR, PR + KCl, and KCl (Figure 2B). The K rate with PR + KCl and KCl sources had a linear effect on the K content, while the PR and AR sources had no effect. The K content was higher with KCl than other K sources, especially at the K rate of 400 mg kg−1 (Figure 2D). The K uptake increased with the K rate addition for PR, PR + KCl, and KCl sources, while for AR, it produced no effect. At the K rate of 400 mg kg−1, KCl reached a higher K uptake than other K sources, and PR + KCl was higher than PR and AR (Figure 2F).

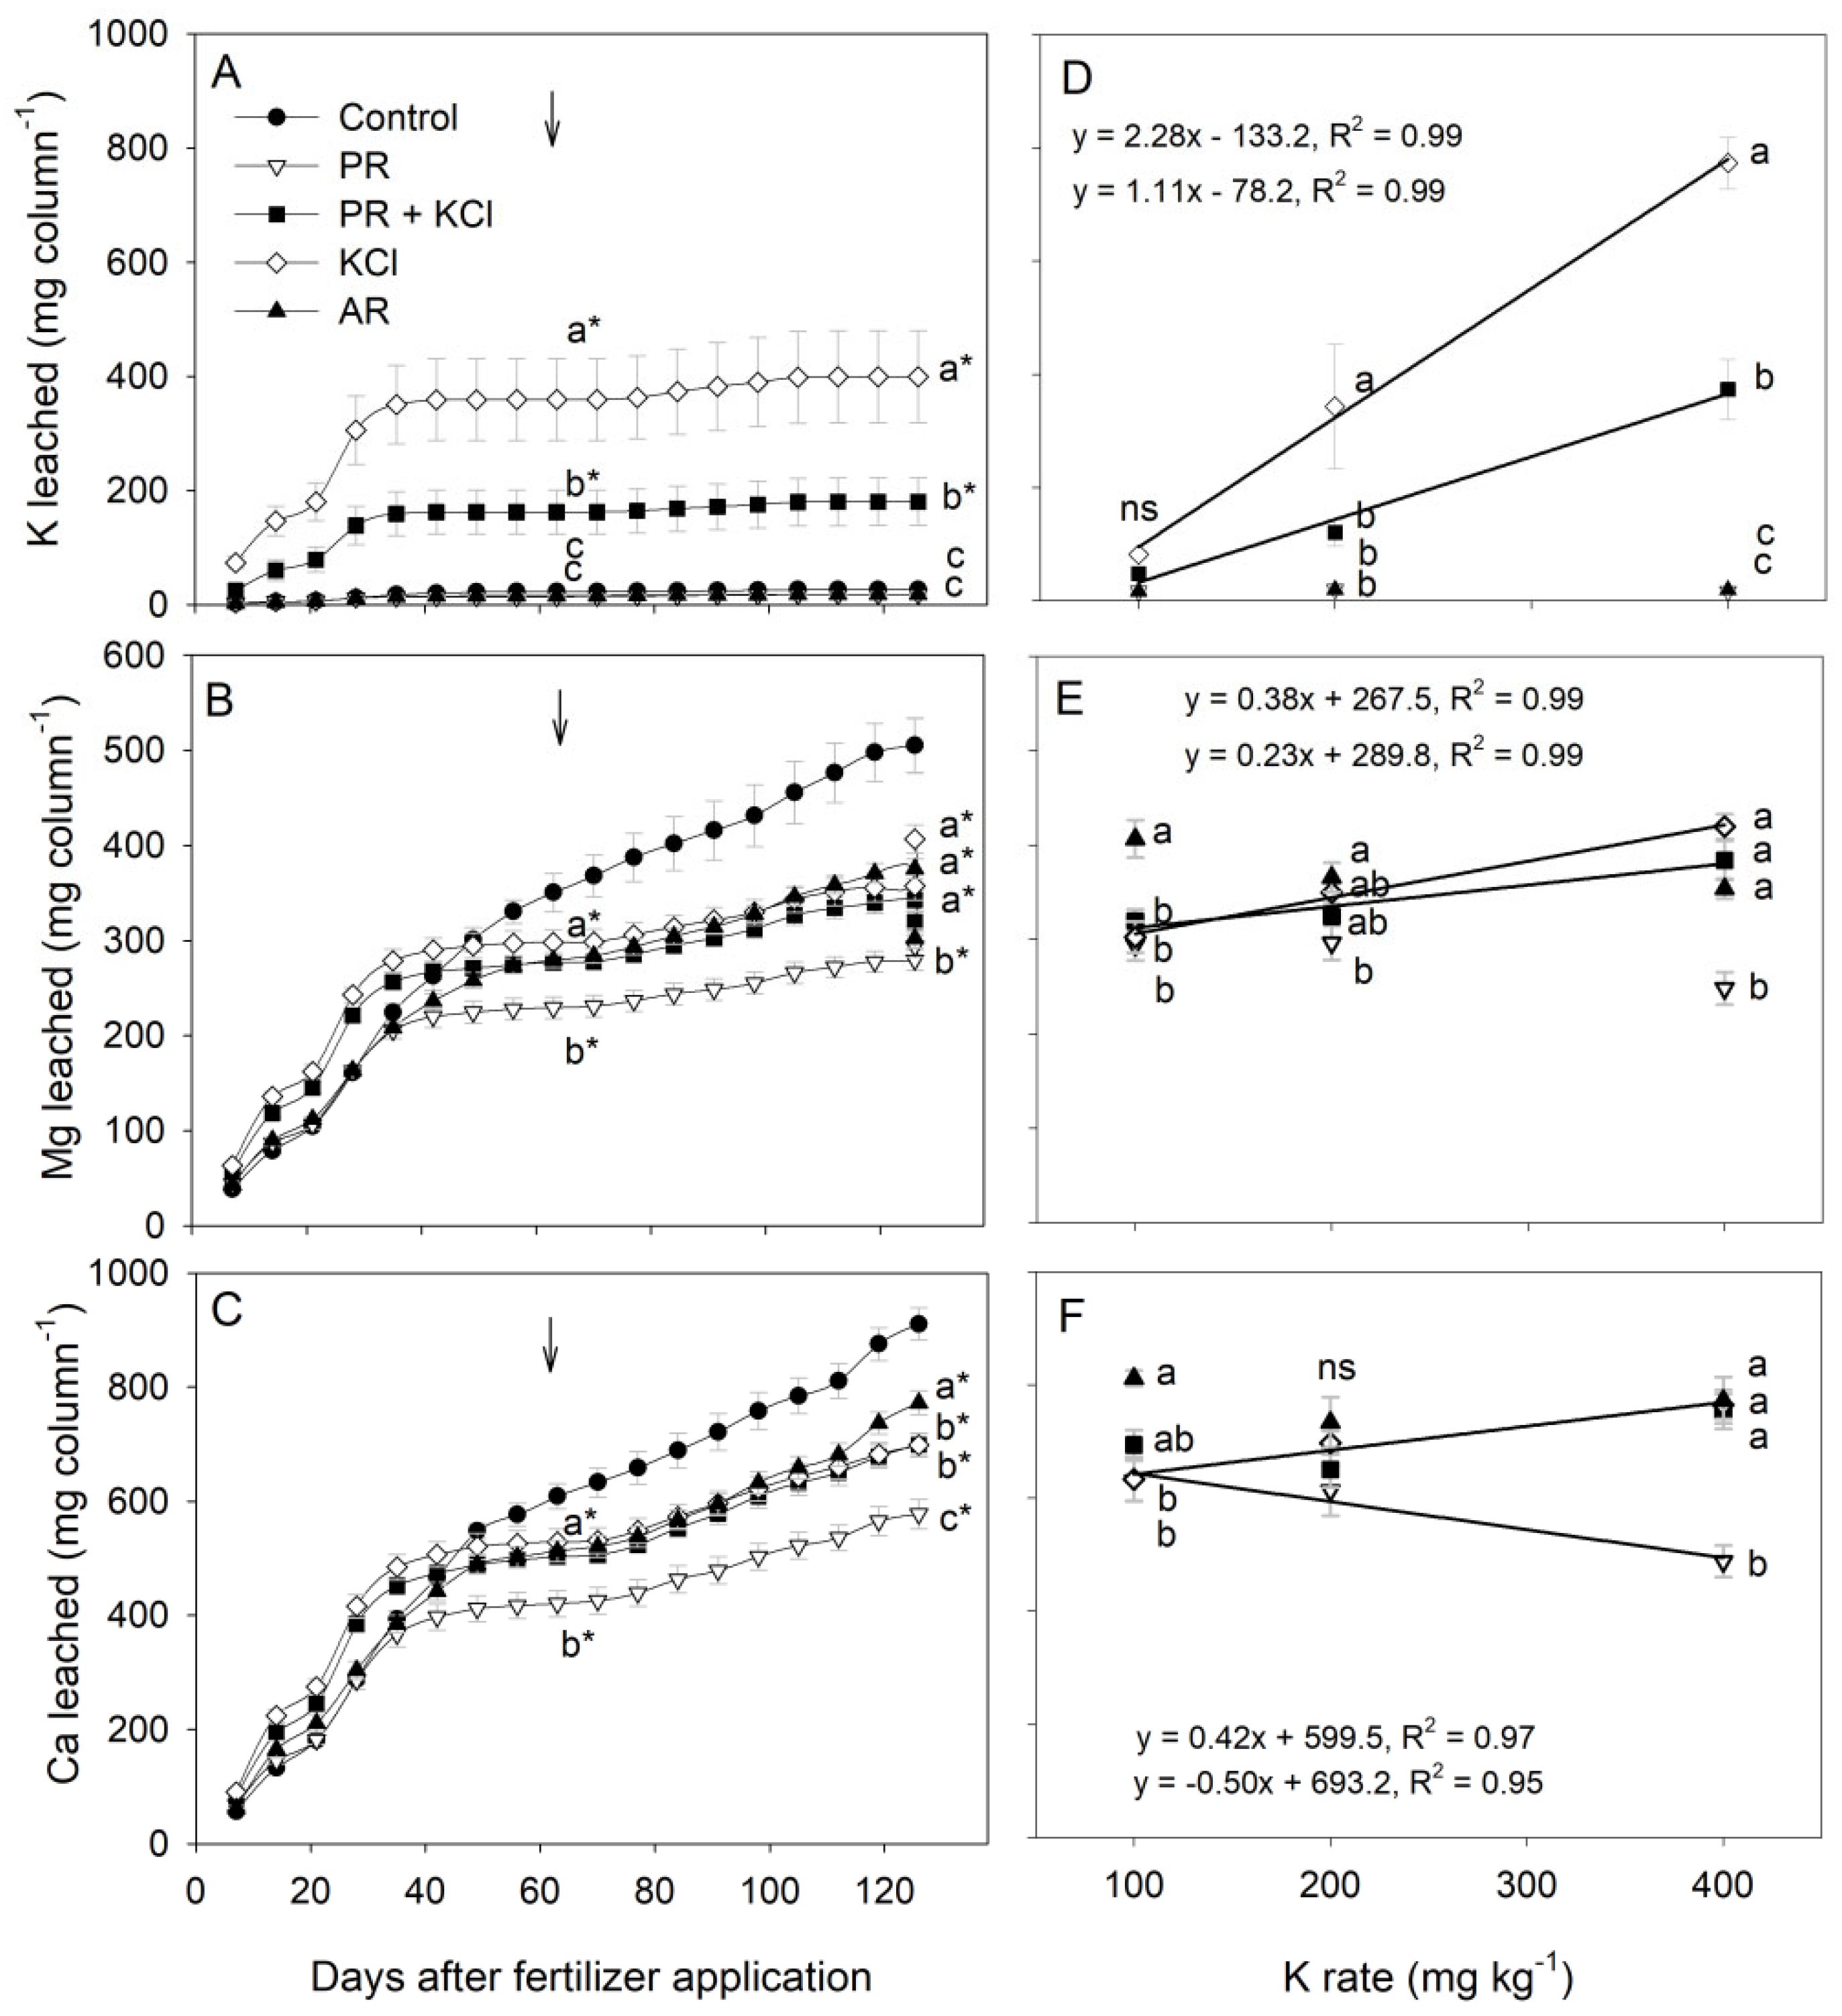
3.3. K, Ca, and Mg Leaching and Soil K Content

K leaching increased until 30 days after maize emergence, mainly in the KCl and PR + KCl treatments, and it then underwent little change until the end of the experiment at 126 days (Figure 3A). KCl’s total average K leached was 400 mg column−1, corresponding to 15% of K applied (6–21%); this was higher than in the PR + KCl source, which had K leaching of 180 mg column−1. PR and AR resulted in similar K leaching to control plots at around 20 mg column−1 (Figure 3A). K leaching increased according to a K rate for the KCl and PR + KCl sources but had no effect for PR and AR (Figure 3D). K leaching was higher with KCl than PR + KCl at a K rate of 400 mg kg−1, while PR and AR showed the smallest amount of leaching (Figure 3D).
Ca and Mg leaching increased with the passage of time during maize and rice growth and were higher in the control plots than in the treatments with K application (Figure 3B,C). Mg leaching was 521 mg column−1 in the control treatment, 279 mg column−1 with PR, and 350 mg column−1 with the other K sources (Figure 3B). Total Ca leaching in the control treatment was 919 mg column−1 over 120 days and 773 mg column−1 with AR, which was higher than other K sources (Figure 3C). Ca leaching increased with an increased K rate for PR + KCl and KCl treatments (Figure 3E). PR resulted in lower Ca leaching at a K rate of 400 mg kg−1 compared to KCl, AR, and PR + KCl (Figure 3E). Mg leaching decreased with an increased K rate for PR, while Mg leaching increased with an increased K rate for KCl (Figure 3F). PR had lower Mg leaching than KCl, AR, and PR + KCl at a K rate of 400 mg kg−1 (Figure 3F).
The K content of soil after maize and rice cultivation ranged from 7.6 to 20 mg kg−1 at a soil layer of 0–20 cm. On average, AR presented lower K content than the PR, PR + KCl, and KCl source (Supplemental Table S4). PR + KCl had a soil K content of 14.5 mg kg−1, which was higher than the control plots (9 mg kg−1) at a 0–20 cm soil depth. On average, an increased K rate resulted in a linear increase in K content at the 0–20 cm layer (Supplemental Table S4). At the 20–40 cm layer, PR + KCl and KCl yielded higher soil K content than PR and AR at almost all K rates (Table S4). The average soil K content was highest for KCl, followed by PR + KCl, PR, and finally AR. All K sources had higher soil K content than the control plots at the 20–40 cm layer, with the K content increasing in a linear pattern according to the K rate. The only exception is AR, for which the effect of the K rate on the soil K content was not significant (Supplemental Table S4).

4. Discussion

In general, K application increased the chlorophyll index, the plant height in maize, and the tillering in rice at the evaluated time points. The KCl and the mixture of phonolite and KCl resulted in higher values compared to PR, AR, and the control treatment. However, the increase in the K rate from 100 mg kg−1 to 400 mg kg−1 decreased the chlorophyll index of maize at 45 and 60 days after emergence. The chlorophyll index can be affected by various factors, such as cultivars, growth stage, environmental conditions (temperature, water stress, light, etc.), nutritional deficiency, and others [33]. As such, it is likely that the chlorophyll index reflected the absence of K fertilization at the beginning of maize development (up to 30 days), but at 45 and 60 days, it could be related to other stress factors due to high biomass production in columns, such as nutrient depletion from limited soil exploration by roots, especially on subsequent rice growth, which decreased or had no effect on the chlorophyll index in relation to an increasing the K rate.
The K sources and application rate increased the maize biomass production in the present study. K rocks produced a lower biomass compared to the conventional KCl source or the mixture of PR with KCl. K rocks have low solubility in water (0.8–1.6% of the K total). However, PR + KCl resulted in 67% K soluble in water (Table 2), with efficiency similar to KCl fertilizer (100% K soluble in water), including at a low K rate. Beyond the fact that PR + KCl fertilizer has only 14% KCl and 86% K rock (mass ratio), it also has high solubility in water, improving the use of K rock as a source. It is likely that the high solubility of K sources is necessary to improve maize development. The present study reports a promising effect of combining K rock material with the smallest amount of KCl (14%) among other mixing K sources tested in the literature. In another study, a mixture of 30% KCl + 70% phonolite showed a relative efficiency of 63% compared to KCl [15], while in the present study, the mixture of PR with KCl promoted similar efficiency to synthetic fertilizer. It is likely that the industry process to produce the mixture of PR with KCl resulted in a fertilizer with higher solubility in the present study compared to other literature [15]. In the present study, the solubility (water) of the mixture source was 67% of the total K content, allowing appropriate K nutrition and plant development.
The application of only K rock had lower efficiency compared to conventional fertilizer and had a similar residual effect to KCl. Phonolite rock had a relative efficiency of 72% compared to KCl in maize biomass production, while the alkaline feldspar rock resulted in an efficiency of 40%. The K release from rock sources was probably enhanced due to organic acids exuded from maize plants, which reduce soil pH in the rhizosphere [18]. The residual effect of K rock sources achieved similar efficiency compared to the mixture of PR with KCl and KCl only and promoted higher subsequent rice production compared to control plots. PR had a stronger residual effect than AR, revealing the limited release of K from AR. Rice was grown soon after maize without disturbing the soil in the columns, and therefore, the maize roots could have had an influence on rice growth (e.g., decomposition and nutrient cycling), along with the relatively short time (60 days). Nevertheless, all K sources had a residual effect on rice biomass, resulting in higher production compared to control plots.
Other studies have reported increased efficiency for K rocks with solubilizing microorganisms amendments [34,35,36,37,38], organic compounds [39,40,41,42], or thermal and chemical process treatments [43,44,45]. Inoculants have exhibited good efficiency in laboratory studies but not at the field scale [42], though physical and chemical modifications or biological treatments such as solubilizing bacteria and fungi usually generated better results. Further studies should evaluate the mixture of K rock and soluble K fertilizer at field scale and should also evaluate associations with solubilizing microorganisms.
The literature has identified contrasting efficiencies of K rock materials in supplying K. One review study found that several rock materials achieved positive results, while others have identified no agronomic benefits [42]. Recently, it was reported that potassium rocks (mica, feldspar, and greensand) resulted in higher biomass (palmarosa and oat) than a control treatment; the mica source produced a similar yield and K uptake compared to KCl [9]. The authors found up to five times higher K release (in water and citric acid) from mica than from other K rocks. Phonolite and alkaline silicate rock sources resulted in similar rice and bean yields compared to KCl [13]. Other studies have also reported similar efficiency for K rocks compared to a conventional K fertilizer. For example, the gneiss material promoted similar ryegrass production rates and K uptake compared to K2SO4 [12], and K feldspar rocks and the mixture of 50% K rock + 50% KCl showed higher or similar rice and wheat yields compared to KCl [14]. Conversely, the use of K rock can result in lower efficiency compared to conventional fertilizers, such as lower biomass for palmarosa and oat when treated with K rock from feldspar and greensand compared to KCl [9] and a lower shoot biomass with nepheline and phonolite than with KCl, reaching relative effectiveness up to 27–29% of KCl in medium texture soil and 50–64% in sandy soil [17].
The use of K rocks has produced different performances according to site-specific conditions, such as K rock material, crop, soil, and climate. Hence, a K source combining K rock with a small amount of KCl may be advantageous by supplying soluble K and slow-release K, and optimizing the use efficiency of K rock for high crop yield, especially when K rock efficiency is low. The production of a K source containing a large quantity of national K rock (Brazil, in this case) and a small amount of imported KCl can reduce the costs of the K fertilizer, given that the price of K rocks represent less than 30% from that of KCl [46]; this would reduce the dependency on the international market, which would benefit local farmers and prevent price fluctuations.
Ca and Mg leaching was higher in control plots than with added K sources, which likely occurred due to the lower biomass production (including roots and nutrient uptake) in control plots. The K leaching was, on average, 15% of the K applied with KCl treatment, while the mixture of K rock with KCl reduced this loss by more than 50% (Figure 3). In addition, PR + KCl resulted in lower K content in the 20–40 cm soil layer than KCl, reducing the risk of leaching. The study was conducted in greenhouse columns, where plant roots can better explore the soil; this results in higher nutrient extraction compared to the field. The K uptake for maize with KCl ranged from 2000 to 2800 mg column−1 for a K application rate of 900–3600 mg column−1 (100 to 400 mg kg−1), demonstrating that a low K rate can result in a negative K balance (K removal > K input) and consequently a depletion in soil K content [47]. Another study indicated a reduction in K leaching; with a simulated rainfall of 14 mm (4 events), the KCl treatment underwent K leaching of 100 mg K column−1 (5% of total K applied) in sandy soil, with the K rock source reducing this loss [48]. In the present study, the mixed source of PR with KCl resulted in substantial reduction in K leaching, which improved K fertilization by increasing K use efficiency. Future research should evaluate the effectiveness of the mixture of PR + KCl in reducing K loss via leaching at the field scale.
Using K rock materials in agriculture as a successful alternative K source involves the consideration of aspects such as the Na2O content and salinity index of the material, the energy expenditure in the melting process, and agricultural operation and logistics costs due to low K2O contents, which may limit fertilizer use only to locations relatively close to their production sites [13]. At the same time, the indigenous source of K can supply Ca, Mg, and Si present through K rock materials, which can improve crop yields [14].

5. Conclusions

In this study, phonolite (PR) and alkaline feldspar (AR) K rocks achieved a lower efficiency in maize biomass production compared to conventional KCl fertilizer, reaching relative efficiencies of 72% and 40% of KCl, respectively. However, the mixture of PR with KCl (KCl 86:14 mass ratio) was promising, and it resulted in similar efficiency to KCl fertilizer in maize biomass production. K rock sources and the mixture of PR with KCl had a similar residual effect on rice production compared to KCl during the 120-day timeframe. K leaching was, on average, 15% of the K applied from the KCl fertilizer; the mixture of K rock with KCl reduced this loss by more than 50%.
The mixture of phonolite rock with a small amount of KCl fertilizer (14%) can optimize K fertilization, resulting in similar biomass production to conventional fertilizer and reducing K loss via leaching, which may improve K use efficiency. Future research should evaluate this K source at the field scale, as it may reduce K fertilization costs and the dependency on the international market.

Supplementary Materials

The following supporting information can be downloaded at: https://www.mdpi.com/article/10.3390/soilsystems9030083/s1, Figure S1: Air temperature and relative humidity variation in the greenhouse during the experiment; Table S1: Chlorophyll index and plant height at different time of maize cultivation due to K source and rate; Table S2: Chlorophyll index and tillering at different time of rice cultivation due to K source and rate; Table S3: Equation parameters and coefficient of determination adjusted to maize and rice biomass, K content, and K uptake according to K rate (100, 200, and 400 mg kg−1) and K source; Table S4: Exchangeable K content in soil layers after maize and rice growth according to of K fertilizer source and application rate (100, 200 and 400 mg kg−1).

Author Contributions

Conceptualization: C.P.S. and R.O.; formal analysis: J.R.S.; funding acquisition: R.O.; investigation: C.P.S., R.M.M. and J.S.; methodology: C.P.S. and R.O.; project administration: C.P.S. and R.O.; supervision: R.O.; validation: C.P.S., J.R.S. and R.O.; visualization: C.P.S., J.R.S. and R.O.; writing—original draft preparation: C.P.S. and J.R.S.; writing—reviewing and editing: C.P.S., J.R.S., R.M.M., J.S. and R.O. All authors have read and agreed to the published version of the manuscript.

Funding

The authors thank Yoorin Fertilizantes® for providing the K sources. C.P.S. and J.R.S. received a scholarship from the Foundation for Research and Agricultural and Forestry Studies (FEPAF) [grant number 1145]. R. Otto received a research productivity fellowship from the National Council for Scientific and Technological Development (CNPq) [grant #314811/2023-0].

Institutional Review Board Statement

Not applicable.

Informed Consent Statement

Not applicable.

Data Availability Statement

Raw data will be made available upon request.

Conflicts of Interest

The authors declare no conflict of interest.

References

  1. Marschner, P. (Ed.) Marschner’s Mineral Nutrition of Higher Plants, 3rd ed.; Academic Press: San Diego, CA, USA, 2012; ISBN 978-0-12-384905-2. [Google Scholar]
  2. Zörb, C.; Senbayram, M.; Peiter, E. Potassium in Agriculture—Status and Perspectives. J. Plant Physiol. 2014, 171, 656–669. [Google Scholar] [CrossRef] [PubMed]
  3. Goulding, K.W.T.; Loveland, P.J. The Classification and Mapping of Potassium Reserves in Soils of England and Wales. J. Soil Sci. 1986, 37, 555–565. [Google Scholar] [CrossRef]
  4. ANDA. Anuário Estatístico Setor de Fertilizantes; ANDA (Associação Nacional para a Difusão de Adubos): São Paulo, Brazil, 2021. (In Portuguese) [Google Scholar]
  5. IFA. Public Summary Short-Term Outlook 2023–2024—IFA (International Fertilizer Association). Available online: https://www.ifastat.org/market-outlooks (accessed on 23 April 2024).
  6. Cantarella, H.; Quaggio, J.A.; Mattos, D.; Boaretto, R.M.; van Raij, B. Boletim 100: Recomendações de Adubação e Calagem Para o Estado de São Paulo; Instituto Agronômico: Campinas, Brazil, 2022; ISBN 978-65-88414-09-5. (In Portuguese)
  7. Rosolem, C.A.; Steiner, F. Effects of Soil Texture and Rates of K Input on Potassium Balance in Tropical Soil. Eur. J. Soil Sci. 2017, 68, 658–666. [Google Scholar] [CrossRef]
  8. Shirale, A.O.; Meena, B.P.; Gurav, P.P.; Srivastava, S.; Biswas, A.K.; Thakur, J.K.; Somasundaram, J.; Patra, A.K.; Rao, A.S. Prospects and Challenges in Utilization of Indigenous Rocks and Minerals as Source of Potassium in Farming. J. Plant Nutr. 2019, 42, 2682–2701. [Google Scholar] [CrossRef]
  9. Basak, B.B.; Sarkar, B.; Maity, A.; Chari, M.S.; Banerjee, A.; Biswas, D.R. Low-Grade Silicate Minerals as Value-Added Natural Potash Fertilizer in Deeply Weathered Tropical Soil. Geoderma 2023, 433, 116433. [Google Scholar] [CrossRef]
  10. Crusciol, C.A.C.; Soratto, R.P.; Gilabel, A.P.; Costa, C.H.M.d.; Campos, M.d.; Castro, G.S.A.; Ferrari Neto, J. Broadcast Application of Ground Silicate Rocks as Potassium Sources for Grain Crops. Pesqui. Agropecuária Bras. 2022, 57, e02443. [Google Scholar] [CrossRef]
  11. Manning, D.A.C.; Baptista, J.; Sanchez Limon, M.; Brandt, K. Testing the Ability of Plants to Access Potassium from Framework Silicate Minerals. Sci. Total Environ. 2017, 574, 476–481. [Google Scholar] [CrossRef] [PubMed]
  12. Priyono, J.; Gilkes, R.J. High-Energy Milling Improves the Effectiveness of Silicate Rock Fertilizers: A Glasshouse Assessment. Commun. Soil Sci. Plant Anal. 2008, 39, 358–369. [Google Scholar] [CrossRef]
  13. Soratto, R.P.; Crusciol, C.A.C.; Campos, M.D.; Costa, C.H.M.D.; Gilabel, A.P.; Castro, G.S.A.; Ferrari Neto, J. Silicate Rocks as an Alternative Potassium Fertilizer for Upland Rice and Common Bean Crops. Pesqui. Agropecuária Bras. 2021, 56, e01411. [Google Scholar] [CrossRef]
  14. Zhao, X.; Gao, S.; Lu, D.; Wang, H.; Chen, X.; Zhou, J.; Zhang, L. Can Potassium Silicate Mineral Products Replace Conventional Potassium Fertilizers in Rice–Wheat Rotation? Agron. J. 2019, 111, 2075–2083. [Google Scholar] [CrossRef]
  15. Cruz, C.A.C.D.; Orioli Júnior, V.; Bernardes, J.V.S.; Sargentim, M.M.; Silva, G.A.; Kochenborger, A.C.D. Efficiency of Phonolite as a Potassium Source for Paiaguás Palisadegrass. Pesqui. Agropecuária Trop. 2021, 51, e67857. [Google Scholar] [CrossRef]
  16. Luchese, A.V.; de Castro Leite, I.J.G.; Alves, M.L.; dos Santos Vieceli, J.P.; Pivetta, L.A.; Missio, R.F. Can Basalt Rock Powder Be Used as an Alternative Nutrient Source for Soybeans and Corn? J. Soil Sci. Plant Nutr. 2023, 23, 4044–4054. [Google Scholar] [CrossRef]
  17. Nogueira, T.A.R.; Miranda, B.G.; Jalal, A.; Lessa, L.G.F.; Filho, M.C.M.T.; Marcante, N.C.; Abreu-Junior, C.H.; Jani, A.D.; Capra, G.F.; Moreira, A.; et al. Nepheline Syenite and Phonolite as Alternative Potassium Sources for Maize. Agronomy 2021, 11, 1385. [Google Scholar] [CrossRef]
  18. Basak, B.B.; Sarkar, B.; Sanderson, P.; Naidu, R. Waste Mineral Powder Supplies Plant Available Potassium: Evaluation of Chemical and Biological Interventions. J. Geochem. Explor. 2018, 186, 114–120. [Google Scholar] [CrossRef]
  19. Van Der Bauwhede, R.; Muys, B.; Vancampenhout, K.; Smolders, E. Accelerated Weathering of Silicate Rock Dusts Predicts the Slow-Release Liming in Soils Depending on Rock Mineralogy, Soil Acidity, and Test Methodology. Geoderma 2024, 441, 116734. [Google Scholar] [CrossRef]
  20. Oze, C.; Smaill, J.B.; Reid, C.M.; Palin, M. Potassium and Metal Release Related to Glaucony Dissolution in Soils. Soil Syst. 2019, 3, 70. [Google Scholar] [CrossRef]
  21. EMBRAPA. Brazilian Soil Classification System, 5th ed.; Empresa Brasileira de Pesquisa Agropecuária (EMBRAPA): Brasília, Brazil, 2018. [Google Scholar]
  22. Soil Survey Staff. Soil Taxonomy: A Basic System of Soil Classification for Making and Interpreting Soil Surveys, 2nd ed.; U.S. Department of Agriculture Handbook; Natural Resources Conservation Service: Washington, DC, USA, 1999.
  23. van Raij, B.; Andrade, J.C.; Cantarella, H.; Quaggio, J.A. Análise Química Para Avaliação Da Fertilidade de Solos Tropicais; Instituto Agronômico: Campinas, Brazil, 2001. (In Portuguese)
  24. Blake, G.R.; Hartge, K.H. Bulk Density. In Methods of Soil Analysis; John Wiley & Sons, Ltd.: Hoboken, NJ, USA, 1986; pp. 363–375. ISBN 978-0-89118-864-3. [Google Scholar]
  25. MAPA. Ministério Da Agricultura, Pecuária e Abastecimento (MAPA). Manual de Métodos Analíticos Oficiais Para Fertilizantes e Corretivos; Secretaria de Defesa Agropecuária: Brasilia, Brazil, 2017. (In Portuguese)
  26. Malavolta, E. Elementos de Nutrição Mineral de Plantas; Editora Agronômica Ceres: São Paulo, Brazil, 1980. (In Portuguese) [Google Scholar]
  27. van Raij, B. Fertilidade do Solo e Manejo de Nutrientes; IPNI: Piracicaba, Brazil, 2011; ISBN 978-85-98519-07-4. [Google Scholar]
  28. Malavolta, E.; Vitti, G.C.; Oliveira, S.A. Avaliação do Estado Nutricional de Plantas; Associação Brasileira para Pesquisa da Potassa e do Fosfato: Piracicaba, Brazil, 1997. (In Portuguese) [Google Scholar]
  29. R Core Team. R: A Language and Environment for Statistical Computing. In R Foundation for Statistical Computing; R Core Team: Vienna, Austria, 2024; Available online: https://www.r-project.org/ (accessed on 10 December 2024).
  30. Ferreira, E.B.; Cavalcanti, P.P.; Nogueira, D.A. ExpDes: Experimental Designs Package. R Package Version 1.2.1. 2021. Available online: https://cran.r-project.org/web/packages/ExpDes.pt/index.html (accessed on 4 October 2021).
  31. Warnes, G.R.; Bolker, B.; Lumley, T.; Johnson, R.C. Contributions from Randall C. Johnson Are Copyright SAIC-Frederick, Inc. Funded by the Intramural Research Program, of the NIH, National Cancer Institute and Center for Cancer Research Under NCI Contract NO1-CO-12400. (2018). Gmodels: Various R Programming Tools for Model Fitting. R Package Version 2.18.1. 2018. Available online: https://cran.r-project.org/package=gmodels (accessed on 4 October 2021).
  32. Systat Software (SSI). Sigmaplot for Windows, Version 12.5; Systat Software: San Jose, CA, USA, 2006. [Google Scholar]
  33. Peterson, T.A.; Blackmer, T.M.; Francis, D.D.; Schepers, J.S. G93-1171 Using a Chlorophyll Meter to Improve N Management. Historical Materials from University of Nebraska-Lincoln Extension 1353. 1993. Available online: https://digitalcommons.unl.edu/extensionhist/1353 (accessed on 22 May 2025).
  34. Anjanadevi, I.P.; John, N.S.; John, K.S.; Jeeva, M.L.; Misra, R.S. Rock Inhabiting Potassium Solubilizing Bacteria from Kerala, India: Characterization and Possibility in Chemical K Fertilizer Substitution. J. Basic Microbiol. 2016, 56, 67–77. [Google Scholar] [CrossRef] [PubMed]
  35. Basak, B.B.; Maity, A.; Ray, P.; Biswas, D.R.; Roy, S. Potassium Supply in Agriculture through Biological Potassium Fertilizer: A Promising and Sustainable Option for Developing Countries. Arch. Agron. Soil Sci. 2022, 68, 101–114. [Google Scholar] [CrossRef]
  36. Lodi, L.A.; Klaic, R.; Bortoletto-Santos, R.; Ribeiro, C.; Farinas, C.S. Unveiling the Solubilization of Potassium Mineral Rocks in Organic Acids for Application as K-Fertilizer. Appl. Biochem. Biotechnol. 2022, 194, 2431–2447. [Google Scholar] [CrossRef] [PubMed]
  37. Schueler, T.A.; Dourado, M.L.; Videira, S.S.; da Cunha, C.D.; Rizzo, A.C.L. Biosolubilization of Verdete: An Alternative Potassium Source for Agriculture Fertilizer. Biocatal. Agric. Biotechnol. 2021, 34, 102031. [Google Scholar] [CrossRef]
  38. Supanjani; Han, H.S.; Jung, J.S.; Lee, K.D. Rock Phosphate-Potassium and Rock-Solubilising Bacteria as Alternative, Sustainable Fertilisers. Agron. Sustain. Dev. 2006, 26, 233–240. [Google Scholar] [CrossRef]
  39. Basak, B.B.; Sarkar, B.; Naidu, R. Environmentally Safe Release of Plant Available Potassium and Micronutrients from Organically Amended Rock Mineral Powder. Environ. Geochem. Health 2021, 43, 3273–3286. [Google Scholar] [CrossRef] [PubMed]
  40. Ramos, C.G.; Dalmora, A.C.; Kautzmann, R.M.; Hower, J.; Dotto, G.L.; Oliveira, L.F.S. Sustainable Release of Macronutrients to Black Oat and Maize Crops from Organically-Altered Dacite Rock Powder. Nat. Resour. Res. 2021, 30, 1941–1953. [Google Scholar] [CrossRef]
  41. Saritha, M.; Kumar, P.; Panwar, N.R.; Burman, U. Plant Response to Novel Organo-Mineral Fertilizers Based on Selective Enrichment of P- and K-Solubilizing Microorganisms in Soil. J. Soil Sci. Plant Nutr. 2021, 21, 2392–2402. [Google Scholar] [CrossRef]
  42. Shirale, A.O.; Meena, B.P.; Biswas, A.K.; Gurav, P.P.; Srivastava, S.; Das, H.; Thakur, J.K.; Patra, A.K.; Rao, A.S. Characterization and K Release Pattern of Glauconite in Contrasting Soils of India. J. Soil Sci. Plant Nutr. 2023, 23, 4632–4646. [Google Scholar] [CrossRef]
  43. Biswas, S.S.; Biswas, D.R.; Sarkar, A.; Ghosh, A. Oxalic-Acid-Treated Waste Mica, a Potent Natural Supplement to K Fertilizers for Growing Wheat and Rice in Inceptisol. J. Soil Sci. Plant Nutr. 2023, 23, 581–593. [Google Scholar] [CrossRef]
  44. Mbissik, A.; Khiari, L.; Raji, O.; Elghali, A.; Lajili, A.; Ouabid, M.; Jemo, M.; Bodinier, J.-L. Potassium Fertilizer Value of Raw and Hydrothermally Treated Igneous Rocks. J. Soil Sci. Plant Nutr. 2023, 23, 1030–1045. [Google Scholar] [CrossRef]
  45. Santos, W.O.; Mattiello, E.M.; Vergutz, L.; Costa, R.F. Production and Evaluation of Potassium Fertilizers from Silicate Rock. J. Plant Nutr. Soil Sci. 2016, 179, 547–556. [Google Scholar] [CrossRef]
  46. Folego, T. O Brasil tem um Fertilizante de Baixo Carbono. Mas Precisa Desbravar o Mercado. Available online: https://capitalreset.uol.com.br/agronegocio/o-brasil-tem-um-fertilizante-de-baixo-carbono-mas-precisa-desbravar-o-mercado/ (accessed on 11 July 2025). (In Portuguese).
  47. Sanches, G.M.; Magalhães, P.S.G.; Kolln, O.T.; Otto, R.; Rodrigues, F.; Cardoso, T.F.; Chagas, M.F.; Franco, H.C.J. Agronomic, Economic, and Environmental Assessment of Site-Specific Fertilizer Management of Brazilian Sugarcane Fields. Geoderma Reg. 2021, 24, e00360. [Google Scholar] [CrossRef]
  48. Yu, C.; Geisseler, D.J.; Brown, P.H.; Khalsa, S.D.S. Distribution of Potassium, Calcium, and Magnesium Ions from Potassium Fertilizers in Columns of Orchard Soils. Soil Sci. Soc. Am. J. 2023, 87, 572–585. [Google Scholar] [CrossRef]
Figure 1. Maize shoot biomass (A,B), K content (C,D), and K uptake (E,F) due to K fertilizer source application (PR—phonolite, PR + KCl, KCl, and AR—alkaline rock) and application rate, cultivated over 60 days in greenhouse columns. Means followed by the same lowercase letters do not differ from the Tukey test (p < 0.05). * Significant difference from control treatment (p < 0.05). Linear function parameters are shown in Table S3.
Soilsystems 09 00083 g001
Figure 2. Rice shoot biomass (A,B), K content (C,D), and K uptake (E,F) due to residual effect of K fertilizer source application (PR—phonolite, PR + KCl, KCl, and AR—alkaline rock) and application rate, cultivated over 60 days in greenhouse columns. Means followed by same lowercase letters do not differ from Tukey test (p < 0.05). * Significant difference from control treatment (p < 0.05). ns: not significant. Linear function parameters are shown in Table S3.
Soilsystems 09 00083 g002
Figure 3. Accumulated leaching dynamic of K (A), Mg (B), and Ca (C) and total leachate (DF) during the cultivation of maize and rice over 120 days in greenhouse columns in relation to the application of K fertilizer source (PR—phonolite, PR + KCl, KCl, and AR—alkaline rock) and rate. The arrows indicate the maize harvest and subsequent rice growth. Means followed by the same lowercase letters do not differ from the Tukey test (p < 0.05) at the maize (60 days) and rice (120 days) harvest times. * Significant difference from control treatment (p < 0.05). ns: not significant (p < 0.05).
Soilsystems 09 00083 g003
Table 1. Chemical and physical properties of soil before the experiment.
Soil DepthpHOMPKCaMgH + AlCECBSSandSiltClay
cm-g dm−3mg dm−3mmolc dm−3 %g kg−1
0–204.91591.21061835.24981719163
20–404.71060.71051833.74781114175
Extractants: OM: organic matter, dichromate oxidation; pH CaCl2; phosphorus (P), potassium (K), calcium (Ca), and magnesium (Mg): ion exchangeable resin; hydrogen and aluminum (H + Al): SMP Buffer solution (pH 7.0); CEC: cation exchange capacity. BS: base saturation. Soil samples were analyzed for chemicals [23] and particle-size [24] contents.
Table 2. Potassium content in the K sources according to extractant.
K SourcePotassium Content
Total *Citric Acid 2% Water
K2O Content (% of Total K2O)
Phonolite rock (PR)7.590.79 (10%)0.06 (0.8%)
PR + KCl15.6011.44 (73%)10.41 (67%)
Alkaline rock (AR)12.400.22 (1.8%)0.20 (1.6%)
KCl60.1560.15 (100%)60.10 (100%)
* HClO4 and HF. C6H8O7 0.02 g L−1. Water + ammonium oxalate, 40 g L−1. Values in parentheses indicate the percentage of K2O content within the total K2O content.
Disclaimer/Publisher’s Note: The statements, opinions and data contained in all publications are solely those of the individual author(s) and contributor(s) and not of MDPI and/or the editor(s). MDPI and/or the editor(s) disclaim responsibility for any injury to people or property resulting from any ideas, methods, instructions or products referred to in the content.

