Article

Soil Texture’s Hidden Influence: Decoding Plant Diversity Patterns in Arid Ecosystems

1
College of Ecology and Environment, Xinjiang University, Urumqi 830046, China
2
Key Laboratory of Oasis Ecology Ministry of Education, Xinjiang University, Urumqi 830046, China
3
Xinjiang Jinghe Observation and Research Station of Temperate Desert Ecosystem, Ministry of Education, Bole 833300, China
*
Author to whom correspondence should be addressed.
Soil Syst. 2025, 9(3), 84; https://doi.org/10.3390/soilsystems9030084
Submission received: 13 May 2025 / Revised: 9 July 2025 / Accepted: 22 July 2025 / Published: 25 July 2025

Abstract

Desert plant communities play a vital role in sustaining the stability of arid ecosystems; however, they demonstrate limited resilience to environmental changes. A critical aspect of understanding community assembly mechanisms is determining whether soil texture heterogeneity affects vegetation diversity in arid deserts, especially under conditions of extreme water scarcity and restricted nutrient availability. This study systematically examined the relationships between plant diversity and soil physicochemical properties across four soil texture types—sand, sandy loam, loamy sand, and silty loam—by selecting four representative desert systems in the Hami region of Xinjiang, China. The objective was to elucidate the mechanisms through which soil texture may impact desert plant species diversity. The findings revealed that silty loam exhibited distinct characteristics in comparison to the other three sandy soil types. Despite its higher nutrient content, silty loam demonstrated the lowest vegetation diversity. The Shannon–Wiener index (H′), Simpson dominance index (C), Margalef richness index (D), and Pielou evenness index (Jsw) for silty loam were all lower compared to those for sand, sandy loam, and loamy sand. However, silty loam exhibited higher values in electrical conductivity (EC), urease activity (SUR), and nutrient content, including soil organic matter (SOM), ammonium nitrogen (NH4+-N), and available potassium (AK), than the other three soil textures. This study underscores the significant regulatory influence of soil texture on plant diversity in arid environments, offering new insights and practical foundations for the conservation and management of desert ecosystems.

1. Introduction

Desert ecosystems, among the most fragile terrestrial systems globally, cover 13% to 33% of the Earth’s land surface [1]. These ecosystems play vital roles in enhancing biodiversity, maintaining regional ecological equilibrium, and regulating global and regional hydrological and carbon cycles. Desert vegetation, serving as the functional foundation and critical component of these ecosystems [2], exerts crucial impacts on environmental dynamics in arid and semi-arid regions [3]. Desert areas typically endure harsh climatic conditions characterized by low precipitation, extreme temperature fluctuations, and soil salinity stress. Furthermore, desert vegetation provides indispensable ecological services by mitigating soil erosion, controlling aeolian and fluvial sediment transport, sustaining local hydrological cycles, and participating in global carbon cycling and climate regulation [4]. The plant diversity index is a key ecological indicator that reflects both community structure and ecosystem functioning [5] and is widely employed to evaluate ecosystem stability and the degree of environmental disturbance. High-diversity communities typically exhibit greater resource use complementarity and functional redundancy [6], which contribute to enhanced drought resilience and ecological stability. In resource-limited desert ecosystems, maintaining community diversity is particularly critical for supporting the coupling of soil–lant–hydrological processes [7]. From the perspectives of ecological functioning and land management, plant diversity indices not only deepen our understanding of community response mechanisms [8] but also provide a scientific basis for assessing ecosystem degradation, monitoring restoration progress, and guiding appropriate vegetation configuration in arid environments [9].
In arid zones, soil heterogeneity significantly alters spatiotemporal water distribution patterns through modified water allocation processes [10], primarily involving groundwater evaporation and surface precipitation redistribution. Under limited soil moisture conditions, vapor migration, condensation, and re-evaporation intensity are governed by soil physicochemical properties and groundwater table depth. Fine-particle soil layers establish zero-flux planes through enhanced vapor adsorption, effectively suppressing upward transport of liquid water and vapor while reducing actual evaporation rates [11]. Soil texture—a core indicator of desert soil heterogeneity [12]—directly influences infiltration-runoff equilibrium through spatial variations: sandy soils exhibit high permeability that accelerates deep percolation and minimizes surface runoff [13], whereas clayey soils with low permeability promote runoff generation and spatial precipitation reallocation. Spatial salt heterogeneity triggers salt surface accumulation via capillary action [14], lowering local soil osmotic potential and driving water migration to low-salinity zones, thereby exacerbating precipitation spatial divergence. The soil heterogeneity-driven “water-salt redistribution” mechanism [15] not only creates short-term spatiotemporal disparities in runoff–infiltration dynamics but also indirectly influences regional precipitation frequency [16] and intensity through modifications to surface albedo and localized moisture circulation [17].
Plant community distribution patterns in arid regions exhibit pronounced spatial heterogeneity, leading to the hypothesis that desert soil heterogeneity—particularly spatial variations in texture, salinity, and water availability—may serve as a key driver of vegetation distribution disparities. Numerous studies have demonstrated that vegetation distribution heterogeneity is shaped by the coordinated regulation of multiple environmental factors, including climate, topography, and soil physicochemical properties. Among these factors, soil forms the basis of habitat heterogeneity, with its physical and chemical properties directly governing vegetation growth, distribution, and diversity [18,19,20]. As one of the critical physical attributes of soil, texture plays a pivotal role in vegetation community assembly and succession by influencing soil water retention, aeration, salt migration, and nutrient availability [21]. Existing studies predominantly focus on the isolated effects of soil texture on vegetation diversity, often neglecting its interactive effects with other environmental factors [22], which may result in oversimplified interpretations of soil texture’s ecological functions. In arid zones, where water scarcity constitutes the primary limiting factor for vegetation growth, soil texture significantly modulates water interception, infiltration, and availability [23]. Consequently, investigating the relationships between soil texture types and vegetation diversity in these regions carries substantial theoretical and practical significance for ecosystem management.
This study investigates plant species diversity and its relationship with soil environmental factors—particularly how soil texture regulates nutrient and moisture distribution to influence vegetation diversity—in the arid desert region of Hami, China. Focusing on the Hami arid zone, we aimed to unravel the key mechanisms through which soil texture governs vegetation diversity. We proposed two hypotheses: (1) spatial heterogeneity in soil texture may regulate vertical and horizontal water allocation through groundwater evaporation–surface precipitation infiltration–runoff mechanisms, thereby altering soil moisture distribution patterns; (2) soil heterogeneity drives non-random plant community distributions by inducing salinity gradients and aeration changes, which impose water-salt-oxygen stress on vegetation. Our findings quantitatively revealed interactive effects between soil texture and water–salinity factors for the first time, providing a theoretical basis for context-specific soil management strategies in arid zone vegetation restoration. Crucially, this work challenges the conventional paradigm that “high-nutrient soils invariably enhance biodiversity,” advancing arid ecology from climate-dominant frameworks toward soil–climate synergy models.

2. Materials and Methods
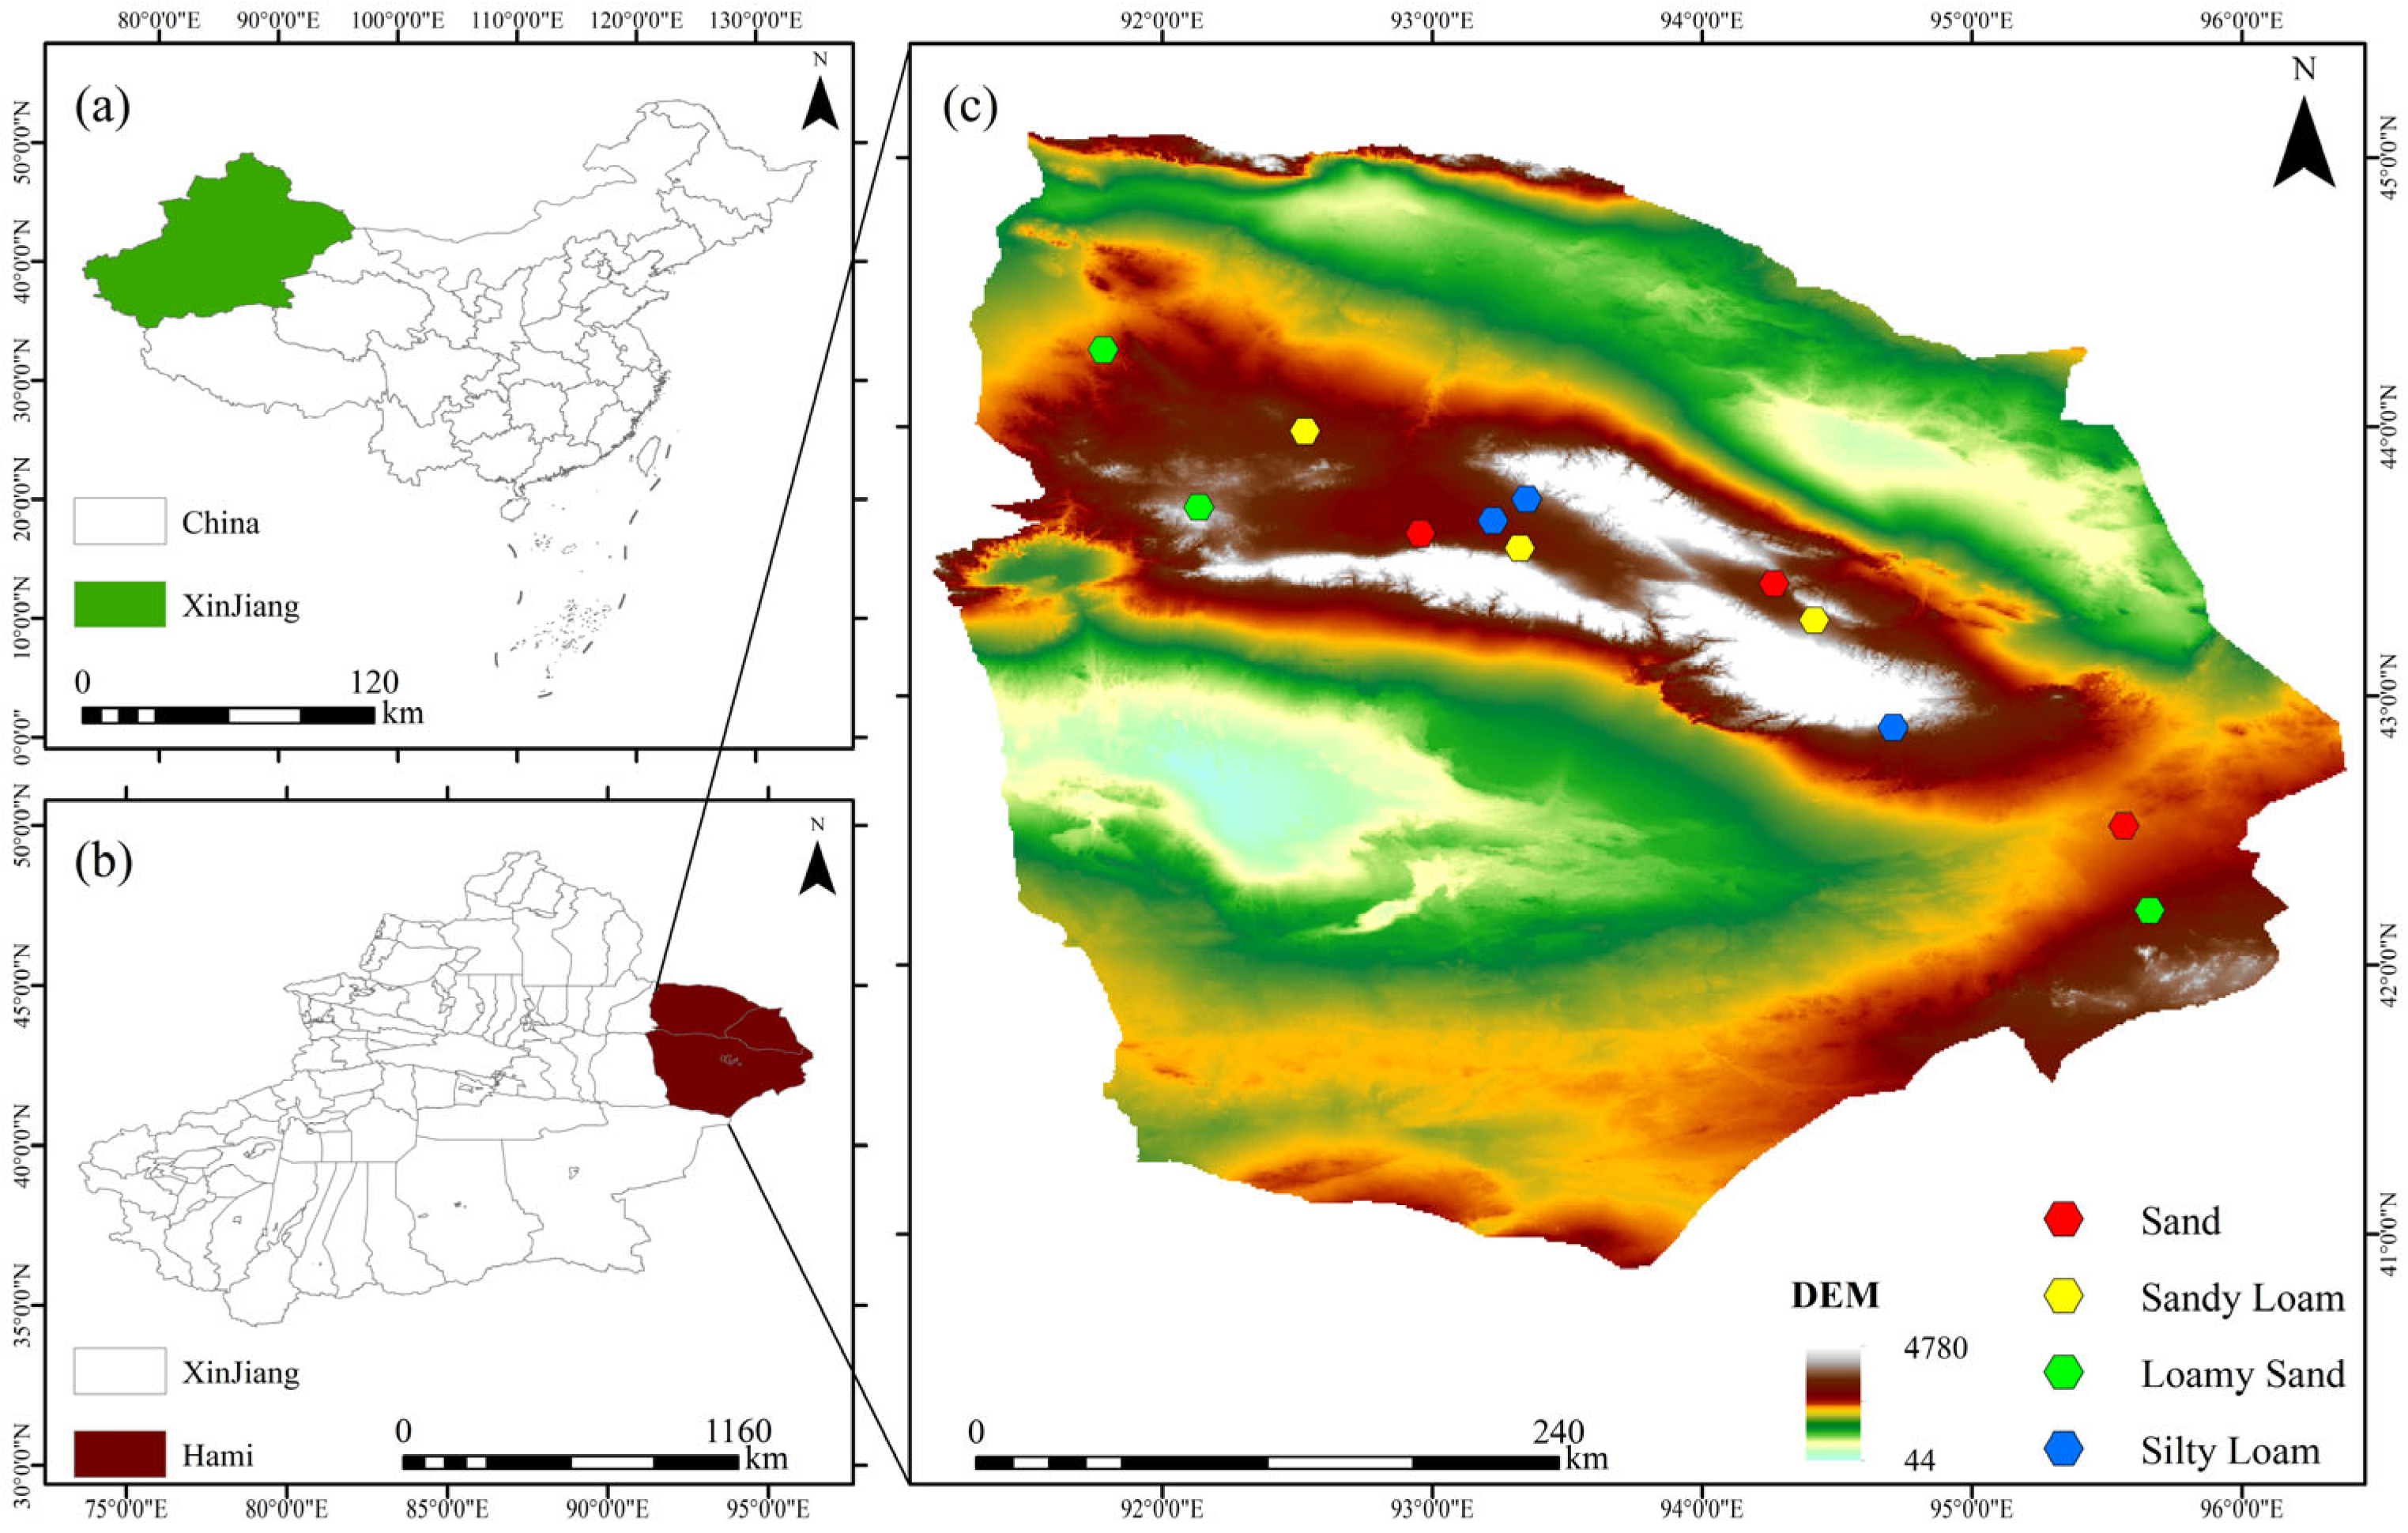
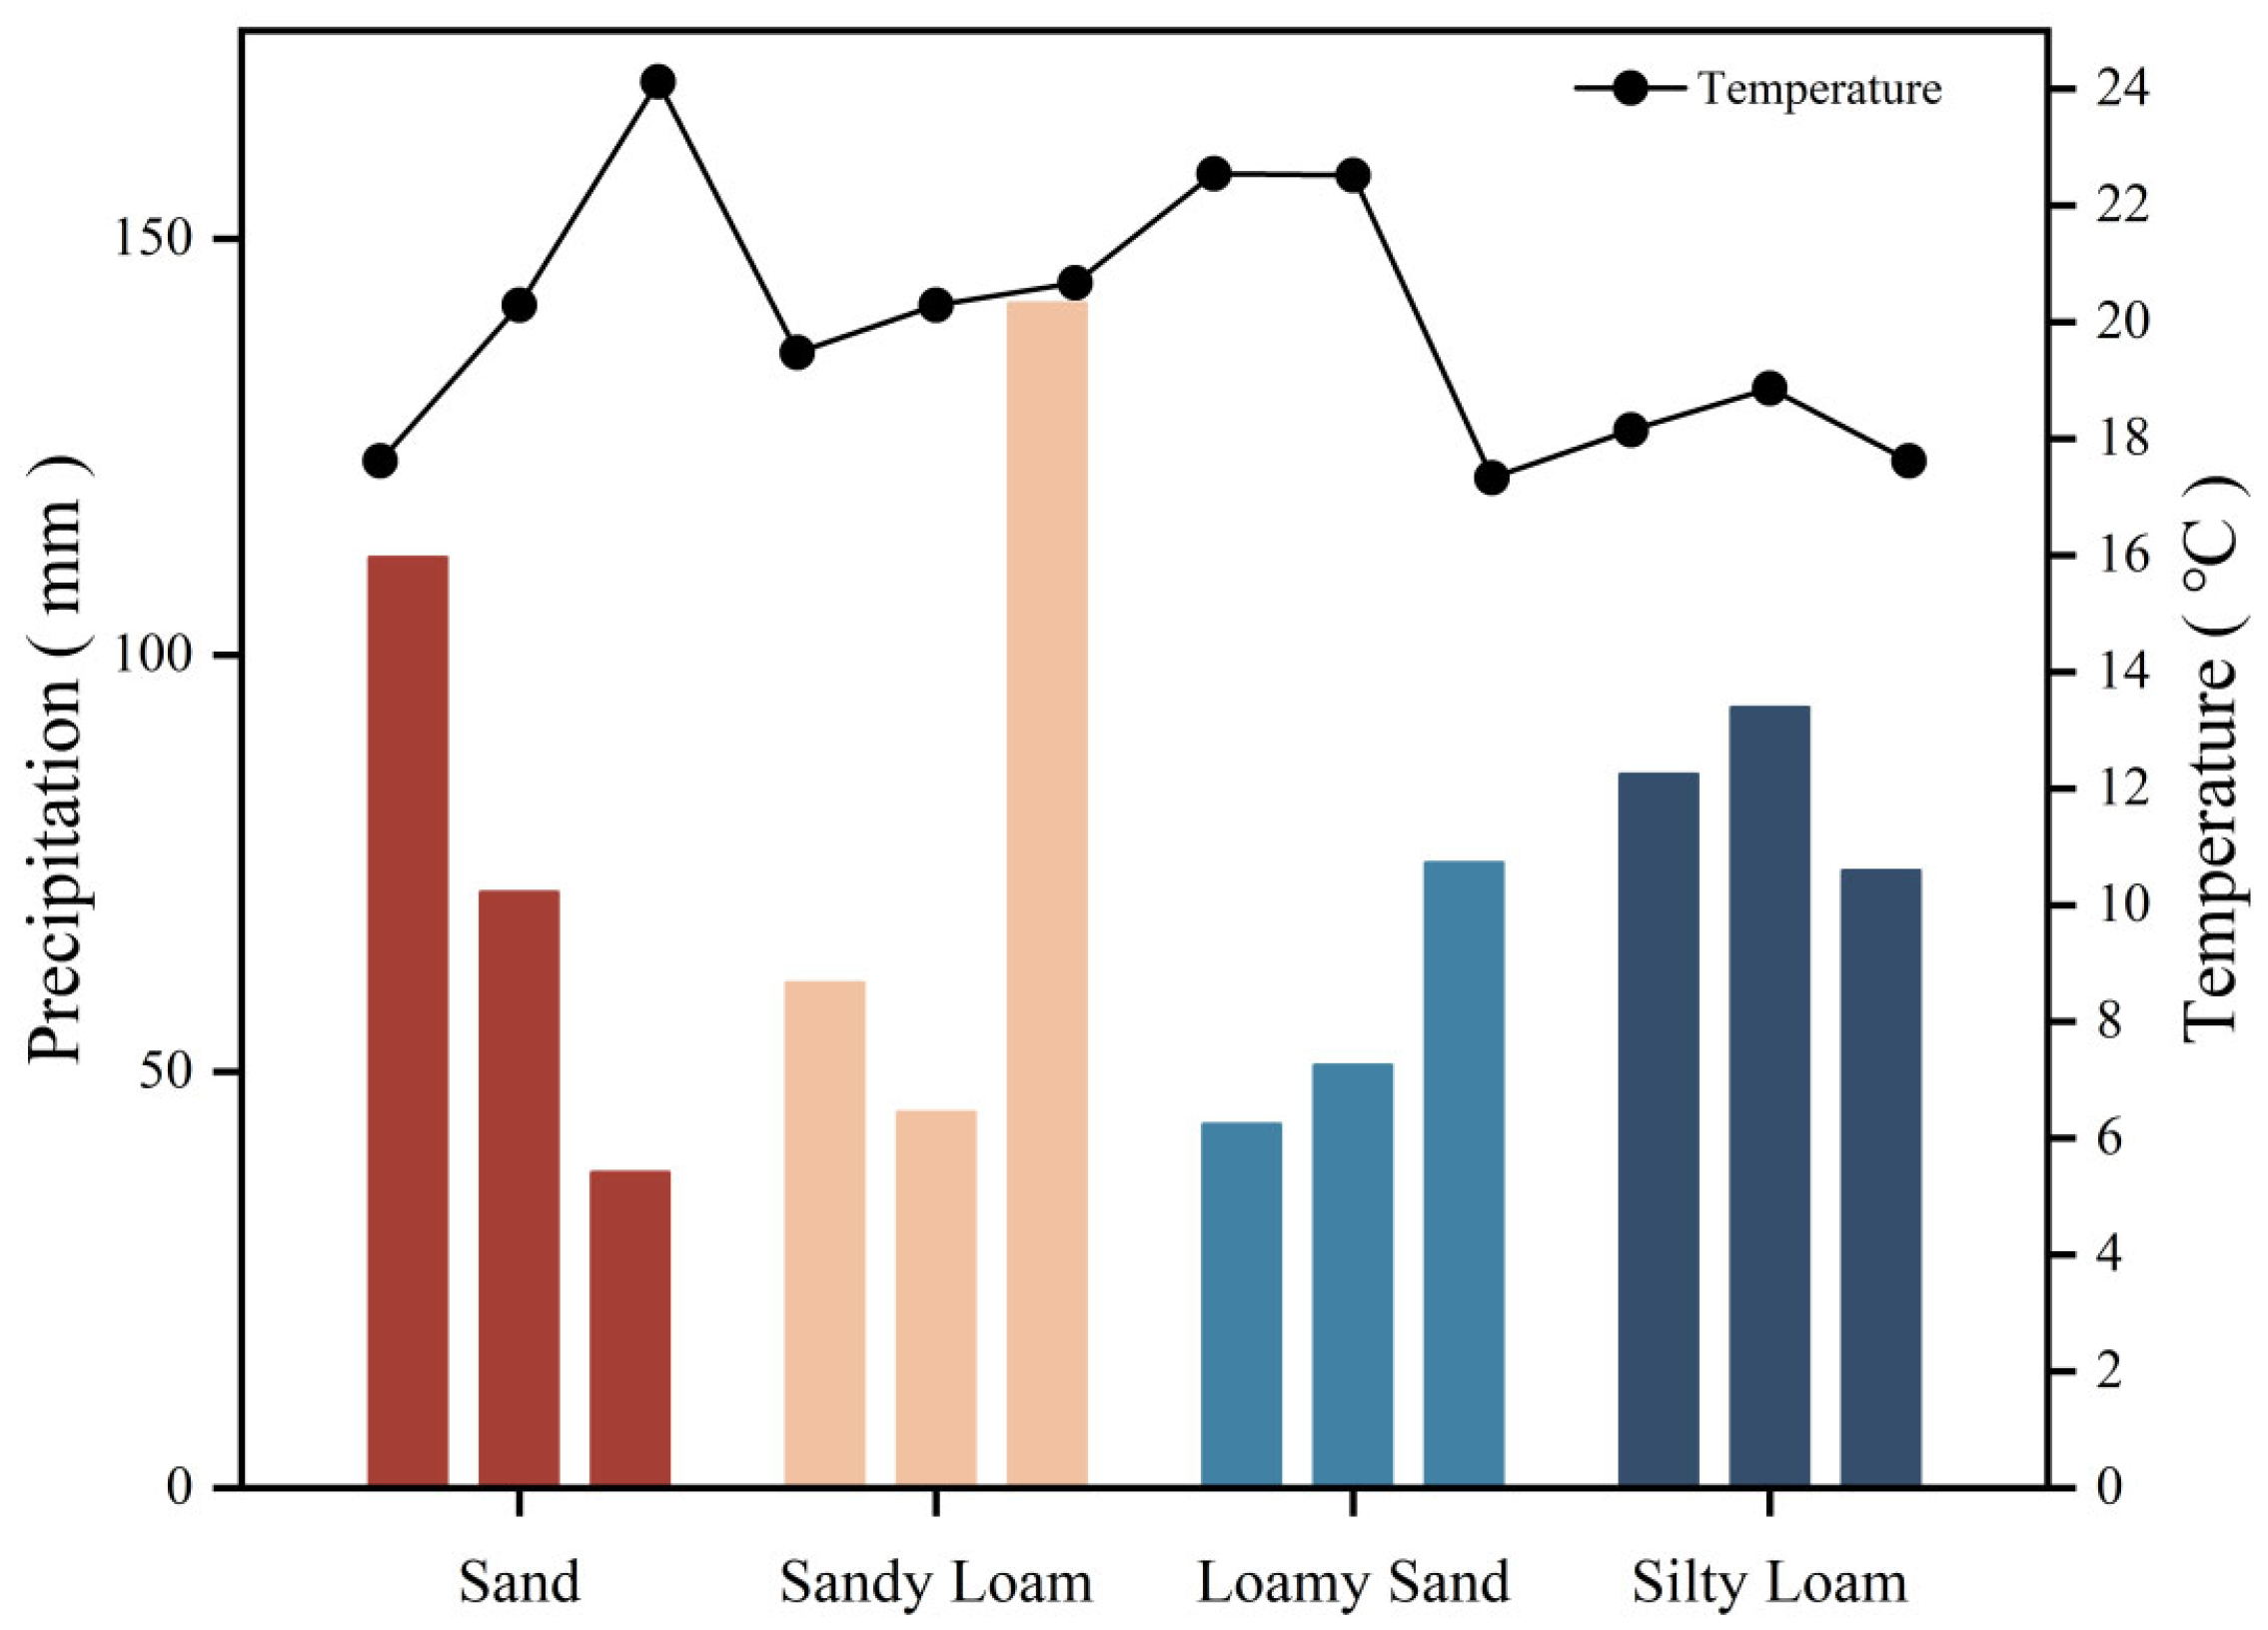
2.1. Study Site

The Hami region (91°06′33″ E–96°23′ E, 40°52′47″ N–45°05′33″ N) is situated in Western China, spanning both sides of the Tianshan Mountains at the easternmost extremity of the Xinjiang Uygur Autonomous Region (Figure 1). The Hami desert ecosystem exemplifies a temperate continental arid climate, featuring pronounced diurnal temperature fluctuations with an average daily range of 14.8 °C. Extreme temperatures reach 43 °C (max) and −32 °C (min), while the mean annual temperature stands at 9.8 °C. The frost-free period averages 182 days. Climatic conditions exhibit stark aridity, with mean annual precipitation of 33.8 mm contrasting sharply against potential annual evaporation of 3300 mm. Precipitation demonstrates marked intra-annual unevenness, predominantly concentrated between June and August. Vegetation communities display a simplified structural organization, dominated by herbaceous species including Stipa sareptana A. K. Becker, Seriphidium nitrosum var. gobicum (Krasch.) Y. R. Ling, Krascheninnikovia ceratoides (L.) Gueldenst., Agropyron cristatum (L.) Gaertn, Salsola collina Pall, Halogeton glomeratus (M. Bieb.) C. A. Mey, and Ephedra intermedia Schrenk ex C. A. Mey.

2.2. Vegetation Survey

To determine the effects of different soil textures on soil nutrient distribution, soil urease activity, and plant species diversity index, four typical soils (sand, sandy loam, loamy sand, and silty loam) were selected, and three sample plots were set up for each type of soil, where vegetation surveys and soil surveys were conducted. To ensure the accuracy of the findings and to minimize the effect of spatial autocorrelation, a random sampling design was used in this study. In order to avoid strong spatial autocorrelation between neighboring sampling sites, the distance between sampling sites was kept above 30 km. The temperature and precipitation data are shown in Figure 2, which stem from the China Meteorological Data Network (http://data.cma.cn, accessed on 24 February 2025) of the National Meteorological Information Center.
Field vegetation surveys were conducted in July 2023, with recorded data including plot coordinates (latitude, longitude), elevation, and surrounding environmental characteristics. Within each plot, standardized 1 m × 1 m herbaceous quadrats were established based on species distribution patterns to document vegetation parameters: species inventory, richness (number of species), plant height, and individual count per species. Soil samples at a 0–50 cm depth were collected using a five-point sampling method within each quadrat. Composite samples obtained by homogenizing subsamples from five profiles were processed through quartering, followed by natural air-drying, debris removal, and sieving for subsequent soil property analyses.

2.3. Soil Sampling and Experiment

The soil particle size distribution was determined via the hydrometer method. Soil pH was measured using a pH meter, while electrical conductivity (EC) was assessed with a conductivity meter (water-to-soil ratio of 5:1). Soil organic matter (SOM) content was quantified through the external heating method with sulfuric acid–potassium dichromate (H2SO4-K2Cr2O7) oxidation. Urease activity (SUR) was analyzed employing the sodium phenolate–sodium hypochlorite colorimetric method [24]. Ammonium nitrogen (NH4+-N), available phosphorus (AP), and available potassium (AK) were measured using the TuoPu YunNong soil multi-parameter analyzer. PH mater and Electrical conductivity meter is produced by Leici in Shanghai, China. The soil multi-parameter analyzer is produced by TuoPu YunNong in Hangzhou, China.

2.4. Soil Texture Classification

Soil particle size was graded according to the United States Department of Agriculture (USDA) soil texture grading standards (clay (<0.02 mm), silt (0.002–0.05 mm), very fine sand (0.05–0.1 mm), fine sand (0.1–0.25 mm), medium sand (0.25–0.5 mm), coarse sand (0.5–1 mm), and very coarse sand (1–2 mm)). The texture of the sampled soils is shown in Figure 3.

2.5. Subsection

Based on the results of the vegetation community survey, the species diversity index was calculated.The species diversity index is described by the Shannon–Wiener diversity index (H′) [25], Simpson dominance index (C) [26], Margalef richness index(D) [27], and Pielou evenness index (Jsw) [28]. The calculation methods were as follows:
Shannon–Wiener diversity index:
H = i = 1 s p i ln p i
Simpson dominance index:
C = 1 i = 1 s p i 2
Margalef richness index:
D = S 1 ln N
Pielou evenness index:
( J s w ) = H / ln S
where N is the total number of individuals of all species, S is the total number of species in the sample, and Pi is the ratio of the number of individuals of the ith species to the total number of individuals of all species. (H′) is the Shannon–Wiener diversity index, (C) is the Simpson dominance index, (D) is the Margalef richness index, and (Jsw) is the Pielou evenness index.

2.6. Data Processing

The data were statistically examined using SPSS 26.0 software, and the soil physical and chemical properties and vegetation diversity index were analyzed using one-way ANOVA, which was used to compare the differences in plant diversity in different textures of soil. Figure 1 was created using ArcMap 10.8, while Figure 2, Figure 3, Figure 4, Figure 5 and Figure 6 were created using Origin 2025.

3. Results

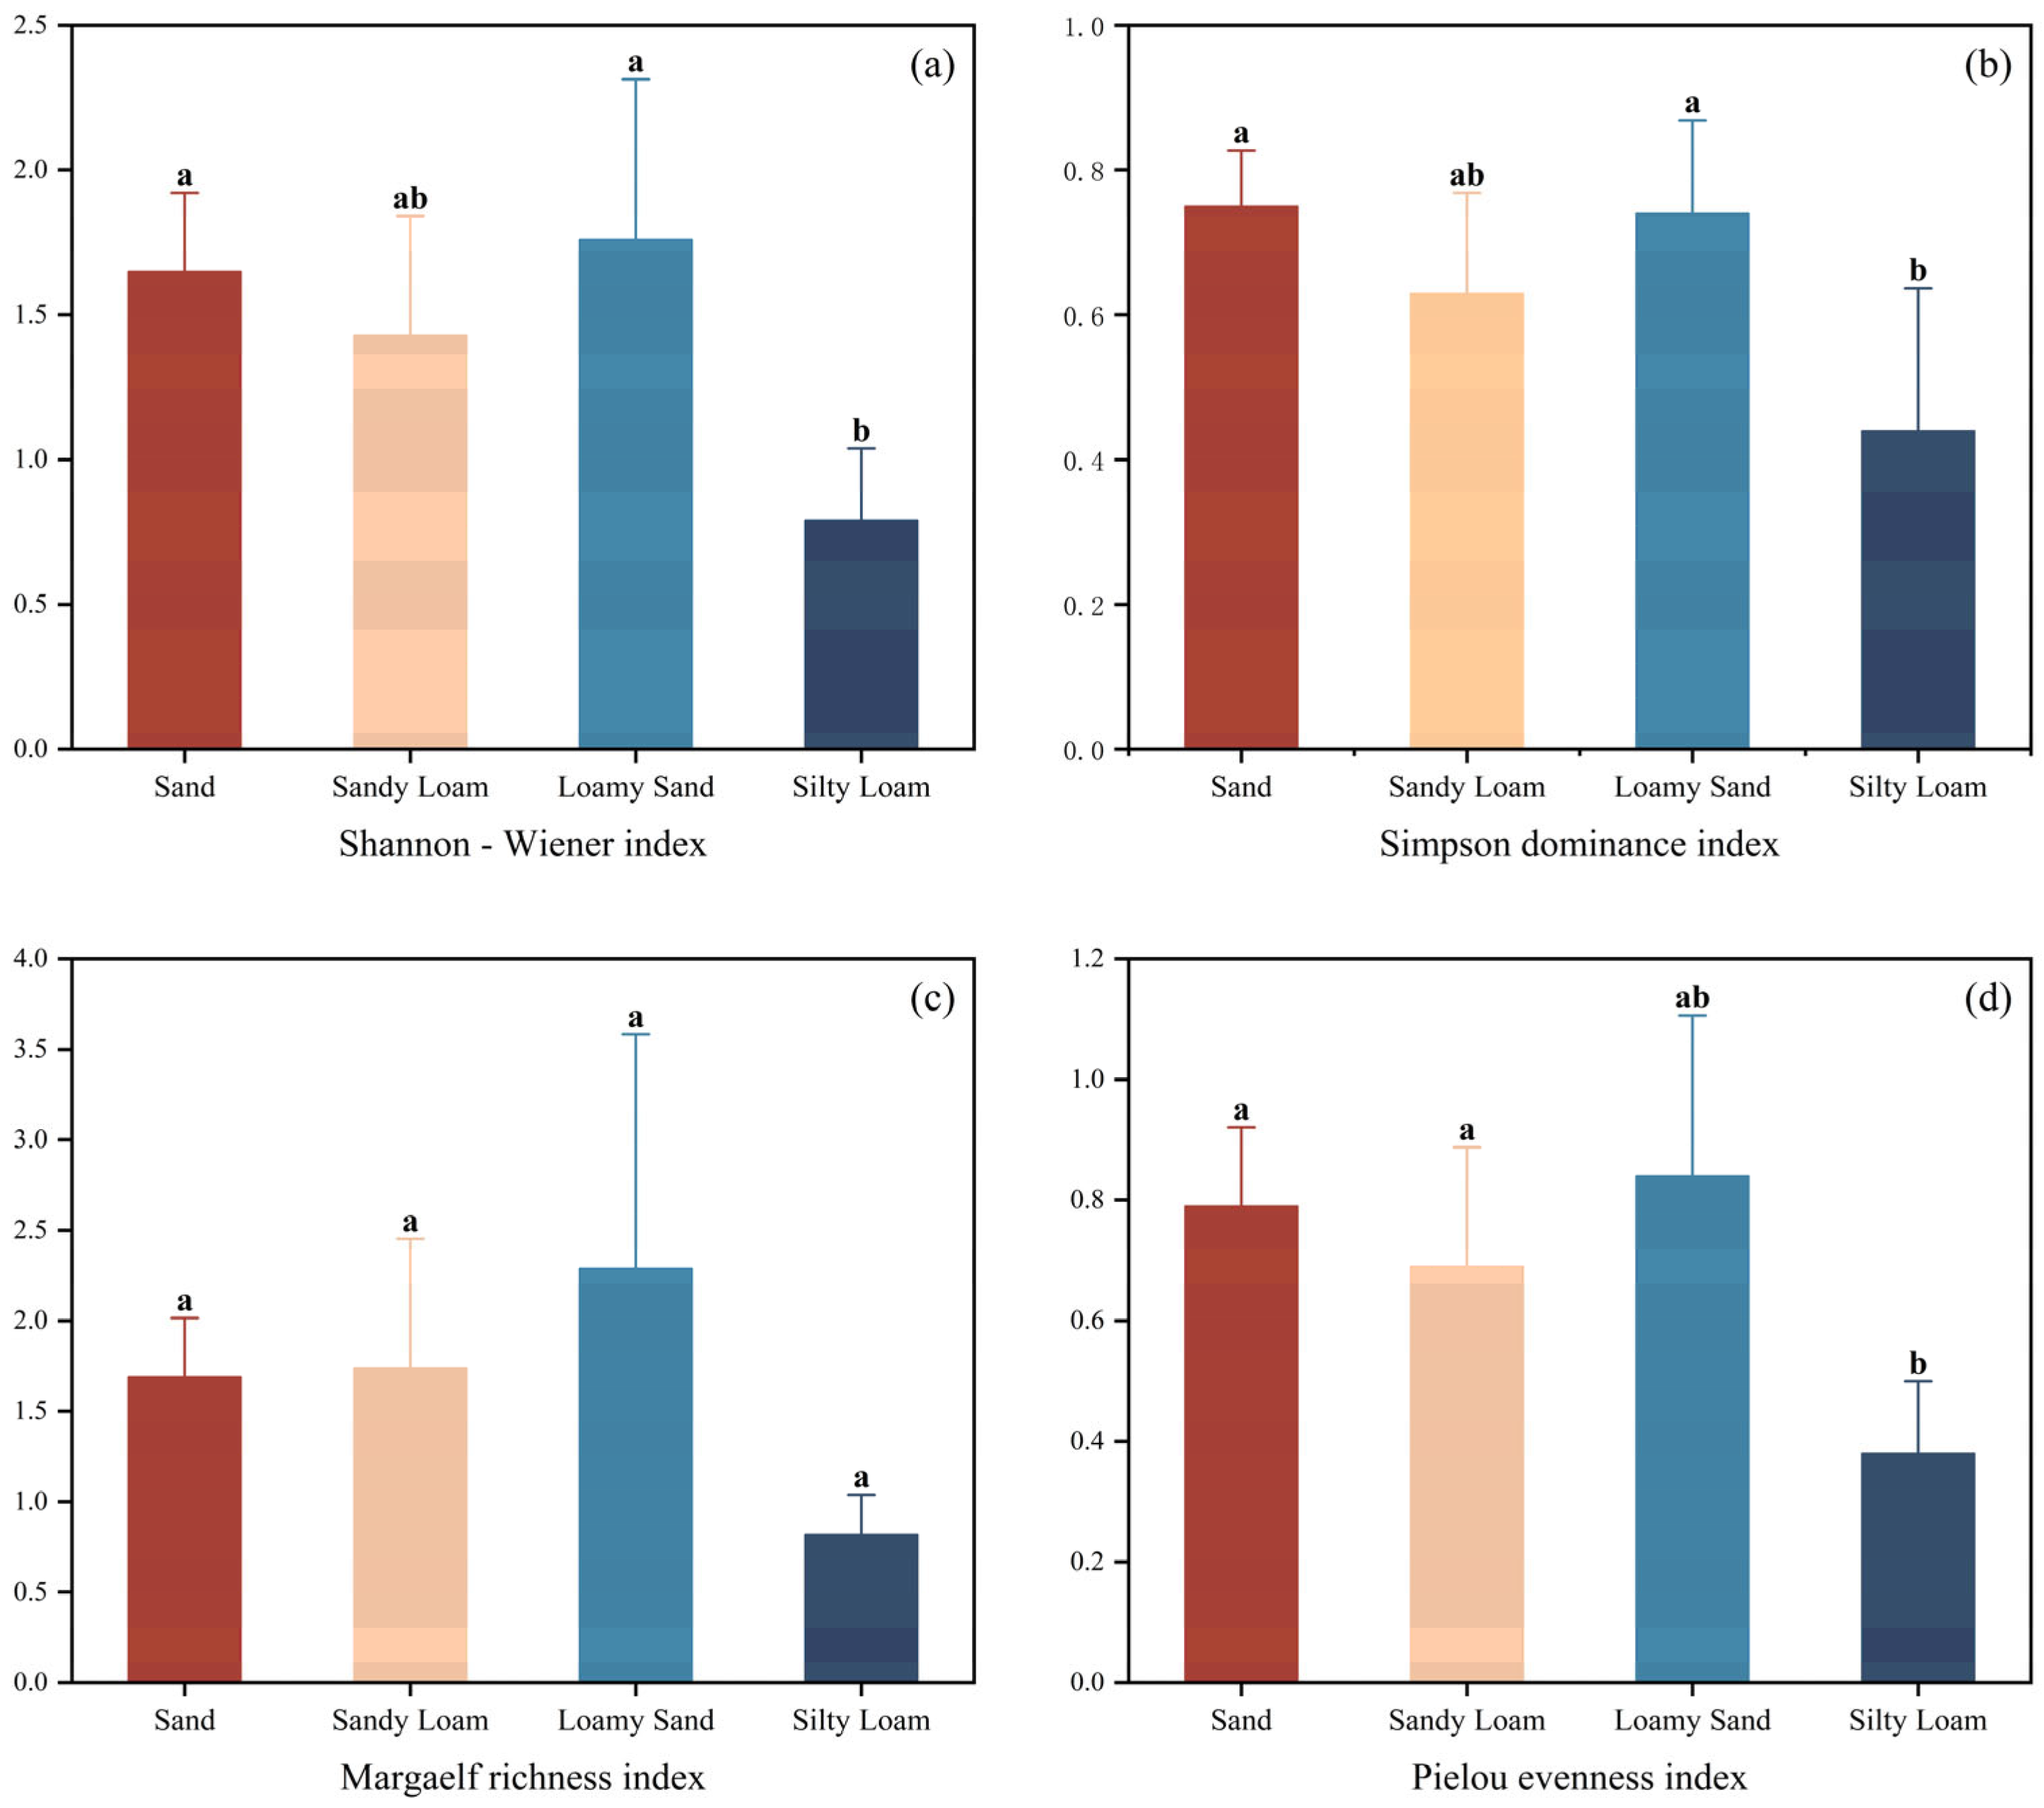
3.1. Plant Species Diversity

A total of 25 plant species belonging to 12 families and 23 genera were recorded in the study area. Species inventory, plant height, and individual count per species are shown in Supplementary Materials. Plant species diversity indices directly reflect vegetation community structure, with soil texture exerting a significant influence on these metrics. The diversity indices across four soil texture types (sand, sandy loam, loamy sand, and silty loam) are presented in Figure 4. In the Hami arid desert region, the Shannon–Wiener index (H′) ranged from 0.60 to 2.35 (mean: 1.41), the Simpson dominance index (C) ranged from 0.26 to 0.87 (mean: 0.64), the Margalef richness index (D) ranged from 0.68 to 3.76 (mean: 1.64), and the Pielou evenness index (Jsw) ranged from 0.29 to 0.97 (mean: 0.67). Overall, the study area demonstrates low biodiversity and a simplified community structure. Silty loam exhibited the lowest values across all indices: H′ (0.79), C (0.44), D (0.82), and Jsw (0.38). Conversely, loamy sand showed the highest values for H′ (1.76), D (2.29), and Jsw (0.84). Sand and sandy loam displayed comparable intermediate values: sand demonstrated H′ (1.65), C (0.75), D (1.69), and Jsw (0.79); sandy loam demonstrated H′ (1.43), C (0.63), D (1.74), and Jsw (0.69).

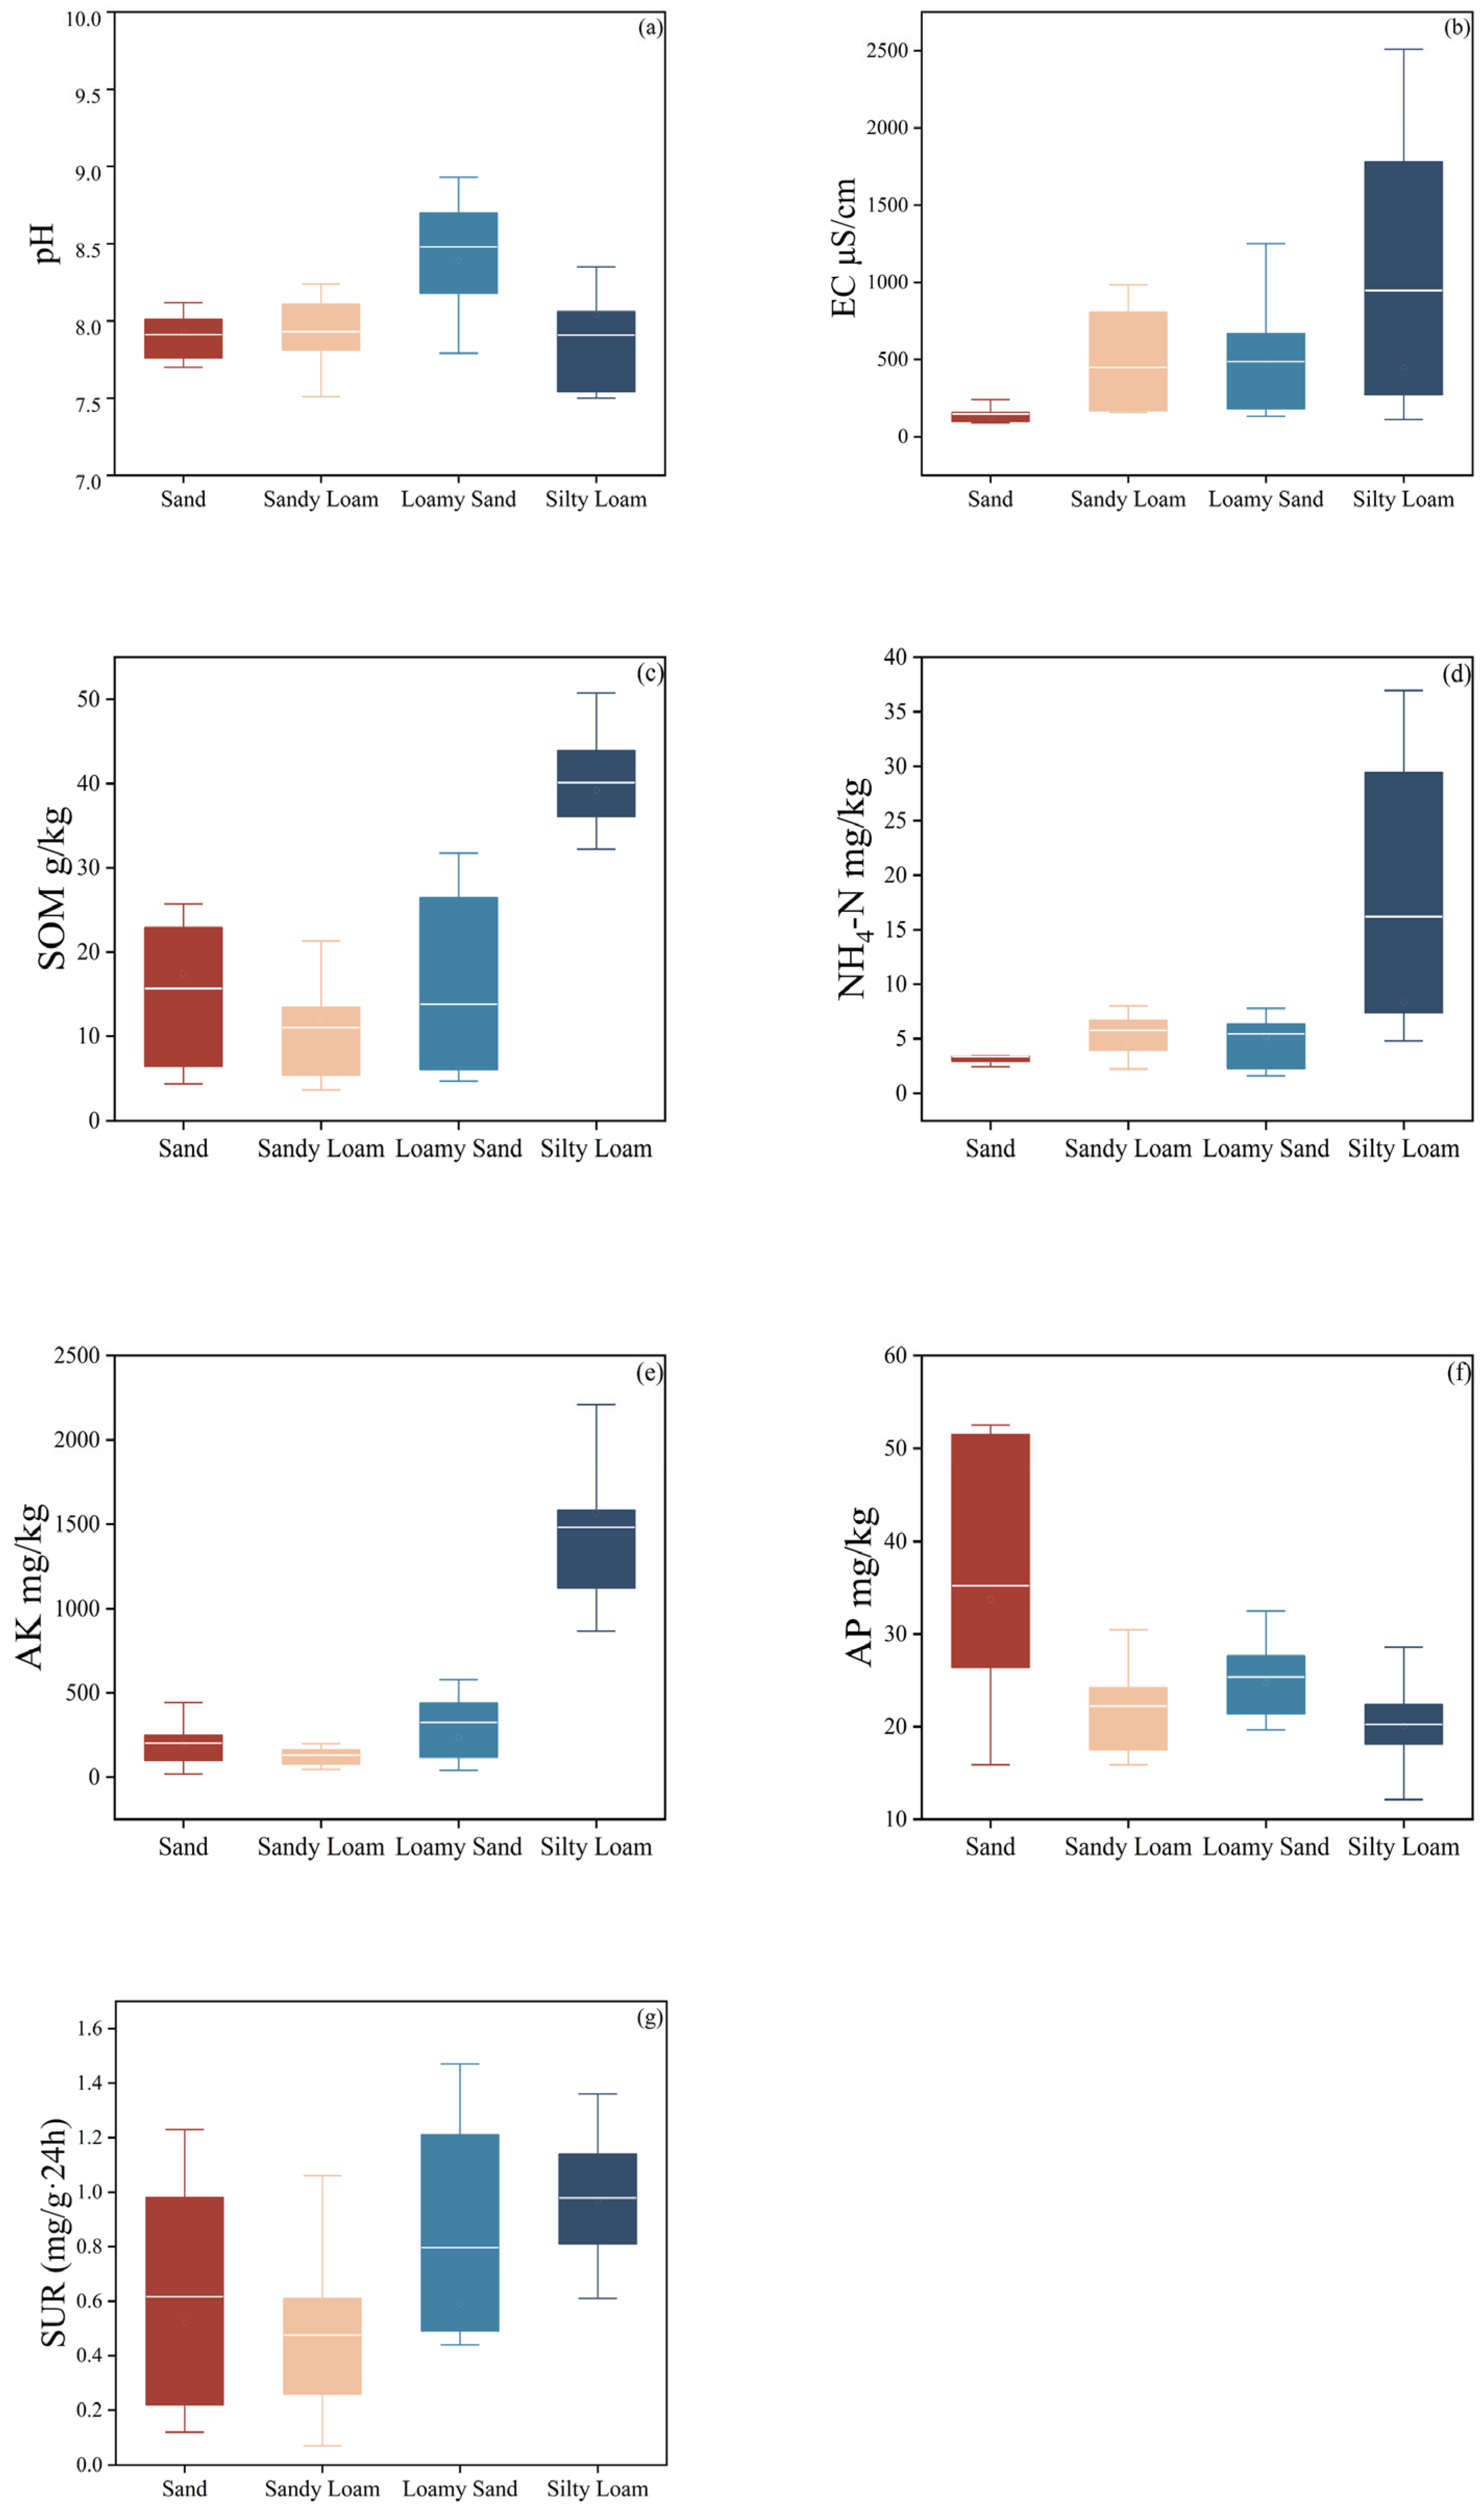
3.2. Soil Physicochemical Properties and Urease Activity

Soil pH; electrical conductivity; and soil organic matter, ammonium nitrogen, available potassium, available phosphorus contents, and urease activity of typical soils (sand, sandy loam, loamy sand, and silty loam) in the desert area are shown in Figure 5. There was some variation in pH among the four soil types. Loamy sand had the highest pH (8.47), and loamy sand was more alkaline and variable (δ = 0.29). The sandy loam had the next highest pH (7.93), was moderately alkaline in character, and had a relatively stable pH (δ = 0.05). The sandy loam had a pH (7.91), slightly lower than the sandy loam, and the data were also relatively concentrated (δ = 0.02), again exhibiting a moderately alkaline character. The silty loam had the lowest pH (7.90), which was close to neutral and had a relatively concentrated data distribution (δ = 0.09), and the pH of the soil was relatively stable.
There were significant differences in EC between soil types. The EC of silty loam (947.20 μS/cm) was significantly higher than the other three soil types, and it had the highest average EC and greater variability in EC (δ = 867,827.55). Loamy sand had the next highest EC (485.51 μS/cm), but lower than silty loam, and sandy loam had a slightly lower EC (448.96 μS/cm) than loamy sand. The lowest EC (148.16 μS/cm) was observed in sandy soil, with slight variability (δ = 3910.35).
Soil types are the central factor influencing the soil nutrient distribution, and different soil types showed different nutrient characteristics due to differences in the physical structure, chemical composition, and biological activity. Silty loam had the highest SOM (40.13 g/kg), the data distribution was relatively concentrated, and its SOM was stable (δ = 35.41). The loamy sand soil had the second-highest SOM (16.01 g/kg), but the distribution was very scattered (δ = 142.97) and had significant variability. The SOM (15.67 g/kg) content of the sandy loam was slightly higher than that of the sandy loam (11.01 g/kg), and the distribution of both was relatively concentrated (δ = 76.62 for the sandy loam and δ = 34.51 for the sandy loam).
The silty loam had the highest average NH4+-N (265.25 mg/kg) and the most dispersed distribution of data (δ = 176.72), with greater variability. The loamy sand soil had the next highest NH4+-N (16.20 mg/kg), and the data distribution was relatively concentrated (δ = 13.39). Sandy loam (6.01 mg/kg) and sandy loam (5.15 mg/kg) had relatively lower and closer NH4+-N, and the data distribution was relatively concentrated (δ = 11.25 for sandy loam and δ = 0.99 for sandy loam).
The silty loam had a much higher content of AK (1369.25 mg/kg) than the other three soil types, while the silty loam also had the most dispersed data distribution, showing great variability (δ = 204,945.76). The AK (325.39 mg/kg) content of loamy sand was significantly lower than that of silty loam, but higher than that of sandy loam and sandy sand, with relatively concentrated data (δ = 88,063.91). Sandy loam (265.25 mg/kg) and sandy loam (210.05 mg/kg) had lower and very similar AK content, and the data were also relatively concentrated (δ = 2576.66 for sandy loam and δ = 22,737.61 for sandy loam).
The AP content (34.71 mg/kg) of the sandy loam was significantly higher than that of the other three soil types, and the data distribution of the sandy loam was the most dispersed (δ = 194.52), suggesting that it had a high degree of variability in AP content. The AP content of sandy loam (21.77 mg/kg), loamy sand (22.92 mg/kg), and silty loam (20.24 mg/kg) was relatively close to the other three soil types, and the distribution of the data was also more concentrated, with a weaker variability (δ = 35.75 for sandy loam, δ = 30.99 for loamy sand, and δ = 23.20 for silty loam).
There were some differences in the SUR activity of different soil types. The highest SUR activity (0.95 mg/g·24 h) was found in the loamy loam (0.80 mg/g·24 h), slightly higher than the loamy sand (0.80 mg/g·24 h), and the distribution of the data was more centralized (δ = 0.06). Its SUR activity was also relatively stable. The SUR activity of sandy and loamy sand was lower than that of silty loam and higher than that of sandy loam (0.62 mg/g·24 h), but the data distribution of both was also more dispersed, and the variability was larger in both sandy (δ = 0.19) and loamy sand (δ = 0.16). The lowest SUR activity was found in the sandy loam (0.48 mg/g·24 h), which had a higher variability (δ = 0.09) than the silty loam. This suggests that there may be differences in plant growth and development and organic matter decomposition capacity in different soil types, which affects SUR activity.

3.3. Factors Influencing Plant Diversity

The correlation between the plant diversity index and climatic and soil factors is shown in Figure 6. Climatic factors (mean monthly temperature (Tem) and mean monthly precipitation (Pre)), soil factors (SOM, AP, and NH4+-N), and soil physical conditions (sand, silt, and EC) were significantly correlated with the index of Hami desert plant diversity. Tem was significantly correlated with the Shannon–Wiener index, Margalef index, and Pielou index (p ≤ 0.05). Pre was negatively correlated with the Shannon–Wiener index, Margalef index, and Pielou index (p ≤ 0.05). SOM was negatively correlated with the Shannon–Wiener index, Margalef index, and Pielou index (p ≤ 0.01) and negatively correlated with the Simpson index (p ≤ 0.05). AP was positively correlated with the Shannon–Wiener index, Simpson index, and Pielou index (p ≤ 0.001) and positively correlated with the Margalef index (p ≤ 0.05). NH4+-N was negatively correlated with the Shannon–Wiener index, Simpson index, and Pielou index (p ≤ 0.01). Soil sand content was positively correlated with the Shannon–Wiener index, Simpson index, and Pielou index (p ≤ 0.001) and positively correlated with the Margalef index (p ≤ 0.05). Soil silt content was negatively correlated with the Shannon–Wiener index, Simpson index, and Pielou index (p ≤ 0.01) and negatively correlated with Margalef’s index (p ≤ 0.05). pH was positively correlated with the Shannon–Wiener index, Margalef index, and Pielou index (p ≤ 0.001) and positively correlated with the Simpson index (p ≤ 0.01). EC was negatively correlated with the Simpson index (p ≤ 0.001) and negatively correlated with the Shannon–Wiener index and Pielou index (p ≤ 0.01).
Soil SUR activity was positively correlated with soil organic matter (p ≤ 0.001) and average monthly precipitation (p ≤ 0.01), positively correlated with soil silt content (p ≤ 0.05), and negatively correlated with soil sand content (p ≤ 0.05). There were significant negative correlations (p ≤ 0.05) with the Shannon–Wiener index, Margalef index, and Pielou index and highly significant negative correlations (p ≤ 0.01) with the mean monthly temperature (p ≤ 0.001) and AP (p ≤ 0.01).

4. Discussion

4.1. Effects of Soil Texture on Plant Species Diversity

Vegetation diversity is influenced by a variety of environmental factors. In arid and semi-arid deserts, climatic factors significantly affect vegetation diversity through a combination of mechanisms [29]. Climatic factors, such as mean annual precipitation, relative humidity, and mean annual air temperature, play a more important role in vegetation diversity in arid deserts [30]. Air temperature significantly affects the Simpson dominance diversity index by controlling thermal conditions via water evaporation [31]. In the semi-arid region of the Western Loess Plateau, precipitation is probably the most important environmental factor driving the change and diversity of shrublands (desert, alpine, and secondary shrublands) [32]. Factors such as precipitation and its distribution, temperature changes, and evapotranspiration not only directly affect plant growth and reproduction but also indirectly regulate vegetation diversity by altering soil water and nutrient dynamics, competitive relationships among species, and ecosystem stability [33]. While climate-driven abiotic factors shape vegetation diversity, their synergistic effects with soil nutrients are particularly critical [34]. When conditions such as moisture and temperature indirectly affect species competition by altering the soil environment, the spatial distribution and availability of nutrients further provide a resource base for ecological niche differentiation [35]. Under the condition of sufficient soil nutrient supply, different species can develop unique ecological niches, reduce direct competition, and promote species coexistence, demonstrating the promotional effect of nutrients on vegetation diversity [36]. Du believed that soil water content, organic matter, soluble salts, and surface temperature are the main factors affecting plant diversity, productivity, and community stability in the arid gravel desert area [37]. However, during field surveys in the arid desert region of Hami, we observed a counterintuitive phenomenon: the vegetation diversity of sandy soils was significantly higher than that of silty loam, which is more capable of retaining water and fertilizer. The species richness of annual herbaceous plants in sandy soils was 30–50% higher than that in silty loam areas, and the community Pielou index was elevated by about 0.2–0.3. However, in this study, we found that the main influencing factor of vegetation diversity was soil texture, and that the distribution of the different soil grain sizes and their degree of evenness greatly influence the physicochemical properties of soil such as water infiltration, salt distribution, and aeration [38]. Based on the above mechanisms, we suggest that in arid zones, soil texture may synergistically alter water distribution patterns, alleviate salinity and oxygen stress, and influence soil heterogeneity and hence desert plant diversity.
Silty loam has a particle composition dominated by silt (0.002–0.05 mm, 70–90%), which is able to effectively sequester mineral nutrients through silt–clay composite colloids and has a higher electrical conductivity and nutrient content, such as organic matter, than sandy soils, but with insufficient aeration and water permeability [39]. Under arid conditions, the key limiting factor for plant growth is often water rather than nutrients. Under extreme water stress conditions in the arid regions of Hami, drought-tolerant annual herbaceous plants are often found in the vegetation communities. These plants may be more likely to coexist and develop higher diversity in well-aerated and drained soils such as sand, sandy loam, and loamy sand. This is because sandy, sandy loam, and loamy sand soils, which are macroporous sandy soils, can rapidly infiltrate in a short period of time after precipitation [40], which reduces the retention time of water on the soil surface, thus decreasing the amount of evaporation of precipitation and increasing the amount of water available to plants [41]. The ability of silty loam to provide relatively stable nutrient and water conditions under low precipitation [42] may be more conducive to the dominance of a small number of plants adapted to this environment with high nutrient uptake capacity and tolerance to low oxygen, rather than promoting the coexistence of multiple species. Silty loams, due to their lower drainage and denser pore structure, can lead to the accumulation of salts in the soil, which can cause osmotic stress and ionic toxicity to plants, limiting plant growth and reproduction, with only a few salt-tolerant plants able to survive in this environment [43]. This may have contributed to the lower plant diversity index of the loamy sand soils. The fine pore structure of silty loam also results in poor aeration and a relative lack of oxygen in the soil [44], which can be a limitation to diverse plant communities, especially species that require deep-rooted respiration and good aeration conditions. Despite the high nutrient content of silty loam soils, effective nutrient utilisation is water-limited under arid conditions, resulting in dominant species crowding out others through competition, reducing species richness of vegetation [45]. Soil heterogeneity is a key factor influencing vegetation diversity, with sandy soils promoting plant diversity by optimizing water use, and fine-grained soils suppressing plant diversity due to salt accumulation and low oxygen stress, leading to a homogenous community structure.

4.2. Relationship Between Soil Texture and Physicochemical Properties and Urease Activity

By analyzing the physicochemical properties, nutrient content, and urease activity of the soils, it was found that homogeneously textured sand and loamy sand soils usually showed low variability, suggesting that their physical and chemical properties were more consistent. Conversely, silty loams were complex in texture and contained a variety of grain-size components, resulting in higher coefficients of variation for electrical conductivity (EC) and nutrient content, showing greater instability and heterogeneity. Sandy loam, although more complex in particle size distribution than sand, still has less variability and shows good stability and adaptability.
The physical properties of soil indirectly regulate nutrient effectiveness and spatial distribution by affecting water distribution and vegetation growth [45]. The uniformity of the particle size distribution of soil largely determines the type and scale distribution of soil pore structure, which in turn affects the accumulation and distribution of soil nutrients and soil moisture retention capability [46]. Silty loam is highly water retentive and relatively poorly drained, but provides a more stable moisture environment for plant root growth and microbial activity. The fine particulate matter of silty loam can adsorb enzymes and substrates to form enzyme–substrate complexes [47], which provide favorable conditions for soil enzymes. Under relatively well-watered conditions [48], the inter-root action is strong and urease activity is elevated, demonstrating the advantages of silty loam in urease activity. The urease activity was not directly controlled by the determination of particle size distribution of soil but was more driven by moisture conditions, nutrient conditions, and vegetation status [49]. Nutrient enrichment in silty loam was also highly influenced by the synergistic effects of moisture and vegetation, with moisture increasing the efficiency of nutrient uptake and redistribution by plants [50], promoting organic matter accumulation and mineralization [51]. The role of the soil’s physical structure on nutrients is more reflected in its function of regulating the water retention capacity and vegetation growth [52] rather than directly affecting the nutrients themselves.
The differences in the determination of particle size distribution and pore characteristics shape the microenvironmental conditions of the soil to a certain extent. Silty loam contains a multilevel particle size distribution component, and its internal pore structure is more complex, with both large pores providing a channel for the rapid passage of water and small pores providing a place for water retention and soil nutrient enrichment [53]. Soil fine particles can adsorb and retain water and nutrients [4]. The surface area of the fine-grained component of the silt is large, which can adsorb water and organic matter, improving the soil’s ability to retain water and nutrients [54]. The stability of soil aggregates is also affected by the particle size distribution, which in turn affects the soil’s resistance to erosion and carbon sequestration [55]. This porous hierarchical structure creates a diverse microenvironment at the micro-scale, allowing stable accumulation and a slow decomposition of organic matter in small pores or within aggregates [56], leading to a more heterogeneous distribution of soil nutrients in space. Soil texture fundamentally affects the accumulation and distribution of soil nutrients in the soil, as well as the water retention capacity and stability of the soil by regulating the complexity of the soil pore structure and microenvironment [57], which in turn determines the selection of plant habitats and growth and development.

5. Conclusions

In this study, we focused on four typical soils in Hami—sand, sandy loam, loamy sand, and silty loam, which differ significantly in terms of particle composition, pore structure, and water-holding capacity—to gain insights into the effects of soils with different particle size distributions on the soil physicochemical properties, nutrient status, and urease activity of desert plant community diversity. Our results suggest the following: (1) In arid desert areas, soil texture is the main controlling factor driving plant community diversity by regulating water distribution, salt accumulation and aeration heterogeneity. Sandy loam supported the coexistence of multiple plant species due to rapid water infiltration and low water–salt coupled stress, while silty loam, despite being nutrient-rich, led to community homogenization due to high salt accumulation and insufficient aeration. (2) The spatial differentiation of soil nutrients and urease activity mainly stems from the differences in physical structure due to soil texture and its joint regulation of water–biological processes. Sandy soils accelerated water infiltration and nutrient leaching due to a homogeneous macroporous network, resulting in low nutrient retention and limited urease activity, while silty loams promoted nutrient adsorption and enrichment through fine particulate matter and enhanced microbial activity and rooting through a relatively high water-holding capacity, thus driving high spatial partitioning of urease activity and nutrients. These results enhance our understanding of the mechanisms that maintain biodiversity in desert ecosystems, provide important insights into broader ecological processes, and may inform strategies to conserve biodiversity in this fragile environment under future climate change. Current conclusions are based on short-term observations, and more in-depth research observations of texture–diversity feedback mechanisms under long-term drought stress are still needed. The study of plant species diversity patterns and their relationship with soil texture will further deepen our understanding of the structure and function of desert ecosystems, improve our ability to restore and conserve desert ecosystems and species, and thus enhance the conservation of plant biodiversity in fragile arid and semi-arid ecosystems.

Supplementary Materials

The following supporting information can be downloaded at: https://www.mdpi.com/article/10.3390/soilsystems9030084/s1, Table S1: Sand, sandy loam, loamy sand, and silty loam—the results of field vegetation surveys, including species inventory, plant height, and individual count per species.

Author Contributions

Conceptualization, S.W. and C.L.; methodology, S.W. and C.L.; formal analysis, S.W., Z.L. and Y.W.; investigation, S.W., C.L., Z.L. and Y.W.; writing—original draft preparation, S.W.; writing—review and editing, C.L.; supervision, Z.L. and Y.W. All authors have read and agreed to the published version of the manuscript.

Funding

This research was funded by the “Key Research and development projects of Xinjiang Uygur Autonomous Region”, with grant number 2022B03025-5, and the “Key Issues and Key Technologies Research on Integrated Protection and Restoration Project of Mountains, Waters, Forests, Farmlands, Lakes, Grasses, and Sands in the Important Source Area of Tarim River (Aksu River Basin), Xinjiang”, with grant number AKSSSXM2022620.

Institutional Review Board Statement

Not applicable.

Informed Consent Statement

Not applicable.

Data Availability Statement

Data supporting the reported results can be provided upon request.

Conflicts of Interest

The authors declare no conflicts of interest.

References

  1. Cao, Y.; Nie, M.; Shen, Y.; Hu, Y.; Ma, D.; Li, D.; Hou, T.; Fang, P.; Wang, X. Changes in vegetation and soil characteristics and their correlations in grasslands at different stages of degradation on the desert steppe in an arid wind-sandy area of Ningxia. Acta Pratacult. Sin. 2024, 33, 1–14. [Google Scholar]
  2. Zhang, F.; Zhang, L.; Wang, W.; Wang, X. Relationships Between Characteristic of Soil Nutrients and Soil Texture and Moisture in Wind-Water Erosion Crisscross Region. J. Soil Water Conserv. 2012, 26, 99–104. [Google Scholar]
  3. Miao, J.; Li, S.; Xu, X.; Liu, G.; Wang, H.; Fan, J.; Akhmadi, K. Benefits and ecological restoration implications of hanging grass fences in Mongolian desert steppe. J. Arid Land 2024, 16, 1541–1561. [Google Scholar] [CrossRef]
  4. Yan, Y.; Xin, X.; Xu, X.; Wang, X.; Yang, G.; Yan, R.; Chen, B. Quantitative effects of wind erosion on the soil texture and soil nutrients under different vegetation coverage in a semiarid steppe of northern China. Plant Soil 2013, 369, 585–598. [Google Scholar] [CrossRef]
  5. Broecher, M.; Meyer, S.T.; Eisenhauer, N.; Ebeling, A. The positive plant diversity/consumer relationship is independent of grassland age. BASIC Appl. Ecol. 2024, 76, 58–68. [Google Scholar] [CrossRef]
  6. Liu, Q.; Shi, J.; Ma, Y.; Wang, Y.; Wang, X.; Lyu, L.; He, M.; Cai, Z. Relationship between plant diversity and community stability in alpine mining areas. J. Mt. Sci. 2025, 22, 901–912. [Google Scholar] [CrossRef]
  7. Dietrich, P.; Ebeling, A.; Meyer, S.T.; Asato, A.E.B.; Broecher, M.; Gleixner, G.; Huang, Y.; Roscher, C.; Schmid, B.; Vogel, A.; et al. Plant diversity and community age stabilize ecosystem multifunctionality. Glob. Change Biol. 2024, 30, e17225. [Google Scholar] [CrossRef] [PubMed]
  8. Cui, Z.; Sun, J.; Wu, G.-L. Plant diversity increases spatial stability of aboveground productivity in alpine grasslands. Oecologia 2024, 205, 27–38. [Google Scholar] [CrossRef] [PubMed]
  9. Wang, B.; Zhu, Y.; Yang, X.; Shan, D.; Wang, D.; Tu, Y.; Shi, Z.; Indree, T. Effects of plant diversity and community structure on ecosystem multifunctionality under different grazing potentials in the eastern Eurasian steppe. Sci. Total Environ. 2024, 934, 173128. [Google Scholar] [CrossRef] [PubMed]
  10. English, N.B.; Weltzin, J.F.; Fravolini, A.; Thomas, L.; Williams, D.G. The influence of soil texture and vegetation on soil moisture under rainout shelters in a semi-desert grassland. J. Arid Environ. 2005, 63, 324–343. [Google Scholar] [CrossRef]
  11. Liu, X.; Chen, X.; Wang, L.; Zhang, Y.; Cheng, Q. Effect of vapour transport on soil evaporation under different soil textures and water table depths in an arid area of Northwest China. Hydrol. Process. 2023, 37, e14821. [Google Scholar] [CrossRef]
  12. Sager, C.; Airo, A.; Mangelsdorf, K.; Arens, F.L.; Karger, C.; Schulze-Makuch, D. Habitability of Polygonal Soils in the Hyper-Arid Atacama Desert After a Simulated Rain Experiment. J. Geophys. Res. Biogeosci. 2023, 128, e2022JG007328. [Google Scholar] [CrossRef]
  13. Li, D.; Wang, S.; Li, X.; Mao, X.; Cao, T. Experimental Study on One-dimensional Permeability of Sandy Clayey Purple Soil at Unsaturated Condition. Chin. J. Undergr. Space Eng. 2020, 16, 373–380. [Google Scholar]
  14. Dai, S.; Shin, H.; Santamarina, J.C. Formation and development of salt crusts on soil surfaces. ACTA Geotech. 2016, 11, 1103–1109. [Google Scholar] [CrossRef]
  15. Shokri-Kuehni, S.M.S.; Vetter, T.; Webb, C.; Shokri, N. New insights into saline water evaporation from porous media: Complex interaction between evaporation rates, precipitation, and surface temperature. Geophys. Res. Lett. 2017, 44, 5504–5510. [Google Scholar] [CrossRef]
  16. Sadeghi, M.; Babaeian, E.; Tuller, M.; Jones, S.B. Particle size effects on soil reflectance explained by an analytical radiative transfer model. Remote Sens. Environ. 2018, 210, 375–386. [Google Scholar] [CrossRef]
  17. Yuan, G.; Zhang, L.; Liu, Y. Impacts of soil moisture and atmospheric moisture transport on the precipitation in two typical regions of China. Atmos. Res. 2021, 247, 105151. [Google Scholar] [CrossRef]
  18. Su, J.; Zhao, X.; Li, G. Distribution pattern of plant community and its relationship with environmental factors in Qilian Mountains National Nature Reserve of Gansu Province. Guihaia 2022, 42, 450–459. [Google Scholar]
  19. Zhang, H.; Zou, W.; Chen, Z.; He, L.; Peng, X.; Wang, G.; Peng, P.; Li, J.; Shi, S. Distribution pattern of plant communities and its relationship with environmental factors in eastern Xizang, China. Chin. J. Appl. Environ. Biol. 2023, 29, 1289–1297. [Google Scholar] [CrossRef]
  20. Wang, Z.; Pan, C. Spatial Distribution of Vegetation Community and Environmental Interpretations in Desert-oasis Ecotone in the Lower Reaches of Tarim River. Xinjiang Agric. Sci. 2009, 46, 449–458. [Google Scholar]
  21. Lund, E.D.; Wolcott, M.C.; Hanson, G.P. Applying nitrogen site-specifically using soil electrical conductivity maps and precision agriculture technology. Sci. World J. 2001, 1, 767–776. [Google Scholar] [CrossRef] [PubMed]
  22. Austin, A.T.; Yahdjian, L.; Stark, J.M.; Belnap, J.; Porporato, A.; Norton, U.; Ravetta, D.A.; Schaeffer, S.M. Water pulses and biogeochemical cycles in arid and semiarid ecosystems. Oecologia 2004, 141, 221–235. [Google Scholar] [CrossRef] [PubMed]
  23. Alaoui, A. A Simple Method to Assess Key Soil Hydraulic Properties. Water 2023, 15, 467. [Google Scholar] [CrossRef]
  24. Liu, X.; Wang, J.; Zhao, X. Effects of simulated nitrogen deposition on the soil enzyme activities in a Pinus tabulaeformis forest at the Taiyue Mountain. Acta Ecol. Sin 2015, 35, 4613–4624. [Google Scholar]
  25. Shannon, C.E. A mathematical theory of communication. Bell Syst. Tech. J. 1948, 27, 379–423. [Google Scholar] [CrossRef]
  26. Simpson, E.H. Measurement of diversity. Nature 1949, 163, 688. [Google Scholar] [CrossRef]
  27. Margalef, R. Diversidad de Especies en las Comunidades Naturales; Instituto de Biología Aplicada: Barcelona, Spain, 1951. [Google Scholar]
  28. Pielou, E.C. The measurement of diversity in different types of biological collections. J. Theor. Biol. 1966, 13, 131–144. [Google Scholar] [CrossRef]
  29. An, N.; Guo, B.; Zhang, D.; Yang, Q.; Luo, W. Desert vegetation composition and spatial distribution of soil nutrients in the middle section of Hexi Corridor. Arid Zone Res. 2024, 41, 432–443. [Google Scholar]
  30. Zhou, S.; Duan, Y.; Zhang, Y.; Guo, J. Vegetation dynamics of coal mining city in an arid desert region of Northwest China from 2000 to 2019. J. Arid Land 2021, 13, 534–547. [Google Scholar] [CrossRef]
  31. Karatassiou, M.; Parissi, Z.M.; Panajiotidis, S.; Stergiou, A. Impact of Grazing on Diversity of Semi-Arid Rangelands in Crete Island in the Context of Climatic Change. Plants 2022, 11, 982. [Google Scholar] [CrossRef] [PubMed]
  32. Hou, H.; Zhang, Y.; Zhou, J.; Guo, Y.; Liu, H.; Li, Y.; Gao, S. Aridity and Soil Properties Drive the Shrub–Herb Interactions Along Drought Gradient in Desert Grassland in Inner Mongolia. Agronomy 2024, 14, 2588. [Google Scholar] [CrossRef]
  33. Lundell, S.; Batbaatar, A.; Carlyle, C.N.; Lamb, E.G.; Otfinowski, R.; Schellenberg, M.P.; Bennett, J.A. Plant responses to soil biota depend on precipitation history, plant diversity, and productivity. Ecology 2022, 103, e3784. [Google Scholar] [CrossRef] [PubMed]
  34. Zhao, Y.; Zhao, M.; Qi, L.; Zhao, C.; Zhang, W.; Zhang, Y.; Wen, W.; Yuan, J. Coupled Relationship between Soil Physicochemical Properties and Plant Diversity in the Process of Vegetation Restoration. Forests 2022, 13, 648. [Google Scholar] [CrossRef]
  35. Yao, K.; Wang, Y.; Wu, Y. Competition and Niche Differentiation of Water and Nutrients between Broussonetia papyrifera and Platycladus orientalis under Prolonged Drought Stress. Agronomy 2022, 12, 1489. [Google Scholar] [CrossRef]
  36. Klimek, S.; Marini, L.; Hofmann, M.; Isselstein, J. Additive partitioning of plant diversity with respect to grassland management regime, fertilisation and abiotic factors. Basic Appl. Ecol. 2008, 9, 626–634. [Google Scholar] [CrossRef]
  37. Du, H.; Fan, P.; Bi, Y.; Xie, S.; Liu, Y.; Liu, Y. Plant Community Characteristics and Their Relationship with Environmental Factors in Different Geomorphic Units in Arid Gravel Desert. Bull. Bot. Res. 2024, 44, 459–469. [Google Scholar] [CrossRef]
  38. Jarvis, N.J. A review of non-equilibrium water flow and solute transport in soil macropores: Principles, controlling factors and consequences for water quality. Eur. J. Soil Sci. 2020, 71, 279–302. [Google Scholar] [CrossRef]
  39. Chen, X.; Duan, Z. Changes in soil physical and chemical properties during reversal of desertification in Yanchi County of Ningxia Hui autonomous region, China. Environ. Geol. 2009, 57, 975–985. [Google Scholar] [CrossRef]
  40. Eltarabily, M.G.; Bali, K.M.; Negm, A.M.; Yoshimura, C. Evaluation of Root Water Uptake and Urea Fertigation Distribution under Subsurface Drip Irrigation. Water 2019, 11, 1487. [Google Scholar] [CrossRef]
  41. Li, Y.; Jiang, J.; Song, C.; Li, Z. Relationship Between Soil Factors and Ephemeral Plant Species Diversity on Typical Sand Dunes in the Mosuowan Region. Arid Zone Res. 2018, 35, 912–919. [Google Scholar]
  42. Tan, Q.; Huo, S.; Wang, D.; Wen, M.; Xing, M.; Lu, M. Hysteresis of Water Retention Curve of the Capillarimetric Diapason in Saline Soils. Eurasian Soil Sci. 2024, 57, 1217–1230. [Google Scholar] [CrossRef]
  43. Ayari, M.; Charef, A.; Azouzi, R.; Khiari, N.; Ben Sassi, M. Effect of Zeolite, Femur and Lignite Application Rates on Soil Hydraulic Properties and Fertility of Sandy and Clay Soils at Semi-arid Climate. Commun. Soil Sci. Plant Anal. 2022, 53, 408–425. [Google Scholar] [CrossRef]
  44. Guo, C.; Yao, C.; Wu, J.; Qin, S.; Yang, H.; Li, H.; Mao, J. Field and numerical experiments of subsurface drainage systems in saline and low-permeability interlayered fields in arid regions. Agric. Water Manag. 2024, 300, 108898. [Google Scholar] [CrossRef]
  45. Ye, C.; Zheng, G.; Tao, Y.; Xu, Y.; Chu, G.; Xu, C.; Chen, S.; Liu, Y.; Zhang, X.; Wang, D. Effect of Soil Texture on Soil Nutrient Status and Rice Nutrient Absorption in Paddy Soils. Agronomy 2024, 14, 1339. [Google Scholar] [CrossRef]
  46. Yu, M.; Zhang, L.; Xu, X.; Feger, K.-H.; Wang, Y.; Liu, W.; Schwaerzel, K. Impact of land-use changes on soil hydraulic properties of Calcaric Regosols on the Loess Plateau, NW China. J. Plant Nutr. Soil Sci. 2015, 178, 486–498. [Google Scholar] [CrossRef]
  47. Wu, Y.; Zhang, H.; Li, J.; Wang, Z.; Jiang, Y. Adsorption of soil invertase to goethite, gibbsite and their organic complexes and the effects on enzyme catalytic performance. Colloids Surf. B Biointerfaces 2023, 222, 113073. [Google Scholar] [CrossRef] [PubMed]
  48. Khadem, A.; Raiesi, F. Influence of biochar on potential enzyme activities in two calcareous soils of contrasting texture. Geoderma 2017, 308, 149–158. [Google Scholar] [CrossRef]
  49. Song, W.; Han, F.; Bao, Z.; Chai, Y.; Wang, L.; Huang, C.; Cheng, H.; Chang, L. Mulching Practices Improve Soil Moisture and Enzyme Activity in Drylands, Increasing Potato Yield. Agronomy 2024, 14, 1077. [Google Scholar] [CrossRef]
  50. Wu, Y.; Zhao, Z.; Zhao, F.; Cheng, X.; Zhao, P.; Liu, S. Response of Pear Trees’ (Pyrus bretschneideri ‘Sinkiangensis’) Fine Roots to a Soil Water Regime of Regulated Deficit Irrigation. Agronomy 2021, 11, 2316. [Google Scholar] [CrossRef]
  51. Yu, Q.; Zhang, Z.; He, Y.; Hao, M.; Wang, G.; Dun, X.; Wu, Q.; Gao, P. Secondary shrubs promoted the priming effect by increasing soil particle organic carbon mineralization. Front. For. Glob. Change 2023, 6, 1288259. [Google Scholar] [CrossRef]
  52. Fischer, C.; Tischer, J.; Roscher, C.; Eisenhauer, N.; Ravenek, J.; Gleixner, G.; Attinger, S.; Jensen, B.; de Kroon, H.; Mommer, L.; et al. Plant species diversity affects infiltration capacity in an experimental grassland through changes in soil properties. Plant Soil 2015, 397, 1–16. [Google Scholar] [CrossRef]
  53. Tavanti, R.F.R.; Montanari, R.; Panosso, A.R.; Freddi, O.S.; Paz-Gonzalez, A. Pedotransfer function to estimate the soil structural “s” index and spatial variability in an oxisol within a livestock farming system. Eng. Agric. 2020, 40, 34–44. [Google Scholar] [CrossRef]
  54. Lin, H.S.; McInnes, K.J.; Wilding, L.P.; Hallmark, C.T. Effects of soil morphology on hydraulic properties: II. Hydraulic pedotransfer functions. Soil Sci. Soc. Am. J. 1999, 63, 955–961. [Google Scholar] [CrossRef]
  55. Baveye, P. Comment on “Soil structure and management: A review” by C.J. Bronick and R. Lal. Geoderma 2006, 134, 231–232. [Google Scholar] [CrossRef]
  56. Binh Thanh, N.; Binh Trung, P.; Tong Xuan, N.; Vinh Ngoc, N.; Thanh Van, T.; Quang-Vu, B. Contrastive nutrient leaching from two differently textured paddy soils as influenced by biochar addition. J. Soils Sediments 2020, 20, 297–307. [Google Scholar] [CrossRef]
  57. Juice, S.M.; Schaberg, P.G.; Kosiba, A.M.; Waite, C.E.; Hawley, G.J.; Wang, D.; Perdrial, J.N.; Adair, E.C. Soil type modifies the impacts of warming and snow exclusion on leachate carbon and nutrient losses. Biogeochemistry 2022, 160, 199–217. [Google Scholar] [CrossRef]
Figure 1. Location and position of the sampling site in the Turpan–Hami region. Dots represent the specific locations of each sampling site. Different colors represent the DEM range in the study, with white indicating a higher elevation. Locations of Xinjiang Province in China (a), Hami Counties in Xinjiang Province (b), and Hami region (c).
Soilsystems 09 00084 g001
Figure 2. Average temperature and precipitation in July in Hami.
Soilsystems 09 00084 g002
Figure 3. United States Department of Agriculture (USDA) Soil Texture Classification Standards. Samples were classified as sand, sandy loam, loamy sand, and silty loam according to the USDA soil texture classification standards.
Soilsystems 09 00084 g003
Figure 4. Plant diversity indices of typical soil textures in desert areas. (a) Shannon–Wiener index, (b) Simpson dominance index, (c) Margalef richness index, and (d) Pielou evenness index. In (a) different letters indicate significant differences in the Shannnon–Wiener index for different soil types (p < 0.05), In (b) different letters indicate significant differences in the Simpson dominance index for different soil types (p < 0.05), In (c) same letters indicate no significant differences in the Margalef richness index for different soil types (p > 0.05), In (d) different letters indicate significant differences in the Pielou evenness index for different soil types (p < 0.05).
Soilsystems 09 00084 g004
Figure 5. Physico-chemical properties and urease activity of typical soils (sand, sandy loam, loamy sand, and silty loam) in the desert region. (a) Soil pH, (b) soil electrical conductivity, (c) soil organic matter, (d) soil ammonium nitrogen, (e) soil available potassium, (f) soil available phosphorus, and (g) soil urease activity.
Soilsystems 09 00084 g005
Figure 6. Correlation analysis of factors influencing plant diversity. pH (soil pH), EC (soil electrical conductivitye), SUR (soil urease activity), SOM (soil organic matter), NH4+-N (soil ammonium nitrogen), AK (soil available potassium), AP (soil available phosphorus), clay (soil clay content), silt (soil silt content), sand (soil sand content), H’ (Shannon–Wiener index), C (Simpson dominance index), D (Margalef richness index), Jsw (Pielou evenness index), Tem (mean monthly temperature), and Pre (mean monthly precipitation).
Soilsystems 09 00084 g006
Disclaimer/Publisher’s Note: The statements, opinions and data contained in all publications are solely those of the individual author(s) and contributor(s) and not of MDPI and/or the editor(s). MDPI and/or the editor(s) disclaim responsibility for any injury to people or property resulting from any ideas, methods, instructions or products referred to in the content.

