Article

In Vitro Evaluation of Enhanced Efficiency Nitrogen Fertilizers Using Two Different Soils

1
Plant Science Department, University of Tennessee, Knoxville, TN 37996, USA
2
Department of Biosystems Engineering and Soil Science, University of Tennessee, Knoxville, TN 37996, USA
3
Department of Agricultural Sciences and Technology, Ho Technical University, Ho P.O. Box HP 217, Ghana
*
Author to whom correspondence should be addressed.
Soil Syst. 2025, 9(3), 80; https://doi.org/10.3390/soilsystems9030080
Submission received: 29 May 2025 / Revised: 9 July 2025 / Accepted: 10 July 2025 / Published: 16 July 2025

Abstract

There are discrepancies regarding the effectiveness of enhanced efficiency nitrogen (N) fertilizer (EENF) products on ammonia loss from unincorporated, surface applications of urea-based fertilizers. Soil properties and management practices may account for the differences in the performance of EENF. However, few studies have investigated the performance of urea- and urea ammonium nitrate (UAN)-based EENF on soils with contrasting properties. Controlled-environment incubation experiments were conducted on two soils with different properties to evaluate the efficacy of urea and UAN forms of EENF to minimize ammonia volatilization losses. The experiments were set up as a completely randomized design, with seven treatments replicated four times for 16 days. The N treatments, which were surface-applied at 134 kg N ha−1, included untreated urea, untreated UAN, urea+ANVOLTM (urease inhibitor product), UAN+ANVOLTM, environmentally smart nitrogen (ESN®), SUPERU® (urease and nitrification inhibitor product), and urea+Excelis® (urease and nitrification inhibitor product). In this study, urea was more susceptible to ammonia loss (24.12 and 26.49% of applied N) than UAN (5.24 and 16.17% of applied N), with lower ammonia volatility from soil with a pH of 5.8 when compared to 7.0. Urea-based EENF products performed better in soil with a pH of 5.8 compared to the soil with pH 7.0, except for ESN, which was not influenced by pH. In contrast, the UAN-based EENF was more effective in the high-pH soil (7.0). Across both soils, all EENFs reduced cumulative ammonia loss by 32–91% in urea and 27–70% in UAN, respectively, when compared to their untreated forms. The urea-based EENF formulations containing both nitrification and urease inhibitors were the least effective among the EENF types, performing particularly poorly in high-pH soil (pH 7.0). In conclusion, the efficacy of EENF is dependent on soil pH, N source, and the form of EENF. These findings underscore the importance of tailoring EENF applications to specific soil conditions and N sources to optimize N use efficiency (NUE), enhance economic returns for producers, and minimize environmental impacts.

1. Introduction

Ammonia volatilization is recognized as one of the most common and relevant losses of nitrogen (N) in cropping systems [1,2]. Ammonia loss is especially pronounced in calcareous soils, which are typically rich in calcium carbonate and naturally alkaline [3]. Ammonia volatilization has a negative impact on N use efficiency (NUE), which measures the quantity of grain produced per unit of fertilizer applied. Grain yield losses have often correlated positively with ammonia volatilization, with yield losses as high as 25% reported for field corn [4].
Extensive research has demonstrated that in no-till production systems, surface-applied urea-based N fertilizers are more prone to ammonia volatilization losses compared to systems involving tillage [5]. In some cases, these losses can exceed 20% of applied N within a 14-day period [2,6,7].
Several strategies have been studied to minimize ammonia loss from urea-based fertilizers. Enhanced efficiency N fertilizers (EENFs) including enzyme inhibitors and slow or controlled release fertilizers have been tested and recommended as an approach to reducing ammonia loss [8,9,10,11]. Nonetheless, the efficacy of EENF products has shown variability, which may be partially attributed to differences in soil properties, N sources, and the specific formulations of EENF used [4,10,12]. Notable EENFs include enzyme inhibitors (urease and nitrification), slow- and controlled-release fertilizers, biofertilizers, and nanofertilizers.
Urease inhibitors function by binding to the active site of the urease enzyme or altering its structure, thereby impairing the enzyme’s ability to catalyze the hydrolysis of urea into ammonia and carbon dioxide [11,13,14]. There are several urease inhibitors, including N-(butyl) thiophosphoric triamide (NBPT) and phenylphosphorodiamidate. N-(butyl) thiophosphoric triamide has been extensively studied and widely used as a urease inhibitor to reduce ammonia volatilization from the surface application of urea-based fertilizers [11,14]. On the other hand, nitrification inhibitors function by suppressing the activity of ammonium-oxidizing bacteria, particularly Nitrosomonas species, thereby slowing the conversion of ammonium to nitrate [13,14]. Common compounds used as nitrification inhibitors include dicyandiamide (DCD) and nitrapyrin [2-chloro-6-(trichloromethyl-pyridine).
Enhanced efficiency N fertilizer products may be formulated with a combination of urease and nitrification inhibitors, the most common being NBPT and DCD mixtures. Slow-release N fertilizers are generally physically coated with compounds that slow N release over time compared to the untreated forms. Slow-release N fertilizers can lower ammonia volatilization and nitrate losses, especially in coarse-textured soils [15], but their effectiveness on NUE and crop yield vary greatly depending on soil and environmental conditions. Studies have reported inconsistent inhibitory effects when combining NBPT (a urease inhibitor) with DCD (a nitrification inhibitor), compared to using NBPT alone. For example, research results show higher amounts of ammonia losses from the combination of DCD- and NBPT-treated urea compared to NBPT [16]. In contrast, ref. [17] observed that a combination of DCD and NBPT reduced ammonia loss. Others have reported no change in ammonia loss due to the addition of DCD [18].
While environmental conditions and fertilizer management practices drive the extent of ammonia loss from unincorporated urea-based fertilizers, the potential for such losses is determined by soil properties. Soil properties including high soil pH, low soil organic matter (SOM), and low clay content increase ammonia loss from unincorporated, surface applied urea [19,20,21]. Although soil properties have been proposed as a key factor influencing ammonia loss, few studies have systematically evaluated different forms of EENF products across soils with varying properties, particularly differences in soil pH. For example, field trials investigating ammonia volatilization from EENF products rarely evaluate both N stabilizers and slow-release fertilizers within the same study. This limitation is largely attributed to the logistical complexity and financial demands of conducting comprehensive, multi-location field trials. In contrast, laboratory-based incubation studies offer a more practical and controlled environment to investigate ammonia volatilization potential across diverse soils.
Urea and urea ammonium nitrate (UAN) are commonly used urea-based fertilizers, with producers selecting between them based on logistical considerations, availability, and cost-effectiveness. These fertilizers vary in their susceptibility to ammonia volatilization. Ammonia volatilization losses from surface-applied UAN are generally lower than those from urea, though in some cases, UAN has resulted in higher losses. Elevated ammonia losses from UAN have been linked to its chemical composition and the pH of the soil [22].
Identifying urea and UAN forms of EENF that are effective under varying soil properties would improve the adoption of this important N management tool. Insights from such comparative studies can help refine N management strategies involving widely used EENF products. This study hypothesized that ammonia volatilization losses would vary among different EENF forms when applied to two soils with contrasting properties. The primary objective was to assess the effectiveness of various EENF products in mitigating ammonia volatilization across these two soil types. The findings of this study will underscore the importance of aligning the selection of EENF with local soil and environmental conditions to improve N retention in the soil for crop uptake, reduce fertilizer input requirements, and ultimately lower production costs.

2. Materials and Methods

2.1. Experimental Design and Treatments

The experiment was set up as a completely randomized design, containing 7 N treatments and 2 soils, and was replicated 4 times for a total of 56 (n = 7 × 2 × 4) experimental units. Nitrogen treatments were a combination of N fertilizer source and EENF. All the N fertilizer sources used for this experiment included granular urea and liquid UAN, and were surface-applied at an equivalent rate of 134 kg N ha−1. This is the recommended sidedress N application rate for non-irrigated corn production in the state of Tennessee, where substantial ammonia loss is reported to occur. Four EENF products of urea and one EENF product of UAN were evaluated in this experiment. The urea-based EENF included (1) a slow-release fertilizer, Environmentally Smart Nitrogen (ESN®) (44-0-0), (2) an NBPT- and Duromide-treated urea, ANVOLTM; (3) an NBPT- and DCD-formulated urea, SUPERU® (46-0-0); and (4) an NBPT- and DCD-treated urea, Excelis® (46-0-0). The EENF product for UAN was an NBPT-treated UAN, ANVOLTM. Detailed information on the composition and application rates of EENF products is provided in Table 1. In addition, an untreated or non-EENF urea (46-0-0) and UAN (32-0-0) were included in the experiment. Thus, seven N fertilizer treatments were evaluated in this trial: (1) untreated urea, (2) urea+ANVOLTM, (3) urea+Excelis®, (4) ESN®, (5) SUPERU®, (6) untreated UAN, and (7) UAN+ANVOLTM.
According to the Natural Resources Conservation Service, United States Department of Agriculture, the soils used in this study were Loring (fine–silty, mixed, active, thermic Oxyaquic Fragiudalfs) and Grenada (fine–silty, mixed, active, thermic Oxyaquic Fraglossudalfs) [23]. Soil samples were collected from production fields managed under no-till, corn–soybean rotation systems at 0–15 cm depth. This depth is considered the most typical for surface fertilizer application studies. The samples were air-dried, ground, sieved through a 2 mm mesh, and analyzed for various properties: SOM content using the loss by ignition method, soil pH using a 1:1 soil-to-water ratio, Mehlich III extractable soil nutrients, soil nitrate-N and ammonium-N through 2 M KCl extraction, and soil texture by the hydrometer method. Detailed procedures for these methods are available in the Soil Test Methods from the Southern United States Manual [24]. The physicochemical characteristics of each soil are shown in Table 2.

2.2. Ammonia Volatilization Study

The incubation system was maintained under consistent conditions throughout the experiment to ensure that any observed differences in ammonia volatilization were attributable solely to the N treatments applied. The ambient temperature was held constant at 28 °C, the airflow rate was regulated at 1 L min−1, and the incoming air was nearly 100% saturated with moisture before interacting with the soil surface. The system includes a pump, distribution manifolds, flow meters, humistats, and insulated cabinet boxes, all of which provide precisely controlled air to a series of glass jars containing the soil treatments or replicates. The air was supplied by an air pump (DDL80-101, Gast Manufacturing Inc., Benton Harbor, MI, USA) to the distribution manifolds. The dry air from the pump was moistened with deionized water in the humistats to maintain constant soil moisture throughout the experiment. Vinyl tubes guided the air flow through the system, which was then directed into chambers holding the glass jars with prepared soil. To begin the experiment, the glass jars were filled with 500 g of each soil and moistened to 2/3 of the field capacity. Moistened soil samples were covered with parafilm and incubated at a constant temperature of 28 °C for 48 h to allow equilibration within the system. Following incubation, the parafilm was removed and the soil surface was gently patted to ensure uniformity. Equivalent N application rates for urea, UAN, and EENF products were calculated based on the exposed soil surface area within each glass jar, corresponding to a field application rate of 134 kg N ha−1 in the state of Tennessee. Fertilizers were applied uniformly to the soil surface, with liquid treatments dispensed using a pipette and granular forms applied manually. Ammonia gas from the volatilized N fertilizer was captured by a tube that bubbled it through an acid trap containing 100 mL of 0.02 M orthophosphoric acid. The N trapped in the acid was measured on days 1, 2, 3, 4, 5, 6, 7, 9, 11, 13, and 16 following fertilization, based on the premise that the first seven days represent the most critical period for ammonia volatilization. Subsequent measurements, extending to day 16, were intended to capture any additional N losses occurring beyond this initial phase. The ammonium content in the acid traps was analyzed using an automated TL-2800 Single Channel ammonium and nitrate analyzer (Timberline Instruments, Boulder, CO, USA).

2.3. Statistical Analysis

In this study, we compared the performance of EENF on ammonia loss at each sampling time as well as the cumulative ammonia loss at four time points. The cumulative ammonia loss was evaluated at 1, 3, 7, and 16 days after fertilizer application (DAF), which was a summation of ammonia loss between sampling times 1, 1–3, 1–7, and 1–16, respectively. The first time point (1 DAF) was selected to examine the onset of ammonia loss, the second (3 DAF) captured the peak ammonia loss period based on previous studies, the third (7 DAF) assessed when ammonia loss typically levels off, and the fourth (16 DAF) examined the total ammonia loss over the entire incubation period. In addition, the difference between corresponding initial rates of ammonia loss and maximum of ammonia loss (DIFF) across all treatments was evaluated. The effects of N treatments, soil, and their interactions on cumulative ammonia loss at 1, 3, 7, 16 DAF, and DIFF were subjected to analysis of variance using a SAS 9.4 Proc Glimmix model (SAS Institute, Cary, NC, USA). Tukey’s HSD at α = 0.05 in SAS was used to identify differences in means of effects. In addition, differences in both cumulative and initial ammonia losses were quantified across all treatments and analyzed using the SAS Proc Glimmix model to underscore the effectiveness of EENF products in mitigating ammonia volatilization from the soil. The percentage inhibition was calculated for urea as (untreated urea − EENF)/untreated urea × 100, where EENF represents SUPERU®, urea+Excelis®, urea+ANVOLTM, and ESN fertilizers, while the percentage inhibition for UAN was calculated as (UAN − UAN + ANVOLTM)/untreated UAN × 100. Additionally, rates of ammonia loss were calculated for all treatments over the sampling period, expressed as N loss (% of applied N) per unit of sampling time.

3. Results

3.1. Ammonia Loss Flux

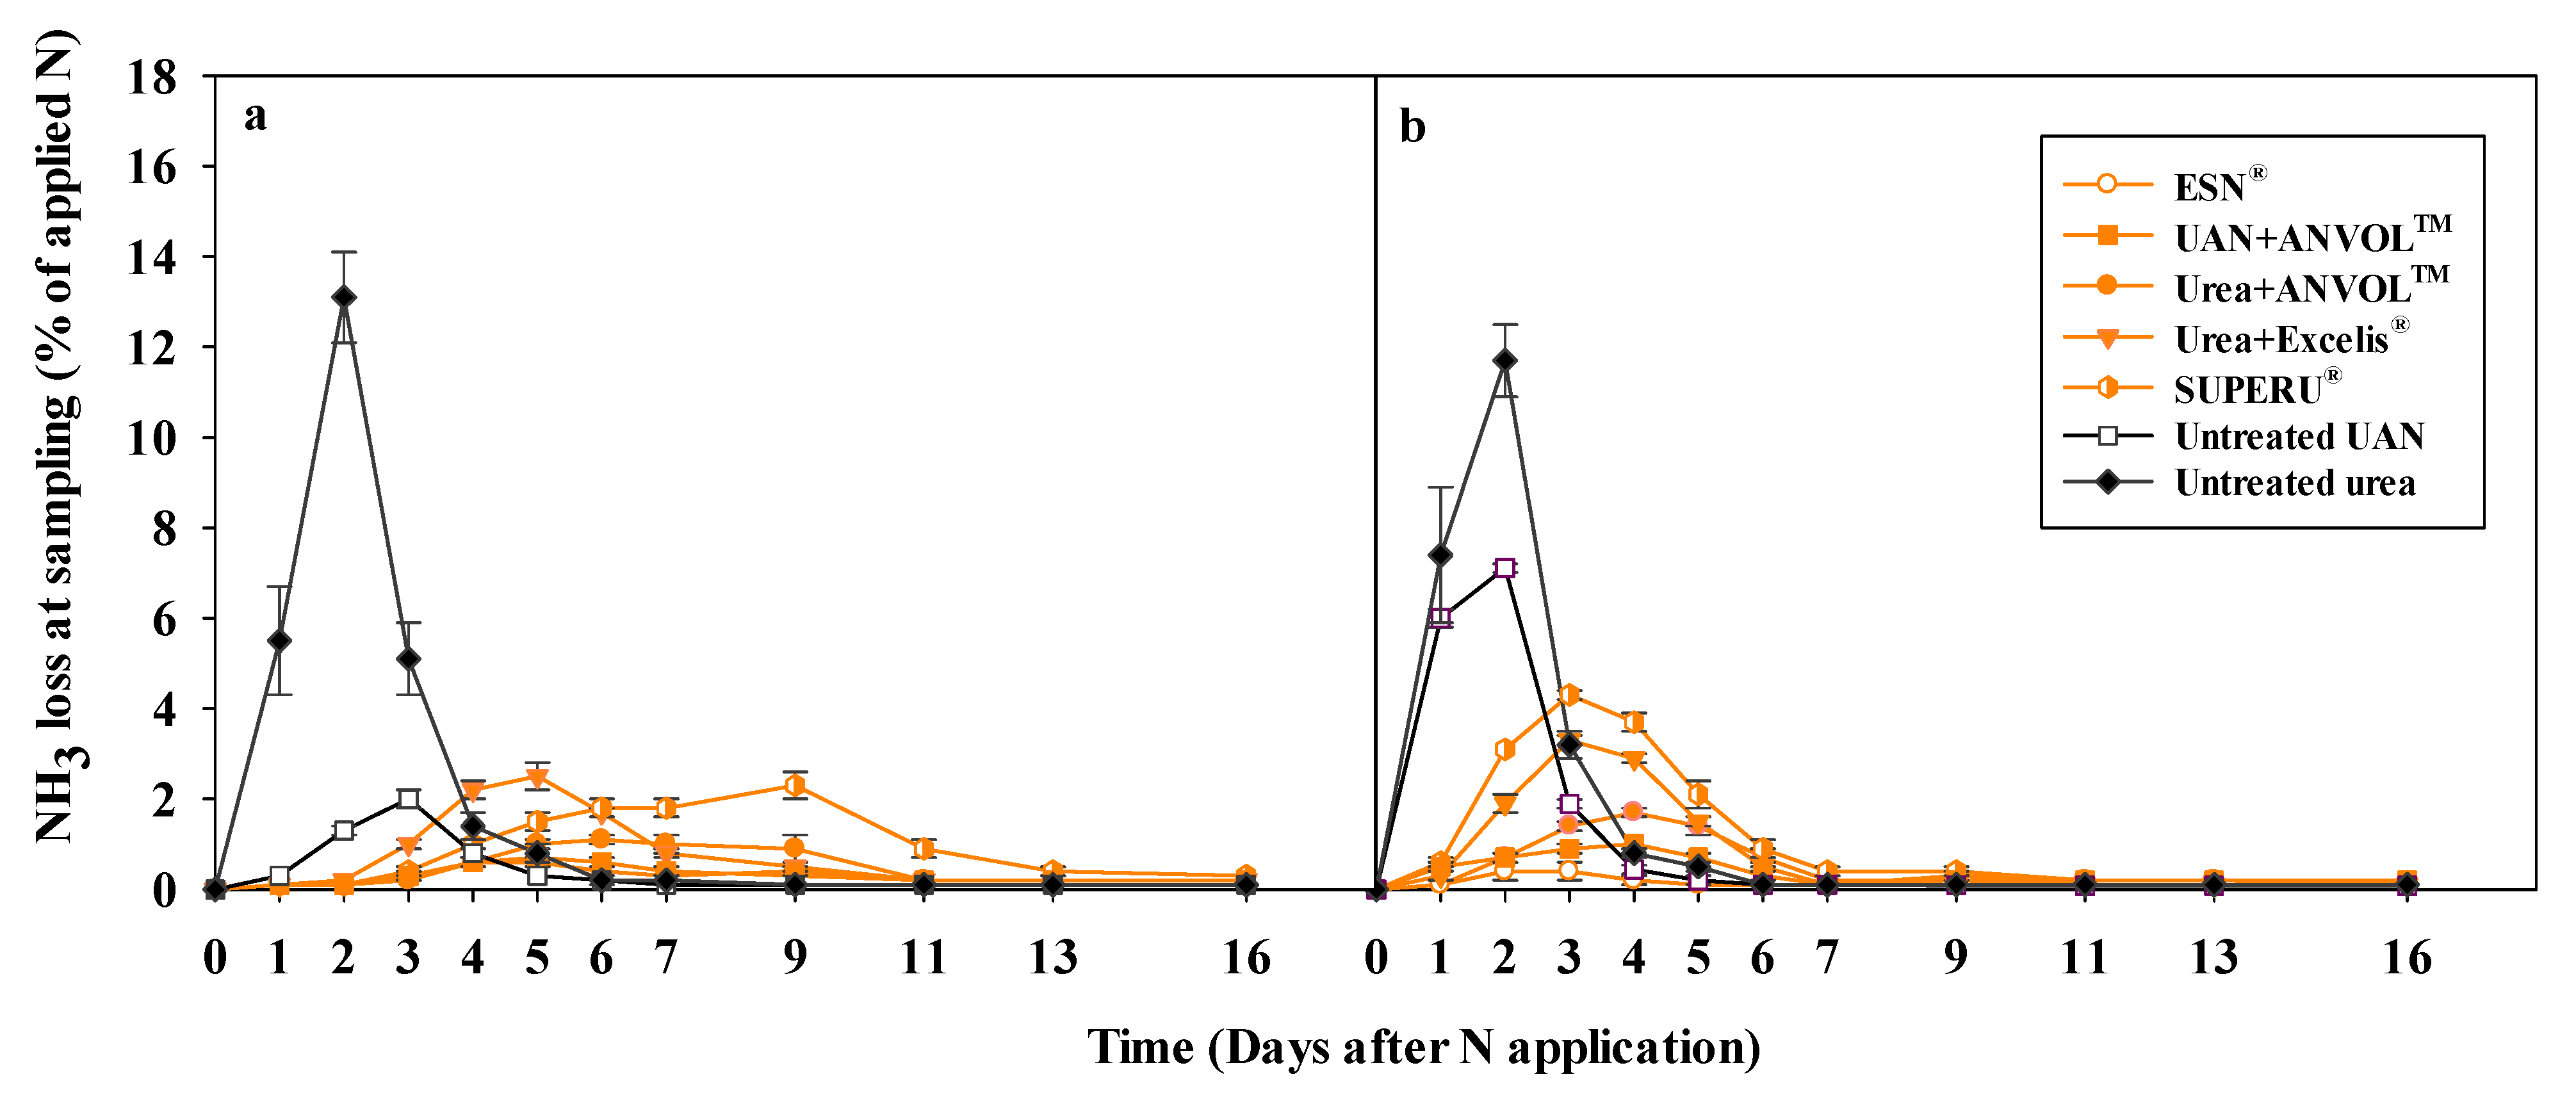
3.1.1. Ammonia Volatilization Flux

Ammonia loss was detected from all N treatments on 1 DAF, regardless of the soil. In the low-pH soil (Loring), the peak ammonia flux from untreated urea (13.1% of the applied N) was 6.5 times greater than untreated UAN (2% of the applied N) and occurred a day earlier. However, in the high-pH soil (Grenada), the peak ammonia loss from both N sources occurred on the same day (2 DAF). Nevertheless, the flux from urea was 1.6 times greater than UAN (Figure 1a,b). For both soils, ammonia losses from untreated forms of these N sources decreased rapidly after these peak losses throughout the remainder of the incubation period, and there was no recognizable difference in ammonia loss between urea and UAN on day 7 and beyond.
The EENF forms were effective in delaying and reducing peak ammonia flux compared to their corresponding non-EENF forms. Ammonia loss for the EENF treatments ranged from 0.1% to 2.5% of applied N in Loring, and from 0.1% to 4.3% of applied N in Grenada soil during the first 7 DAF (Figure 1a,b). Peak ammonia loss from EENF forms was delayed by 1–5 DAF. In the Loring soil, peak ammonia loss flux occurred on 5 DAF for all EENF except SUPERU®, which happened a day later. Urea treated with Excelis® had the highest flux among the EENF forms in the Loring soil. In the Grenada soil, peak ammonia loss from the EENF occurred earlier and was greater than in the Loring soil. The peak flux for ESN®, UAN+ANVOLTM, urea+ANVOLTM, urea+Excelis®, and SUPERU®, were 0.6, 1.0, 1.7, 3.3, and 4.3% of applied N, which occurred on 3, 4, 4, 3, and 3 DAF, respectively. In the high-pH Grenada soil, urea treated with SUPERU® had the highest flux among the EENF forms. Unlike untreated urea and UAN, which showed high spikes in ammonia loss, the amended products exhibited more consistent losses across the sampling period (Figure 1a,b).

3.1.2. Ammonia Loss Rate

On the first day, the highest ammonia loss rate was observed from the untreated urea (5.5 and 7.3% of applied N d−1), which was higher than untreated UAN (0.3 and 6.0% of applied N d−1) regardless of soil (Table 3). All the EENF treatments had a lower initial ammonia rate compared to their non-EENF forms. Regarding the soil, initial ammonia rates from all the treatments applied onto Loring soil were lower than corresponding applications on Grenada soil, except urea+ANVOLTM and ESN®. The maximum ammonia loss rate for all the untreated urea was 13.1 and 11.7% of applied N d−1 for Loring and Grenada soils, respectively, on the same day (day 2). In contrast to UAN, the maximum ammonia loss rate from UAN applied to Loring soil (1.9% of applied N d−1) occurred on day 3, which was a day later than in Grenada soil (7.1% of applied N d−1). All the EENF treatments reduced and delayed the day of maximum ammonia rate. In Loring soils, the maximum rates for SUPERU®, urea+Excelis®, urea+ANVOLTM, UAN+ANVOLTM, and ESN® were 2.2, 2.5, 1.2, 0.7, and 0.6 of applied N d−1, which occurred on days 9, 5, 6, 5, and 4, respectively. In Grenada soils, the maximum rates for SUPERU®, urea+Excelis®, urea+ANVOLTM, UAN+ANVOLTM, and ESN® were 4.3, 3.3, 1.7, 1.0, and 0.4 of applied N d−1, which occurred on days 3, 3, 4, 4, and 3, respectively.

3.1.3. Cumulative Ammonia Loss

There was a significant interactive effect of N source and soil on cumulative ammonia loss at 1, 3, 7, and 16 DAF (Table 4). Cumulative ammonia loss from all the N treatments followed a curvilinear pattern for the duration of the experiment, irrespective of the soil (Figure 2a,b). Untreated urea exhibited similar total ammonia loss on both soils on 3 and 16 DAF. On 1 DAF, losses from Grenada were higher than Loring; however, on 7 DAF, Loring had higher losses than Grenada soil (Table 4). Untreated UAN had higher losses when applied onto Grenada soils than Loring soils on all the DAF. The total ammonia loss on 1, 3, 7, and 16 DAF from all the EENF from Loring soil was similar to the corresponding EENF applied to Grenada soil, except on SUPERU® (on 3, 7, and 16 DAF) and urea+Excelis® (on 3 DAF), for which the total ammonia loss from Grenada was higher than for Loring soils.
On 1 DAF, the highest ammonia loss recorded from untreated urea applied onto the Grenada soil was similar to untreated UAN applied on the same soil; both were greater than the other N treatments, irrespective of soil (Table 4). Ammonia loss was similar among all the EENF forms irrespective of the soil and was comparable to untreated UAN applied onto Loring soil. The similarity in ammonia loss from the untreated urea and UAN applied on Grenada soil on 1 DAF was non-existent by 3 DAF and beyond, with the untreated urea having a greater loss than UAN. Total ammonia loss on 3 DAF from the untreated urea applied to both soils was greater than the other N treatments regardless of soil. Ammonia loss from untreated UAN applied to Grenada soil was greater than untreated UAN applied to Loring soil and all the EENFs. Untreated UAN applied onto Loring soils produced higher results than EENF applied onto the same soil, but lower than losses from SUPERU® and Urea+Excelis® applied to Grenada soil. Total ammonia losses from SUPERU® and Urea+Excelis® applied to Grenada were higher than those in Loring soils, while there were no differences for the remaining EENFs. Loring soil had a higher loss from the untreated urea compared to Grenada soil on 7 DAF, and both were greater than for the remaining N treatments (Table 4). Untreated UAN applied onto Grenada soils had higher losses than Urea+Excelis® when applied onto the same soil, as well as SUPERU® and Urea+Excelis® applied to Loring soil.
Among the EENFs, the highest and lowest ammonia losses were observed when SUPERU® and ESN were applied onto Grenada soils, respectively. Ammonia losses from all the EENFs from Loring soil were similar to those of corresponding EENFs applied to Grenada, except for SUPERU®, which had a lower ammonia loss amount from Loring soil on 7 DAF. On 16 DAF, the cumulative ammonia losses for untreated urea were 24.1% and 26.5% of applied N in Grenada and Loring soils, respectively, which were higher than the losses from all other N treatments in the corresponding soils (Figure 3). Cumulative ammonia losses from untreated UAN applied on Grenada soil were comparable to those from SUPERU® on the same soils, but higher than the untreated UAN applied onto the Loring soil and the remaining EENFs. Untreated UAN applied onto Loring soil produced greater results than those from ESN® applied in Grenada soils, and lower than those from SUPERU® and urea+Excelis® in both soils (Table 4). Among the EENF, SUPERU® applied on Grenada had the highest loss, which was greater than for the remaining EENFs. The losses from SUPERU® applied on the Loring soil were similar to those for Urea+Excelis® on both soils. Environmentally Smart Nitrogen had the lowest amount of loss on Grenada soil, and was similar to ESN® and urea+ANVOLTM applied on Loring soil.
All the EENFs were effective in reducing ammonia loss compared to the corresponding untreated or non-EENF forms in both soils. In Loring soil, a moderate to high reduction in ammonia loss was observed from the EENFs (61–88%), except for UAN treated with ANVOLTM (Table 5). However, it is important to consider that the amount of ammonia loss from untreated UAN suggests that the soil is not very susceptible to ammonia loss. In Grenada soil, a moderate to high reduction in ammonia loss was observed from EENFs (54–91%), except for SUPERU®.

3.1.4. Comparing Initial and Maximum Ammonia Volatilization

There was a significant interactive effect of N source and soil on the difference between initial rates and the maximum ammonia loss (Table 4). Volatilization kinetics, defined as the difference between initial and peak ammonia loss rates [25], were highest for untreated urea in the Loring soil, but comparable to SUPERU® in the Grenada soil. SUPERU® and urea+Excelis® in the Loring soil, and urea+Excelis® and untreated UAN in the Grenada soil, exhibited similar kinetics. The treated urea and UAN formulations showed slower volatilization dynamics overall, with ESN demonstrating the slowest release pattern across both soils.

4. Discussion

The detection of ammonia from all treatments regardless of the soil can be attributed to the onset of urea hydrolysis and/or the conversion of ammonium components of the UAN to ammonia in the high-pH soil. The day of peak ammonia flux from the untreated N fertilizer treatments (2–3 DAF) reported in the current study was consistent with findings from other published incubation studies [7,16,26]. These findings indicate that under soil, environmental, or management conditions conducive to ammonia loss from urea-based fertilizers, implementing mitigation strategies such as the use of stabilized or treated fertilizers or timing applications shortly after rainfall or irrigation is advisable to reduce N volatilization.
Generally, peak ammonia flux was higher for urea than UAN in both soils; however, the magnitude of difference between these two N sources was smaller in the high-pH soil. Previous studies have attributed the earlier and higher ammonia fluxes from untreated urea compared to UAN, as observed in Loring soil in this experiment, to rapid urea hydrolysis [16]. It was demonstrated by [27] that soil surface pH increased from 6.6 to 8.4 and remained elevated after urea application, with the resulting alkaline pH potentially promoting ammonia volatilization. The rapid breakdown of urea increases the concentration of ammoniacal-N in solution after application, which can readily be converted to ammonia and lost through ammonia volatilization [28]. Since urea hydrolysis is relatively lower in UAN than urea, lower ammonia fluxes occur from the urea component of UAN compared to urea, which undergoes complete hydrolysis. However, in soils with a pH of 7 and above, the peak ammonia loss from untreated urea is generally similar to that of UAN, which is consistent with the observation reported in this experiment. Urea ammonium nitrate contains relatively higher amounts of ammonium concentration than urea. Since a high pH favors the dissociation of ammonium to ammonia, the onset of ammonia loss from UAN begins immediately in soils with a very high soil pH [28]. In contrast, the ammonia volatilization is slow because the low pH favors the conversion of ammonia to ammonium.
All the urea-based EENFs delayed the day of peak flux and reduced the amount of peak ammonia loss compared to the untreated forms, which aligns with previous research. It was reported by [10] that the maximum ammonia loss from NBPT-treated urea occurred on day 5 DAF. In a study by [16], involving two soils, urea amended with NBPT reduced and delayed peak ammonia fluxes until days 7 and 9 DAF. In a review of several related studies, ref. [29] showed that NBPT-treated urea delayed peak volatilization by at least 3.5 days compared to untreated urea.
These findings align with previous studies that showed that adding NBPT to urea significantly reduces ammonia volatilization compared to untreated urea. For instance, ref. [17] observed a reduction in ammonia volatilization of 61–80% when urea was treated with NBPT compared to untreated urea. Similarly, ref. [16] reported a 79% reduction (6% of applied N) when urea was treated with NBPT, versus 28% of applied N for untreated urea. Additionally, ref. [30] found a 55% reduction (1.9% of applied N) for NBPT-treated urea, compared to 4.2% of applied N for untreated urea. It was also shown by [12] that amending urea with NBPT reduced ammonia volatilization by 32.3% and 71.4% in sandy loam and silty clay soils, respectively. Explaining this phenomenon, ref. [31] showed that the two nickel (Ni) atoms of the urease enzyme form a bond with one of the amide groups and oxygen atoms of the NBPT to form a cation bridge, which allows the oxygen atom on the bridge to form a strong hydrogen bond with the other amide group of the NBPT. Unlike untreated urea, which is easily degraded by the urease enzyme, this three-point bond of the NBPT molecule with the urease enzyme binding sites temporarily inhibits the functionality of the urease enzyme and lowers ammonia loss [31].
In this study, DCD did not improve the efficiency of NBPT. The higher cumulative ammonia losses observed with combinations of NBPT and DCD in SUPERU® and urea+Excelis® align with findings from previous research. For example, ref. [12] reported that SUPERU® resulted in greater ammonia volatilization than urea treated with NBPT alone in two different soils. Similarly, ref. [16] found that urea mixed with NBPT and DCD lost 15–17% of applied N, compared to 6% with NBPT alone in one trial, and 28–33% of applied N versus 17% in another. It was also observed by [18] that mixtures of urea and DCD increased ammonia loss to 5.7% of applied N, compared to 4.2% with untreated urea.
Similarly, this study found that ammonia volatilization kinetics were more rapid for SUPERU® and urea+Excelis® compared to other EENF products in both soils. This aligns with findings from a pot experiment on spring wheat, where [32] reported that combining DCD with hydroquinone (a urease inhibitor) initially suppressed wheat growth, though the effect was no longer evident at harvest. This observation may indicate suboptimal N retention by the formulation during the initial stages of crop development. A study by [33] showed that DCD, particularly when combined with urease inhibitor, increased the availability of ammonium in the soil for wheat uptake. The observed increase in volatilization kinetics associated with DCD may be attributed to its effectiveness in suppressing nitrification, thereby maintaining higher ammonium concentrations that are more susceptible to volatilization losses [34]. These findings suggest that the combination of NBPT and DCD may not always synergistically reduce ammonia volatilization and could, in some cases, lead to higher losses.
The greater cumulative ammonia loss observed with SUPERU® (which has a higher concentration of DCD than NBPT) compared to urea+Excelis® (with a higher concentration of NBPT than DCD) (Table 1; Figure 2) may indicate that NBPT was more effective in reducing ammonia loss than DCD. The precise mechanism behind the increased ammonia loss with combinations of DCD and NBPT remains unclear, but it could involve factors beyond urea hydrolysis, as both DCD and NBPT belong to the amide compound group [16]. These changes might contribute to a reduced effectiveness of NBPT when used in combination with DCD.
The ammonia volatilization at sampling observed with SUPERU® and urea+Excelis® in this study remained high throughout the incubation period, consistent with findings from [16]. However, contrary to [16,18], who reported that urea treated with DCD lost more N than untreated urea, our study showed that the cumulative losses for untreated urea were higher than those from SUPERU® and urea+Excelis® by the end of the incubation in both soils (Figure 2).
The results of this study are consistent with a previously published study on the effectiveness of ESN® to reduce ammonia volatilization [12,30]. The observed effectiveness of ESN® in reducing ammonia losses from the surface application of untreated urea is often attributed to the coating of the ESN® granules by hydrophobic materials, which are less affected by soil and climatic conditions. The polymer coating also regulates the amount of N released into the soil solution, thus reducing the concentration of ammonium available for urea hydrolysis and lowering ammonia volatilization [12]. While some studies suggest that ammonia loss could increase with ESN® application at later stages [12,32], this was not observed in our study. Instead, ammonia losses declined over the 16-day incubation period, consistent with the controlled release mechanism of ESN®.

5. Conclusions

In this study, the EENF formulations effectively delayed peak ammonia emissions by 1 to 5 days and reduced peak ammonia flux by 24–82% for UAN and 92–97% for urea in Loring soil, and by 60–94% for UAN and 76–97% for urea in high-pH soil, compared to their respective non-EENF counterparts. Consequently, the cumulative ammonia losses were lowered by 27–91% in both soils. Among the treatments, the slow-release fertilizer ESN® demonstrated superior performance in minimizing ammonia loss (88–91%) compared to NBPT-treated urea or UAN (27–79%). Furthermore, urea amended solely with NBPT (urea+ANVOL™) was more effective at reducing volatilization (72–79%) than formulations combining NBPT and DCD (SUPERU® and urea+Excelis®) (61–64%). The performance of EENF products was influenced by soil characteristics, particularly soil pH. The UAN-based EENFs were more effective in soils with a pH above 7, where volatilization losses from untreated UAN were higher. In contrast, urea-based EENFs containing NBPT and/or DCD performed better in soils with a pH below 7. These findings underscore the importance of considering soil properties—especially initial soil pH—when selecting EENF products, as their effectiveness can vary significantly in soils prone to ammonia loss from surface-applied, unincorporated urea-based fertilizers. Tailoring EENF applications to specific soil conditions can reduce environmental impacts, enhance NUE, and increase profits for producers. Future research will evaluate the efficacy of EENF forms of urea-based fertilizers to reduce ammonia loss in muddy or flooded soil conditions for growers that have options for aerial N application.

Author Contributions

S.O.: Data curation, Formal analysis, Investigation, Methodology, Software, Visualization, Writing—original draft, Writing—review and editing; S.L.: Investigation; L.A.D.: Conceptualization, Funding acquisition, Methodology, Supervision, Writing—original draft, Writing—review and editing; F.W.: Conceptualization, Investigation, Methodology, Supervision, Writing—original draft, Writing—review and editing; D.Y.: Conceptualization, Investigation, Methodology, Supervision, Writing—original draft, Writing—review and editing; D.S.: Conceptualization, Funding acquisition, Methodology, Supervision, Writing—original draft, Writing—review and editing; X.Y.: Conceptualization, Funding acquisition, Investigation, Methodology, Supervision, Writing—original draft, Writing—review and editing; J.A.: Visualization, Writing—review and editing; N.A.: Conceptualization, Data curation, Formal analysis, Funding acquisition, Investigation, Methodology, Project administration, Supervision, Writing—original draft, Writing—review and editing. All authors have read and agreed to the published version of the manuscript.

Funding

This research was funded by the Tennessee Department of Agriculture, grant number 00000072575.

Institutional Review Board Statement

Not applicable.

Informed Consent Statement

Not applicable.

Data Availability Statement

The raw data supporting the conclusions of this article will be made available by the authors on request.

Conflicts of Interest

The authors declare no conflicts of interest.

Abbreviations

The following abbreviations are used in this manuscript:
NUENitrogen use efficiency
UANUrea ammonium nitrate
EENFEnhanced efficiency nitrogen fertilizer
NBPTN-(butyl) thiophosphoric triamide
DCDDicyandiamide
ESNEnvironmentally smart nitrogen
SOMSoil organic matter
DAFDays after fertilizer application

References

  1. Chuong, T.; Plant, R.; Linquist, B.A. Fertilizer source and placement influence ammonia volatilization losses from water-seeded rice systems. Soil Sci. Soc. Am. J. 2020, 84, 784–797. [Google Scholar] [CrossRef]
  2. Fageria, N.K. Nitrogen Management in Crop Production; CRC Press: Boca Raton, FL, USA, 2014. [Google Scholar]
  3. Li, S.; Zheng, X.; Zhang, W.; Han, S.; Deng, J.; Wang, K.; Wang, R.; Yao, Z.; Liu, C. Modeling ammonia volatilization following the application of synthetic fertilizers to cultivated uplands with calcareous soils using an improved DNDC biogeochemistry model. Sci. Total. Environ. 2019, 660, 931–946. [Google Scholar] [CrossRef] [PubMed]
  4. Adotey, N.; Kongchum, M.; Li, J.; Whitehurst, G.B.; Sucre, E.; Harrell, D.L. Ammonia Volatilization of Zinc Sulfate-Coated and NBPT-Treated Urea Fertilizers. Agron. J. 2017, 109, 2918–2926. [Google Scholar] [CrossRef]
  5. Palma, R.M.; Saubidet, M.I.; Rimolo, M.; Utsumi, J. Nitrogen losses by volatilization in a corn crop with two tillage systems in the Argentine Pampa. Commun. Soil Sci. Plant Anal. 1998, 29, 2865–2879. [Google Scholar] [CrossRef]
  6. Lasisi, A.A.; Akinremi, O.O.; Kumaragamage, D. Nitrification inhibitor reduces the inhibitory effect of N-(n-butyl) thiophosphoric triamide (NBPT) on the hydrolysis of urea. Soil Sci. Soc. Am. J. 2020, 84, 1782–1794. [Google Scholar] [CrossRef]
  7. Frame, W.H.; Alley, M.M.; Whitehurst, G.B.; Whitehurst, B.M.; Campbell, R. In vitro evaluation of coatings to control ammonia volatilization from surface-applied urea. Agron. J. 2012, 104, 1201–1207. [Google Scholar] [CrossRef]
  8. Adams, C.B.; Thapa, S.B.; Fan, Y.; Park, S. Agronomic and economic effects of two enhanced-efficiency urea fertilizer technologies on Southern Great Plains winter wheat. Agron. J. 2018, 110, 1097–1102. [Google Scholar] [CrossRef]
  9. Dillon, K.A.; Walker, T.W.; Harrell, D.L.; Krutz, L.J.; Varco, J.J.; Koger, C.H.; Cox, M.S. Nitrogen sources and timing effects on nitrogen loss and uptake in delayed flood rice. Agron. J. 2012, 104, 466–472. [Google Scholar] [CrossRef]
  10. Frame, W. Ammonia volatilization from urea treated with NBPT and two nitrification inhibitors. Agron. J. 2017, 109, 378–387. [Google Scholar] [CrossRef]
  11. Ruark, M.D.; Soratto, R.P.; Rosen, C.J. Merits and limitations of enhanced efficiency fertilizers. In Soil Nitrogen Uses and Environmental Impacts; CRC Press: Boca Raton, FL, USA, 2018; pp. 289–314. [Google Scholar]
  12. Awale, R.; Chatterjee, A. Enhanced efficiency nitrogen products influence ammonia volatilization and nitrous oxide emission from two contrasting soils. Agron. J. 2017, 109, 47–57. [Google Scholar] [CrossRef]
  13. Junejo, N.; Khanif, M.Y.; Hanfi, M.M.; Yunus, W.W.; Dharejo, K.A. Role of inhibitors and biodegradable material in mitigation of nitrogen losses from fertilized lands. Afr. J. Biotechnol. 2011, 10, 3504–3514. [Google Scholar]
  14. Trenkel, M.E. Slow-and Controlled-Releasee and Stabilized Fertilizers: An Option for Enhancing Nutrient Use Efficiency in Agriculture, 2nd ed.; International Fertilizer Industry Association: Paris, France, 2010; pp. 14–69. [Google Scholar]
  15. Peng, X.; Maharjan, B.; Yu, C.; Su, A.; Jin, V.; Ferguson, R.B. A laboratory evaluation of ammonia volatilization and nitrate leaching following nitrogen fertilizer application on a coarse-textured soil. Agron. J. 2015, 107, 871–879. [Google Scholar] [CrossRef]
  16. Soares, J.R.; Cantarella, H.; Menegale, M.L.d.C. Ammonia volatilization losses from surface-applied urea with urease and nitrification inhibitors. Soil Biol. Biochem. 2012, 52, 82–89. [Google Scholar] [CrossRef]
  17. Watson, C.J.; Akhonzada, N.A.; Hamilton, J.T.G.; Matthews, D.I. Rate and mode of application of the urease inhibitor N-(n-butyl) thiophosphoric triamide on ammonia volatilization from surface-applied urea. Soil Use Manag. 2008, 24, 246–253. [Google Scholar] [CrossRef]
  18. Zaman, M.; Nguyen, M.; Blennerhassett, J.; Quin, B. Reducing NH3, N2O and NO3-N losses from a pasture soil with urease or nitrification inhibitors and elemental S-amended nitrogenous fertilizers. Biol. Fertil. Soils 2008, 44, 693–705. [Google Scholar] [CrossRef]
  19. Al-Kanani, T.; MacKenzie, A.F.; Barthakur, N.N. Soil water and ammonia volatilization relationships with surface-applied nitrogen fertilizer solutions. Soil Sci. Soc. Am. J. 1991, 55, 1761–1766. [Google Scholar] [CrossRef]
  20. San Francisco, S.; Urrutia, O.; Martin, V.; Peristeropoulos, A.; Garcia-Mina, J.M. Efficiency of urease and nitrification inhibitors in reducing ammonia volatilization from diverse nitrogen fertilizers applied to different soil types and wheat straw mulching. J. Soc. Food Agric. 2011, 91, 1569–1575. [Google Scholar] [CrossRef] [PubMed]
  21. Sunderlage, B.; Cook, R.L. Soil property and fertilizer additive effects on ammonia volatilization from urea. Soil Sci. Soc. Am. J. 2018, 82, 253–259. [Google Scholar] [CrossRef]
  22. Jantalia, C.P.; Halvorson, A.D.; Follett, R.F.; Alves, B.J.R.; Polidoro, J.C.; Urquiaga, S. Nitrogen source effects on ammonia volatilization as measured with semi-static chambers. Agron. J. 2012, 104, 1595–1603. [Google Scholar] [CrossRef]
  23. Soil Survey Staff, Natural Resources Conservation Service, United States Department of Agriculture, Official Soil Series Descriptions. Available online: https://www.nrcs.usda.gov/conservation-basics/natural-resource-concerns/soil/citing-our-databases (accessed on 5 October 2024).
  24. Sikora, F.J.; Hardy, M. Soil organic matter. In Soil Test Methods from the Southeastern United States, 2nd ed.; Sikora, F.J., Moore, K.P., Eds.; Southern Cooperative Series Bulletin No. 419; Southern Extension and Research Activity Information Exchange Group-6 (SERA-IEG-6): Kentucky, KY, USA, 2014; pp. 48–53. [Google Scholar]
  25. Rosales, A.P. Kinetics of ammonium volatilization in the form of ammonia in soils through a textural gradient. Agro Prod. 2024, 17, 23–33. [Google Scholar]
  26. Damodar Reddy, D.; Sharma, K. Effect of amending urea fertilizer with chemical additives on ammonia volatilization loss and nitrogen-use efficiency. Biol. Fertil. Soils 2000, 32, 24–27. [Google Scholar] [CrossRef]
  27. Griggs, B.R.; Norman, R.J.; Wilson, C.E.; Slaton, N.A. Ammonia volatilization and nitrogen uptake for conventional and conservation tilled dry-seeded, delayed-flood rice. Soil Sci. Soc. Am. J. 2007, 71, 745–751. [Google Scholar] [CrossRef]
  28. Kissel, D.E.; Cabrera, M.L.; Ferguson, R.B. Reactions of ammonia and urea hydrolysis products with soil. Soil Sci. Soc. Am. J. 1988, 52, 1793–1796. [Google Scholar] [CrossRef]
  29. Silva, A.G.B.; Sequeira, C.H.; Sermarini, R.A.; Otto, R. Urease inhibitor NBPT on ammonia volatilization and crop productivity: A meta-analysis. Agron. J. 2017, 109, 1–13. [Google Scholar] [CrossRef]
  30. Rochette, P.; MacDonald, J.D.; Angers, D.A.; Chantigny, M.H.; Gasser, M.; Bertrand, N. Banding of urea increased ammonia volatilization in a dry acidic soil. J. Environ. Qual. 2009, 38, 1383–1390. [Google Scholar] [CrossRef] [PubMed]
  31. Manunza, B.; Deiana, S.; Pintore, M.; Gessa, C. The binding mechanism of urea, hydroxamic acid and N-(N-butyl)-phosphoric triamide to the urease active site. A comparative molecular dynamics study. Soil Biol. Biochem. 1999, 31, 789–796. [Google Scholar] [CrossRef]
  32. Xu, X.; Zhou, L.; Van Cleemput, O.; Wang, Z. Fate of urea-15N in a soil-wheat system as influenced by urease inhibitor hydroquinone and nitrification inhibitor dicyandiamide. Plant Soil 2000, 220, 261–270. [Google Scholar] [CrossRef]
  33. Xu, X.; Huang, Y.; Zhou, L.; Huang, G.; Cleemput, O. Effect of dicyandiamide and hydroquinone on the transformation of urea-nitrogen-15 in soil cropped to wheat. Biol. Fertil. Soils 2001, 34, 286–290. [Google Scholar] [CrossRef]
  34. Gioacchini, P.; Nastri, A.; Marzadori, C.; Giovannini, C.; Antisari, L.V.; Gessa, C. Influence of urease and nitrification inhibitors on N losses from soils fertilized with urea. Biol. Fertil. Soils 2002, 36, 129–135. [Google Scholar] [CrossRef]
Figure 1. Ammonia loss flux at sampling from surface-applied ESN®, UAN+ANVOLTM, urea+ANVOLTM, urea+Excelis®, SUPERU®, untreated UAN, and untreated urea onto (a) Loring silt loam and (b) Grenada silt loam during the 16 days of incubation study.
Soilsystems 09 00080 g001
Figure 2. Cumulative ammonia loss from surface-applied ESN®, UAN+ANVOLTM, urea+ANVOLTM, urea+Excelis®, SUPERU®, untreated UAN, and untreated urea onto (a) Loring silt loam and (b) Grenada silt loam during the 16 days of incubation study.
Soilsystems 09 00080 g002
Figure 3. Cumulative ammonia loss from surface-applied ESN®, UAN+ANVOLTM, urea+ANVOLTM, urea+Excelis®, SUPERU®, untreated UAN, and untreated urea onto (a) Loring silt loam and (b) Grenada silt loam during the 16 days of incubation study. Bars with the same letter are not significantly different across the two soils.
Soilsystems 09 00080 g003
Table 1. Enhance efficiency N fertilizer (EENF) used, manufacturers, fertilizer additives, and recommended application rates.
EENFType of EENFCompanyName and Conc. (%) of Active Ingredients Application Rate (L/kg)
ANVOLTMNitrogen stabilizerKoch Industries, Wichita, KS, USANBPT (10–20%); Duromide (20–30%);
N-methyl-2-pyrrolidone (<10%)
0.0014 (Urea)
0.0007 (UAN)
Excelis®Nitrogen stabilizerTimac Agro, Reading, PA, USANBPT (12%); DCD (2%); Other extracts (0.8%)0.0019 (Urea)
0.0021 (UAN)
ESN®Slow-release Agrium U.S. Inc., Loveland, CO, USAUrea (>95%); Castor oil (4%);
Imidodicarbonic diamide (<1%)
N/A
SUPERU®Nitrogen stabilizerKoch Industries, Wichita, KS, USAUrea (60–100%); DCD (0.85%); NBPT (0.06%);
N-Methyl-2-pyrrolidone (<0.1%)
N/A
NBPT, N-(butyl) thiophosphoric triamide.
Table 2. Selected physiochemical properties.
Soil PropertyValue
LoringGrenada
Soil pH5.87.0
Soil Organic Matter (g/kg)304.2
Estimated Nitrogen Release (# N/ha)8068
Mehlich 3 extractable nutrients
   Sulfur (ppm)199.0
   Phosphorus (mg/kg)9097
   Calcium (mg/kg)14041999
   Magnesium (mg/kg)120267
   Potassium (mg/kg)155225
   Sodium (mg/kg)10.011
   Boron (mg/kg)0.80.6
   Iron (mg/kg)296.0170
   Manganese (mg/kg)106.091
   Copper (mg/kg)1.11.7
   Zinc (mg/kg)5.45.2
   Aluminum (mg/kg)401508
   Clay (g/kg)140180
   Sand (g/kg)360330
   Silt (g/kg)500490
   Field capacity (g/kg)300320
Loring, Loring silt loam with 8–12% slope; Grenada, Grenada silt loam with 2–5% slope.
Table 3. Ammonia loss rate (% of applied N d−1) for all treatments applied onto the two soils.
SoilN SourceSampling Time (Days After Fertilizer Application)
12345679111316
-------------------------------------------% of Applied N d−1----------------------------------------------
LoringUntreated urea5.513.15.11.40.80.20.10.10.10.10.1
Untreated UAN0.31.31.90.80.30.20.10.10.10.10.1
SUPERU®0.10.10.41.01.51.81.82.20.90.40.3
Urea+Excelis®0.10.21.02.22.51.70.80.50.20.20.2
Urea+ANVOLTM0.10.10.20.71.01.21.01.00.20.20.1
UAN+ANVOLTM0.10.20.30.60.70.70.40.30.30.20.2
ESN®0.10.10.30.60.60.30.30.40.30.20.2
GrenadaUntreated urea7.311.73.20.80.50.10.10.10.10.10.1
Untreated UAN6.07.11.90.40.20.10.10.10.10.10.1
SUPERU®0.63.14.33.72.10.90.40.40.20.20.1
Urea+Excelis®0.31.93.32.91.50.50.10.10.10.10.1
Urea+ANVOLTM0.10.71.51.71.40.70.20.20.10.10.1
UAN+ANVOLTM0.50.70.91.00.70.30.10.20.20.20.2
ESN®0.10.40.40.20.10.10.10.30.20.20.2
The ammonia loss rate was calculated by dividing ammonia loss at sampling by the days between sampling intervals. The font in bold represents the maximum ammonia loss rate for each treatment.
Table 4. Interactive effect between N source and cumulative ammonia volatilization (% of applied N) on 1, 3, 7, and 16 DAF and DIFF (difference between corresponding initial rates of ammonia loss and maximum ammonia loss across all treatments) in the two soils.
SoilN Source1 DAF †3 DAF7 DAF16 DAFDIFF ¥
--------------------------------% of Applied N -----------------------------------------
LoringUntreated urea5.49 b23.61 a26.22 a26.49 a21.00 a
Untreated UAN0.26 c3.52 e4.85 fg5.24 de4.98 d–f
SUPERU®0.11 c0.59 f6.62 ef10.43 c10.32 c
Urea+Excelis®0.10 c1.35 f8.53 de9.58 c9.48 c
Urea+ANVOLTM0.10 c0.40 f4.18 f–h5.65 de5.55 de
UAN+ANVOLTM0.10 c0.58 f2.88 g–i3.83 ef3.73 d–f
ESN®0.10 c0.53 f2.28 hi3.28 ef3.18 fg
GrenadaUntreated urea7.35 a22.32 a23.87 b24.12 a16.77 b
Untreated UAN6.00 a15.00 b15.85 c16.17 b10.17 c
SUPERU®0.59 c8.11 c15.36 c16.34 b15.75 b
Urea+Excelis®0.25 c5.45 d10.50 d11.03 c10.78 c
Urea+ANVOLTM0.13 c2.21 ef6.20 ef6.67 d6.54 d
UAN+ANVOLTM0.48 c2.07 ef4.23 f–h4.93 de4.45 d–f
ESN®0.11 c0.88 f1.38 i2.18 f2.07 g
† DAF, Days after fertilizer application. ¥ Difference between corresponding initial rates of ammonia loss and maximum ammonia loss across all treatments (16 DAF − 1 DAF). Means followed by the same letter within a column are not significantly different at α = 0.05.
Table 5. Cumulative ammonia loss at the end of sampling and reduction (%) compared to the corresponding untreated forms.
N TreatmentLoringGrenada
Ammonia LossReductionAmmonia LossReduction
% of Applied N% % of Applied N%
Untreated UAN5.2-16.2-
Untreated urea26.5-24.1-
UAN+ANVOLTM3.827 *4.970 *
SUPERU®10.46116.332
Urea+Excelis®9.66411.054
Urea+ANVOLTM5.7796.772
ESN®3.3882.291
Reduction = (urea − EENF)/untreated urea × 100, where EENF represents SUPERU®, urea+Excelis®, urea+ANVOLTM, and ESN fertilizers. * % reduction = (UAN − UAN + ANVOLTM)/untreated UAN × 100.
Disclaimer/Publisher’s Note: The statements, opinions and data contained in all publications are solely those of the individual author(s) and contributor(s) and not of MDPI and/or the editor(s). MDPI and/or the editor(s) disclaim responsibility for any injury to people or property resulting from any ideas, methods, instructions or products referred to in the content.

