Article

Impact of Different Soil Tillage Practices on Microplastic Particle Abundance and Distribution

by
Bruno Ćaleta
1,
Branimir Hackenberger Kutuzović
2,
Danijel Jug
3,
Irena Jug
3 and
Davorka Hackenberger Kutuzović
2,*
1
Institute of Applied Ecology—Oikon Ltd., 10020 Zagreb, Croatia
2
Department of Biology, J.J. Strossmayer University of Osijek, 31000 Osijek, Croatia
3
Faculty of Agrobiotechnical Sciences Osijek, J.J. Strossmayer University of Osijek, 31000 Osijek, Croatia
*
Author to whom correspondence should be addressed.
Soil Syst. 2025, 9(2), 63; https://doi.org/10.3390/soilsystems9020063
Submission received: 6 April 2025 / Revised: 2 June 2025 / Accepted: 11 June 2025 / Published: 13 June 2025

Abstract

:
Microplastic contamination in agricultural soils has become a growing concern due to its potential impact on soil quality and ecosystem health. This study aimed to quantify the abundance, particle shape ratio, and examine the vertical distribution of microplastic particles in agricultural soils under different tillage and fertilization regimes. Field experiments were conducted using a split-split-plot design at two sites with differing land-use histories. Treatments included conventional tillage (ST), conservation tillage (deep (CTD) and shallow (CTS)), and varying fertilization practices. Microplastics (MPs) were detected in 100% of soil samples, ranging from 200 to 7400 particles/kg. Statistical analysis showed significantly lower MPs abundance in CTS compared to CTD, while ST showed intermediate levels. Vertical profiles revealed homogeneous distribution in ST and CTS and heterogeneous distribution in CTD, with the highest accumulation in the topsoil. At the Cacinci site, fertilization significantly increased MPs levels (p = 0.021), supporting the hypothesis that inorganic fertilizers contribute to microplastic input as well. This study highlights the need for agricultural practices that minimize both the input and vertical redistribution of MPs in soils, as well as the need for more research on this topic.

1. Introduction

Microplastics (MPs) are synthetic polymer particles that are smaller than 5 mm, with lower limit being 1 μm [1]. Research on microplastics in soil ecosystems has intensified in recent years soils, as soils are recognized as both a major sink and source of MPs [2]. Soil MPs contamination has been estimated to be 4 to 23 times greater than marine MPs contamination, highlighting the urgent need to better understand terrestrial MPs pollution [3]. However, even this can be an underestimate, as new studies on marine water and sediment report up to 15 times higher quantities of MPs than previously recorded [4].
Once incorporated into the soil, MPs can alter its physical properties (e.g., bulk density, aggregate stability, micro- and macropores ratio, water permeability, rate of moisture evaporation, and water retention capacity [3,5,6,7,8]), as well as its chemical and biological characteristics. MPs can adsorb and desorb organic pollutants, heavy metals, and antibiotics, as well as release toxic chemical additives into the surrounding soil and potentially into other ecosystem compartments [9,10,11,12]. In addition to adversely affecting soil properties, MPs can negatively influence soil microorganisms, flora, and fauna [13,14,15,16]. Their effects on soil organisms may be indirect—via aforementioned changes in soil properties—or direct, impairing physiological functions such as feeding, reproduction, and enzyme activities [17]. Hence, the contamination of soil with MPs could severely deteriorate physical and biological aspects of soil and consequently impact agricultural production.
Corradini et al. [18] found that agricultural fields were most polluted and that agricultural activities could be one of the main sources of soil MPs pollution. The concentration of MPs particles in agricultural fields is found to depend on land use and various management practices [19]. Major input pathways of MPs into agricultural soils are atmospheric deposition, littering, tire abrasion, surface runoff, sewage sludge and other fertilizers, plastic mulching, irrigation, and flooding [8,20]. As healthy soils are indispensable in food security, ecosystem services, and climate resilience, understanding the dynamics of MPs contamination is crucial. Despite growing evidence of widespread MPs in agricultural soils, knowledge gaps remain—particularly regarding the factors that control vertical movement and accumulation.
One major concern is the potential for vertical migration of microplastics into groundwater. Vertical and horizontal MPs transport is influenced by several factors, including soil biota; physical soil properties such as macropores, aggregation, and cracking; precipitation; and agricultural activities such as plowing and harvesting [19]. The potential 100-year penetration depth of MPs was found to be 5.24 m, with smaller size particles having a greater potential for downward movement under wet–dry cycles [21]. In addition to particle size, the type of polymer and surface hydrophobicity show the strongest correlation with MPs mobility [22]. Studies have also shown that different crop root systems could influence MPs mobility in soil and that some of the root systems could contribute to the upward movement of MPs in the soil profile [23]. Rillig et al. [24] hypothesized that plowing could push MPs from the surface to a single layer at the plowing depth, whereas shallow harrowing could have a mixing effect resulting in the distribution of MPs throughout the whole tillage layer.
Generally, the spatial distribution of soil MPs in agricultural landscapes is assumed to be highly heterogeneous due to the influence of the cropping system and management practices [25]. However, significant knowledge gaps remain regarding the vertical migration of MPs and the influence of specific agricultural practices, such as tillage and fertilization, on their distribution.
In this study, we quantified the abundance and identified the shapes of microplastics (MPs) across three soil depths (0–10, 10–20, and 20–30 cm) in experimental fields subjected to different tillage (conventional, shallow conservation, and deep conservation) and fertilization (recommended and reduced) regimes. We aimed to assess how these agricultural practices influence the vertical distribution of MPs. Based on field design, we hypothesized that reduced soil disturbance under conservation tillage would result in limited vertical translocation of MPs, while fertilization regimes could act as an additional source of MPs.

2. Materials and Methods

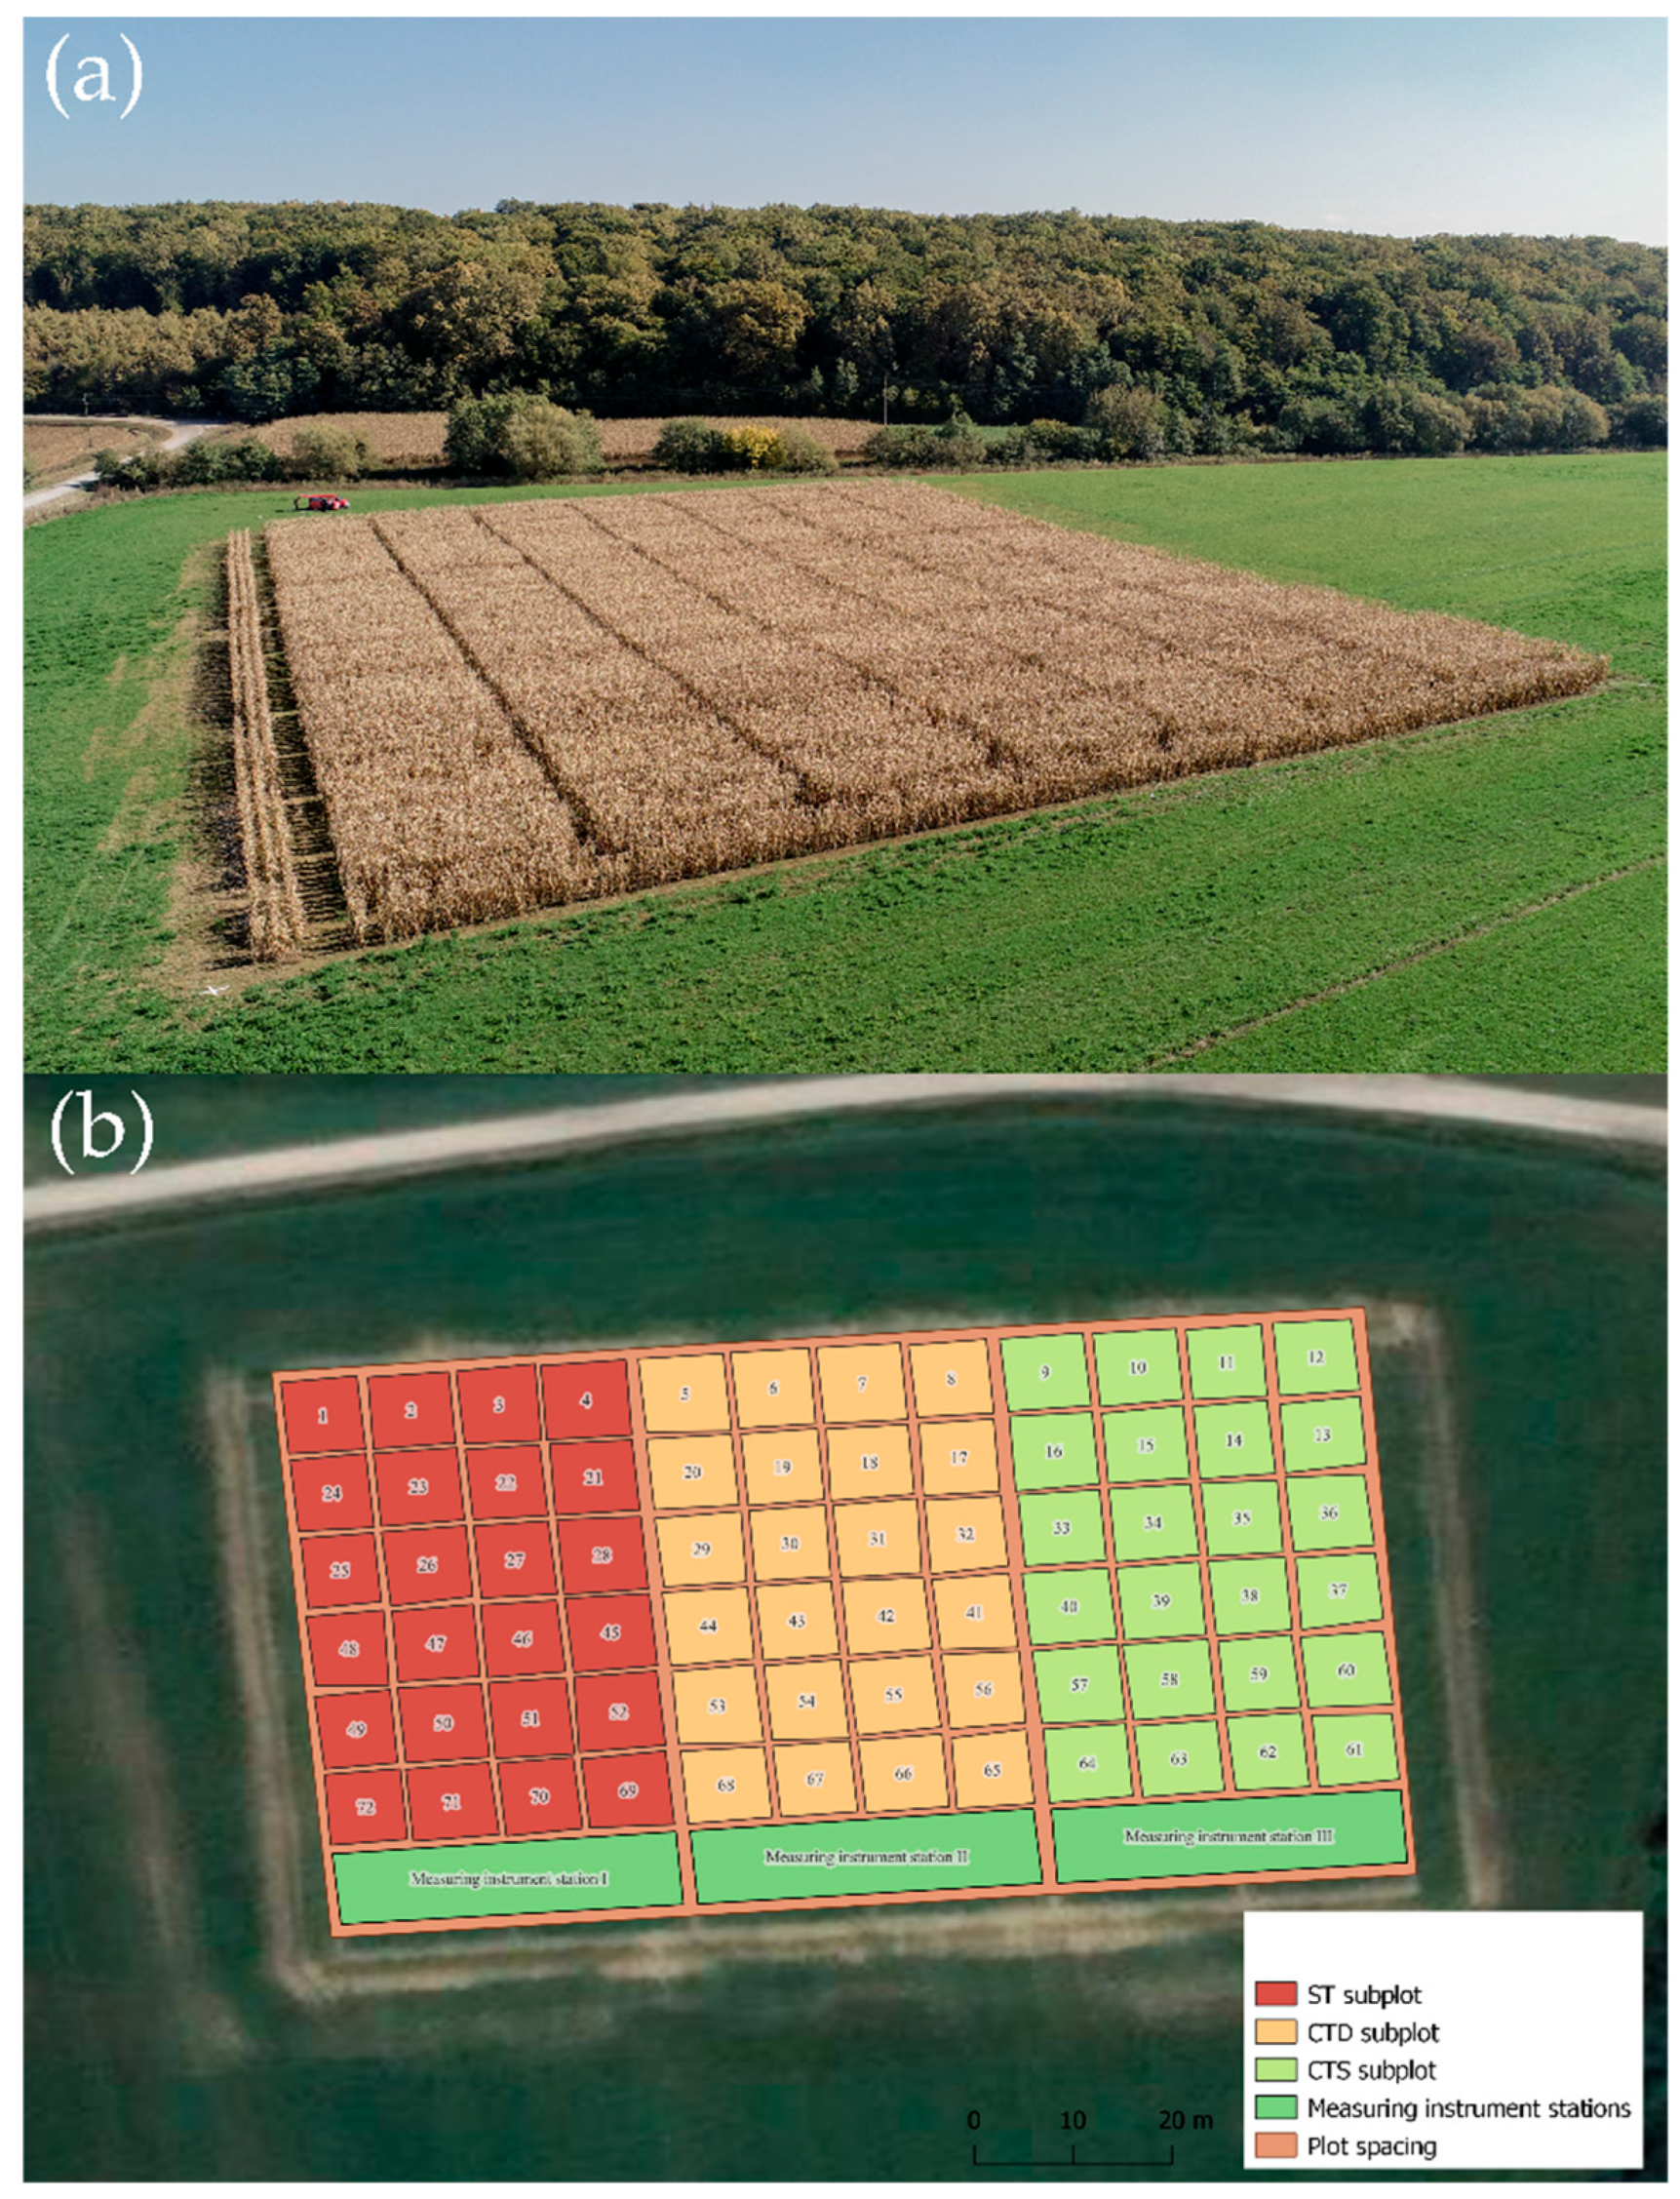
2.1. Site Description, Experimental Design, and Treatments

Two experimental split-split-plot fields are located near Cacinci, Croatia (Long. 17.863508 E, Lat. 45.6134353 N, Altitude 117 m) and Krizevci, Croatia (Long. 16.558217 E, Lat. 46.0278038 N, Altitude 140 m) (Supplementary Material, Figure S1). The experimental field in Cacinci was traditionally used for cropland, while the experimental field in Krizevci was grassland left without disturbance for at least 15 years prior to being adapted to the experimental split-split-plot design. The experimental sites also differ in soil properties. The samples were taken across the experimental site from a depth of 0–30 cm and homogenized in average samples. Some of the measured parameters are summarized in Table 1. Additionally, soil pH was measured according to ISO 10390 procedure [26]; soil organic carbon (SOC) according to ISO 14235 standard [27]; soil organic matter content (SOM) conversion of SOC to SOM according to Pribyl [28]; soil texture analysis by sieving and sedimentation method according to ISO 11277 [29]. More details on the experimental sites are given in Jug et al. [30]. There was no slope on either of the experimental plots.
Both plots had the same experimental design. Namely, we employed three types of tillage systems: conventional tillage system (ST), deep conservation tillage system (CTD), and shallow conservation tillage system (CTS). Within the ST, standard plowing was used as a tillage practice, in which plowing was conducted using a reversible moldboard plow at a depth of 30 cm; within the CTD, a subsoiler with a star roller was utilized as a primary tillage treatment at a depth of 30 cm; and within the CTS, a subsoiler with a star roller at a depth of 5–10 cm was utilized as a primary tillage treatment. In addition, they differed in terms of crop cover residues management. Namely, CTD and CTS had minimum permanent crop cover residues of a minimum of 30% and 50%, respectively, left on the soil surface and counted after sowing [31]. Furthermore, each tillage system was divided according to the treatment used for the soil conditioning. Different treatments included liming (with calcium oxide according to recommendation)—half of each experimental parcel were subjected to liming and the other half not, and fertilization was applied. Fertilization included a treatment with a recommended quantity (NPK, urea, and CAN (calcium ammonium nitrate)) (FR) and a treatment with a 50% of the recommended fertilizer amount (FD). Each fertilization treatment was further subdivided into two subplots: one with the application of Geo2 (biophysiological soil activator) (recommended fertilization quantity and GeO2—GFR and 50% recommended fertilizer amount and GeO2—GFD) and one without (only fertilizers as explained above). Fertilizers were applied uniformly across all tillage treatments, following identical application schedules. The total fertilizer input varied depending on the experimental location and the specific fertilization treatment. Fertilization was carried out with NPK (0:20:30) fertilizer and urea (46% nitrogen) during the autumn with primary tillage, while CAN (calcium ammonium nitrate, 27% nitrogen) was applied pre-sowing in the spring. The general scheme of split-split-plot design used in our study is shown in Figure 1. Plots were separated with 2 m wide spacing, and subplots were separated with 1 m wide spacing. The size of the main plots for tillage was 640 m2, while the subplots measured 160 m2 for the liming treatment, and split-split plots for the fertilization treatment were 80 m2. Each agrotechnical measure, e.g., soil cultivation, fertilization, and sowing, was carried out identically and simultaneously at both sites, with a time difference between the sites of one or two days.

2.2. Soil Sampling and Sample Preparation

Soil was sampled using a single root auger (Ø 8 cm, 15 cm; Eijkelkamp Soil & Water). Within the plots, 10 random locations were selected, and the soil was sampled at three depths at each location: 0–10 cm (T—top), 10–20 cm (M—middle), and 20–30 cm (B—bottom). These depths were chosen based on the common depth of the plow layer in agricultural fields. The total number of soil samples at both experimental plots was 180. Each sample was kept at room temperature (22 ± 2 °C) in the dark until sample preparation and analysis.
Prior to the analysis of microplastics (MPs) content, soil samples were dried at room temperature for 24–48 h, crushed with a pestle and mortar, and further dried to a constant mass. After drying, soil samples were weighed, and 5 ± 0.01 g of soil was transferred to a 250 mL Erlenmeyer flask.
To minimize the risk of cross-contamination during laboratory procedures, quality control measures were implemented. All equipment and glassware were thoroughly rinsed with distilled water and covered with aluminum foil when not in use. Sample preparation was conducted in a laminar flow cabinet, and personnel wore cotton lab coats and nitrile gloves to avoid synthetic fiber shedding. Non-plastic tools were used whenever possible. Samples were kept in closed, dust-free environments until analysis (up to three months).

2.3. Microplastics Extraction

The protocol included soil organic matter digestion, density separation, filtration, visual identification of isolated microplastics, and further quantitative and qualitative analysis. In the first step, soil organic matter was digested using hydrogen peroxide 30% w/v according to Hurley et al. [32]. Namely, 10 mL of hydrogen peroxide was repeatedly added into an Erlenmeyer flask with a weighted soil sample at the temperature of 60 °C until foaming ceased. The samples were then dried at 60 °C for 24 h.
After drying, soil microplastics were extracted using density separation with an aqueous solution of 5M zinc(II) chloride. While this method is widely used due to its efficiency in isolating MPs from complex matrices, it has limitations. For instance, certain high-density polymers may not be fully recovered, and the risk of contamination during sample processing must be carefully managed. A total of 50 mL of ZnCl2 was mixed with a dried soil sample in an Erlenmeyer flask on a magnetic stirrer for 10 min. After mixing, the content of the flask was transferred into a cylinder with a top-overflow adapter according to Vermeiren et al. [33]. Erlenmeyer flask was rinsed with 30 mL ZnCl2 solution, and the contents of the flask were again transferred into the same measuring cylinder. The contents of the measuring cylinder were stirred using the magnetic stirrer for 10 min and left to sediment for 2 h afterward. Following sedimentation, a ZnCl2 solution using a wash bottle was added to the sedimentation column using the top-overflow method. The top part of the sedimentation column was rinsed with ZnCl2 solution until no particles were visible, and the rinsing solution was collected into a 100 mL beaker. Afterward, the sedimentation and top-overflow processes were repeated. The beaker content was vacuum filtered, and filters containing microplastics were dried for 24 h before visual inspection using a stereomicroscope. Microplastics were isolated from filter paper according to the criteria from Norén [34].
Isolated particles were transferred from the filter to microscope slides, and particles were counted and photographed using the DP-M17 USB microscope camera (9 MP) for further qualitative analysis. The qualitative analysis included individual MP shape determination and size measurement regardless of polymer type of individual particle. The qualitative analysis was conducted using ImageJ 1.5 [35]. According to existing literature, microplastic particles are usually divided into few categories including spheres, beads, pellets, foams, fibers, fragments, films, and flakes [36]. We classified microplastic particles from our study into two categories: fragments, which include irregularly shaped particles, and fibers, which include thread-like particles. Size parameters that were measured in the qualitative analysis are maximum Feret diameter and 2D area for fragments and length for fibers (Supplementary Material, Figure S2). On isolated MPs from several samples, a “hot needle” test was applied for the verification of microplastic identification [37]. Isolated particles were stored using two folded microscope slides wrapped with parafilm.

2.4. Data Analysis

Quantitative results of MPs were reported as the number of particles per mass unit of dry soil calculated from an initial 5 g sample. Qualitative results of MPs included particle shape (fragments or fibers), Feret diameter and 2D area of fragments, and fiber length. Statistical analyses were performed in the R programming environment [38] using a suite of methods: repeated measures one-way ANOVA (vertical distribution of MPs and tillage type), pairwise t-tests with Bonferroni adjustment, non-parametric Friedman rank-sum tests, Wilcox post hoc tests, Chi-squared tests, and multiple linear regression (different comparison of MPs abundance, shape, and distribution and applied treatments and/or physico-chemical soil properties). Bayesian regression models were also employed to assess credible intervals and validate frequentist findings (MPs abundance between sites and tillage types).
The influence of liming and fertilization on microplastic abundance was evaluated using ANOVA and linear regression. Differences in fragment-to-fiber ratios across soil depths, and plots were tested with Chi-squared tests. The fragment ratio (Rf) was calculated as
Rf = Nfra/(Nfra + Nfib),
where Nfra is the number of fragments, and Nfib is the number of fibers in a sample. Rf ranges from 0 (all fibers) to 1 (all fragments). This ratio was further analyzed using ANOVA and multiple linear regression to assess the effects of tillage and soil depth.

3. Results

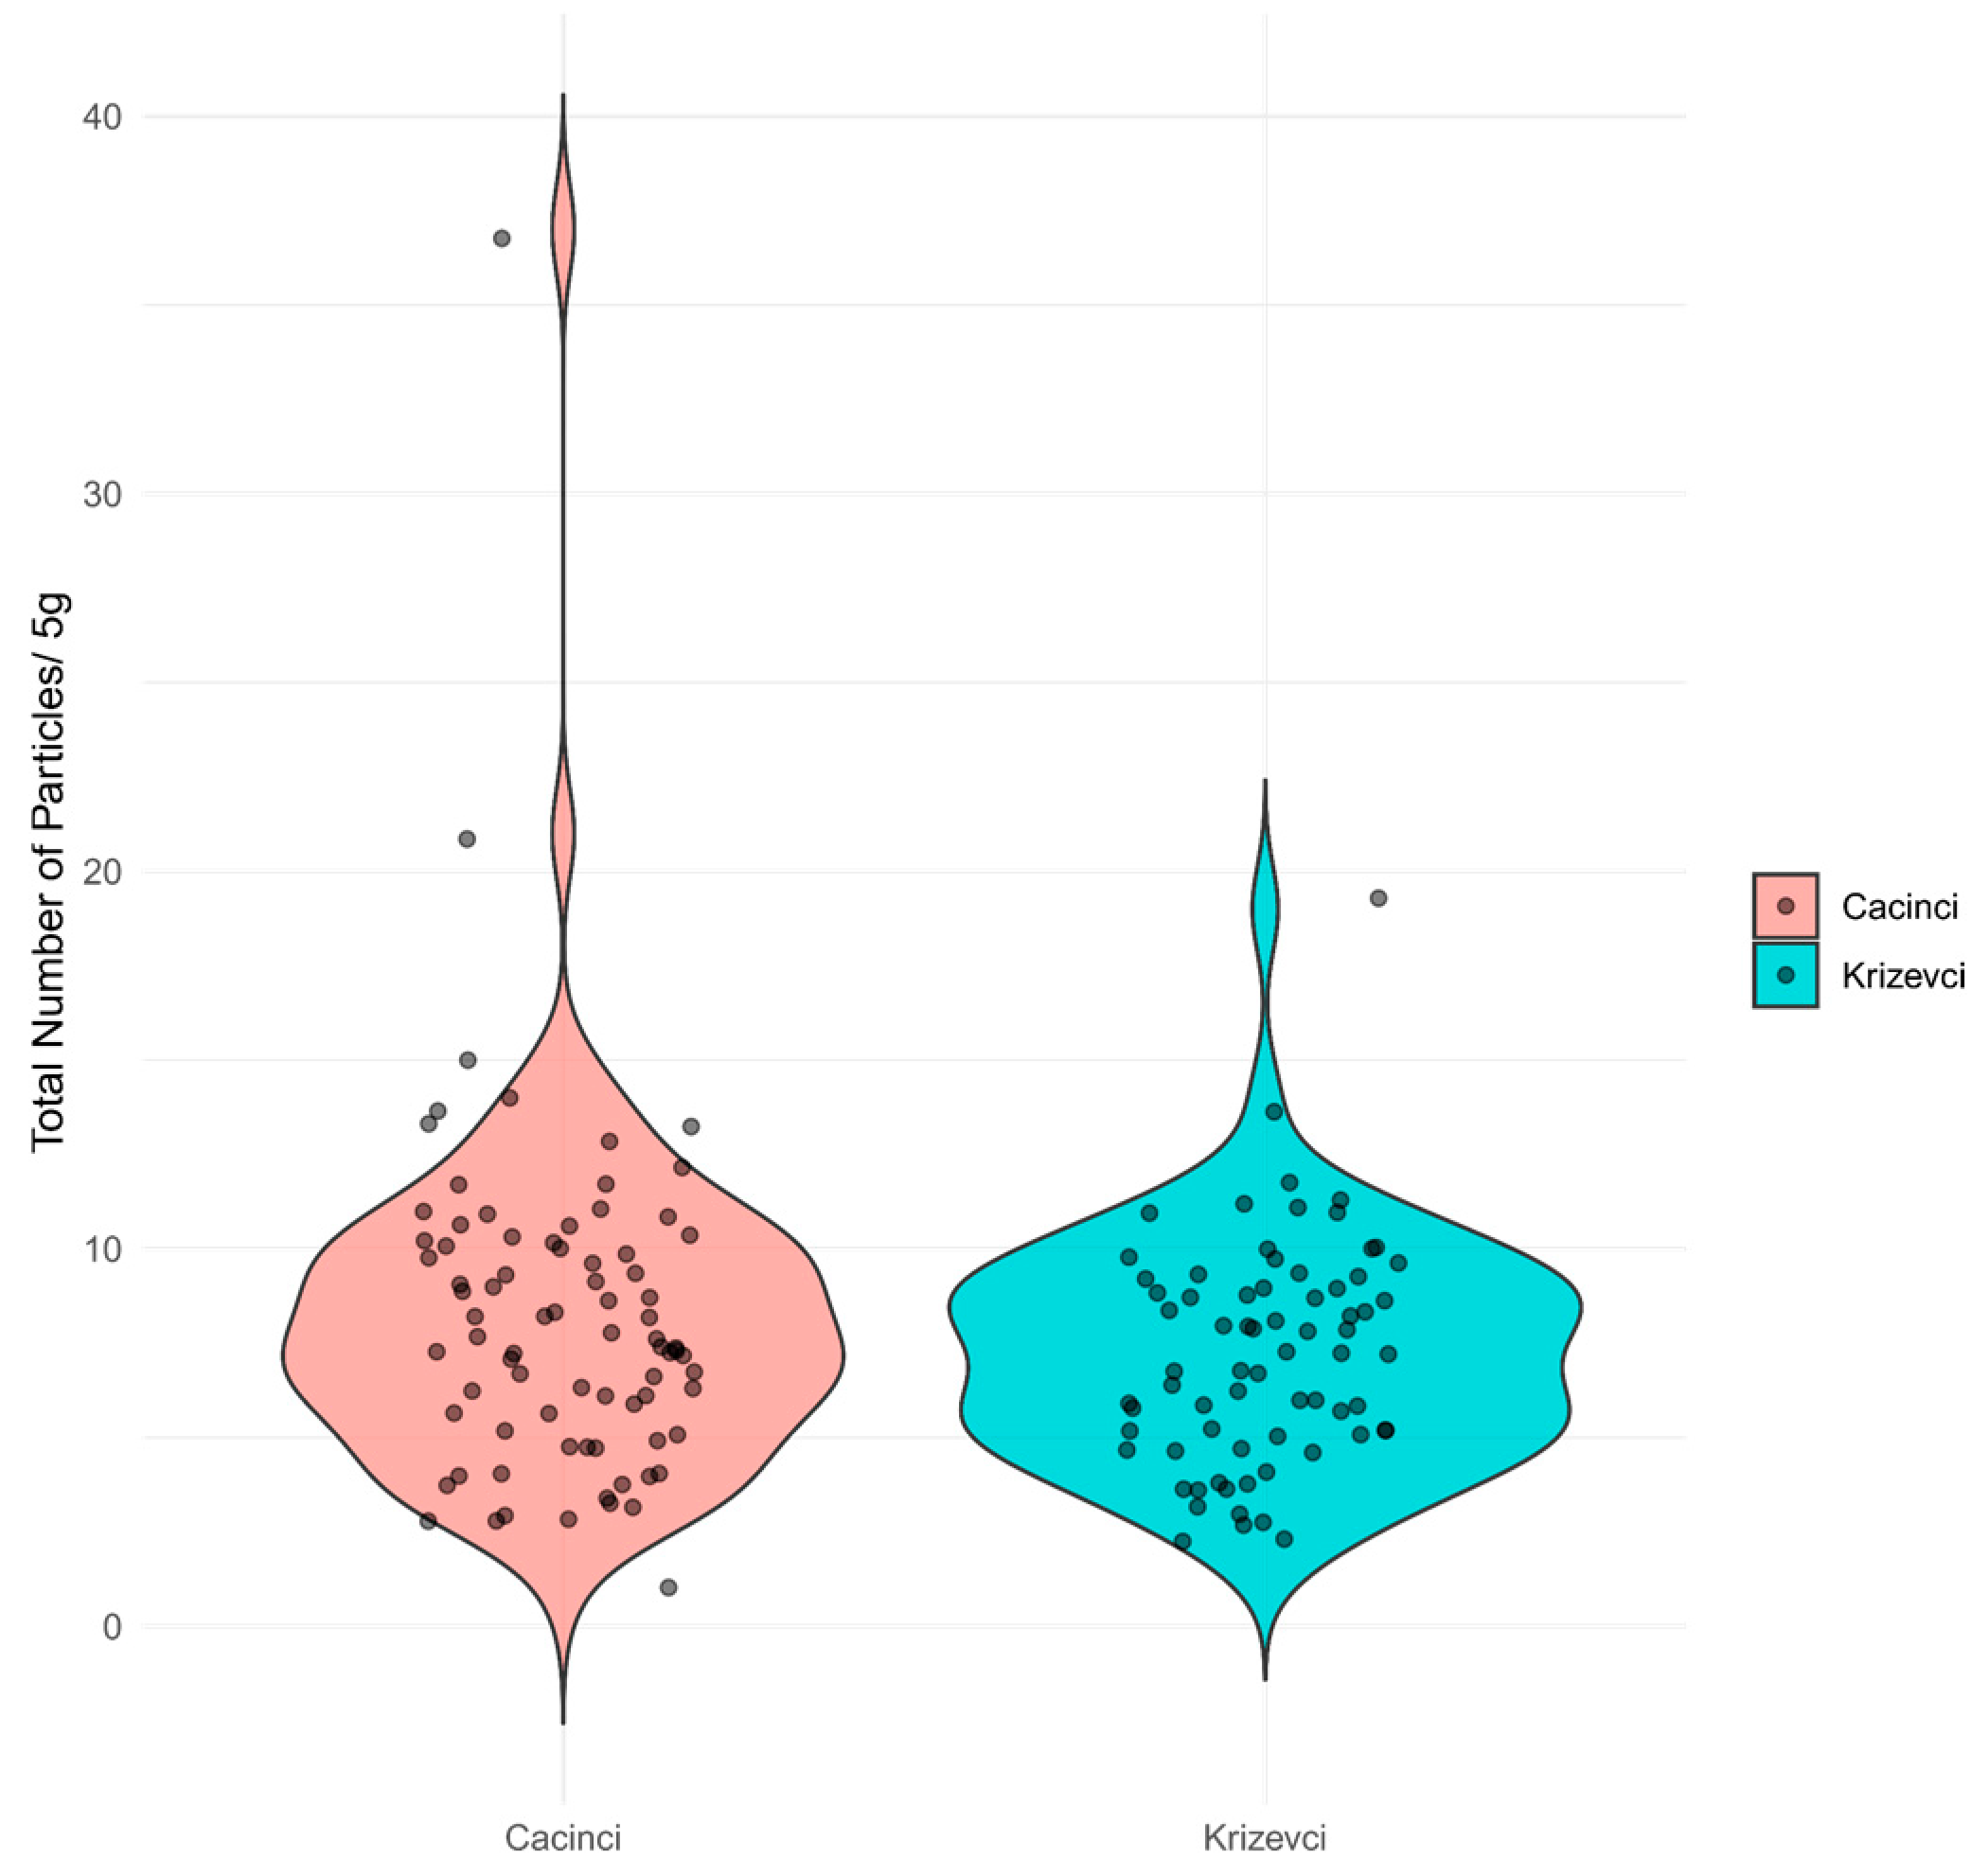
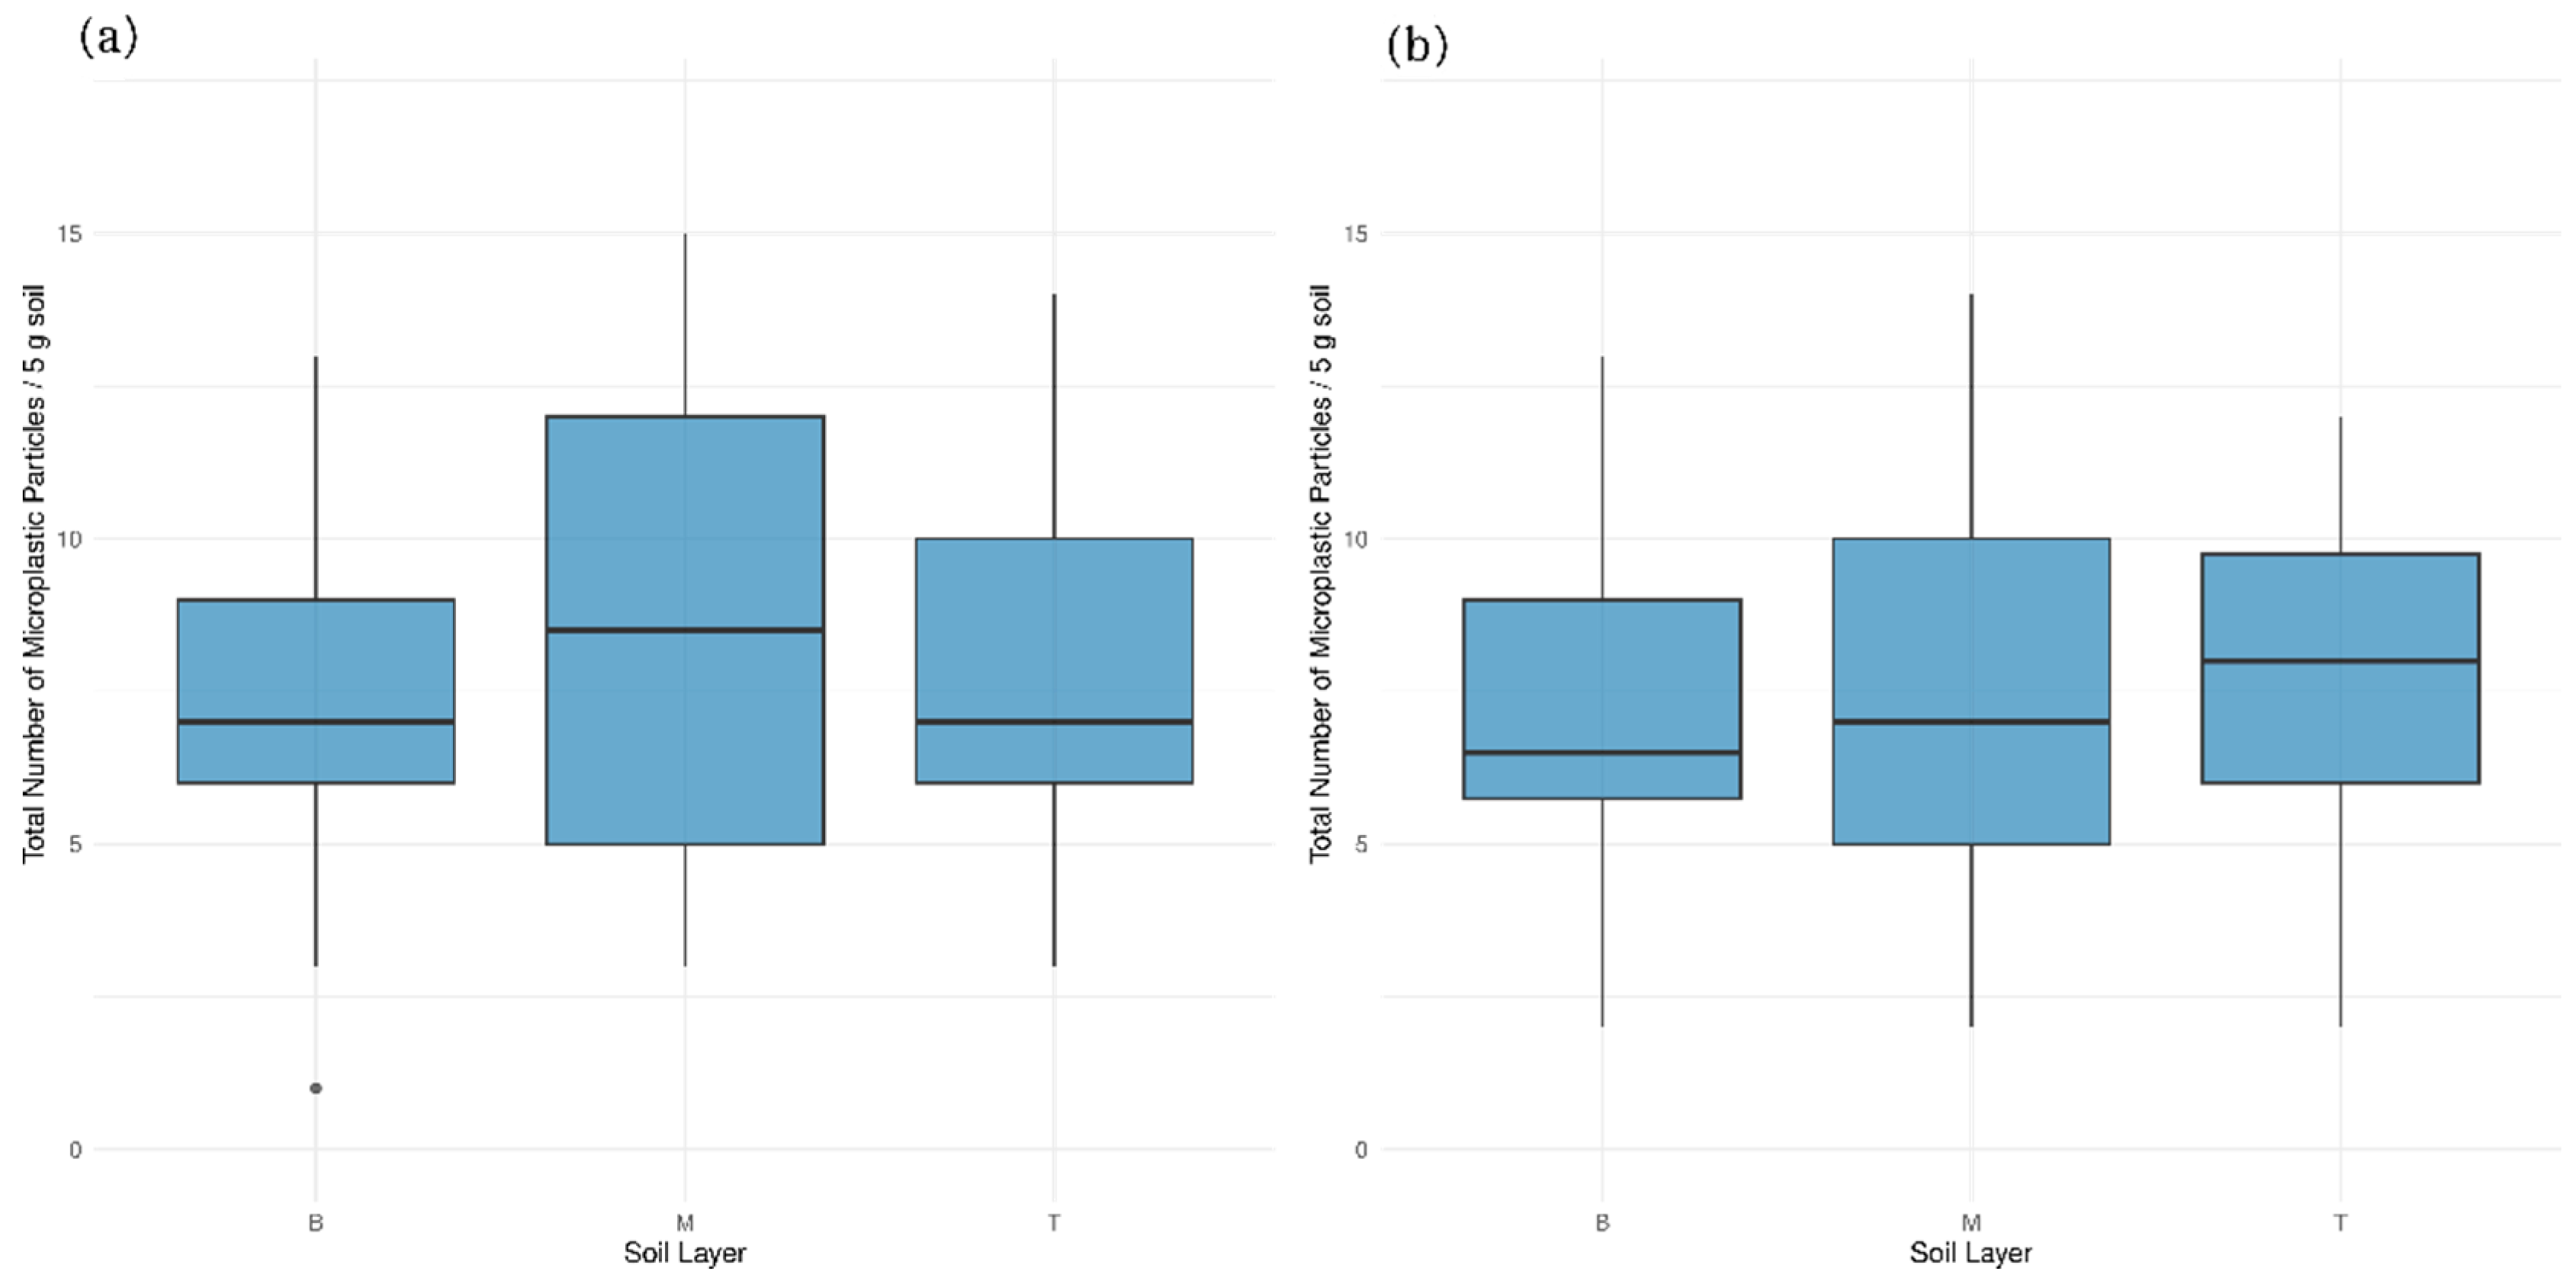
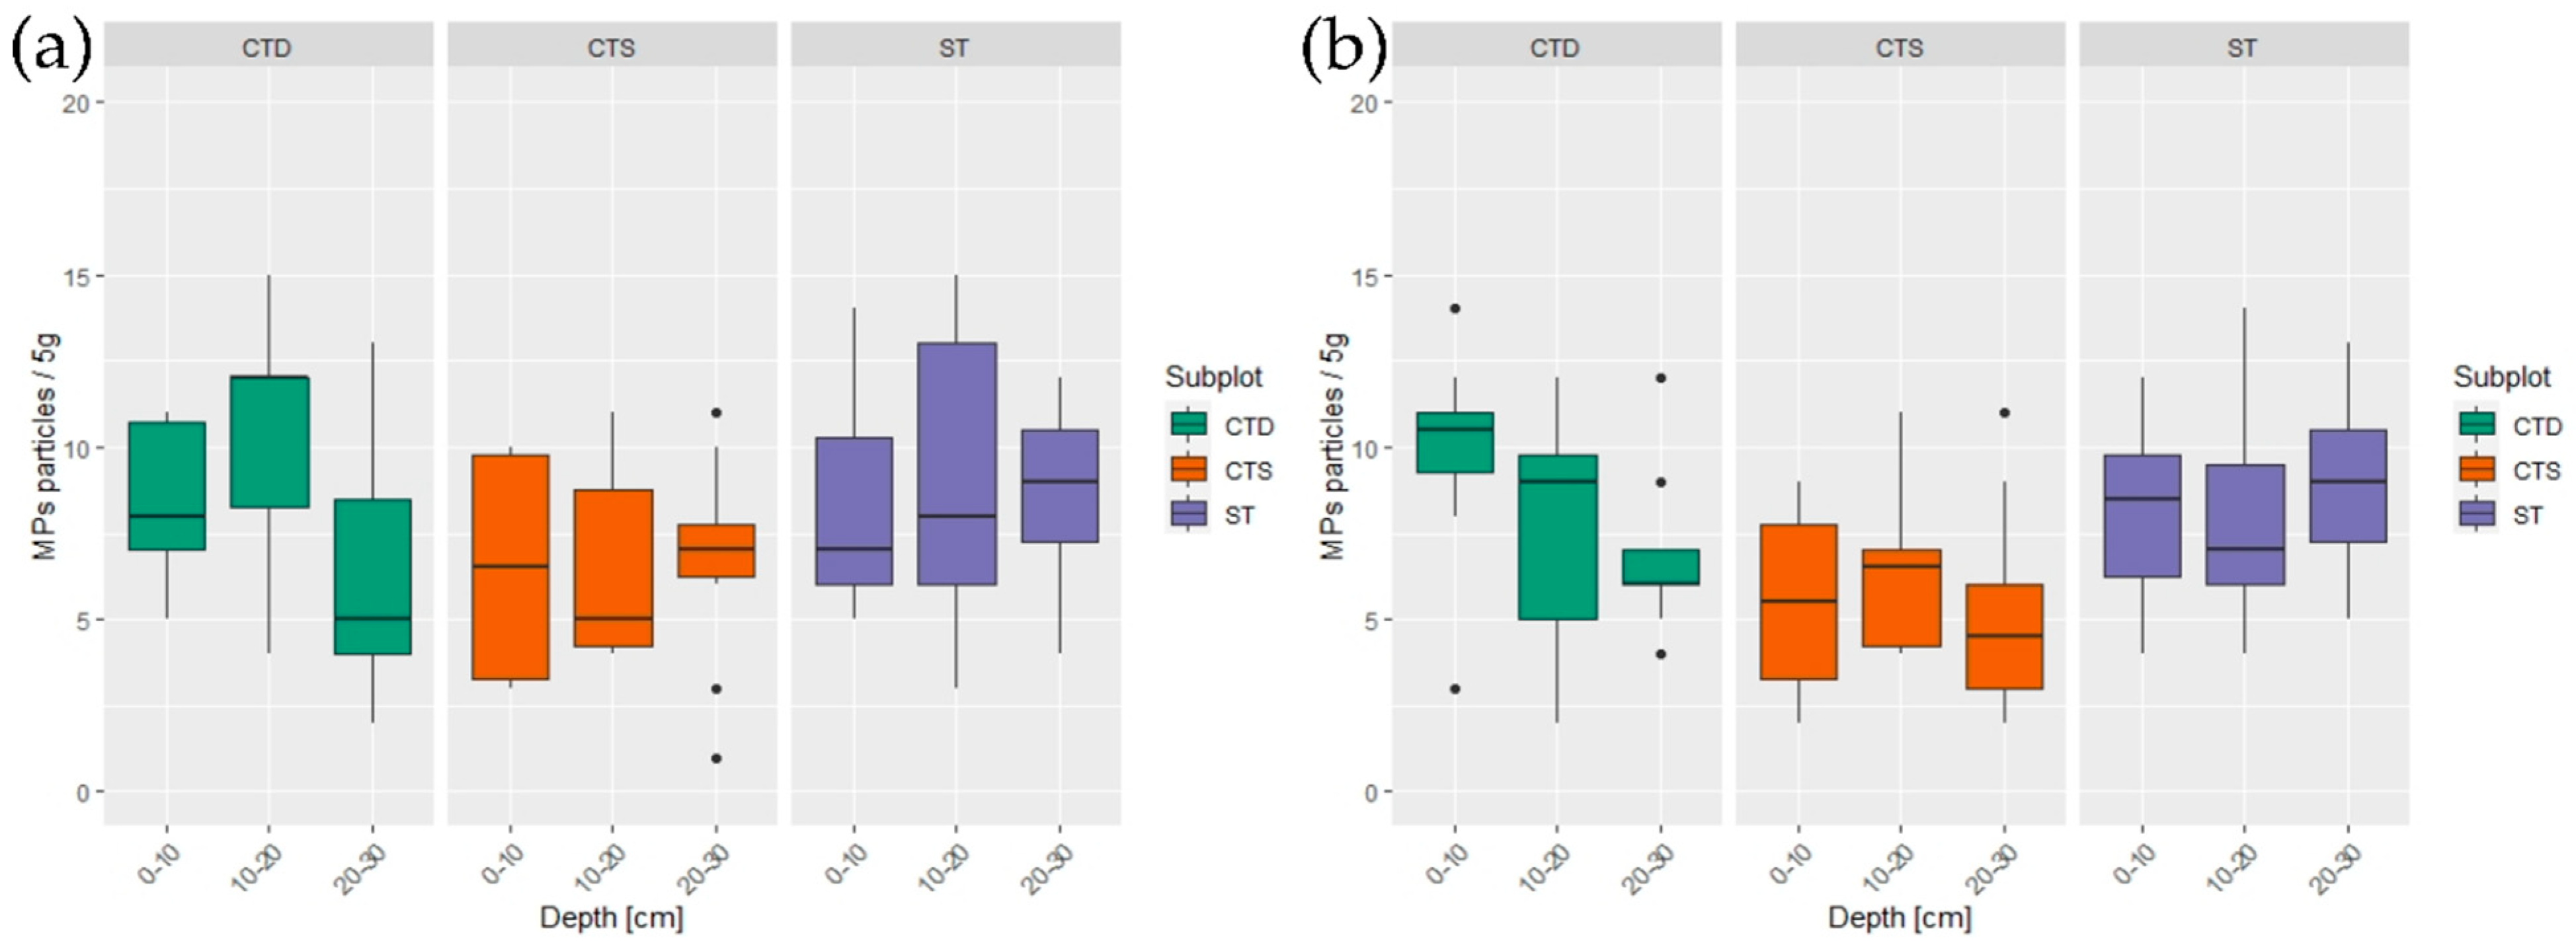
3.1. Effect of Site, Soil Characteristics, and Vertical Distribution of Microplastic Particles

All samples contained microplastics (MPs) in various quantities. The total quantity of MPs did not differ between experimental sites (p = 0.2185; Mann–Whitney U test) (Figure 2). Bayesian factor analysis also showed weak evidence of a significant difference in MPs quantity between the sites. A number of MPs per kg of soil ranged from 200 to 7400, with an average of 1560.
The soil physico-chemical parameters analyzed for MPs variability included soil texture (sand, silt, or clay), soil pH (H2O), and soil organic carbon (SOC) (Supplementary Material, Table S1). The summary of the analysis between vertical distribution, soil physico-chemical parameters, and number of microplastic particles at both sites is given in Table 2. Namely, in the long-term cultivated site Cacinci, there was no significant effect of any of the analyzed parameters. On the other hand, in the Krizevci site, which was not plowed for over a decade prior to the experiment, there was a negative correlation between the variability in MPs size and the amount of soil organic carbon. Soil texture was found to have a possible influence (p ≈ 0.048).
The analysis showed that the number of MPs between soil layers (B—bottom, M—middle, and T—top) was not statistically different at both experimental sites (Figure 3).
Additionally, MPs size did not significantly differ (p > 0.05) between soil layers when both sites were compared. However, at the Krizevci site, regression analysis suggested higher size variability in the middle and topsoil layers compared to the bottom (Table 3).

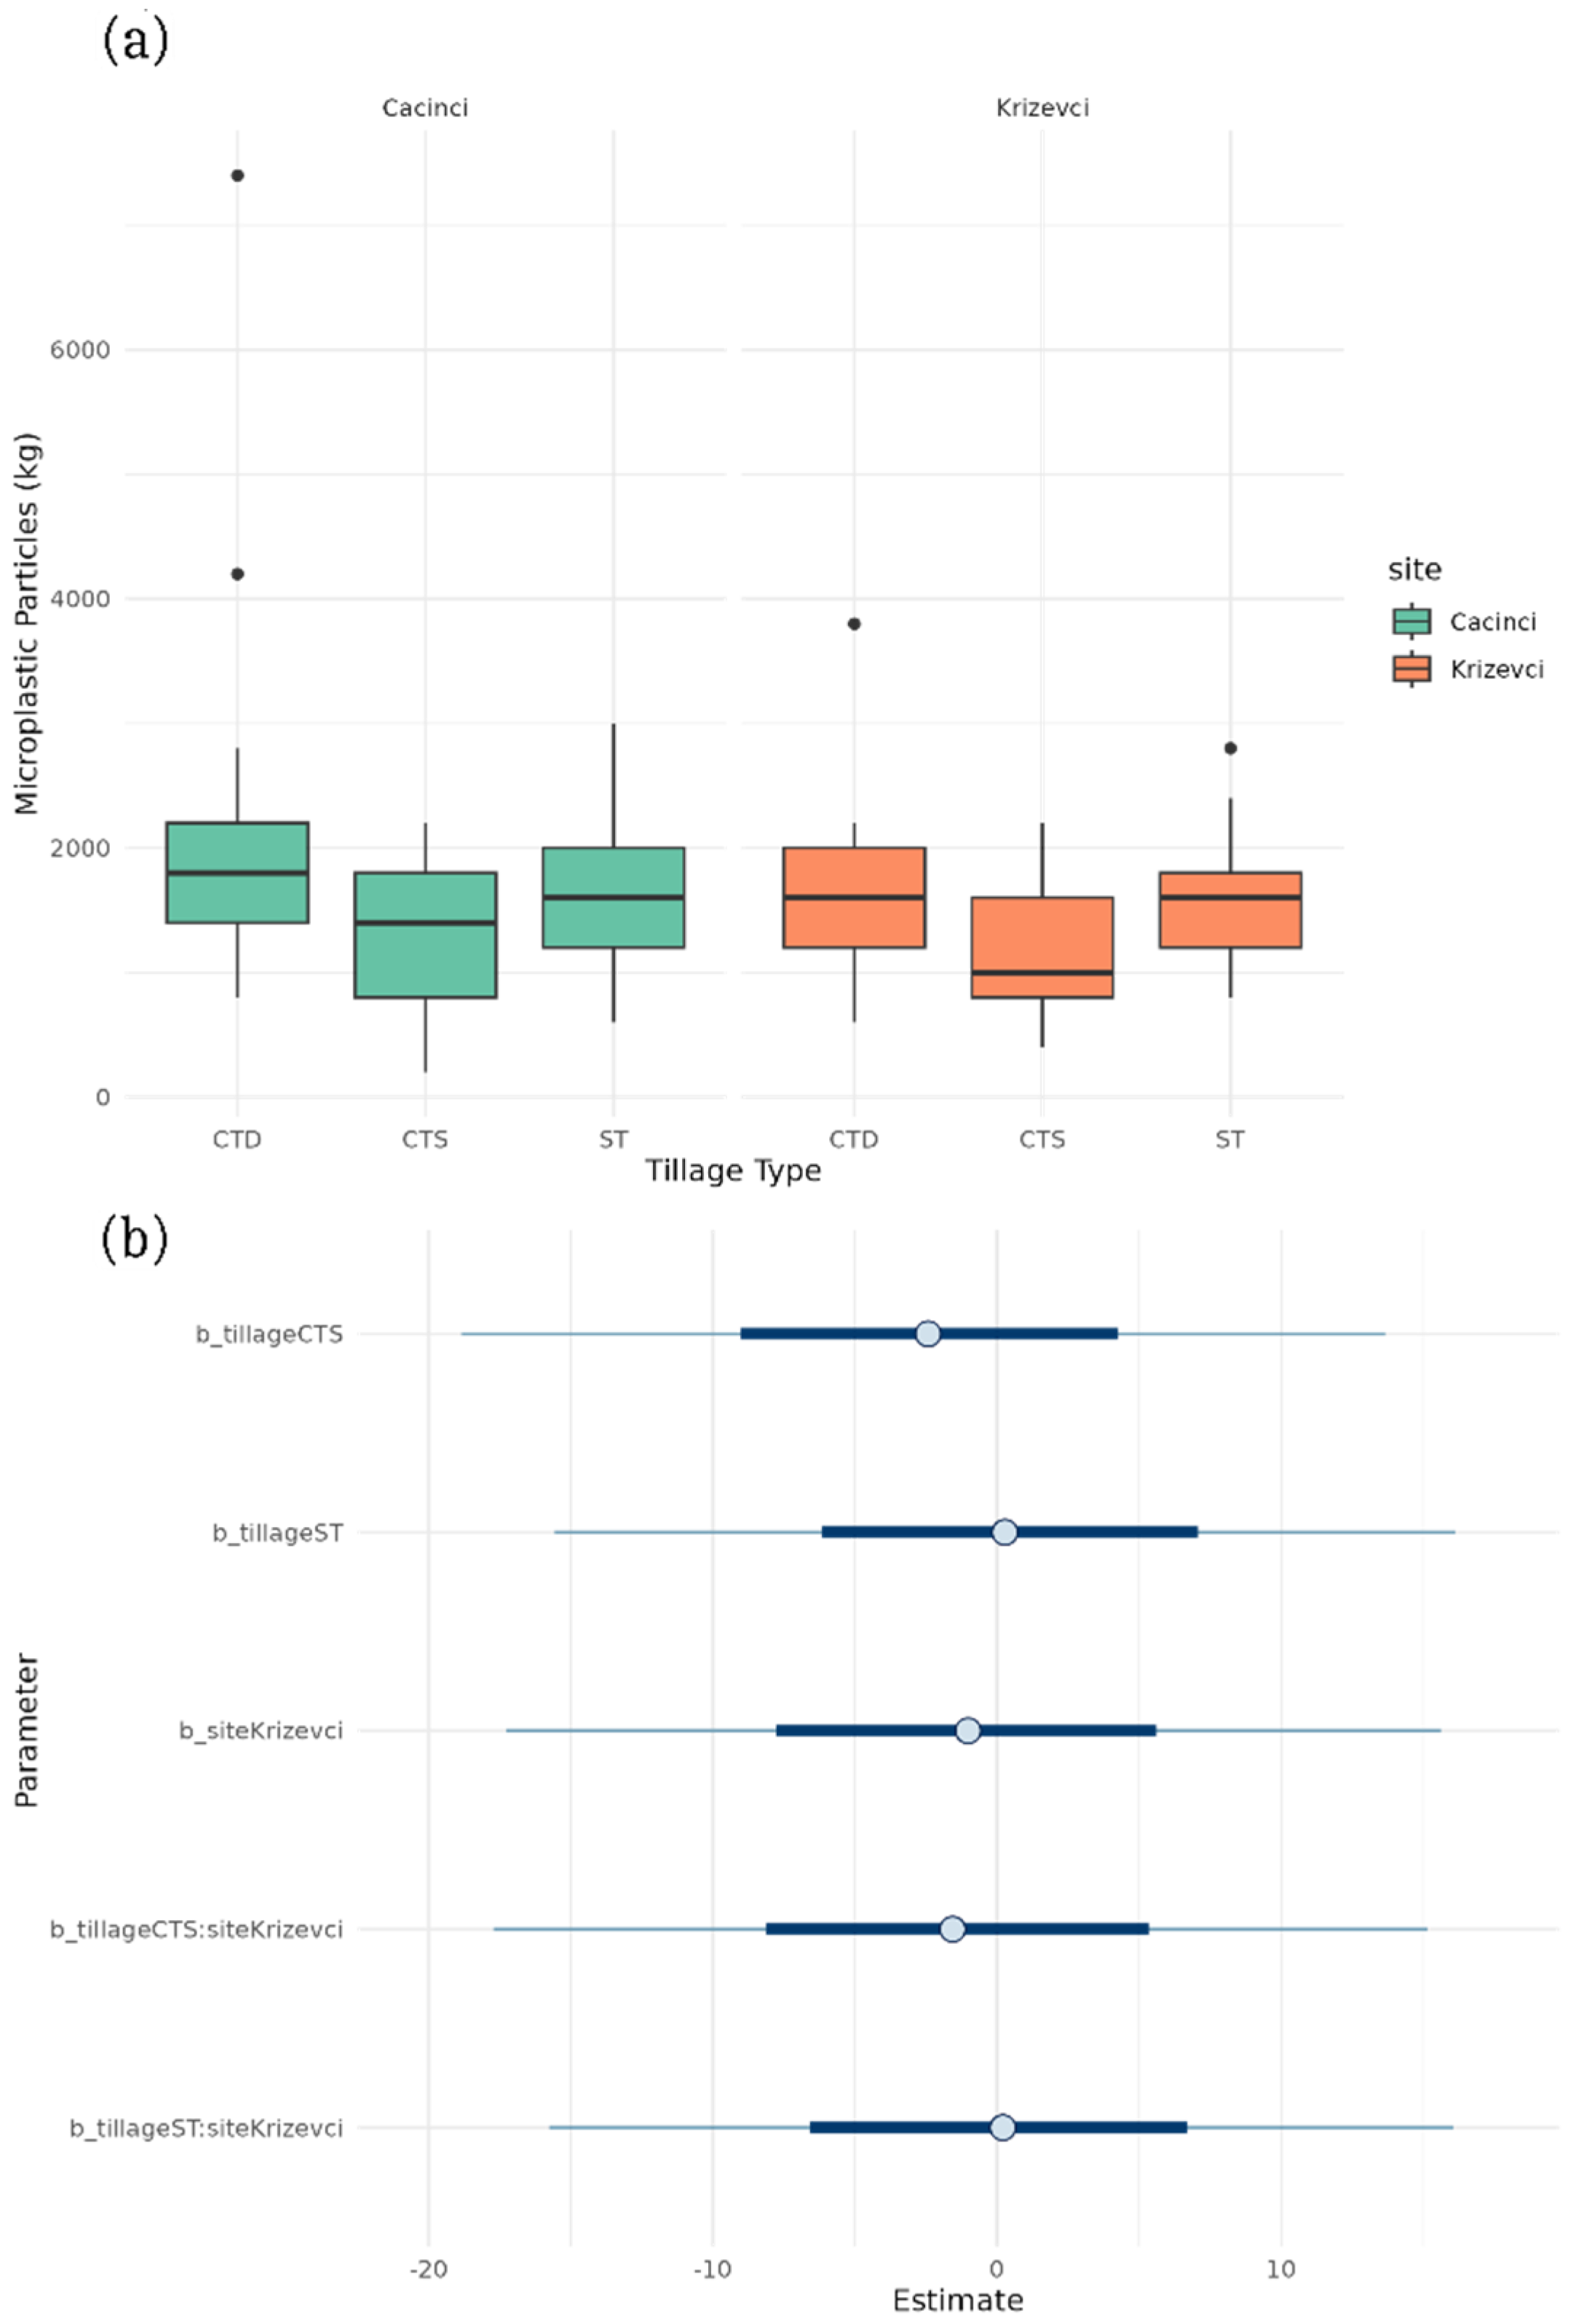
3.2. Tillage Effect on Microplastics

To analyze the effect of tillage type and location on microplastic quantity in the soil, a combination of frequentist and Bayesian methods was applied. The ANOVA results indicated a statistically significant difference among tillage types (ST, CTD, and CTS) (F (2,145) = 7.597, p = 0.0007) but not between locations. Tukey’s post hoc test further revealed that CTS had significantly lower microplastic content compared to CTD (p = 0.0005), while the ST type had a higher microplastic level than CTS but not significantly (p = 0.0326) in both sites (Figure 4a). Bayesian regression also confirmed that CTS had a negative effect on microplastics contamination (Figure 4b).
The vertical distribution of MPs showed homogeneous distribution across the soil profile within the CTS and ST plots and heterogeneous distribution within the CTD plots at both sites (Figure 5). At the Cacinci site, there were no statistically significant differences in MPs abundance in different soil layers within ST (p = 0.598) and CTS plots (p = 0.872). However, within the CTD plot, the middle (10–20 cm) and bottom (20–30 cm) layers differed significantly (p = 0.0038). Similarly, at the Krizevci site, ST (p = 0.705) and CTS (p = 0.570) showed no significant variation across the soil profile, but within the CTD plot, ANOVA showed significant difference between the middle (10–20 cm) and bottom (20–30 cm) layer and between the top (0–10 cm) and bottom (20–30 cm) layers (p = 0.042).
These findings confirm that deeper conservation tillage (CTD) resulted in stratification of microplastics along the soil profile, unlike shallow tillage (CTS) and conventional tillage (ST), which were associated with a more homogenous distribution. The consistency across both sites highlights tillage type as a key driver of MPs vertical migration.

3.3. Fertilization Effect on Microplastics

A two-way ANOVA indicated that fertilization significantly affects microplastics accumulation (p = 0.0332). The highest mean particle count was found in FR treatment at the Cacinci site (2233 ± 1534 particles). Further analysis showed that fertilization type had a significant impact on MPs contamination at Cacinci (ANOVA, F (3.76) = 3.438, p = 0.021) (Table 4). Pairwise comparisons (Table 5) indicated that FR significantly increased contamination compared to FD, while GFD significantly reduced contamination compared to FR. These results suggest that reduced fertilizer input, or the addition of Geo2, may mitigate MPs accumulation.
In contrast, the Krizevci site showed no statistically significant differences between fertilization treatments (Table 4 and Table 5). This may be explained by the site’s shorter agricultural history and fewer cumulative fertilizer applications, limiting potential MPs introduction.
As half of the parcels were subjected to liming with calcium oxide according to recommendation, we also analyzed this application. However, liming treatment showed no effect on soil MPs abundance in either of the two locations.

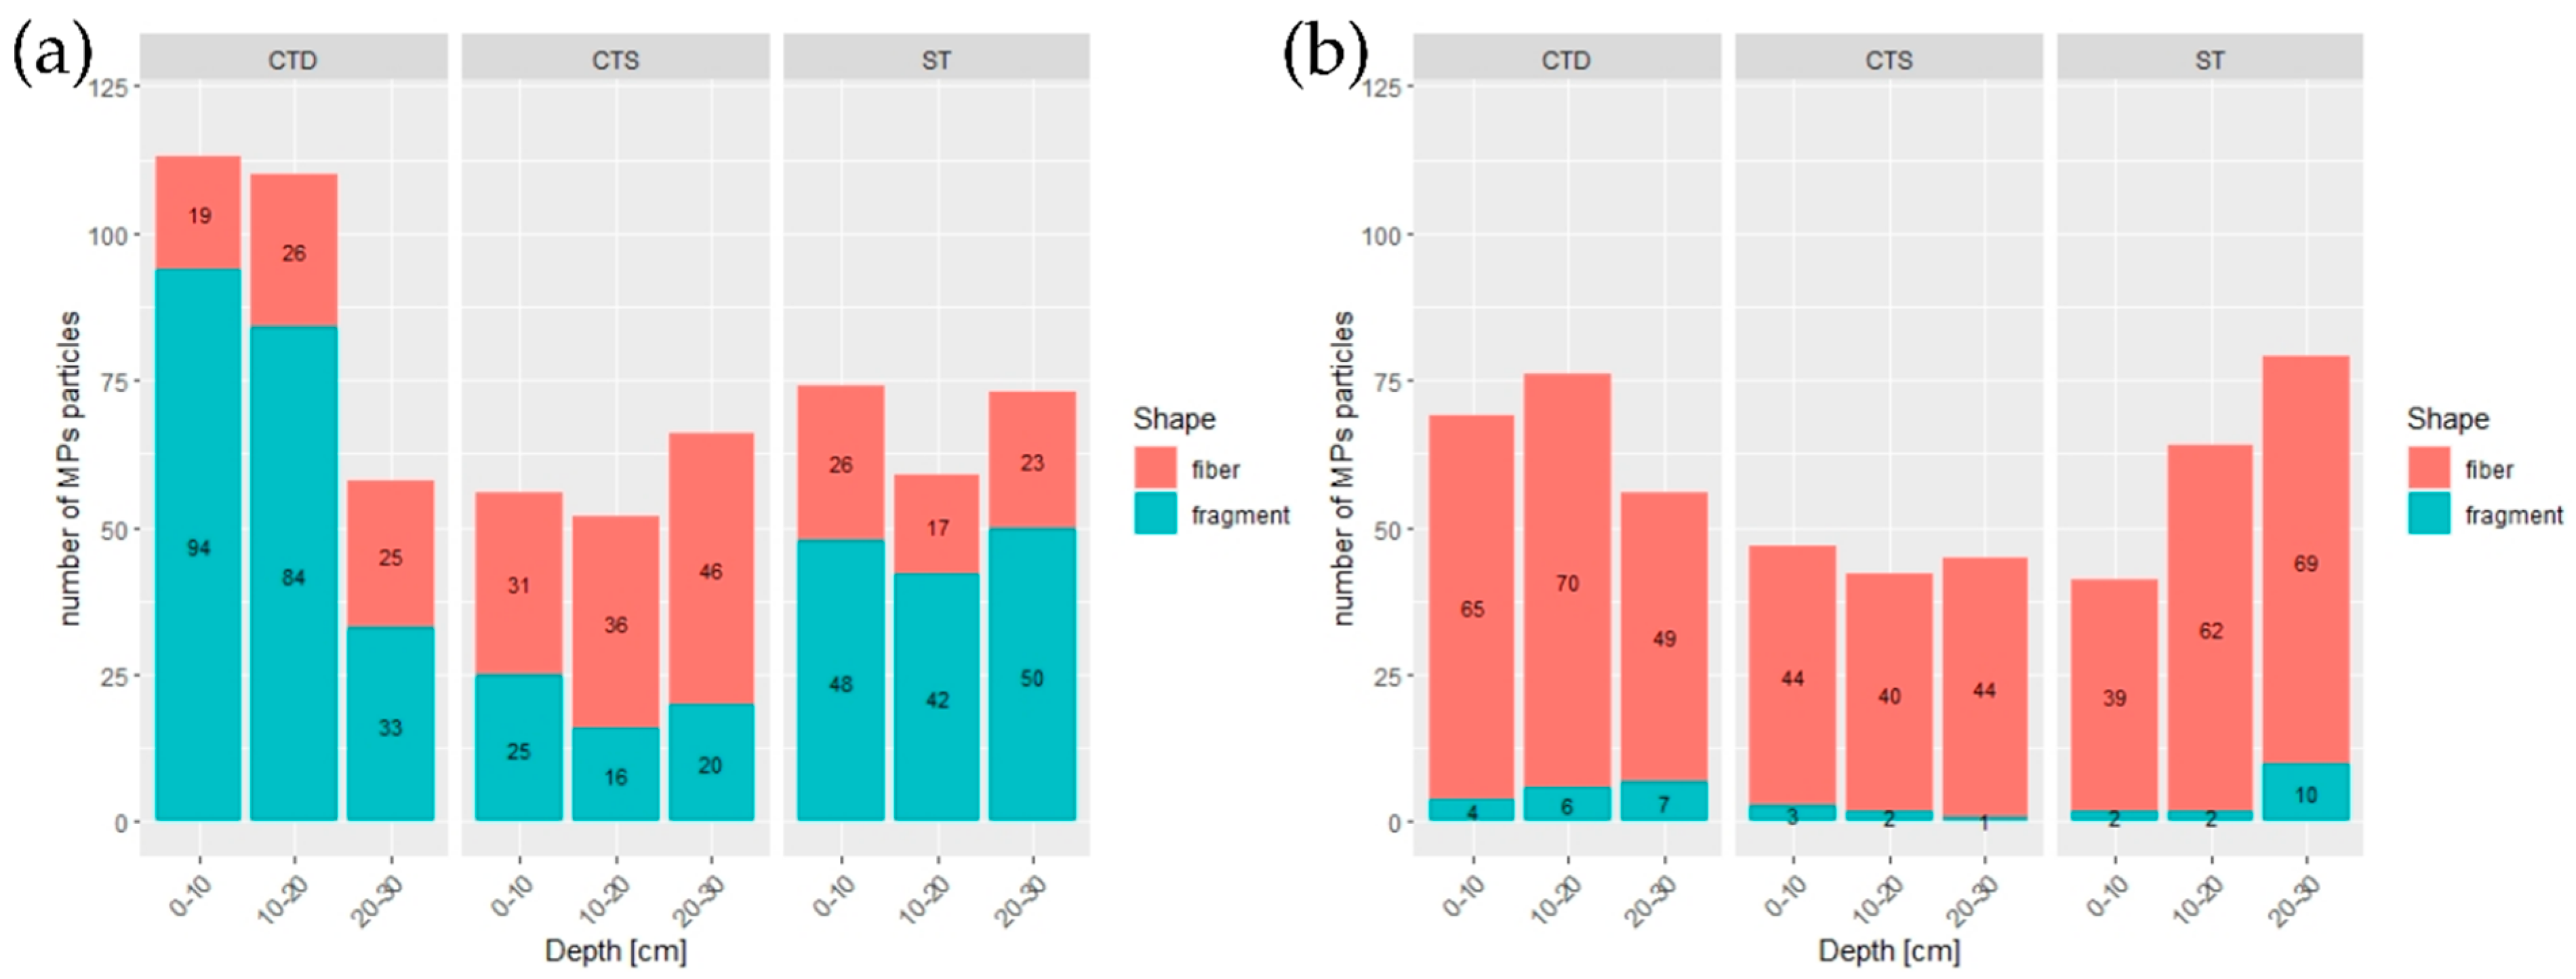
3.4. Shape of Microplastic Particles

Significant differences in MPs shape distribution were observed between the two sites, but not across soil layers. At the Krizevci site, fibers were dominant, representing 90–96% of the total MPs, while Cacinci exhibited a more balanced mix of fibers and fragments (45–57%). Consequently, the fragment-to-fiber ratio significantly differed between the sites (p < 0.001) (Figure 6).
Regarding tillage and vertical distribution, at the Cacinci site, a significant difference in the fragment-to-fiber ratio was observed only within the CTD plots (p = 0.0007), where fragments were more prevalent in the top layer (0–10 cm), while fibers dominated in the bottom layer (20–30 cm). At the Krizevci site, the fragment-to-fiber ratios did not significantly differ between tillage treatments and soil depths.

4. Discussion

In this study, a split-split-plot design was used to investigate how different agricultural practices—in particular tillage, fertilization, and crop residue management—influence the abundance, distribution, and shape of microplastics (MPs) in soil. By implementing this approach at two different experimental sites (Cacinci and Krizevci), we were able to assess the relative impact of each factor under realistic field conditions, as opposed to more controlled systems such as column or incubation studies [21,22,39]. The presence of MPs in all samples confirms that they are ubiquitous in agricultural soils [18,19], while the high concentrations detected at Cacinci—up to 7400 MPs/kg—highlight the potential impact of prolonged intensive agricultural activity on the environment.

4.1. Tillage and Microplastics Distribution

To better understand the role of tillage, we compared the vertical distribution patterns of MPs across different tillage treatments. The differences in vertical distribution of MPs in soil in our experiment can be interpreted with the tillage type of each plot, with the ST and CTS plots showing homogenous distribution within 30 cm of soil, and the CTD plots revealing heterogeneous distribution. Rillig et al. [24] hypothesized that plowing could lead to the presence of microplastics in a single soil layer at the plowing depth. However, our results suggest that plowing (ST) leads to mixing of the plowed soil layer, resulting in more uniform vertical MPs distribution. This agrees with Zhang et al. [39], who observed similar homogenization under intensive mechanical soil disturbance. Intensive mechanical action disrupts soil aggregates and redistributes particles, preventing stratification.
Similarly, conservation tillage with shallow cultivation (CTS) exhibited a homogeneous MPs distribution, but with the lowest overall abundance among tillage types. The minimal disturbance—achieved through shallow cultivation and retention of substantial crop residue cover—preserved the soil structure and limited MPs incorporation. Crop residues were recognized as a barrier, reducing the deposition of airborne MPs and stabilizing the soil surface against erosion- or infiltration-driven particle movement [40]. In contrast, conservation tillage with deep cultivation (CTD) showed a heterogeneous distribution, with significantly higher MPs abundance in the top (T) and middle (M) layers compared to the bottom (B) layer. This pattern is linked to non-inversion tillage using a subsoiler with a star roller and a spike harrow with a string roller. These tools loosen soil without inverting it, sorting larger aggregates to the surface and potentially compacting lower layers, which restricts MPs penetration [41]. Our observation of stratified MP layers in the CTD aligns with Hartmann et al. [37], who emphasized the role of tillage intensity and aggregate disruption in shaping MPs vertical profiles. The higher abundance in the upper layers may also reflect the ‘first-flush’ phenomenon [21], where initial water infiltration mobilizes microplastics downward but not deeply enough to reach the 20–30 cm layer. The data on soil compaction and infiltration rates further explain these patterns: CTS plots, with minimal disturbance, exhibit higher soil compaction and lower infiltration rates, limiting MPs movement into deeper layers. ST plots, with greater soil turnover, have lower compaction and higher infiltration, promoting even distribution. CTD plots, with intermediate disturbance, balance these effects, retaining more microplastics near the surface due to aggregate sorting and reduced permeability in deeper layers. This suggests that tillage not only affects the total MPs abundance but also strongly influences their vertical mobility and stratification in soil.
These findings highlight tillage as a primary driver of MPs distribution, with consistent patterns across both experimental sites despite differences in soil texture (e.g., higher clay content at Cacinci). However, while our data did not reveal a statistically significant effect of soil texture at Cacinci, a marginal effect was observed at Krizevci (p ≈ 0.048). This suggests that in finer-textured soils, MPs may be more prone to retention or vertical stratification. This is in line with previous studies that reported a positive correlation between clay content and MP abundance [42].

4.2. Fertilization and Microplastics Abundance

Recent research, including a study on agricultural fertilizers contributing to microplastics concentrations in UK soils, highlights the growing role of fertilizers in MPs pollution [33]. In our study, fertilization treatments revealed site-specific effects on MPs abundance. At Cacinci, plots with a 50% reduction in fertilization showed significantly lower MPs levels compared to fully fertilized plots. This suggests that fertilizers, particularly organic ones, are a major MPs source, as supported by Yang et al. [43], who documented high MPs concentrations in organic amendments like manure. Even though the inorganic fertilizer application, as the one we used in our study, did not elevate MPs abundance as much as organic amendments, it still contributes to MPs loads beyond background contamination [44]. The elevated MPs levels in the FR plots at Cacinci (2233 ± 1534 MPs/kg) exceeded levels seen in similar studies in European farmland [44], possibly due to cumulative input over years. Cacinci’s longer agricultural history and repeated fertilizer applications likely amplified this effect, allowing microplastics to accumulate over time. In contrast, at Krizevci, a site converted from natural grassland in 2021, no significant fertilization effect was observed. The shorter agricultural history and fewer fertilizer applications likely minimized MPs input, explaining the lack of difference between treatments. Additionally, a research study showed that the MPs from inorganic fertilizers tend to be confined to the topsoil (0–20 cm), with a sharp decline below 20–40 cm [45].

4.3. Particle Shape and Vertical Stratification

Previous research has reported contrasting shape ratios in agricultural fields. Van den Berg et al. [46] found that 86% of microplastics in agricultural soils were fragments, whereas Corradini et al. [47] reported that fibers accounted for 97% of soil microplastics. In this research, MPs shapes varied between sites, reflecting diverse pollution sources. At Cacinci, fragments were the dominant type, comprising a higher proportion of total microplastics. This suggests point sources, such as the degradation of agricultural plastics (e.g., mulch films) or litter, which break into irregular fragments over time [48]. At Krizevci, fibers were more prevalent, pointing to atmospheric deposition as a primary source [7,49]. Fibers, often originating from textiles or synthetic materials, are lightweight and easily transported by wind, depositing onto soil surfaces, especially in less intensively managed areas like Krizevci’s recently converted grassland. Previous studies have also linked elevated fiber concentrations to sewage sludge application [45]. However, this source was not present in our experimental design, suggesting alternative sources or mechanisms must be responsible. Within the CTD plots at Cacinci, fragments were concentrated in the 0–10 cm layer, while fibers were more abundant in the 20–30 cm layer. This shape-dependent stratification indicates that tillage influences particle mobility differently based on morphology. Fibers, with their elongated structure, may penetrate deeper through soil pores during water infiltration or wet–dry cycles [39], while compact fragments remain near the surface where tillage disturbance is greatest. Lehmann et al. [50] noted that shape affects soil interactions, with fibers potentially altering water flow more than fragments. These shape differences have broader implications: fragments may pose greater risks to soil structure due to their irregular edges, while fibers could affect water retention and microbial activity [50]. Understanding shape-specific sources and distributions is critical for tracing MPs pathways and mitigating their impacts [44].

5. Conclusions

Our results demonstrate that tillage practices strongly influence both the abundance and vertical distribution of microplastics (MPs) in agricultural soils. While conventional (ST) and shallow conservation tillage (CTS) led to a more even distribution of MPs, deep conservation tillage (CTD) caused stratification, with higher concentrations in the upper layers.
The effects of fertilization were site-dependent. At Cacinci, recommended fertilization significantly increased MPs abundance, suggesting that inorganic fertilizers may also contribute to MPs input over time. No such effect was observed at Krizevci, which is probably due to the shorter cultivation history.
We also observed shape-specific patterns: fragments remained near the surface, while fibers were more abundant at depth, indicating morphology-dependent movement.
These findings underline the importance of tillage and fertilization in managing soil MPs contamination and support the promotion of low disturbance practices to reduce MPs redistribution.
Future research should include polymer identification, longer-term monitoring, and investigation of the interactions between MPs and soil aggregation to clarify retention and mobility mechanisms under varying field conditions.

Supplementary Materials

The following supporting information can be downloaded at https://www.mdpi.com/article/10.3390/soilsystems9020063/s1. Figure S1: Geographical position of experimental sites in Croatia: a) Cacinci and b) Krizevci.; Figure S2: Examples of isolated microplastic particles (MPs): (a) measuring of MP in ImageJ, (b) isolated fragment, (c) isolated fiber; Table S1: Soil physico-chemical parameters analyzed for MPs variability included soil texture (sand, silt, clay), soil pH (H2O), and soil organic carbon (SOC) at two experimental sites: Cacinci (CAC) and Krizevci (KRI), and under different tillage—conventional tillage system (ST), conservation tillage system-deep (CTD), and conservation tillage system-shallow (CTS), with the application of calcization (CY) or without (CN). Fertilization includes a treatment with a recommended quantity (NPK, urea and CAN (calcium ammonium nitrate)) (FD) and a treatment with a 50% of the recommended fertilizer amount (FR). Each fertilization treatment was further subdivided into two subplots: one with the application of Geo2 (biophysiological soil activator) (recommended fertilization quantity and GeO2-GFD and 50% recommended fertilizer amount and GeO2-GFR) and one without (only fertilizers as explained above). Parameters are measured at three depths: 0–10, 10–20 and 20–30 cm.

Author Contributions

Writing—original draft preparation, methodology, investigation, B.Ć.; conceptualization, writing—review and editing, B.H.K.; writing—review and editing, funding acquisition, D.J.; writing—review and editing, I.J.; writing—review and editing, investigation, D.H.K. All authors have read and agreed to the published version of the manuscript.

Funding

The study has been fully supported by the Croatian Science Foundation under the project “Assessment of conservation soil tillage as advanced methods for crop production and prevention of soil degradation—ACTIVEsoil” (IP-2020-02-2647).

Data Availability Statement

The data will be made available upon request.

Conflicts of Interest

The authors declare declare that the research was conducted in the absence of any commercial or financial relationships that could be construed as a potential conflict of interest.

References

  1. Frias, J.P.G.L.; Nash, R. Microplastics: Finding a Consensus on the Definition. Mar. Pollut. Bull. 2019, 138, 145–147. [Google Scholar] [CrossRef] [PubMed]
  2. Sajjad, M.; Huang, Q.; Khan, S.; Khan, M.A.; Liu, Y.; Wang, J.; Lian, F.; Wang, Q.; Guo, G. Microplastics in the soil environment: A critical review. Environ. Technol. Innov. 2022, 27, 102408. [Google Scholar] [CrossRef]
  3. Horton, A.A.; Walton, A.; David, S.; Elma, L.; Svendsen, C. Microplastics in freshwater and terrestrial environments: Evaluating the current understanding to identify the knowledge gaps and future research priorities. Sci. Total Environ. 2017, 586, 127–141. [Google Scholar] [CrossRef] [PubMed]
  4. Reineccius, J.; Waniek, J.J. Critical reassessment of microplastic abundances in the marine environment. Sci. Total Environ. 2024, 954, 176449. [Google Scholar] [CrossRef] [PubMed]
  5. De Souza Machado, A.A.; Lau, C.W.; Till, J.; Kloas, W.; Lehmann, A.; Becker, R.; Rillig, M.C. Impacts of Microplastics on the Soil Biophysical Environment. Environ. Sci. Technol. 2018, 52, 9656–9665. [Google Scholar] [CrossRef]
  6. De Souza Machado, A.A.; Lau, C.W.; Kloas, W.; Bergmann, J.; Bachelier, J.B.; Faltin, E.; Becker, R.; Görlich, A.S.; Rillig, M.C. Microplastics Can Change Soil Properties and Affect Plant Performance. Environ. Sci. Technol. 2019, 53, 6044–6052. [Google Scholar] [CrossRef]
  7. Zhang, G.S.; Zhang, F.X.; Li, X.T. Effects of polyester microfibers on soil physical properties: Perception from a field and a pot experiment. Sci. Total Environ. 2019, 670, 1–7. [Google Scholar] [CrossRef]
  8. Yu, Y.; Flury, M. Current understanding of subsurface transport of micro- and nanoplastics in soil. Vadose Zone J. 2021, 20, e20108. [Google Scholar] [CrossRef]
  9. Mbachu, O.; Jenkins, G.; Kaparaju, P.; Pratt, C. The rise of artificial soil carbon inputs: Reviewing microplastic pollution effects in the soil environment. Sci. Total Environ. 2021, 780, 146569. [Google Scholar] [CrossRef]
  10. Wang, T.; Wang, L.; Chen, Q.; Kalogerakis, N.; Ji, R.; Ma, Y. Interactions between microplastics and organic pollutants: Effects on toxicity, bioaccumulation, degradation, and transport. Sci. Total Environ. 2020, 748, 142427. [Google Scholar] [CrossRef]
  11. Aghilinasrollahabadi, K.; Salehi, M.; Fujiwara, T. Investigate the influence of microplastics weathering on their heavy metals uptake in stormwater. J. Hazard. Mater. 2021, 408, 124439. [Google Scholar] [CrossRef] [PubMed]
  12. Wang, J.; Liu, X.; Li, Y.; Powell, T.; Wang, X.; Wang, G.; Zhang, P. Microplastics as contaminants in the soil environment: A mini-review. Sci. Total Environ. 2019, 691, 848–857. [Google Scholar] [CrossRef] [PubMed]
  13. Li, Q.; Zeng, A.; Jiang, X.; Gu, X. Are microplastics correlated to phthalates in facility agriculture soil? J. Hazard. Mater. 2021, 412, 125164. [Google Scholar] [CrossRef]
  14. Mammo, F.K.; Amoah, I.D.; Gani, K.M.; Pillay, L.; Ratha, S.K.; Bux, F.; Kumari, S. Microplastics in the environment: Interactions with microbes and chemical contaminants. Sci. Total Environ. 2020, 743, 140518. [Google Scholar] [CrossRef]
  15. Khalid, N.; Aqeel, M.; Noman, A. Microplastics could be a threat to plants in terrestrial systems directly or indirectly. Environ. Pollut. 2020, 267, 115653. [Google Scholar] [CrossRef] [PubMed]
  16. Guo, J.J.; Huang, X.P.; Xiang, L.; Wang, Y.Z.; Li, Y.W.; Li, H.; Cai, Q.Y.; Mo, C.H.; Wong, M.H. Source, migration and toxicology of microplastics in soil. Environ. Int. 2020, 137, 105263. [Google Scholar] [CrossRef]
  17. Klimek, B.; Grzyb, D.; Łukiewicz, B.; Niklińska, M. Microplastics increase soil respiration rate, decrease soil mesofauna feeding activity and change enchytraeid body length distribution in three contrasting soils. Appl. Soil Ecol. 2024, 201, 105463. [Google Scholar] [CrossRef]
  18. Corradini, F.; Casado, F.; Leiva, V.; Huerta-Lwanga, E.; Geissen, V. Microplastics occurrence and frequency in soils under different land uses on a regional scale. Sci. Total Environ. 2021, 752, 141917. [Google Scholar] [CrossRef]
  19. Büks, F.; Kaupenjohann, M. Global concentrations of microplastics in soils—A review. Soil 2020, 6, 649–662. [Google Scholar] [CrossRef]
  20. Fan, W.; Qiu, C.; Qu, Q.; Hu, X.; Mu, L.; Gao, Z.; Tang, X. Sources and identification of microplastics in soils. Soil Environ. Health 2023, 1, 100019. [Google Scholar] [CrossRef]
  21. O’Connor, D.; Pan, S.; Shen, Z.; Song, Y.; Jin, Y.; Wu, W.M.; Hou, D. Microplastics undergo accelerated vertical migration in sand soil due to small size and wet-dry cycles. Environ. Pollut. 2019, 249, 527–534. [Google Scholar] [CrossRef] [PubMed]
  22. Gao, J.; Pan, S.; Li, P.; Wang, L.; Hou, R.; Wu, W.M.; Luo, J.; Hou, D. Vertical migration of microplastics in porous media: Multiple controlling factors under wet-dry cycling. J. Hazard. Mater. 2021, 419, 126413. [Google Scholar] [CrossRef] [PubMed]
  23. Li, H.; Lu, X.; Wang, S.; Zheng, B.; Xu, Y. Vertical migration of microplastics along soil profile under different crop root systems. Environ. Pollut. 2021, 278, 116833. [Google Scholar] [CrossRef]
  24. Rillig, M.C.; Ingraffia, R.; De Souza Machado, A.A. Microplastic incorporation into soil in agroecosystems. Front. Plant Sci. 2017, 8, 8–11. [Google Scholar] [CrossRef] [PubMed]
  25. Brandes, E.; Henseler, M.; Kreins, P. Identifying hot-spots for microplastic contamination in agricultural soils—A spatial modelling approach for Germany. Environ. Res. Lett. 2021, 16, 104041. [Google Scholar] [CrossRef]
  26. ISO 10390; International Organization for Standardization ISO 10390; Soil Quality—Determination of pH-An Instrumental Method for the Routine Determination of pH. International Organization for Standardization: Geneva, Switzerland, 2005.
  27. ISO 14235; Soil Quality—Determination of Organic Carbon by Sulfochromic Oxidation. International Organization for Standardization: Geneva, Switzerland, 1998.
  28. Pribyl, W.D. A critical review of the conventional SOC to SOM conversion factor. Geoderma 2010, 156, 75–83. [Google Scholar] [CrossRef]
  29. ISO 11277; Soil Quality—Determination of Particle Size Distribution in Mineral Soil Material—Method by Sieving and Sedimentation. International Organization for Standardization: Geneva, Switzerland, 2009.
  30. Jug, D.; Jug, I.; Radočaj, D.; Wilczewski, E.; Đurđević, B.; Jurišić, M.; Zsembeli, J.; Brozović, B. Spatio-Temporal Dynamics of Soil Penetration Resistance Depending on Different Conservation Tillage Systems. Agronomy 2024, 14, 2168. [Google Scholar] [CrossRef]
  31. Shelton, D.P.; Jasa, P.J. Estimating Percent Residue Cover Using the Line-Transect Method; G1931; University of Nebraska–Lincoln Extension: Lincoln, NE, USA, 2009; Available online: https://www.researchgate.net/publication/242579305_G93-1133_Estimating_Percent_Residue_Cover_Using_the_Line-Transect_Method (accessed on 22 January 2025).
  32. Hurley, R.R.; Lusher, A.L.; Olsen, M.; Nizzetto, L. Validation of a Method for Extracting Microplastics from Complex, Organic-Rich, Environmental Matrices. Environ. Sci. Technol. 2018, 52, 7409–7417. [Google Scholar] [CrossRef]
  33. Vermeiren, P.; Muñoz, C.; Ikejima, K. Microplastic identification and quantification from organic rich sediments: A validated laboratory protocol. Environ. Pollut. 2020, 262, 114298. [Google Scholar] [CrossRef]
  34. Norén, F. Small Plastic Particles in Coastal Swedish Waters; KIMO Report: Lysekil, Sweden, 2007. [Google Scholar]
  35. Schneider, C.A.; Rasband, W.S.; Eliceiri, K.W. NIH Image to ImageJ: 25 years of Image Analysis. Nat. Methods 2012, 9, 671–675. [Google Scholar] [CrossRef]
  36. Hartmann, N.B.; Hüffer, T.; Thompson, R.C.; Hassellöv, M.; Verschoor, A.; Daugaard, A.E.; Rist, S.; Karlsson, T.; Brennholt, N.; Cole, M.; et al. Are We Speaking the Same Language? Recommendations for a Definition and Categorization Framework for Plastic Debris. Environ. Sci. Technol. 2019, 53, 1039–1047. [Google Scholar] [CrossRef] [PubMed]
  37. Beckingham, B.; Apintiloaiei, A.; Moore, C.; Brandes, J. Hot or not: Systematic review and laboratory evaluation of the hot needle test for microplastic identification. Micropl. Nanopl. 2023, 3, 8. [Google Scholar] [CrossRef]
  38. R Core Team. R: A Language and Environment for Statistical Computing; R Foundation for Statistical Computing: Vienna, Austria, 2021; Available online: https://www.R-project.org/ (accessed on 15 February 2025).
  39. Zhang, X.; Chen, Y.; Li, X.; Zhang, Y.; Gao, W.; Jiang, J.; Mo, A.; He, D. Size/shape-dependent migration of microplastics in agricultural soil under simulative and natural rainfall. Sci. Total Environ. 2022, 815, 152507. [Google Scholar] [CrossRef]
  40. Zhang, Y.; Kang, S.; Allen, S.; Allen, D.; Gao, T.; Sillanpää, M. Atmospheric microplastics: A review on current status and perspectives. Earth-Sci. Rev. 2020, 203, 103118. [Google Scholar] [CrossRef]
  41. Salem, H.M.; Valero, C.; Muñoz, M.Á.; Gil-Rodríguez, M. Effect of integrated reservoir tillage for in-situ rainwater harvesting and other tillage practices on soil physical properties. Soil Tillage Res. 2015, 151, 50–60. [Google Scholar] [CrossRef]
  42. Wang, Y.; Hou, P.; Liu, K.; Hayat, K.; Liu, W. Depth distribution of nano-and microplastics and their contribution to carbon storage in Chinese agricultural soils. Sci. Total Environ. 2024, 913, 169709. [Google Scholar] [CrossRef] [PubMed]
  43. Yang, L.; Zhang, Y.; Kang, S.; Wang, Z.; Wu, C. Microplastics in soil: A review on methods, occurrence, sources, and potential risk. Sci. Total Environ. 2021, 780, 146546. [Google Scholar] [CrossRef]
  44. Cusworth, S.J.; Davies, W.J.; McAinsh, M.R.; Gregory, A.S.; Storkey, J.; Stevens, C.J. Agricultural fertilisers contribute substantially to microplastic concentrations in UK soils. Commun. Earth Environ. 2024, 5, 7. [Google Scholar] [CrossRef]
  45. Heinze, W.M.; Steinmetz, Z.; Klemmensen, N.D.R.; Vollertsen, J.; Cornelis, G. Vertical distribution of microplastics in an agricultural soil after long-term treatment with sewage sludge and mineral fertiliser. Env. Pollut. 2024, 356, 124343. [Google Scholar] [CrossRef] [PubMed]
  46. van den Berg, P.; Huerta-Lwanga, E.; Corradini, F.; Geissen, V. Sewage sludge application as a vehicle for microplastics in eastern Spanish agricultural soils. Environ. Pollut. 2020, 261, 114198. [Google Scholar] [CrossRef]
  47. Corradini, F.; Meza, P.; Eguiluz, R.; Casado, F.; Huerta-Lwanga, E.; Geissen, V. Evidence of microplastic accumulation in agricultural soils from sewage sludge disposal. Sci. Total Environ. 2019, 671, 411–420. [Google Scholar] [CrossRef] [PubMed]
  48. Yang, J.; Li, R.; Zhou, Q.; Li, L.; Li, Y.; Tu, C.; Zhao, X.; Xiong, K.; Christie, P.; Luo, Y. Abundance and morphology of microplastics in an agricultural soil following long-term repeated application of pig manure. Environ. Pollut. 2021, 272, 116028. [Google Scholar] [CrossRef] [PubMed]
  49. Wright, S.L.; Ulke, J.; Font, A.; Chan, K.L.A.; Kelly, F.J. Atmospheric microplastic deposition in an urban environment and an evaluation of transport. Environ. Int. 2020, 136, 105411. [Google Scholar] [CrossRef] [PubMed]
  50. Lehmann, A.; Leifheit, E.F.; Gerdawischke, M.; Rillig, M.C. Microplastics have shape- and polymer-dependent effects on soil aggregation and organic matter loss—An experimental and meta-analytical approach. Microplastics Nanoplastics 2021, 1, 7. [Google Scholar] [CrossRef]
Figure 1. Aerial view of Figure 1. Split-split-plot design at (a) Krizevci site and (b) general scheme of split-split-plot design (ST—conventional tillage system, CTD—deep conservation tillage system, CTS—shallow conservation tillage system).
Soilsystems 09 00063 g001
Figure 2. Quantity of microplastic particles (MPs) expressed as a total number of particles per sample (5 g of soil).
Soilsystems 09 00063 g002
Figure 3. Mean number of microplastic particles in 5 g of soil in different soil layers (B—bottom, M—middle, T—top) at Cacinci (a) and Krizevci (b) sites.
Soilsystems 09 00063 g003
Figure 4. (a): Boxplot showing the number of microplastic particles per kg of soil under different tillage treatments (ST—conventional tillage system; CTD—deep conservation tillage system; CTS—shallow conservation tillage system) at the Cacinci (green) and Krizevci (orange) sites. (b): Posterior distributions of the regression coefficients from the Bayesian model to assess the impact of tillage systems and experimental sites on the abundance of microplastic particles. The dots represent the posterior means, and the horizontal bars denote 95% credible intervals. Values to the left of zero indicate negative effects (reduction in microplastic concentrations), while values to the right indicate positive effects. The parameters labelled “b_tillage” show the main effects of the different tillage types, while the parameters containing “site:tillage” represent the interaction effects that show how the effects of the tillage treatments vary between the two experimental sites.
Soilsystems 09 00063 g004
Figure 5. Vertical distribution of microplastics particles along the soil profile for each plot and sampled depth profile for (a) Cacinci site and (b) Krizevci site compared according to tillage treatment (conventional tillage system (ST), deep conservation tillage system (CTD), and shallow conservation tillage system (CTS)).
Soilsystems 09 00063 g005
Figure 6. Distribution of microplastics particle shapes through the soil profile: (a) Cacinci site and (b) Krizevci site (conventional tillage system (ST), deep conservation tillage system (CTD), and shallow conservation tillage system (CTS)).
Soilsystems 09 00063 g006
Table 1. Measured basic soil mechanical, physical, and chemical parameters of both experimental sites (Cacinci and Krizevci).
SiteSand
[%]
Silt
[%]
Clay
[%]
stFC
[%vol]
ρb
[g cm−3]
ci
[cm h−1]
stySOC
[%]
SOM
[%]
Cacinci12.0753.3534.58Silty Clay Loam34.911.6457.33Stagnosol1.422.84
Krizevci7.3082.6010.10Silt44.591.3980.04Gleysol1.182.36
st—soil texture; FC—field water capacity; ρb—soil bulk density; ci—cumulative infiltration; SOC—soil organic carbon; SOM—soil organic matter; sty—soil type.
Table 2. Summary of the analysis between vertical distribution, soil physico-chemical parameters, and number of microplastic particles at both sites.
FactorCacinciKrizevci
Effect of soil layerNo significant effectModerate effect: greater variability in upper layers
Soil texture (sand, silt, clay)No significant correlationPossible influence (p ≈ 0.048)
Soil pHNo significant effectNo significant effect
Soil organic carbon (SOC)No significant effectSignificant negative correlation with particle variability
Table 3. The average size of microplastic particles (mm) in different soil layers (B—bottom, M—middle, T—top) at both sites (Cacinci and Krizevci).
LayerCacinci (Mean ± SD)Krizevci (Mean ± SD)
B1.17 ± 0.5061.13 ± 0.318
M1.14 ± 0.4621.10 ± 0.270
T1.05 ± 0.4491.16 ± 0.383
Table 4. Descriptive statistics of MPs quantity in different fertilization treatments in both experimental sites (FR—recommended fertilizer treatment; FD—50% quantity of recommended fertilization; GFR—recommended fertilization + GeO2 (biophysiological soil activator); GFD—50% quantity of recommended fertilization + GeO2 (biophysiological soil activator)).
CacinciKrizevci
Fertilization TreatmentMP/kgSample Size (n)MP/kgSample Size (n)
FD1317 ± 313121417 ± 52212
FR2233 ± 1534181492 ± 70024
GFD1492 ± 639391350 ± 59324
GFR1636 ± 742111655 ± 39111
Table 5. Tukey’s HSD test results for multiple comparisons of fertilization treatments. (FR—recommended fertilizer treatment; FD—50% quantity of recommended fertilization; GFR—recommended fertilization + GeO2 (biophysiological soil activator); GFD—50% quantity of recommended fertilization + GeO2 (biophysiological soil activator)).
CacinciKrizevci
Difference95% CIp-ValueDifference95% CIp-Value
FR–FD916.67(31.69, 1801.65)0.03975.00(−481.38, 631.38)0.9845
GFD–FR−741.03(−1417.68, −64.37)0.026−66.67(−623.04, 489.71)0.9890
GFR–FR−596.97(−1505.77, 311.83)0.318237.88(−419.01, 894.77)0.7757
GFD–FD175.64(−608.26, 959.54)0.935−141.67(−595.95, 312.61)0.8440
GFR–FD319.70(−671.54, 1310.93)0.832162.88(−410.11, 735.87)0.8768
GFR–GFD144.06(−666.64, 954.75)0.966304.55(−268.44, 877.53)0.5036
Disclaimer/Publisher’s Note: The statements, opinions and data contained in all publications are solely those of the individual author(s) and contributor(s) and not of MDPI and/or the editor(s). MDPI and/or the editor(s) disclaim responsibility for any injury to people or property resulting from any ideas, methods, instructions or products referred to in the content.

