Article

Assessing the Effect of Organic and Inorganic Resources on Carbon Fractions in Soggy Sodic Soil at Sege in Ada West District, Ghana

by
Benedicta Yayra Fosu-Mensah
1,*,
Diawudeen Mutaru
1,
Dilys Sefakor MacCarthy
2 and
Michael Mensah
3
1
Institute for Environment and Sanitation Studies (IESS), College of Basic and Applied Sciences (CBAS), University of Ghana, Accra LG 209, Ghana
2
Soil and Irrigation Research Centre, Kpong, School of Agriculture, College of Basic and Applied Sciences (CBAS), University of Ghana, Accra LG 68, Ghana
3
Department of Business Administration, University of Professional Studies, Accra LG 149, Ghana
*
Author to whom correspondence should be addressed.
Soil Syst. 2025, 9(2), 62; https://doi.org/10.3390/soilsystems9020062
Submission received: 18 March 2025 / Revised: 30 May 2025 / Accepted: 4 June 2025 / Published: 11 June 2025

Abstract

:
Labile organic carbon (OC), a dynamic component of soil organic carbon (SOC), is essential for improving soil health, fertility, and crop productivity, particularly when organic and inorganic amendments are combined. However, limited research exists on the best amendment strategies for restoring degraded gleyic solonetz soggy sodic (GSSS) soils in West Africa’s coastal zones. A three-year field study (2017–2019) assessed the effects of various combinations of organic (mature or composted cow dung, with or without biochar) and inorganic inputs on soil organic carbon fractions, total carbon stocks, and the Carbon Management Index (CMI) in GSSS soils of Sege, Ada West District, Ghana. The results showed that organic and inorganic combinations outperformed the sole inorganic NPK treatment and the control, particularly in the topsoil. Composted cow dung with mineral fertilizer (CCfert) was especially effective, significantly increasing labile OC, SOC stock, and CMI by 35.3%, 140.5%, and 26% in the topsoil compared to the control and by 28%, 77.8%, and 4.3% compared to NPK alone. In the subsoil, mature cow dung-based treatments performed better. These findings highlight the potential of integrated organic and inorganic strategies, especially those based on composted manure, to rehabilitate degraded sodic soils, build carbon stocks, and improve soil quality for sustainable agriculture in coastal West Africa.

Graphical Abstract

1. Introduction

The integration of organic and inorganic soil amendments is essential for enhancing labile organic carbon (LOC) and soil organic carbon (SOC), both of which play a critical role in restoring soil health, fertility, and agroecosystem productivity worldwide [1]. Labile organic carbon, the readily decomposable fraction of SOC, serves as a key energy source for soil microorganisms that drive nutrient mineralization. SOC, derived from decomposed plant and animal biomass, is fundamental to sustaining soil fertility. However, in many urban and peri-urban agricultural systems, intensive continuous cropping—necessitated by land scarcity and the increasing demand for food—limits smallholder farmers’ ability to maintain adequate SOC levels [2,3]. The absence of fallow periods and repeated crop harvesting depletes plant biomass and soil organic matter (SOM), leading to slow or minimal accumulation of SOC and its labile fractions [2]. These challenges are further compounded by rising fertilizer costs and limited access to inorganic amendments such as sulfate of ammonia, triple superphosphate, and NPK fertilizers at the recommended rate of 60 kg ha−1 [3]. Additionally, the restricted availability of low-input organic fertilizers exacerbates soil degradation as the lack of SOM and SOC reduces soil nutrient retention and water-holding capacity, increasing the risks of nutrient leaching and erosion and declining soil fertility and crop yields [4].
To address these challenges, researchers have been promoting integrated soil fertility management (ISFM)—which includes a range of organic and inorganic amendments—that has been explored to enhance SOC accumulation and improve soil health, fertility, and productivity [5]. Organic amendments, including cow dung, compost, and biochar, provide sustainable alternatives for replenishing soil nutrients and enhancing microbial activity [5,6,7]. Compost and animal manure contain a diverse array of essential nutrients, while biochar offers a stable carbon source, contributing to long-term SOC sequestration and soil quality restoration [1,8,9,10]. However, the separate application of organic and inorganic fertilizers has been shown to yield suboptimal results compared to their combined use as an integrated soil fertility management strategy. The synergistic effects of integration stem from the buildup of SOM and SOC and the synchronization of slow nutrient release from organic amendments with the rapid availability of nutrients from inorganic fertilizers [11,12]. This combined approach has been widely recognized as an effective strategy for improving soil fertility, quality, and long-term productivity [13,14].
The Carbon Management Index (CMI) serves as a valuable tool for assessing the impact of agricultural management practices on soil health and quality [15,16,17,18]. Long-term studies have demonstrated that integrated soil fertility management (ISFM) significantly enhances CMI, reinforcing its role in promoting sustainable soil management [19].
Despite growing evidence supporting ISFM, research on its application in specific soil types, especially coastal soggy sodic soil, remains limited. These soils, such as the gleyic solonetz soils in Sege, Ada West District, Ghana, are characterized by poor drainage, high sodicity, and inherently low fertility. They are highly vulnerable to degradation, making them a critical target for sustainable soil-management interventions. Yet, there is a dearth of empirical studies assessing how integrated organic and inorganic amendments affect SOC dynamics and soil quality in these unique soil systems. This study aims to fill this knowledge gap by investigating the effects of locally available organic amendments—cow dung, compost, and biochar—in combination with inorganic fertilizers on soil carbon fractions, total carbon stocks, and the Carbon Management Index (CMI) in Sege’s coastal soggy sodic soils. The research specifically addresses the following scientific questions:
  • How do integrated organic and inorganic amendments influence labile organic carbon, soil carbon fractions, and total SOC in gleyic solonetz soils?
  • What is the effect of these amendments on the Carbon Management Index (CMI)?
This study seeks to address this gap by investigating the effects of applying locally available organic amendments such as cow dung, compost, and biochar alongside inorganic fertilizers on soil organic carbon fractions, total carbon stocks, and CMI in the coastal soggy sodic soils of Sege in Ada West District, Ghana. Understanding the potential benefits of integrated soil fertility management in low-fertility coastal gleyic solonetz soils is essential for developing sustainable strategies to enhance soil health, fertility, and agricultural productivity. The findings from this study will provide valuable insights into optimizing nutrient management practices and improving the resilience of degraded coastal soils.

2. Materials and Methods
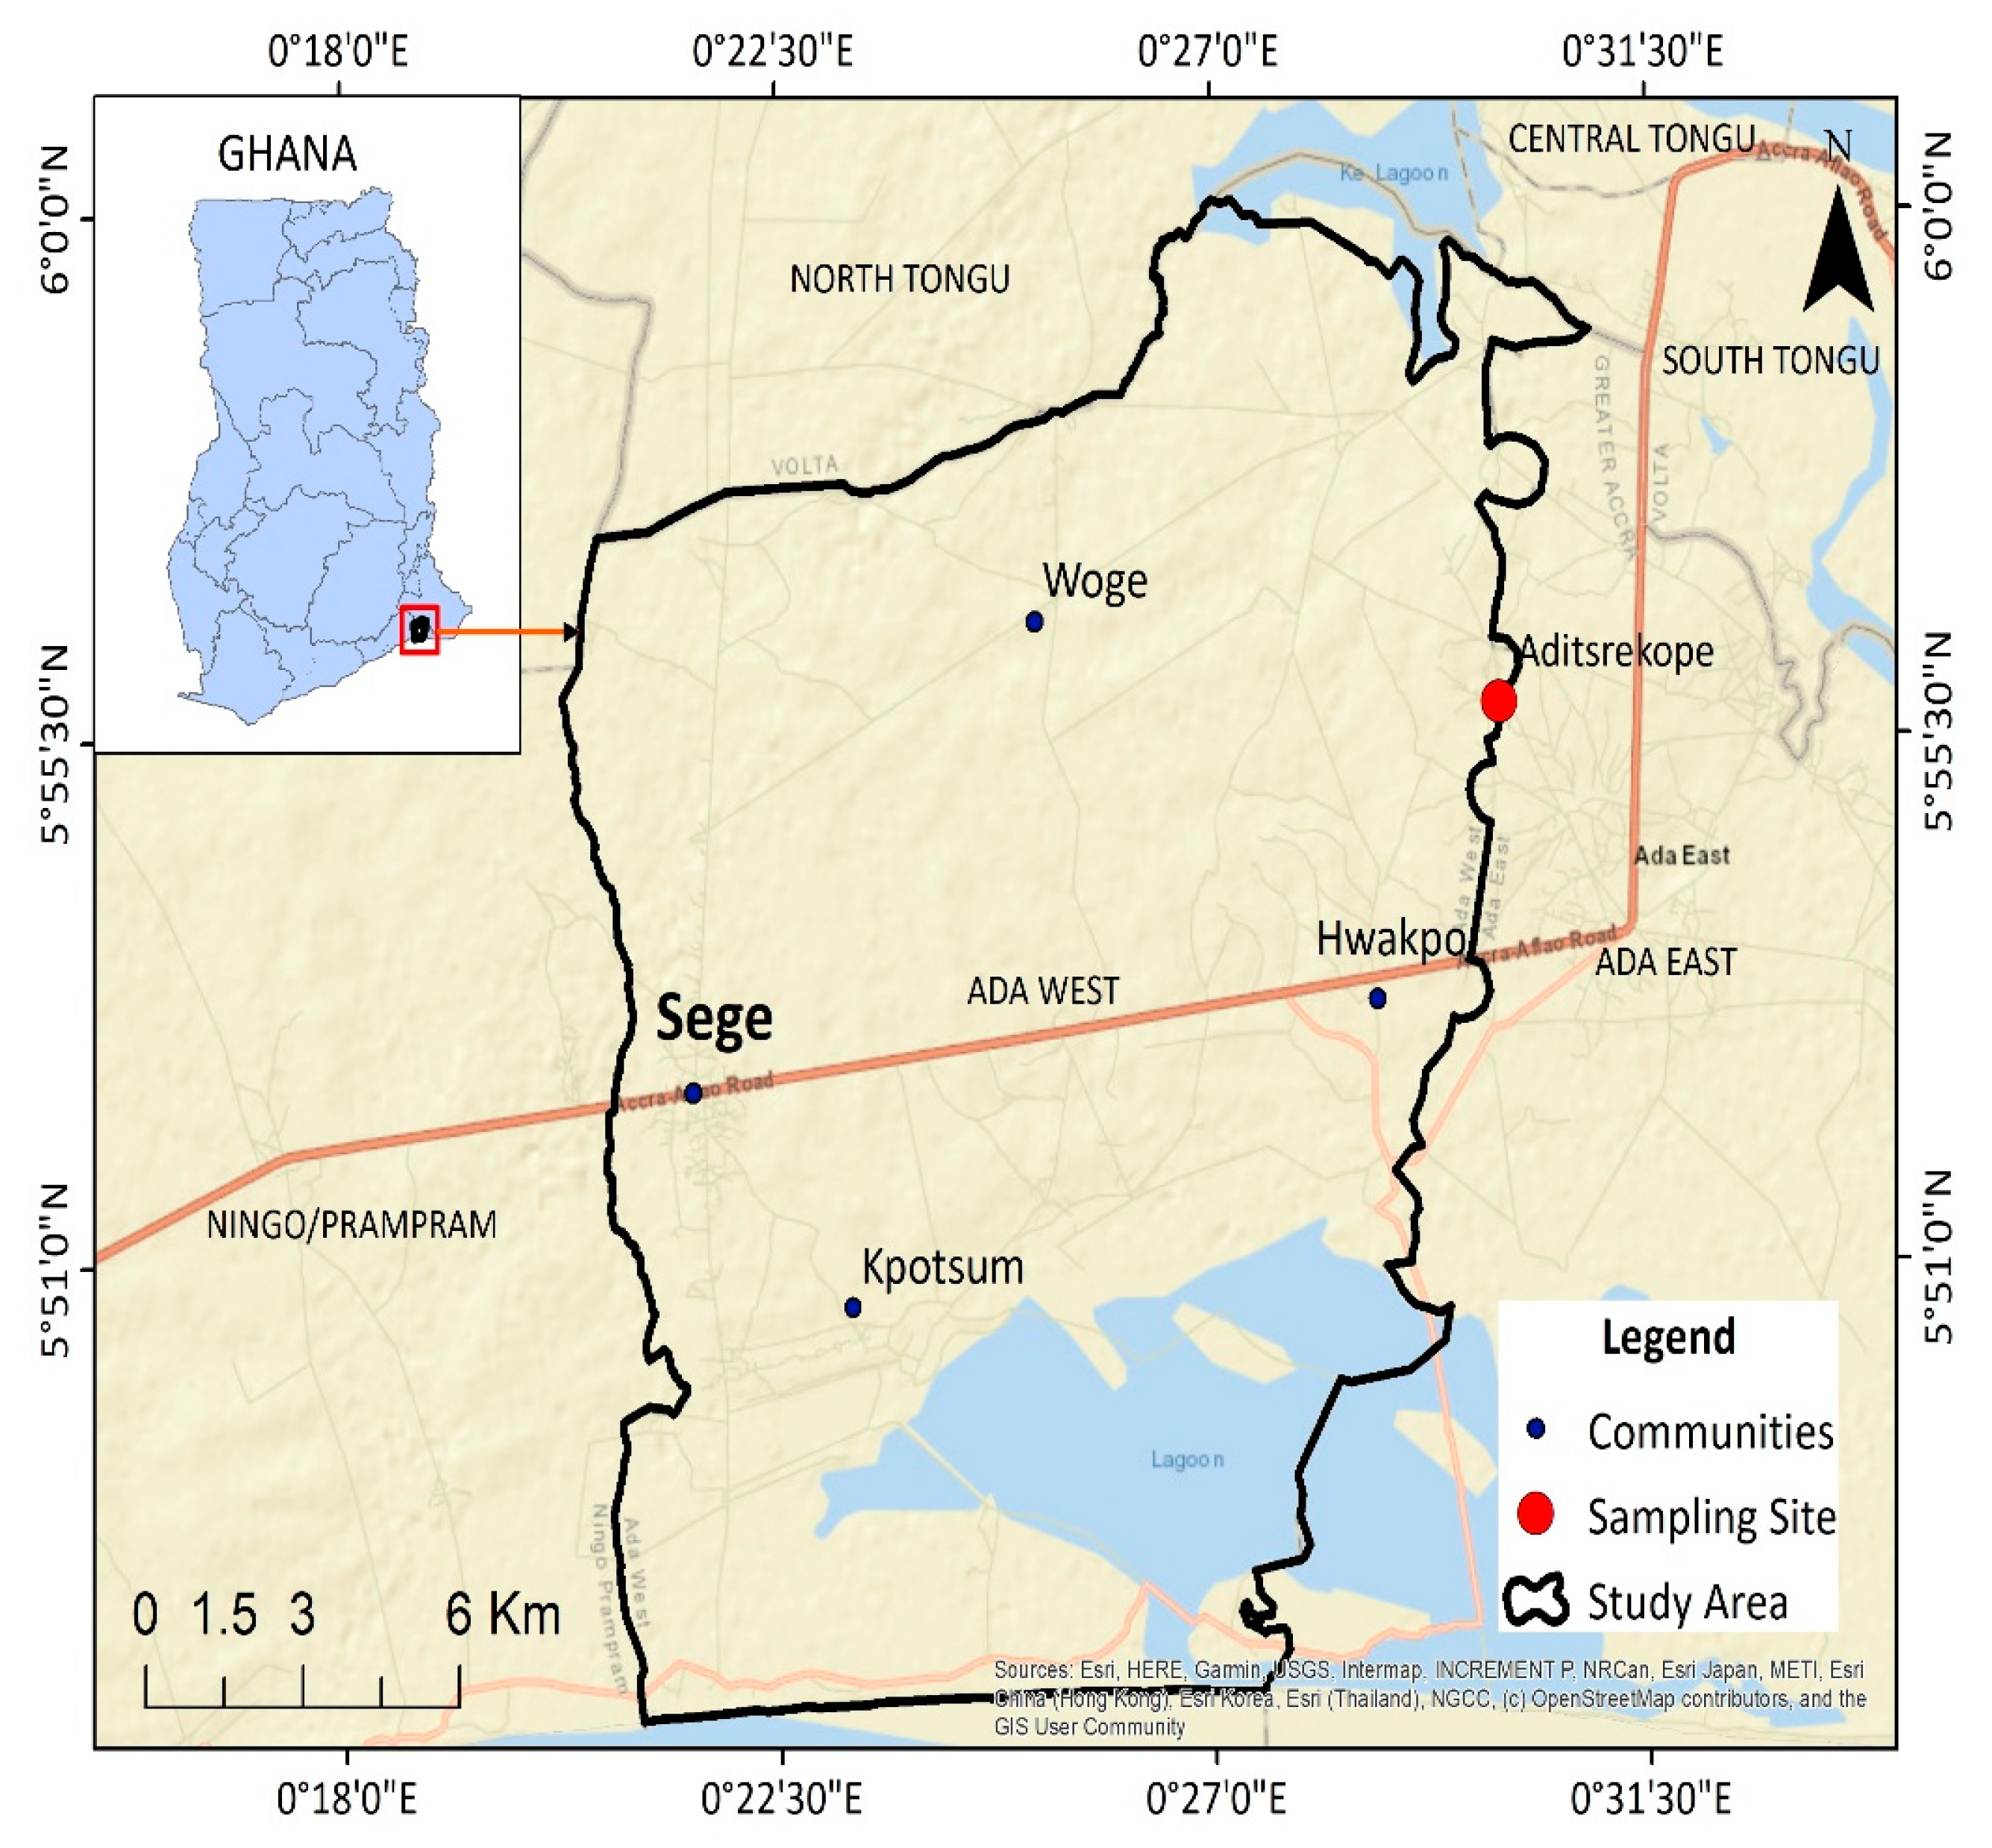
2.1. The Study Area

This study was conducted at experimental research sites managed by the Organic Resource Management for Soil Fertility (ORM4Soil) Project, located in Sege, within the Ada West District of the Greater Accra Region, Ghana (Figure 1). Sege lies between latitudes 5°45′ S and 6°00′ N and longitudes 0°20′ W and 0°35′ E, encompassing the Songhor Lagoon and the Songhor Salt Mining Factory. This region falls within the eastern coastal savannah agro-ecological zone of Ghana, near the Gulf of Guinea in West Africa.
The vegetation is characterized by short savannah grasses interspersed with shrubs and small trees [20]. Rapid urbanization, driven by population growth and the expansion of coastal communities along the West African coastline, is transforming the landscape [21,22]. The area’s climate is typically warm, with average temperatures ranging between 23 °C and 28 °C, though they can rise to 33 °C during particularly hot seasons. Annual rainfall averages 750 mm.
The soils in the study area are primarily gleyic solonetz [23], characterized by high sodium content, poor drainage, and susceptibility to waterlogging due to seawater intrusion. These sodic soils exhibit dense columnar or prismatic structures with mottling, making them challenging for agriculture due to low permeability and poor workability [23,24]. A high groundwater table and a distinct hardpan (natric) horizon, located within 100 cm of the soil surface, further constrain soil productivity [24]. The common food crops grown in the area are watermelon, tomatoes, pepper, maize, and cassava [20].

2.2. Experimental Design and Treatments

This study was designed as a Randomized Complete Block Design (RCBD) with seven treatments replicated four times at the gleyic solonetz soggy sodic (GSSS) site from 2017 to 2019. The treatments comprised various combinations of organic and inorganic soil amendments, namely:
  • MCfert [matured cow dung + sulfate of ammonia + triple superphosphate] MCbiofert [matured cow dung + sulfate of ammonia + biochar + triple superphosphate].
  • CCfert [composted cow dung + sulfate of ammonia + triple superphosphate (TSP)].
  • CCbiofert [composted cow dung + biochar + sulfate of ammonia + triple superphosphate].
  • MC + CCfert [matured cow dung + composted cow dung + ammonium sulfate + triple superphosphate].
  • NPK [15:15:15]—15% nitrogen (N), 15% Phosphorus (P), and 15% potassium (K).
  • The reference soil was an uncultivated natural soil, which served as the control. The TSP (Ca(H2PO4)2·H2O) applied contains 46% P2O5 (phosphorus pentoxide) and ammonium sulfate ((NH4)2SO4) contains 21% nitrogen and 24% sulfur (S).
Based on Lehmann and Joseph [1], it was hypothesized that the combined application of compost, animal manure, biochar, and inorganic fertilizers would enhance labile soil organic carbon (SOC) fractions, total carbon stock, and the Carbon Management Index (CMI) more effectively in the following order: uncultivated soil < NPK < MCfert < MCbiofert < CCfert < CCbiofert < MC + CCfert. The CMI of uncultivated soil, serving as the reference (control), was expected to be higher than that of cultivated soils [15]. While NPK fertilizer may increase CMI compared to unfertilized controls, its effect is generally less pronounced than that of organic amendments [19,25].
The application of cattle manure (cow dung), biochar, and compost individually is expected to result in higher CMI values compared to inorganic fertilizers alone [6,19,25]. However, the combined use of organic and inorganic amendments is hypothesized to yield the highest CMI values and improve crop productivity [19,25]. In other words, while organic amendments are anticipated to outperform inorganic fertilizers consistently, their integration is expected to maximize CMI and agricultural productivity [6,19,25].

2.3. Soil Sampling and Measurements of Physical and Chemical Properties

Samples of the treated soils were taken randomly at 0–15 cm (topsoil) and 15–30 cm (subsoil) depths during the cropping seasons of each year. For each plot, five cores of soil samples were taken and thoroughly mixed to form a composite. An uncultivated site near the experimental plot served as the control soil (reference site). A total of 60 composite soil samples were air-dried at room temperature, crushed, and sieved through a 2 mm mesh for physical and chemical analysis. Particle size distribution or fraction of the soil samples was determined using the modified Bouyoucos hydrometer method [26]. Approximately 50 g of air-dried, sieved (<2 mm) soil was dispersed in a solution of 5% sodium hexametaphosphate and distilled water. The suspension was thoroughly mixed using a mechanical shaker for 16 h to ensure complete dispersion of soil aggregates. After shaking, the suspension was transferred to a 1-L sedimentation cylinder and brought to volume with distilled water. A calibrated hydrometer was used to measure the density of the suspension at specific time intervals (40 s for sand and 2 h for clay fractions) at 20 °C. Readings were corrected for temperature and blank solution values. The relative proportions of sand, silt, and clay were calculated based on the hydrometer readings using standard Bouyoucos equations. Soil electrical conductivity (EC) and pH were measured in a 1:1 ratio (soil–water) using an electrode Oakton pH meter (Oakton Instruments, Vernon Hills, IL, USA). The soil organic carbon (SOC % = g/kg) was determined using Walkley and Black’s [27] method. Total SOC stock (%) was calculated using the bulk soil density approach (SOC stock = SOC × bulk density × soil depth). Using Kjeldahl’s method [28], total Nitrogen (TN) was determined, while available P was measured through Bray’s P1 method [29]. In addition, soil exchangeable bases (Ca, K, Mg, and Na) were extracted with 100 mL of normal ammonium acetate (NH4OAc), buffered at pH 7, and quantified using an atomic absorption spectrometer (PINAAcle 900T, Perkin Elmer Inc., Waltham, MA, USA).

2.4. Initial Soil Chemical Analysis

A preliminary data analysis was performed to determine the soil chemical properties of the biochar, compost, and cow dung). The preliminary data (Table 1 and Table 2) helped in computing the soil organic Carbon Management Index (CMI), total carbon stock, and fractional carbon in the treated soils. The total organic carbon (TOC) in the soil samples was determined using the dry combustion method with a TOC analyzer (LECO TruSpec CN Analyzer by LECO Corporation, Michigan, USA) equipped with a high-temperature furnace and non-dispersive infrared (NDIR) detector. Inorganic carbon was removed by pre-treating subsamples with dilute hydrochloric acid (HCl) to eliminate carbonates. The treated samples were then combusted at approximately 950 °C in the presence of oxygen, converting organic carbon to CO2, which was quantified by the NDIR detector. TOC concentrations were calculated based on a calibration curve prepared using certified reference materials.
The CMI comprehensively measures the impact of agricultural land management practices on soil organic carbon and quality, which are crucial for determining soil health, fertility, and carbon sequestration [15]. The process involved estimating labile carbon (LC), which defines the easiest decomposable fraction of SOC. The LC was determined using the procedure described by Blair et al. [15]. A highly reactive LC signifies the amount of oxidizable carbon by 333 mM KMnO4 C. Based on the LC, the CMI was calculated for both soil depths using Equations (1) and (2).
C M I = T O C s T O C r f × L s L r f × 100
C M I = C P I × L I × 100
where T O C s represents the total organic carbon (TOC) present in the treated soil; T O C r f represents the TOC in the reference soil. The ratio of T O C s to T O C r f estimates the soil Carbon Pool index (CPI), while the Lability Index (LI) was measured using the ratio of labile carbon ( L s ) to the non-labile carbon fraction adjusted to the reference value ( L r f ). A high lability ( L = L C T O C ) implies that a greater proportion of the TOC is easily decomposable, available for microbial activity, and can quickly supply nutrients for plant uptake but it may also mean less stable carbon storage [15]. A CMI > 100 implies the treatment led to an increased lability and TOC compared to the reference soil. Carbon Pool index (CIM) = 100 implies no change, meaning the treated soil had the same levels of lability and TOC as the reference soil condition. A CMI < 100 implies the treatment resulted in a decreased lability and/or TOC compared to the reference condition.

2.5. Statistical Analysis

Descriptive statistics (%, mean, and standard deviation) and Analysis of Variance (ANOVA) were employed using GenStat (12th edition). Duncan’s Multiple Range Test (DMRT) at 5% (soil data) probability level was used to determine the significant differences in treatment means and the effects of the measured soil parameters.

3. Results

3.1. Initial Chemical Properties of Soil, Biochar, Compost, and Cow Dung Before the Experiment

The initial chemical properties of the topsoil (0–15 cm) and subsoil (15–30 cm) before the experiment are summarized in Table 1. The topsoil exhibited slightly lower pH (4.9) and higher electrical conductivity (EC) (0.08 dS/m) compared to the subsoil. Cation exchange capacity (CEC) was marginally higher in the topsoil (8.1 cmol) compared to the subsoil (7.7 cmol). Exchangeable bases (Na, Mg, K, and Ca) were generally more concentrated in the topsoil than in the subsoil. Similarly, available phosphorus, organic matter, and organic carbon levels were higher in the topsoil, while total nitrogen was slightly higher at the surface. These variations indicate potential differences in soil fertility and nutrient availability at different depths.
The initial chemical properties of cow dung, biochar, and compost ranged from neutral to alkaline (Table 2). Cow dung had the highest pH (8.0), followed by compost (7.4) and biochar (6.8). The total nitrogen content was highest in cow dung, followed by compost and biochar (cattle manure > compost > biochar). Biochar recorded the highest organic carbon (OC) content and cation exchange capacity (CEC), highlighting its potential for soil amendment.

3.2. The Effect of Soil Amendments on Physical Properties of the Sodic Soggy Gleyic Solonetz Soil After Application of Treatment at Sege

The effects of soil amendments on the physical properties of the topsoil (0–15 cm) and subsoil (15–30 cm) after the 2019 cropping season are summarized in Table 3. The soil bulk density before the treatment application was 1.61 g cm−3 and 1.64 g cm−3 for the 0–15 cm and 15–30 cm depths, respectively. Soil bulk density was significantly influenced by the treatments (p < 0.05). Among the amendments, CCbiofert resulted in the lowest bulk density (1.51 g cm−3) in the topsoil, while the control recorded the highest (1.63 g cm−3). In the subsoil, the MCbiofert and MC + CCfert treatments had the lowest bulk density (1.60 g cm−3), whereas the control had the highest bulk density value.
The treatment did not significantly influence the particle size distribution (p < 0.05) except for the silt fraction in the topsoil. No significant (p > 0.05) differences were recorded for particle size distribution (sand, silt, and clay) in the subsoil. Hence, soil texture (loamy sand) was not significantly different in all treatments (Table 3).

3.3. The Effect of Soil Amendments on Chemical Characteristics of Gleyic Solonetz Soil at Sege

The results of the soil chemical analysis from the 2019 cropping season experimental site are presented in Table 4 and Table 5, indicating slightly acidic soil conditions. As shown in Table 5, at a 0–15 cm depth, the MCbiofert treatment recorded the highest pH (6.0), while the control had the lowest (5.6). In contrast, at 15–30 cm, the control soil exhibited the highest pH (6.0), whereas MCbiofert recorded the lowest (5.6).
Soil amendments significantly (p < 0.05) influenced total soil organic carbon at both depths. All treatments enhanced organic carbon levels in the topsoil (0–15 cm) compared to the control (Table 4). CCfert recorded the highest organic carbon content (0.37%), while the control had the lowest (0.15%). In the subsoil (15–30 cm), organic carbon content ranged from 0.09% to 0.16%, with CCbiofert exhibiting the highest (0.16%) and the control the lowest (0.09%). However, no significant differences (p > 0.05) were observed among the treatments (MCfert, CCfert, CCbiofert, MC + CCfert, and NPK) (Table 4).
Soil amendments had a significant effect (p < 0.05) on total nitrogen (N). All treatments, except MCfert, increased available nitrogen levels. CCbiofert recorded the highest total nitrogen content (0.18%), while MCfert and the control had the lowest (0.04%). No significant differences (p > 0.05) were observed among MCfert, MC + CCfert, and the control. At 15–30 cm soil depth, the control exhibited the lowest total nitrogen (0.027%), whereas MCbiofert had the highest (0.121%). However, there was no significant difference (p > 0.05) between MCbiofert and CCfert.
Soil-available phosphorus (P) was also significantly affected (p < 0.05) by the soil amendments (Table 4). At 0–15 cm, CCfert recorded the highest available phosphorus (19.15 ppm), while the control had the lowest (14.33 ppm). No significant differences (p > 0.05) were observed among MCfert, MCbiofert, MC + CCfert, and NPK. At 15–30 cm, CCbiofert had the highest available phosphorus (16.41 ppm), while NPK recorded the lowest (14.27 ppm). No significant differences (p > 0.05) were found between MCfert and MCbiofert, as well as among MC + CCfert, NPK, and the control (Table 4).
Values within a column followed by the same letter are not significantly different at p < 0.05. The concentration of exchangeable cations varied across treatments and soil depths. At the 0–15 cm soil depth, the highest exchangeable calcium (Ca) content was observed in the CCfert treatment (1.9 cmolc kg−1), while the lowest was recorded in the NPK treatment (1.1 cmolc kg−1). Statistical analysis revealed a significant difference (p < 0.05) between CCfert and all other treatments except CCbiofert and MC + CCfert.
For exchangeable magnesium (Mg) in the 0–30 cm soil depth, values ranged from 0.14 cmolc kg−1 in NPK to 0.94 cmolc kg−1 in MCfert. A significant difference (p < 0.05) was found between MCbiofert, NPK, and the control. Exchangeable potassium (K) values ranged from 0.047 cmolc kg−1 (control) to 0.068 cmolc kg−1 (MCfert). However, no significant difference (p > 0.05) was observed between MCfert and CCfert, as well as between MCbiofert and MC + CCfert.
For exchangeable sodium (Na), the highest value (0.220 cmolc kg−1) was recorded in MCfert, whereas the lowest (0.166 cmolc kg−1) was observed in MCbiofert. There was no significant difference (p > 0.05) between CCfert and the control.
At a broader range, exchangeable Ca varied from 0.59 cmolc kg−1 (CCbiofert) to 1.06 cmolc kg−1 (MCfert). No significant difference (p > 0.05) was observed between MCbiofert and CCfert and between NPK and the control. Exchangeable Mg ranged from 0.14 cmolc kg−1 (NPK) to 0.44 cmolc kg−1 (MCfert). However, differences among MCbiofert, MC + CCfert, and the control were not statistically significant (p > 0.05). For exchangeable K, values ranged from 0.030 cmolc kg−1 (MC + CCfert) to 0.071 cmolc kg−1 (MCfert). The treatments MCbiofert, CCfert, and NPK were statistically similar.
MCfert recorded the highest sodium (Na) value of 0.133 cmolc kg−1, though this was not significantly (p > 0.05) different from CCfert. In contrast, CCbiofert had the lowest Na value (0.067 cmolc kg−1). The results also showed no significant (p > 0.05) difference between MC + CCfert and NPK.
A significant (p < 0.05) difference was observed in the soil cation exchange capacity (CEC) among the different soil amendments (Table 5). The CEC ranged from 1.7 to 3.0 cmolc kg−1 in the 0–15 cm soil depth and 0.9 to 1.7 cmolc kg−1 in the 15–30 cm depth. For the 0–15 cm depth, MCfert recorded the highest CEC value (3.0 cmolc kg−1), whereas NPK had the lowest (1.7 cmolc kg−1). However, there was no significant difference between MCfert and CCfert. Additionally, no significant (p > 0.05) differences were observed between MCbiofert and the control (soil alone), or between CCbiofert and MC + CCfert. In the 15–30 cm depth, MCfert recorded the highest CEC value (1.7 cmolc kg−1), while NPK had the lowest (0.9 cmolc kg−1). The results further indicated no significant (p > 0.05) differences between MCbiofert and CCfert, nor between CCbiofert and NPK (Table 5).
The treatments had a significant (p < 0.05) effect on soil electrical conductivity (EC) (Table 5). At the 0–15 cm soil depth, EC values ranged from 0.02 to 0.09 dS m−1, with NPK recording the highest (0.09 dS m−1) and the control the lowest (0.02 dS m−1). However, no significant (p > 0.05) differences were observed among MCfert, MCbiofert, CCfert, and CCbiofert. For the 15–30 cm depth, EC values ranged from 0.019 to 0.039 dS m−1, with NPK having the highest (0.039 dS m−1) and the control having the lowest (0.019 dS m−1).
The distribution of carbon fractions in sand, silt, and clay is summarized in Table 6. No significant differences were observed among soils treated with MCbiofert, CCfert, and CCbiofert across all soil fractions at both depths. However, in the sand fraction at the 0–15 cm depth, soils amended with MCbiofert exhibited a carbon content of 0.11%, which was 2.8 times higher than that of the control (0.04%).
In the silt fraction at a depth of 0–15 cm, the control soil had a carbon content of 0.02%, which was three times lower than that of the CCfert treatment (0.06%), the highest recorded value. No significant differences were observed among MCfert, MC + CCfert, NPK, and the control at the topsoil level. Similarly, at the subsoil level, no significant treatment effects were observed, except for MC + CCfert.
For the clay fraction at 0–15 cm, the control soil contained 0.07% carbon, nearly three times lower than the CCfert-amended soil (0.20%). However, the carbon content in CCfert-treated soil was not significantly different (p > 0.05) from that in CCbiofert and MCbiofert at the same depth. At 15–30 cm, the control soil had a carbon content of 0.04%, which was 2.5 times lower than that of MC + CCfert (0.10%), the highest recorded value.
Soil amendments significantly influenced (p < 0.05) the percentage of carbon in the labile fractions (Table 7). At 0–15 cm depth, CCfert recorded the highest KMnO4-C (0.023), whereas the control exhibited the lowest (0.017). No significant differences (p > 0.05) were found among MCbiofert, CCbiofert, and MC + CCfert. Similarly, MCfert and NPK did not show statistically significant differences. The KMnO4-C values varied significantly among the different soil fractions (sand, silt, and clay).
For the sand labile fraction, CCfert-treated soils had the highest labile carbon content (0.018%), which was 2.3 times higher than that of the control soil (0.008%). No significant differences (p > 0.05) were observed between MCfert and NPK, as well as between MCbiofert and CCbiofert. In the silt fraction at 0–15 cm, CCfert recorded the highest carbon content (0.019%), while the control had the lowest (0.008%). No significant differences (p > 0.05) were observed among MCfert, MCbiofert, and NPK, as well as between CCbiofert and MC + CCfert. In the clay labile fraction, no significant differences (p > 0.05) were detected among the treatments.
In the topsoil (0–15 cm), the CCfert treatment had the highest carbon content in the silt fraction (0.0019%), while the control recorded the lowest (0.008%). ANOVA results showed no significant differences (p > 0.05) among MCfert, MCbiofert, and NPK. Similarly, CCbiofert and MC + CCfert were not statistically different. Additionally, no significant (p > 0.05) differences were observed among treatments in the clay labile fraction.
The Carbon Management Index (CMI) results, presented in Table 8, indicate that for all treatments at both soil depths, CMI values were 0.4 to 0.8 times lower than those of the reference soil. At a depth of 15–30 cm, KMnO4-C values ranged from 0.012 to 0.021. The highest KMnO4-C (0.021) was recorded in MCfert-treated soil, while the lowest (0.011) was found in the control. No significant differences (p > 0.05) were observed between MCbiofert and MC + CCfert, as well as between CCbiofert and NPK. However, KMnO4-C was significant in the sand labile fraction (Table 8), with CCbiofert recording the highest value (0.011%), whereas the control had the lowest. No significant (p > 0.05) differences were found among MCfert, CCfert, and MC + CCfert. Similarly, MCbiofert and the control did not differ significantly. For the silt and clay fractions at 0–15 cm, no significant differences (p > 0.05) were observed among treatments.
The incorporation of organic amendments at both soil depths led to a higher Carbon Management Index (CMI) compared to inorganic (NPK) treatments. In the topsoil (0–15 cm), the highest CMI was recorded in CCfert (58), while MCfert and the control had the lowest values (46). No significant differences (p > 0.05) were observed between MCbiofert and CCbiofert. At the subsoil level (15–30 cm), MCfert-amended soils recorded the highest CMI (83.45), whereas the control soil recorded the lowest value (46.81). Similarly, no significant differences (p > 0.05) were found between MCbiofert and MC + CCfert treatments.
The treatments significantly influenced (p < 0.05) the total soil organic carbon stock (Table 4). In the topsoil (0–15 cm), carbon stock ranged from 3.57 to 8.58 t/ha. The CCfert-amended soil had a 2.4-fold increase compared to the control, which recorded the lowest stock (3.57 t/ha). No significant differences (p > 0.05) were observed among MCbiofert, CCfert, and CCbiofert.
For the subsoil (15–30 cm), carbon stock varied between 4.24 and 7.64 t/ha, corresponding to MCbiofert and the control (4.24 t/ha), respectively. No significant differences (p > 0.05) were observed between MCfert and MCbiofert, as well as among CCfert, CCbiofert, and MC + CCfert treatments.

4. Discussion

4.1. The Effect of Combined Organic and Inorganic Amendment on Physicochemical Properties of Gleyic Soggy Sodic Soils at Sege

The organic treatments applied in this study significantly influenced key soil physicochemical properties, including bulk density, pH, electrical conductivity (EC), soil organic carbon (SOC), total nitrogen (TN), available phosphorus (P), exchangeable potassium (K), calcium (Ca), magnesium (Mg), sodium (Na), and cation exchange capacity (CEC) at both topsoil (0–15 cm) and subsoil (15–30 cm) depths.
Organic amendments reduced the bulk density of the topsoil (0–15 cm) compared to the untreated soil. This effect was particularly evident in soils treated with MCbiofert, CCfert, and CCbiofert, likely due to the accumulation of SOC over time. However, bulk density remained lower in the topsoil compared to the subsoil across all amended treatments. Since bulk density serves as an indicator of soil compaction, aeration, and the ability to support root growth and structural functions [30], the observed reductions suggest improved soil conditions for plant development.
The decrease in bulk density in biochar-amended soils (MCbiofert and CCbiofert) may be attributed to the porous nature of biochar, which retains the cell wall structure of its biomass feedstock [31]. This finding aligns with previous research by Laird et al. [32], who reported significantly lower bulk density in biochar-amended soils compared to untreated soils in a column incubation study. Similarly, Mankasingh et al. [33] found that biochar amendments reduced bulk density from 1.66 to 1.53 g cm3. Studies by Ulyett et al. [34] also observed lower bulk density in compost-treated soils. Moreover, organic manure application has been shown to improve soil structure by reducing bulk density while increasing porosity and moisture retention compared to chemical fertilizers alone [35]. The enhancement of soil physical properties in treatments incorporating biochar, compost, and inorganic fertilizers may be attributed to greater stabilization of soil organic matter, which promotes microbial activity and soil aggregation.
The treatments did not significantly affect soil pH at either depth (0–15 cm or 15–30 cm). This finding is consistent with the study by MacCarthy et al. [5], which investigated the use of rice husk biochar in irrigated rice cropping systems on vertisols in Ghana. While biochar application is often associated with increasing soil pH in acidic soils [36,37,38], the current study found no such effect in the biochar-treated plots. The soil pH across all treatments remained within the optimal range of 5.5–7.5 for crop production, as reported by Raemaekers [39].
Soil EC increased at both depths in all amended soils compared to the untreated soil. This increase is likely due to the introduction of cations such as Ca²⁺, Mg²⁺, and Na⁺ from organic amendments and the soil itself, which contribute to higher EC levels. Similar trends have been reported in studies by Chintala et al. [40] and Al-Wabel et al. [41]. The most pronounced increase in soil EC was observed in fields treated with NPK alone at both soil depths, likely due to the salt content of the fertilizer. Additionally, EC levels were higher in the subsoil (15–30 cm) than in the topsoil, suggesting the leaching of cations from the surface to deeper layers. This leaching effect may be attributed to the coarse-textured nature of the soil, which facilitates the downward movement of soluble ions. Previous studies have also highlighted that variations in soil EC are primarily influenced by soil texture, moisture content, bulk density, and CEC [42].
The application of organic amendments significantly increased exchangeable potassium (K), calcium (Ca), magnesium (Mg), sodium (Na), and cation exchange capacity (CEC) in the topsoil compared to the untreated soil. This finding aligns with the studies of Lehmann et al. [43], Rondon et al. [44], and Chan et al. [45], who observed improved nutrient availability following biochar application. Specifically, Chan et al. [45] reported a notable increase in soil nutrient retention after biochar incorporation. The higher CEC observed in organically amended soils supports the assertion by Vanlauwe and Giller (2006) [12] that organic amendments serve as a primary source of CEC, particularly in sandy soils.
Available phosphorus (P) was more enriched in the topsoil (0–15 cm) than in the subsoil (15–30 cm) following organic and inorganic amendments. This enrichment is likely due to the direct addition of organic materials that improve phosphorus availability. The results are consistent with the findings of Davis et al. [46], who reported an increase in P levels in soils amended with cow dung, composted manure, biochar, and inorganic fertilizers. Similar increases in available P have been documented by Olowoake and Adeoye [47] and Sanni [48].
Total nitrogen (TN) is a crucial component of soil organic matter (SOM) that influences decomposition and humification processes. Most amendments increased TN in the surface soil, except for MCfert. However, TN levels in the topsoil were inconsistent with those in the subsoil. The most pronounced effects were observed in CCfert and CCbiofert treatments, likely due to the high nitrogen content of the composted cow dung applied, as opposed to the relatively lower contribution from inorganic fertilizers. In tropical soils, TN typically ranges from 0.02% to 0.40%, with approximately 95% present in organic forms [49]. The TN levels in this study (0.03–0.14%) fall within this normal range. However, nitrogen values remained low across all treatments, with lower levels in the topsoil, likely due to leaching. The post-harvest decline in TN could also be attributed to plant nitrogen uptake during growth and development, a trend similar to the findings of Sanni [48], who observed low nitrogen levels in cow dung-treated and compost-treated plots.
All organic treatments resulted in increased soil organic carbon (SOC) in the topsoil compared to the control, which aligns with previous studies [50,51,52]. The observed increase in SOC ranged from 20% to 57%, likely due to organic matter accumulation in the surface layer (0–15 cm). The most substantial SOC increases were recorded in MCbiofert, CCfert, and CCbiofert treatments, mirroring the TN trends. These results are in line with the findings of Tanimu et al. [53], who reported that cow dung application enhances soil organic carbon content. However, organic amendments did not significantly affect SOC in the subsoil (15–30 cm), where levels remained consistently lower than in the topsoil. This could be due to the naturally higher concentration of soil organic matter in deeper soil layers [54,55]. Additionally, studies by Moreno et al. [56] and Zhao et al. [57] suggest that SOC and TN content are strongly influenced by soil type and management practices.

4.2. The Effect of the Organic and Inorganic Amendment on Soil Labile Carbon of the Gleyic Soggy Sodic Soils at Sege

Labile pools of organic carbon (C) are more responsive to management practices compared to recalcitrant pools [58]. The results of this study showed a notable increase in soil labile C across all organic and inorganic treatments at both soil depths, with a more pronounced effect in the surface soil (0–15 cm) than in the subsoil (15–30 cm). This increase is likely due to the addition of organic matter and the application of inorganic fertilizers, which may have enhanced root biomass yield, thereby contributing to higher labile C levels in the soil [52]. Roots naturally exude labile carbon compounds [59], and various management practices known to increase soil carbon have been shown to enhance KMnO4-extractable C [60,61]. The greater accumulation of labile carbon (C) in the surface soil (0–15 cm) compared to the subsoil (15–30 cm) observed in this study can be attributed to several interrelated factors grounded in both biological activity and soil management practices. Primarily, the surface soil receives the bulk of organic inputs such as plant residues, compost, and manure, which are rich in labile organic compounds. These inputs are typically retained in the top layer due to limited downward movement, especially in soils with relatively coarse texture or moderate structure [62,63].
The combined application of organic and inorganic amendments resulted in higher KMnO4-C content at both soil depths compared to soils that received only NPK fertilizer or no amendment. The increased labile C observed in organically amended plots can be attributed to the substantial organic matter input under these treatments. Previous studies have demonstrated that soils amended with manure exhibit higher labile C levels than those treated with mineral fertilizers or left unamended [64,65]. These findings are in line with earlier research by Cambardella and Elliott [66] and Janzen et al. [67], who reported that labile C concentrations are higher in systems with high substrate input and lower in those with minimal inputs.
The increase in labile C was more pronounced in the surface soil than in the subsoil. Similar trends have been reported in other studies, where labile C increased by 20% to 33% across different soil depths (0–10 cm, 10–20 cm, and 20–30 cm), mainly due to the accumulation of above- and below-ground biomass [68,69]. The application of locally available organic materials, such as cow dung and rice husk biochar, has the potential to enhance soil organic matter accumulation while reducing farmers’ dependence on inorganic fertilizers. This approach could significantly increase labile C and improve nutrient availability in agricultural soils.
Regardless of treatment differences, labile C concentration was highest in the sand fraction, followed by the clay fraction, and lowest in the silt fraction at both soil depths. The study found that 44–78% of labile C in the surface soil (0–15 cm) and 47–58% in the subsoil (15–30 cm) were associated with the sand fraction. These results contrast with the findings of Christenson et al. [70], who reported minimal labile C in sand fractions due to their limited capacity to retain soil organic carbon (SOC) as an organic coating. The high labile C content in the sand fraction observed in this study is likely attributed to the inherently sandy nature of the study site.

4.3. The Influence of Combined Organic and Inorganic Amendment on the Carbon Management Index of the Gleyic Soggy Sodic Soils at Sege

The integration of the soil organic carbon (SOC) pool and carbon lability into the Carbon Management Index (CMI), as originally proposed by Blair et al. [15], provides a valuable tool for evaluating how management practices influence soil quality. This study found that the combined application of organic and inorganic amendments significantly increased CMI compared to the use of inorganic fertilizer alone in the surface soil (0–15 cm). Among the organic treatments, CCfert had the highest CMI, indicating its superior ability to enhance soil carbon storage. These findings are consistent with those of Blair et al. [71], who demonstrated significant improvements in CMI under long-term organic amendments. Similarly, Liu et al. [72] found that manure application in maize–wheat systems significantly increased CMI by improving both labile carbon and overall SOC contents. This study supports the growing consensus that organic amendments not only supply carbon-rich materials but also stimulate microbial activity and promote soil aggregation, thereby enhancing carbon stabilization.
Interestingly, CMI values were higher in the subsoil than in the topsoil, suggesting that the subsoil has a greater potential for carbon storage. This trend diverges from the findings in many other studies, where CMI tends to be greater in surface layers due to higher organic inputs from plant residues and manure [62,73]. This may be due to the relatively higher clay content in this soil, which contributes to increased carbon protection, as reflected in the higher Carbon Pool Index (CPI) and Lability Index (LI). The observed trend in CMI closely mirrors that of total organic carbon (TOC). As highlighted by Kalambukattu et al. [74], CMI serves as an effective tool for assessing changes in soil carbon dynamics. While the absolute CMI values themselves may not be highly significant, they offer critical insights into the impact of different management practices on soil health [15].
Overall, soils receiving organic amendments exhibited higher CMI values compared to those treated with chemical fertilizers alone or left unamended. These findings align with the results of a long-term study by Blair et al. [71], which also reported significant increases in CMI following organic amendments. The most substantial improvements in CMI were observed in the 0–15 cm soil depth, primarily due to the higher CPI values associated with organic material inputs in these treatments.

4.4. The Influence of Combined Organic and Inorganic Soil Amendment on Total Soil Organic Carbon Stock of the Gleyic Soggy Sodic Soils at Sege

The results demonstrated that integrating organic and inorganic fertilization significantly enhanced soil carbon (C) storage. Above-ground biomass from fields was incorporated into the soil at the end of each growing season, contributing to higher soil C stocks in treatments with organic materials compared to those with only NPK or the control plots. These findings align with studies by Gami et al. [75] and Zhang et al. [52], which reported substantial increases in soil organic carbon (SOC) stocks up to a 60 cm depth following long-term manure and inorganic fertilizer applications in Nepal and China, respectively.
In this study, soil C stock accumulation in the 0–15 cm depth increased by 47%, 56%, 58%, 56%, 18%, and 26% under MCfert, MCbiofert, CCfert, CCbiofert, MC + CCbiofert, and NPK treatments, respectively, relative to the control. At the 15–30 cm depth, the corresponding increases were 40%, 44%, 40%, 40%, 40%, and 25%. These results indicate that soil C accumulation was more effective in the topsoil (0–15 cm) than in the subsoil (15–30 cm).

4.5. Limitations

This study focused on KMnO4-oxidizable carbon to estimate the labile carbon pool due to its simplicity and proven sensitivity to management changes; however, this single metric does not capture the full spectrum of labile soil organic carbon. Future studies should incorporate key fractions such as Particulate Organic Carbon (POC), Water Soluble Carbon (WSC), and Microbial Biomass Carbon (MBC), which provide a more comprehensive assessment of labile carbon dynamics.

5. Conclusions

The combined application of organic and inorganic amendments significantly increased soil labile C content and the Carbon Management Index (CMI) compared to NPK alone and the control. The increase in labile carbon was more pronounced in the surface soil than in the subsoil, with labile C content decreasing significantly with depth. The CCfert treatment exhibited the highest accumulation of labile C and the highest CMI, making it a promising option for farmers in the Ada West District.
Despite these gains, labile C values remained relatively low across all treatments, likely due to the short duration of this study. Further long-term research (over 10 years) is needed to assess the sustained effects of combined organic and inorganic amendments on soil labile C, particularly in gleyic solonetz soils. Additionally, soil organic carbon storage was higher in organically amended plots, with greater accumulation in the surface soil than in the subsoil. Among the treatments, CCfert and MCfert showed the highest total C stocks, making them the most effective for soil C sequestration. Overall, the application of combined organic and inorganic fertilizers improved the soil’s physical and chemical properties, reinforcing its potential as a sustainable soil-management strategy.

Author Contributions

D.M., D.S.M. and B.Y.F.-M. designed the study and wrote the protocol; D.M. collected the data; D.M., D.S.M. and B.Y.F.-M. conducted the data analysis; B.Y.F.-M. and D.M. drafted the manuscript; M.M. and B.Y.F.-M. reviewed and contributed to the scientific writing of the manuscript. All authors have read and agreed to the published version of the manuscript.

Funding

This research was financially supported by the Swiss National Science Foundation (SNSF) and the Swiss Agency for Development and Cooperation (SDC) through the Swiss Programme for Research on Global Issues for Development (r4d programme), as part of the ORM4Soil Project (Project No. 177582) on farmer-driven organic resource management to build soil fertility. Additional support was provided by the Research Institute of Organic Agriculture (FiBL).

Institutional Review Board Statement

Not applicable.

Informed Consent Statement

Not applicable.

Data Availability Statement

Data will be made available upon request.

Acknowledgments

The authors thank the ORM4SOIL project for funding this research. We also wish to express our deepest appreciation to Tsatsu Daniel of the Department of Soil Science, University of Ghana, and Teye Joseph Tetteh of the Ada West District Agriculture office for their assistance during the data collection and laboratory analysis.

Conflicts of Interest

The authors declare that there are no conflicts of interest.

References

  1. Lehmann, J.; Joseph, S. Biochar for Environmental Management: An Introduction; Routledge: London, UK, 2015; pp. 1–13. [Google Scholar]
  2. Houssou, N.; Johnson, M.; Kolavalli, S.; Asante-Addo, C. Changes in Ghanaian Farming Systems: Stagnation or a Quiet Transformation? Agric. Hum. Values 2016, 35, 41–66. [Google Scholar] [CrossRef]
  3. Martey, E.; Kuwornu, J.K.M.; Adjebeng-Danquah, J. Estimating the effect of mineral fertilizer use on Land productivity and income: Evidence from Ghana. Land Use Policy 2019, 85, 463–475. [Google Scholar] [CrossRef]
  4. Doe, E.K.; Attua, E.M.; Obour, P.B.; Quaye, A.K.; Fosu-Mensah, B.Y. Soil health and synergy of ecological determinants of green cocoa productivity in different soil ecotypes in Ghana. Front. Sustain. Food Syst. 2023, 7, 1169015. [Google Scholar] [CrossRef]
  5. MacCarthy, D.S.; Darko, E.; Nartey, E.K.; Adiku, S.G.K.; Tettey, A. Integrating Biochar and Inorganic Fertilizer Improves Productivity and Profitability of Irrigated Rice in Ghana, West Africa. Agronomy 2020, 10, 904. [Google Scholar] [CrossRef]
  6. Sohi, S.; Lopez-Capel, E.; Krull, E.; Bol, R. Biochar, Climate Change and Soil: A Review to Guide Future Research; CSIRO Land and Water Science Report 05/09; CSIRO: Canberra, Australia, 2009. [Google Scholar]
  7. Tovihoudji, P.G.; Akponikpè, P.I.; Adjogboto, A.; Djenontin, J.A.; Agbossou, E.K.; Bielders, C.L. Combining hill-placed manure and mineral fertilizer enhances maize productivity and profitability in northern Benin. Nutr. Cycl. Agroecosyst. 2018, 110, 375–393. [Google Scholar] [CrossRef]
  8. Dróżdż, D. Production and Use of Organic Soil Enhancers and Growing Media from Agro-Residues. Ph.D. Thesis, Faculty of Infrastructure and Environment, Czestochowa University of Technology, Częstochowa, Poland, Faculty of Bioscience Engineering, Ghent University, Ghent, Belgium, 2022. [Google Scholar]
  9. Gomez-Brandon, M.; Fernandez-Delgado, M.J.; Domiguez, J.; Insam, H. Animal manures: Recycling and management technologies. In Biomass Now—Cultivation and Utilization; IntechOpen: Rijeka, Croatia, 2013. [Google Scholar] [CrossRef]
  10. Akanni, D.I.; Ojeniyi, S.O. Residual effect of goat and poultry manures on soil properties, nutrient content, and yield of Amaranthus in Southwest Nigeria. Resh. J. Agron. 2008, 2, 44–47. [Google Scholar]
  11. Kapkiyai, J.J.; Karanja, N.K.; Woomer, P.; Qureshi, J.N. Soil organic carbon fractions in a long-term experiment and the potential for their use as a diagnostic assays in highland farming systems of central Kenya. Afr. Crop Sci. J. 1998, 6, 19–28. [Google Scholar] [CrossRef]
  12. Vanlauwe, B.; Giller, K. Popular myths around soil fertility management in sub-Saharan Africa. Agric. Ecosyst. Environ. 2006, 116, 34–46. [Google Scholar] [CrossRef]
  13. Field, C.M. Combining Organic and Mineral Fertilizers for Integrated Soil Fertility Management in Smallholder Farming Systems of Kenya: Explorations Using the Crop-Soil Model FIELD. Agron. J. 2008, 100, 1511–1526. [Google Scholar] [CrossRef]
  14. Quaye, A.K.; Doe, E.K.; Amon-Armah, F.; Arthur, A.; Dogbatse, J.A.; Konlan, S. Predictors of integrated soil fertility management practice among cocoa farmers in Ghana. J. Agric. Food Res. 2021, 5, 100174. [Google Scholar] [CrossRef]
  15. Blair, G.J.; Lefroy, R.D.B.; Lisle, L. Soil carbon fractions based on their degree of oxidation, and the development of a carbon management index for agricultural Systems. Aust. J. Soil Res. 1995, 46, 14591466. [Google Scholar] [CrossRef]
  16. Gentile, R.; Vanlauwe, B.; Chivenge, P.; Six, J. Soil Biology & Biochemistry Interactive effects from combining fertilizer and organic residue inputs on nitrogen transformations. Soil Biol. Biochem. 2008, 40, 2375–2384. [Google Scholar] [CrossRef]
  17. Wang, Q.; Wang, Y.; Wang, S.; He, T.; Liu, L. Fresh carbon andnitrogen inputs alter organic carbon mineralization and microbial community in forest deep soil layers. Soil Biol. Biochem. 2014, 72, 145–151. [Google Scholar] [CrossRef]
  18. Saha, S.; Mina, B.L.; Gopinath, K.A.; Kundu, S.; Gupta, H.S. Organic amendments affect biochemical properties of a subtemperate soil of the Indian Himalayas. Nutr. Cycl. Agroecosyst. 2008, 80, 233–242. [Google Scholar] [CrossRef]
  19. Sher, A.; Adnan, M.; Sattar, A.; Ul-Allah, S.; Ijaz, M.; Hassan, M.U.; Manaf, A.; Qayyum, A.; Elesawy, B.H.; Ismail, K.A.; et al. Combined Application of Organic and Inorganic Amendments Improved the Yield and Nutritional Quality of Forage Sorghum. Agronomy 2022, 12, 896. [Google Scholar] [CrossRef]
  20. Ghana Statistical Service. 2010 Population and Housing Census. Summary Report of Final Results; GSS: Accra, Ghana, 2012. [Google Scholar]
  21. Doan, P.; Oduro, C.Y. Patterns of population growth in peri-urban Accra, Ghana. Int. J. Urban Reg. Res. 2012, 36, 1306–1325. [Google Scholar] [CrossRef]
  22. Owusu, G.; Yankson, P.W. Urbanization in Ghana. The Economy of Ghana Sixty Years After Independence; Oxford University Press: London, UK, 2017; pp. 23–38. [Google Scholar]
  23. FAO. The Euphrates Pilot Irrigation Project: Methods of Soil Analysis. Gabed Soil Laboratory (A Laboratory Manual); Food and Agriculture Organization: Rome, Italy, 1974. [Google Scholar]
  24. IUSS Working Group WRB. World Reference Base for Soil Resources. International Soil Classification System for Naming Soils and Creating Legends for Soil Maps, 4th ed.; International Union of Soil Sciences (IUSS): Vienna, Austria, 2022; Available online: https://www.isric.org/sites/default/files/WRB_fourth_edition_2022-12-18.pdf (accessed on 8 July 2024).
  25. Ghosh, A.; Bhattacharyya, R.; Meena, M.C.; Dwivedi, B.S.; Singh, G.; Agnihotri, R.; Sharma, C. Long-term fertilization effects on soil organic carbon sequestration in an Inceptisol. Soil Tillage Res. 2018, 177, 134–144. [Google Scholar] [CrossRef]
  26. Day, P.R. Particle fractionation and particle-size analysis. In Methods of Soil Analysis, Part 1; Agronomy, M., Black, C.A., Eds.; American Society of Agronomy: Madison, WI, USA, 1965; pp. 545–567. [Google Scholar]
  27. Walkley, A.; Black, I.A. An Examination of the Degtjareff Method for Determining Soil Organic Matter and a Proposed Modification of the Chromic Acid Titration Method. Soil Sci. 1934, 37, 29–38. [Google Scholar] [CrossRef]
  28. Myers, R.J.K. Inclusion of Nitrate and Nitrite In The Kjeldahl Nitrogen Determination of Soils and Plant Materials Using Sodium Thiosulphate. Commun. Soil Sci. Plant Anal. 1984, 15, 1453–1461. [Google Scholar] [CrossRef]
  29. Bray, R.H.; Kurtz, L.T. Determination of total, organic, and available forms of phosphorus in soils. Soil Sci. 1945, 59, 39–46. [Google Scholar] [CrossRef]
  30. Sparling, G.P. Soil Quality Indicators. In Managing Soils and Terrestrial Systems; Taylor & Francis Group: Abingdon, UK, 2020; pp. 357–360. [Google Scholar] [CrossRef]
  31. Yadav, N.K.; Kumar, V.; Sharma, K.R.; Choudhary, R.S.; Butter, T.S.; Singh, G. Biochar and their impacts on soil properties and crop productivity: A review. J. Pharmacogn. Phytochem. 2018, 7, 49–54. [Google Scholar]
  32. Laird, D.A.; Fleming, P.; Davis, D.D.; Horton, R.; Wang, B.; Karlen, D.L. Impact of biochar amendments on the quality of a typical Midwestern agricultural soil. Geoderma 2010, 158, 443–449. [Google Scholar] [CrossRef]
  33. Mankasingh, U.; Choi, P.C.; Ragnarsdottir, V. Biochar application in a tropical, agricultural region: A plot scale study in Tamil Nadu, India. Appl. Geochem. 2011, 26, 218–221. [Google Scholar] [CrossRef]
  34. Ulyett, J.; Sakrabani, R.; Kibblewhite, M.; Hann, M. Impact of biochar addition on water retention, nitrification and carbon dioxide evolution from two sandy loam soils. Eur. J. Soil Sci. 2014, 65, 96–104. [Google Scholar] [CrossRef]
  35. Lal, R. Soils and food sufficiency. A review. Agron. Sustain. Dev. 2009, 29, 113–133. [Google Scholar] [CrossRef]
  36. Ibrahim, H.M.; Al-Wabel, M.I.; Usman, A.R.; Al-Omran, A.E. Effect of Conocarpus biochar application on the hydraulic properties of a sandy loam soil. Soil Sci. 2013, 178, 165–173. [Google Scholar] [CrossRef]
  37. Zheng, J.; Chen, J.; Pan, G.; Liu, X.; Zhang, X.; Li, L.; Bian, R.; Cheng, K.; Jinwei, Z. Biochar decreased microbial metabolic quotient and shifted community composition four years after a single incorporation in a slightly acid rice paddy from southwest China. Sci. Total Environ. 2016, 571, 206–217. [Google Scholar] [CrossRef]
  38. Xu, G.; Sun, J.; Shao, H.; Chang, S.X. Biochar had effects on phosphorus sorption and desorption in three soils with differing acidity. Ecol. Eng. 2014, 62, 54–60. [Google Scholar] [CrossRef]
  39. Raemaekers, H. Romain Crop Production in Tropical Africa; Directorate General for International Cooperation, Ministry of Foreign Affairs, External Trade and International Cooperation: Brussels, Belgium, 2001; pp. 403–407. [Google Scholar]
  40. Chintala, R.; Owen, R.; Kumar, S.; Schumacher, T.E.; Malo, D. Biochar impacts on denitrification under different soil water contents. In Proceedings of the 20th World Congress of Soil Science, Jeju, Republic of Korea, 8–13 June 2014; p. 157. [Google Scholar]
  41. Al-Wabe, M.I.; Usman, A.R.A.; Al-Farraj, A.S.; Ok, Y.S.; Abduljabbar, A.; Al-Faraj, A.; Sallam, A.S. Correction to: Date palm waste biochars alter a soil respiration, microbial biomass carbon, and heavy metal mobility in contaminated mined soil. Environ. Geochem. Health 2019, 41, 1809. [Google Scholar] [CrossRef] [PubMed]
  42. Corwin, D.L.; Lesch, S.M. Apparent soil electrical conductivity measurements in agriculture. Comput. Electron. Agric. 2005, 46, 11–43. [Google Scholar] [CrossRef]
  43. Lehmann, J.; da Silva, J.P., Jr.; Steiner, C.; Nehls, T.; Zech, W.; Glaser, B. Nutrient availability and leaching in an archaeological Anthrosol and a Ferralsol of the Central Amazon basin: Fertilizer, manure and charcoal amendments. Plant Soil 2003, 249, 343–357. [Google Scholar] [CrossRef]
  44. Rondon, M.A.; Lehmann, J.; Ramirez, J.; Hurtado, M. Biological nitrogen fixation by common beans (Phaseolus vulgaris L.) increases with bio-char additions. Biol. Fertil. Soils 2007, 43, 699–708. [Google Scholar] [CrossRef]
  45. Chan, K.Y.; Zwieten, V.L.; Meszaros, I.; Dowine, A.; Joseph, S. Using poultry litter biochars as soil amendments. Aust. J. Soil Res. 2008, 46, 437–444. [Google Scholar] [CrossRef]
  46. Davis, A.S.; Jacobs, D.F.; Wightman, K.E.; Birge, Z.K.D. Organic matter added to bareroot nursery beds influences soil properties and morphology of Fraxinus pennsylvanica and Quercus rubra seedlings. New For. 2006, 31, 293–303. [Google Scholar] [CrossRef]
  47. Olowoake, A.A.; Adeoye, G. O Influence of differently composted organic residues on the yield of maize and its residual effects on the fertility of an Alfisol in Ibadan, Nigeria. Intl. J. Agric. Environ. Biotech 2013, 6, 79–84. [Google Scholar]
  48. Sanni, K.O. Effect of compost, cow dung and NPK 15-15-15 fertilizer on growth and yield performance of Amaranth (Amaranthus hybridus); Department of Crop Production and Horticulture Lagos State Polytechnic: Ikorodu, Nigeria, 2016; pp. 76–81. [Google Scholar]
  49. Stevenson, F.J. Humic Chemistry, Genesis, Composition, Reactions; Wiley: Hoboken, NJ, USA, 1994. [Google Scholar]
  50. Banger, K.; Kukal, S.; Toor, G.; Sudhir, K.; Hanumanthraju, T. Impact of long-term additions of chemical fertilizers and farmyard manure on carbon and nitrogen sequestration under rice-cowpea cropping system in semi-arid tropics. Plant Soil 2009, 318, 27–35. [Google Scholar] [CrossRef]
  51. Li, J.; Wen, Y.; Li, X.; Li, Y.; Yang, X.; Lin, Z.; Song, Z.; Cooper, J.M.; Zhao, B. Soil labile organic carbon fractions and soil organic carbon stocks as affected by long-term organic and mineral fertilization regimes in the North China Plain. Soil Tillage Res. 2018, 175, 281–290. [Google Scholar] [CrossRef]
  52. Zhang, C.; Zhao, Z.; Li, F.; Zhang, J. Effects of Organic and Inorganic Fertilization on Soil Organic Carbon and Enzymatic Activities. Agronomy 2022, 12, 3125. [Google Scholar] [CrossRef]
  53. Dodor, D.E.; Amanor, Y.J.; Attor, F.T.; Adjadeh, T.A.; Neina, D.; Miyittah, M. Co-application of biochar and cattle manure counteract positive priming of carbon mineralization in a sandy soil. Environ. Syst. Res. 2018, 7, 5. [Google Scholar] [CrossRef]
  54. Paul, E.A.; Clark, F.E. Soil Microbiology and Biochemistry, 2nd ed.; Academic Press: London, UK, 1996. [Google Scholar]
  55. Nyakatawa, E.Z.; Reddy, K.C.; Sistani, K.R. Tillage, covercropping, and poultry litter effects on selected soil chemical properties. Soil Till. Res. 2001, 58, 69–79. [Google Scholar] [CrossRef]
  56. Moreno, F.; Murillo, J.M.; Pelegrı’n, F.; Giro’n, I.F. Long-term impact of conservation tillage on stratification ratio of soil organic carbon and loss of total and active CaCO3. Soil Till. Res. 2006, 85, 86–93. [Google Scholar] [CrossRef]
  57. Zhao, F.Z.; Yang, G.H.; Han, X.H.; Feng, Y.Z.; Ren, G.X. Stratification of carbon fractions and carbon management index in deep soil affected by the grain-to- green program in China. PLoS ONE 2014, 9, e99657. [Google Scholar] [CrossRef]
  58. Biederbeck, V.O.; Janzen, H.H.; Campbell, C.A.; Zentner, R.P. Labile soil organic matter as influenced by cropping practices in an arid environment. Soil Biol. Biochem 1994, 26, 1647–1656. [Google Scholar] [CrossRef]
  59. Conteh, A.; Lefroy, R.D.B.; Blair, G.J. Dynamics of organic matter in soil as determined by variations in 13C/12C isotopic ratios and fractionation by ease of oxidation. Soil Res. 1997, 35, 881–890. [Google Scholar] [CrossRef]
  60. Moharana, P.C.; Sharma, B.M.; Biswas, D.R.; Dwivedi, B.S.; Singh, R.V. Long-term effect of nutrient management on soil fertility and soil organic carbon pools under a 6-year-old pearl milletwheat cropping system in an incepticol of subtropical India. Field Crops Res. 2012, 136, 32–41. [Google Scholar] [CrossRef]
  61. Ng’ang’a, S.K.; Jalang’o, D.A.; Girvetz, E.H. Soil carbon enhancing practices: A systematic review of barriers and enablers of adoption. SN Appl. Sci. 2019, 1, 1726. [Google Scholar] [CrossRef]
  62. Xu, M.G.; Lou, Y.L.; Sun, X.H.; Wang, W.; Baniyamuddin, M.; Zhao, K. Effects of organic manure application with chemical fertilizers on nutrient absorption and yield of rice under long-term fertilization. Plant Soil 2011, 341, 427–438. [Google Scholar]
  63. Luo, Z.; Wang, E.; Sun, O.J. Soil carbon change and its responses to agricultural practices in Australian agro-ecosystems: A review and synthesis. Geoderma 2017, 216, 226–233. [Google Scholar] [CrossRef]
  64. Leite, L.F.C.; Mendonga, E.S.; Machado, P.L.O.A. Influence of organic and mineral fertilization on organic matter fractions of a Brazilian Acrisol under maize/common bean intercrop. Aust. J. Soil Res. 2007, 45, 25–32. [Google Scholar] [CrossRef]
  65. Mtambanengwe, F.; Mapfumo, P. Smallholder farmer management impacts on particulate and labile carbon fractions of granitic sandy soils in Zimbabwe. Nutr. Cycl. Agroecosyst. 2008, 81, 1–15. [Google Scholar] [CrossRef]
  66. Cambardella, C.; Elliott, E. Particulate soil organic-matter changes across a grassland cultivation sequence. Soil Sci. Soc. Am. J. 1992, 56, 777–783. [Google Scholar] [CrossRef]
  67. Janzen, H.H.; Campbell, C.A.; Brandt, S.A.; Lafond, G.P.; Townley-Smith, L. Light-fraction organic matter in soils from long-term crop rotations. Soil Sci. Soc. Am. J. 1992, 56, 1799–1806. [Google Scholar] [CrossRef]
  68. Benbi, D.K.; Brar, K.; Toor, A.S.; Singh, P. Total and labile pools of soil organic carbon in cultivated and undisturbed soils in northern India. Geoderma 2015, 237, 149–158. [Google Scholar] [CrossRef]
  69. Gabarron-Galeote, M.A.; Trigalet, S.; Wesemael, B. Effect of land abandonment on soil organic carbon fractions along a Mediterranean precipitation gradient. Geoderma 2015, 249–250, 69–78. [Google Scholar]
  70. Christenson, L.M.; Lovett, G.M.; Weathers, K.C.; Arthur, M.A. The Influence of Tree Species, Nitrogen Fertilization, and Soil C to N ratio on Gross Soil Nitrogen Transformations. Soil Sci. Soc. Am. J. 2009, 73, 638–646. [Google Scholar] [CrossRef]
  71. Blair, N.; Faulkner, R.D.; Till, A.R.; Korschens, M.; Schulz, E. Long-term management impacts on soil C, N and physical fertility. Part II: Bad Lauchstadt static and extreme FYM experiments. Soil Till Res 2006, 91, 39–47. [Google Scholar] [CrossRef]
  72. Liu, E.; Yan, C.; Mei, X.; He, W.; Bing, S.H.; Ding, L.; Liu, Q.; Liu, S.; Fan, T. Long-term effect of chemical fertilizer, straw, and manure on soil chemical and biological properties in northwest China. Geoderma 2018, 312, 45–52. [Google Scholar] [CrossRef]
  73. Zhou, J.; Wang, H.; Shen, J.; Li, L.; Zhang, F. Legacy of manure application history determines chemical and microbial responses of a temperate agricultural soil. Sci. Rep. 2015, 5, 16320. [Google Scholar] [CrossRef]
  74. Kalambukattu, J.G.; Singh, R.; Patra, A.K.; Arunkumar, K. Soil carbon pools and carbon management index under different land use systems in the Central Himalayan region. Acta Agric. Scan. Sect. B Soil Plant Sci. 2013, 63, 200–205. [Google Scholar] [CrossRef]
  75. Gami, S.K.; Lauren, J.G.; Duxbury, J.M. Influence of soil texture and cultivation on carbon and nitrogen levels in soils of the eastern Indo-Gangetic Plains. Geoderma 2009, 153, 304–311. [Google Scholar] [CrossRef]
Figure 1. Map of the study area.
Soilsystems 09 00062 g001
Table 1. Initial soil chemical properties at the site before the experiment at Sege.
Soil Depth/ UnitpHECCECCaMgKNaAvail. POC TNC/NOM
(1:1)dS/mcmolExchangeable Bases (cmol/kg)(cmol/kg)(%)(%) %
0–15 cm4.90.088.10.430.360.060.414.480.170.051:030.29
15–30 cm5.20.057.70.360.230.040.214.060.110.041:60.19
Table 2. Initial chemical properties of biochar, compost, and cow dung before the experiment.
Chemical PropertiesBiocharManureCompost
pH6.887.4
EC (dS/m)5.58.66.2
CEC (cmol)82.127.921.4
Ca (cmol/kg)3.06.54.2
Mg (cmol/kg)7.48.16.4
K (cmol/kg)0.641.00.74
Na (cmol/kg)0.330.930.56
Available P (%)66.191.077
OC (%)37.88.07.6
TN (%)0.490.690.55
C/N77:112:111.1
Table 3. Soil bulk density and particle size distribution.
TreatmentsSoil Bulk Density% Sand% Silt% ClayTexture
0–15 cm
MCfer 1.56 ab89.2 a5.0 ab5.8 aSand
MCbiofert1.53 a88.3 a5.0 ab6.7 aLoamy sand
CCfert1.54 a87.5 a5.8 b6.7 aLoamy sand
CCbiofert1.51 a87.5 a5.0 ab7.5 aLoamy sand
MC + CCfert1.56 ab88.3 a5.8 b5.8 aSand
NPK1.61 bc87.5 a5.0 ab7.5 aLoamy sand
Uncultivated Soil Alone1.63 c89.2 a3.3 a7.5 aSand
L.S.D. (0.05)0.061.71.72.0
15–30 cm
MCfert1.65 a88.3 a3.3 a8.3 aLoamy sand
MCbiofert1.60 a87.9 a3.3 a8.8 aLoamy sand
CCfert1.61 a87.5 a3.8 a8.8 aLoamy sand
CCbiofert1.63 a88.8 a3.8 a7.5 aLoamy sand
MC + CCfert1.60 a87.5 a3.8 a8.8 aLoamy sand
NPK1.63 a88.3 a3.3 a8.3 aLoamy sand
Soil Alone1.63 a87.5 a4.2 a8.3 aLoamy sand
L.S.D. (0.05)0.061.82.22.2
Value 1 (a) is significantly different from value 2 (b) and value 4 (c); value 2 (b) is significantly different from value 1 (a) and value 4 (c); value 3 (ab) is not significantly different from value 1 (a) or value 2 (b) but is significantly different from value 4 (c); value 4 (c) is significantly different from all other values (a, b, and ab).
Table 4. Organic carbon stock, available P, and C/N ratio of sodic soggy gleyic solonetz soil at Sege.
0–15 cm15–30 cm
TreatmentsOC (%)Stock (c/ha) N (%)AV. POC (%)Stock (c/ha)N (%)AV. P
MCfert0.29 c6.76 c0.04 a16.38 b0.15 ab7.57 c0.053 b15.03 ab
MCbiofert0.35 d8.08 d0.08 b16.32 b0.16 c7.64 c0.121 c15.11 ab
CCfert0.37 d8.58 d0.14 c19.15 c0.15 ab7.07 bc0.120 c15.73 bc
CCbiofert0.36 d8.14 d0.18 d18.62 c0.15 ab7.14 bc0.050 ab16.41 c
MC + CCfert0.19 ab4.34 ab0.05 a16.91 b0.15 ab7.32 bc0.053 b14.35 a
NPK0.20 b4.82 b0.12 c16.38 b0.12 ab5.84 b0.070 b14.27 a
Soil Alone0.15 a3.57 a0.04 a14.33 a0.09 a4.24 a0.027 a14.29 a
Values within a column followed by the same letter are not significantly different at p < 0.05.
Table 5. Treatment effects on chemical properties of sodic soggy gleyic solonetz soil at Sege.
TreatmentpHECCECCaMgKNa
(Water)(dS m−1)(cmol kg−1)(cmol/kg)
0–15 cm
MCfert5.9 a0.04 b3.0 d1.8 d0.94 d0.068 e0.220 f
MCbiofert6.0 a0.05 b2.1 b1.3 b0.48 a0.063 d0.166 a
CCfert5.8 a0.04 b2.9 d1.9 e0.80 c0.067 e0.196 b
CCbiofert5.9 a0.05 b2.7 c1.7 d0.70 bc0.050 b0.199 c
MC + CCfert5.8 a0.06 b2.6 c1.7 d0.65 b0.063 d0.201 d
NPK5.6 a0.09 c1.7 a1.1 a0.43 a0.055 c0.207 e
Soil Alone5.6 a0.02 a2.2 b1.4 c0.40 a0.047 a0.194 b
15–30 cm
MCfert5.6 a0.037 e1.7 e1.06 d0.44 d0.071 e0.133 e
MCbiofert5.6 a0.030 cd1.2 c0.82 c0.22 bc0.033 b0.107 d
CCfert5.7 a0.031 d1.2 c0.83 c0.23 c0.032 b0.132 e
CCbiofert5.7 a0.026 bc0.9 a0.59 a0.20 b0.040 d0.067 a
MC + CCfert5.8 a0.024 b1.0 b0.64 b0.21 bc0.030 a0.075 b
NPK5.7 a0.039 e0.9 a0.62 ab0.14 a0.034 b0.073 b
Soil Alone6.0 a0.019 a1.6 d0.61 ab0.21 bc0.037 c0.085 c
Values within a column followed by the same letter are not significantly different at p < 0.05.
Table 6. Soil organic carbon fractions in sand, silt, and clay.
Topsoil at 0–15 cm (%)Subsoil at 15–30 cm (%)
TreatmentOC SandSiltClayOC SandSiltClay
MCfert0.29 c0.08 bc0.04 a 0.15 c0.15 ab0.04 a0.021 b0.09 b
MCbiofert0.35 d0.11 c0.05 bc0.19 d0.16 b0.04 a0.020 b0.09 b
CCfert0.37 d0.10 c0.06 c0.20 d0.15 ab0.03 a0.020 b0.08 b
CCbiofert0.36 d0.10 c0.05 bc0.20 d0.15 ab0.04 a0.018 b0.08 b
MC + CCfert0.19 b0.06 ab0.02 a0.10 b0.15 ab0.03 a0.016 ab0.10 b
NPK0.20 b0.05 a0.02 a0.12 b0.12 ab0.04 a0.019 b0.06 ab
Soil Alone0.15 a0.04 a0.02 a0.07 a0.09 a0.03 a0.007 a0.04 a
Values within a column followed by the same letter are not significantly different at p > 0.05.
Table 7. Labile carbon fractions of soils influenced by organic and inorganic amendments at Sege.
Topsoil at 0–15 cm (%)Subsoil at 15–30 cm (%)
TreatmentKMnO4-CSand LFSilt LFClay LFKMnO4-CSand LFSilt LFClay LF
MCfert0.018 b0.008 a0.0014 b0.0023 a0.021 e0.010 c0.0008 a0.0032 b
MCbiofert0.019 c0.015 c0.0014 b0.0026 a0.014 b0.007 a0.0007 a0.0033 b
CCfert0.023 d0.018 d0.0019 cd0.0027 a0.019 d0.010 c0.0009 a0.0034 b
CCbiofert0.019 c0.014 c0.0016 bc0.0030 a0.018 c0.011 d0.0008 a0.0029 b
MC + CCfert0.019 c0.010 b0.0016 bc0.0023 a0.015 b0.010 c0.0008 a0.0034 b
NPK0.018 b0.008 a0.0014 b0.0030 a0.018 c0.009 b0.0007 a0.0034 b
Soil Alone0.017 a0.008 a0.0008 a0.0026 a0.012 a0.007 a0.0008 a0.0022 a
RF0.040 e0.033 e0.0022 d0.0053 b0.028 f0.019 e0.0017 b0.0046 c
Values within a column followed by the same letter are not significantly different at p < 0.05; RF = reference soil.
Table 8. Carbon Management Index as influenced by organic and inorganic amendments.
Topsoil at 0–15 cmSubsoil at 15–30 cm
TreatmentTOC (%)LICPICMITOC (%)LICPICMI
MCfert0.29 c2.5 b0.18 c46 a0.15 ab8.10 de0.10 ab83 e
MCbiofert0.35 d2.2 b0.22 d49 b0.16 b5.00 b0.11 b52 b
CCfert0.37 d2.5 b0.24 d58 d0.15 ab7.58 de0.10 ab74 d
CCbiofert0.36 d2.1 b0.23 d48 b0.15 ab6.95 cd0.10 ab69 c
MC + CCfert0.19 b4.4 d0.12 b51 c0.15 ab5.50 bc0.10 ab57 b
NPK0.20 b3.7 c0.13 b47 ab0.12 ab8.89 e0.08 ab71 cd
Soil Alone0.15 a5.0 e0.09 a46 a0.09 a8.07 de0.06 a47 a
RF1.58 e1.0 a1.00 e100 d1.48 c1.00 a1.00 c100 f
Values within a column followed by the same letter are not significantly different at p > 0.05, while those with different letters are significant at p < 0.05; RF reference soil.
Disclaimer/Publisher’s Note: The statements, opinions and data contained in all publications are solely those of the individual author(s) and contributor(s) and not of MDPI and/or the editor(s). MDPI and/or the editor(s) disclaim responsibility for any injury to people or property resulting from any ideas, methods, instructions or products referred to in the content.

