Article

Biochar and Kitchen Stove Ash for Improving Nutrient Availability and Microbial Functions of Tropical Acidic Soil

1
Institute of Geography, Soil Science and Soil Resources, Ruhr-Universität Bochum, 44801 Bochum, Germany
2
Regional Soil Survey, Geological Survey of North Rhine-Westphalia, 47803 Krefeld, Germany
3
Soil Science Department, College of Agriculture and Natural Sciences, University of Cape Coast, Cape Coast PMB TF0494, Ghana
*
Author to whom correspondence should be addressed.
Soil Syst. 2025, 9(2), 49; https://doi.org/10.3390/soilsystems9020049
Submission received: 6 March 2025 / Revised: 24 April 2025 / Accepted: 10 May 2025 / Published: 13 May 2025

Abstract

:
Tropical acidic soils exhibit inherently low fertility and reduced microbial activity, driven by low pH and accelerated organic matter mineralization, phosphorus (P) fixation, and aluminum (Al3+) and iron (Fe3+) toxicity. These constraints limit agricultural productivity, necessitating sustainable and low-cost soil amendments essential for improving the soil fertility in such regions. This study investigated the effects of biochar, kitchen stove ash (KSA), and their combined application on the soil chemical properties, nutrient dynamics, and microbial functions in a tropical acidic soil. The treatment included the unamended control and two doses of 0.25% w/w (B10) and 0.5% w/w (B20) corncob biochar, 0.03% w/w kitchen stove ash (Ash), and 0.027% w/w commercial-grade calcium carbonate (Lime). Each biochar dose was added alone or in combination with either ash (Ash + B10 and Ash + B20) or calcium carbonate (Lime + B10 and Lime + B20). After eight weeks of laboratory incubation at 20 °C, the soil pH, N and P bioavailability, microbial biomass, and extracellular enzyme activities were measured. The combined application of 0.5% w/w biochar with 0.03% w/w KSA (Ash + B20) resulted in the most significant improvements in all of the examined soil fertility indicators than the individual amendments. Specifically, the soil pH was increased by 40% (+1.9 pH units) compared with the unamended control. Available phosphorus, mineral nitrogen, and total potassium were increased by 49%, 22%, and 36%, respectively, compared with the unamended control. Regarding the microbial parameters, the Ash + B20-treated soil showed the highest microbial respiration (+56%), microbial biomass (+45%), and extracellular C- and N-cycling enzyme activities compared with the unamended soil. The ash supplied minerals (P, K, and Mg) provided a more beneficial effect on the soil’s nutrient content and microbial functions than the calcium carbonate. The study demonstrated that underutilized kitchen ash may supplement biochar’s liming and nutrient supply potentials, even at a lower application rate, to improve the fertility of weathered acidic soil.

1. Introduction

Soils in semi-arid and sub-humid tropics share the common characteristics of acidity and poor nutrient contents, even though their predominant soil formation factors are different [1,2]. The acidity and low nutrient conditions adversely affect crop productivity in most sub-Saharan African agroecosystems [3]. The natural process of weathering from non-calcareous parent rocks coupled with intensive farming and the use of acid-forming fertilizers are the significant causes of soil acidity in these agroecosystems [4]. Recent studies have indicated that the soil pH in key agricultural zones has declined by 0.5–1.5 units over the past three decades, with acidic soils (pH < 5.5) now affecting approximately 15–20% of arable land [5]. Additionally, the soil’s Fe concentration is high [6]. As a result, essential plant nutrients such as phosphorus (P) are readily immobilized by reactive Fe in acidic conditions, thereby reducing their bioavailability for plant uptake [7]. Soil acidity and low nutrient availability adversely impact the soil microbial biomass, respiration, and enzymatic activities, which are mainly responsible for maintaining the nutrient cycle [8]. A long-standing strategy to mitigate soil acidity involves the application of acid-neutralizing materials, which has been shown to enhance crop productivity [9]. A lime application not only corrects the soil pH, but also neutralizes the toxicity effect of Fe and Al, making plant essential nutrients more available in the soil [10]. Several Ca-containing limes, such as dolomite, calcite, slaked, and burnt lime, are effective in ameliorating acidic soil, but their application is limited by their generally low availability in tropical zones and the high cost involved [11]. Given the extensive and severe nature of soil acidity in sub-Saharan Africa, Buri et al. [6] advocate for cost-effective amelioration approaches, particularly those that are accessible to smallholder farmers.
Kitchen stove ash (KSA) is a product of combusted wood or charcoal as a cooking fuel [12]. Although not environmentally friendly, up to 80% of the rural and peri-urban residents of sub-Saharan Africa still depend on wood or firewood for cooking [13]. An estimated 500 kg of KSA is produced annually from a typical household in sub-Saharan Africa [2]. Instead of being regarded as waste material, Neina et al. [14] encouraged the agronomic use of KSA to curb the waste menace and enhance resource efficiency. KSA is an effective acid-neutralizing alkaline, containing up to 70% calcium carbonate equivalent [2,14]. Its constituent mineral elements, like Ca, P, Mg, and K, are essential for soil fertility improvement and plant growth [15]. The addition of KSA can also increase the soil pH and P availability in highly acidic savanna soil where lime is unavailable to poorly resourced farmers [16]. Several studies have demonstrated that the residual liming effect of kitchen stove ash (KSA) is relatively short-lived. In addition, the excessive application of KSA can disrupt the soil nutrient balance, inhibit microbial activity, and lead to the gradual accumulation of heavy metals. As a result, the integrated use of KSA with other organic amendments has been proposed as an effective approach to mitigate these negative impacts on soil health and function [2,17].
Many studies on improving soil fertility have featured the stable organic amendment biochar. Biochar is produced from the pyrolysis of agricultural by-products by heating biomass at high temperatures (450–700 °C) under limited oxygen conditions [18]. Depending on the feedstock and production conditions, the extent of biochar’s benefit to soil may also vary in different soil types and fertility levels [19,20]. Long-term biochar application enhances soil microbial diversity through stable microhabitats and altered substrate availability [19] and also improves the soil structure, enhances nutrient retention, and contributes to long-term carbon sequestration [21]. Amongst the significant considerations for adding biochar to tropical soil is the ability to increase the pH of acidic soils. Yeboah et al. [22] reported a significant improvement in the soil pH that correlated strongly with the crop yield in rice husk and corncob biochar-amended acidic soil. The liming potential of biochar results from the ash elemental content and is responsible for improving the soil pH [2]. In a study by Steiner et al. [23], biochar produced from corncobs, peanut hulls, rice husks, and wood shaving feedstocks had an ash content of 23%, 13%, 50%, and 16%, respectively, which significantly increased the soil pH and enhanced the nutrient availability in acidic soils, thereby positively influencing plant growth. Frimpong et al. [24] demonstrated that effective soil acidity amelioration in tropical regions requires biochar application rates exceeding 30 t ha⁻1. The practical and sustainable implementation of such high biochar dosages in these soils presents significant challenges related to feedstock availability and the high production cost. In this regard, Galinato et al. [25] suggested that adding lime to such acidic soils would be more economical than biochar. Sanchez [2] also discussed the unlikely agronomic relevance of biochar application to soil fertility if the rate was above 10 t ha−1.
Hence, the objective of this study was to evaluate the co-application of biochar and kitchen stove ash (KSA) as a sustainable and cost-effective strategy to enhance the soil pH, nitrogen (N) and phosphorus (P) availability, and microbial function in tropical acidic soils. Specifically, the study compared the effectiveness of KSA to that of commercial calcium carbonate (CaCO₃), each applied in combination with biochar at reduced amendment rates. We therefore hypothesized that the co-addition of ash and biochar would (i) significantly improve the soil pH, nutrient (N and P) availability, and efficient microbial function in tropical acidic soil, and (ii) allow for reduced biochar application rates for the improvement of highly weathered soil.

2. Materials and Methods

2.1. Soil Sampling, Lime Requirement, and CaCO3 Determination

Petroplinthic Cambisol (IUSS Working Group [26]) samples were collected using a soil auger from a depth of 0–20 cm from an arable field in the savannah agroecological zone of Ghana (9°28028.7500 N latitude and 0°50053.4800 W longitude) for this study. The soil is Fe-rich with an average pH of 4.8 and is composed of 45.7% sand, 48.4% silt, and 5.9% clay, respectively. The soil contained 4.1 g kg−1 SOC, total nitrogen of 0.4 g kg−1, and an effective CEC of 33 mmolc kg−1. The collected soil was air-dried, sieved (2 mm), and transported in an air-tight package to Germany for the incubation studies and laboratory analysis. The lime requirement of the soil was estimated according to the method described by Shoemaker et al. [27]. Briefly, 10 mL of Shoemaker–McLean–Pratt (SMP) buffer was added to a 1:5 (w/v) suspension of soil and 0.1 M CaCl2. The mixture was shaken for 15 min, and the reading was taken with a pH meter (Sentix 41, Wissenschaftlich-Technische Werkstätten (WTW) GmbH, Weilheim, Germany) after 60 min. Using a reference chart by Ziadi and Sen Tran [28], the lime requirement of the soil was estimated at 0.5 t ha−1 CaCO3 to a target pH of 6.1 from the initial pH of 4.8. Ash was collected randomly from over 20 traditional cookstoves in Ghana and composited for the study. The calcium carbonate (CaCO3) equivalent (CCE) in the ash was determined using the back titration method [29]. Before the CCE determination, the ash was oven-dried at 60 °C and sieved through 500 µm mesh. Then, 1 g of ash was gently boiled for 5 min in 10 mL of 0.5 mol dm−3 HCl and cooled to room temperature by adding 50 mL of deionized water. The solution was back titrated with 1 N NaOH to a faint pink color using phenolphthalein as an indicator. The percentage of CaCO3 was calculated according to the method described by Horváth et al. [30]. Two rates of corncob-derived biochar, 0.5% w/w (B20) and 0.25% w/w (B10), corresponding to 20 and 10 t ha−1, were applied. Based on the predetermined lime requirement of the soil, kitchen stove ash (Ash) and commercial grade calcium carbonate (Lime) were applied at 0.03% w/w (Ash) and 0.027% w/w (Lime), equivalent to 0.7 and 0.5 t ha−1, respectively. Each rate of biochar was applied solely or in combination with KSA (Ash + B10 and Ash + B20) or calcium carbonate (Lime + B10 and Lime + B20). The unamended Petroplinthic Cambisol served as the control treatment. The chemical properties of the applied biochar and KSA are presented in Table 1.

2.2. Incubation Experiment and Basal Respiration

The control and all amended treatments were adjusted to 50% water-holding capacity and transferred to a 0.12 L vessel for eight (8) weeks of incubation at 20 °C. The incubation vessels were placed in an airtight flask with a cup fitted at the upper chamber. A 10 mL of 0.1 M potassium hydroxide (KOH) solution was added to the cup, and the unit was inserted in a water bath of a 96-cell respirometer (Respicond IV device Nordgren Innovations, Djäkneboda, Sweden). The CO2 evolution was automatically measured every four hours with platinum electrodes attached to a CarbOBot unit (prw electronics, Berlin, Germany) through the detection of changes in the electrical conductivity of the KOH solution. Saturated KOH due to absorbed CO2 from the soil was freshly replaced, and CO2 emitted from each treatment was continuously measured. The total amount of CO2 measured per treatment over the period (basal respiration) was cumulatively calculated and expressed as µg C-CO2 g−1 soil.

2.3. Microbial Biomass Carbon and Nitrogen

After incubation, the chloroform fumigation extraction method (CFE) described by Vance et al. [31] was adopted to estimate the microbial biomass carbon (Cmic) and microbial biomass nitrogen (Nmic). A duplicate sample of 10 g was weighed in 100 mL glass bottles. The bottles containing samples for fumigation extraction were placed in a glass desiccator containing ethanol-free chloroform (CHCl3) for 24 h. Afterward, 40 mL of 0.05 M K2SO4 solution was added to the fumigated and non-fumigated samples. The samples were then shaken for 30 min on a horizontal shaker (Edmund Bühler GmbH, Bodelshausen, Germany) at 250 rev min−1 and filtered through Whatman glass microfiber filters (Sigma-Aldrich Chemie GmbH, Munich, Germany). Using a TOC-TNb Analyzer Multi-N/C 2100S (Analytik Jena, Jena, Germany), the K2SO4 extractable C and N in the fumigated and non-fumigated extracts were determined. The difference in extractable C and N contents in the fumigated and non-fumigated extracts was calculated in the formula kEC with a factor of 0.45, described by [32].

2.4. Determination of Extracellular Enzyme Activities

Extracellular enzyme activities for C and N cycles were measured to assess the response of soil microorganisms to changing substrate and nutrient supply. Extracellular enzyme analyses were carried out using the microplate fluorometric multi-substrate assay as described by Marx et al. [33]. The activities of β-glucosidase (β-glu), β-cellobiohydrolase (β-cello), and β-xylosidase (β-xyl) for carbon cycling, tyrosine-aminopeptidase (Tyr-amino), and arginine-aminopeptidase (Arg-amino) for nitrogen cycling, and N-acetyl glucosaminidase (N-acet) conducting to the carbon and nitrogen cycle were measured. A total of 1 g of fresh soil and 50 mL of the sterile water suspension were mixed in an autoclaved glass beaker. The suspensions were subjected to 150 W sonication for 1 min to release the attached enzymes from the soil particles. The activities of β-glu, β-cello, β-xyl, and N-acet were determined using 4-methylumbelliferon (MUF), while Tyr-amino and Arg-amino were analyzed with 7-amino-4-methylcoumarin (AMC) labeled substrate (Sigma-Aldrich Chemie GmbH, Munich, Germany). Different concentration levels of 0, 50, 100, 150, and 200 μmol were prepared for each substrate to calculate the Michaelis–Menten enzyme kinetics to determine the maximal potential activity (Vmax) and substrate affinity (Km). An optimal pH for enzyme activities was obtained by preparing a 0.1 M 2-N-morpholinoethanesulfonic acid (MES) buffer for MUF and 0.05 M Tris (hydroxymethyl) aminomethane (TRIZMA) buffer for the AMC substrates. Samples and respective buffer solutions were pipetted into Greiner 96 Polystyrol microplates (Sigma-Aldrich Chemie GmbH, Munich, Germany). The plates were incubated at 30 °C, and fluorescence was measured every 0, 30, 60, 120, and 180 min using a Tecan infinite 200 microplate reader (Tecan Trading AG, Mannedorf, Switzerland) at the 360 nm excitation and 465 nm emission wavelengths. The enzyme activities over time were calculated in nmol g−1 h−1 using the maximal velocity (Vmax) and Michaelis–Menten constant Km in a nonlinear regression model (Km = Vmax/2).

2.5. Soil pH, Mineral N, Plant Available P, and Total Soil Nutrients

Soil pH was determined in a 1:5 (w/v) mixture of soil and 0.1 M CaCl2 solution, and readings taken with a pH probe (Sentix 41, Wissenschaftlich-Technische Werkstätten (WTW) GmbH, Weilheim, Germany). The soil mineral N (Nmin) content was determined by shaking 10 g of preincubated soil in 100 mL of 0.01 M K2SO4 solution for one hour and filtered through 0.45 mm Whatman filter paper. The ammonium (NH4) content in the extract was determined photometrically with sodium dichloroisocyanurate and sodium salicylate (DIN 38406-E5-1, 1985) in a Lambda 2 spectrophotometer (Perkin Elmer Inc., Waltham, MA, USA), and the nitrate (NO3) concentrations were measured with an ion chromatograph (881 Compact IC Pro, Metrohm AG, Herisau, Switzerland). For phosphate determination, a 1:7 (w/v) air-dried soil and acid fluoride solution was shaken for 90 s at 125 rpm and immediately filtered with 0.2 μm cellulose membrane filter paper [34]. The orthophosphate content in the extracted solutions was colorimetrically determined by absorption at a wavelength of 695 nm using the molybdenum blue method [35].
The total carbon and nitrogen contents of the soil samples were determined using a C/N analyzer (Vario Max Cube, Elementar Analysesysteme Gmbh, Hanau, Germany). The total nutrient concentrations (Ca, K, Al, and Fe) in the soils were measured after microwave-assisted digestion with concentrated nitric acid (65% HNO3) in Teflon tubes. Briefly, 0.25 g of soil was digested in 10 mL of nitric acid using a MARS Xpress microwave (CEM, Kamp-Lintfort, Germany) at 120 °C for 15 min. After cooling to room temperature, the digest was diluted with 10 mL of deionized water and filtered through 0.2-μm cellulose membrane filter paper. The resulting solution was analyzed for the total nutrient concentrations using inductively coupled plasma-optical emission spectrometry (Ciros CCD, SPECTRO Analytical Instruments GmbH, Kleve, Germany).

2.6. Statistical Analysis

The experimental dataset was subjected to analysis of variance (ANOVA, p < 0.05) using the R Language and Environment for Statistical Computing version 4.3.1 [36]. The Shapiro–Wilk test was carried out to test the normal distribution of the dataset and visualized by ggboxplot and gghistograph. A post hoc test (Tukey’s HSD) was performed to determine the least significant difference (LSD) of means at p values < 0.05. The principal component analysis was applied to analyze correlations between the soil fertility attributes. Pearson correlation analysis was conducted to assess the relationships among variables, with R2 and p-values reported in three significance ranges: >0.05, >0.01, and >0.001. The PCA figure was created using OriginPro version 2022b (Origin Lab Corporation, Northampton, MA, USA) [37].

3. Results

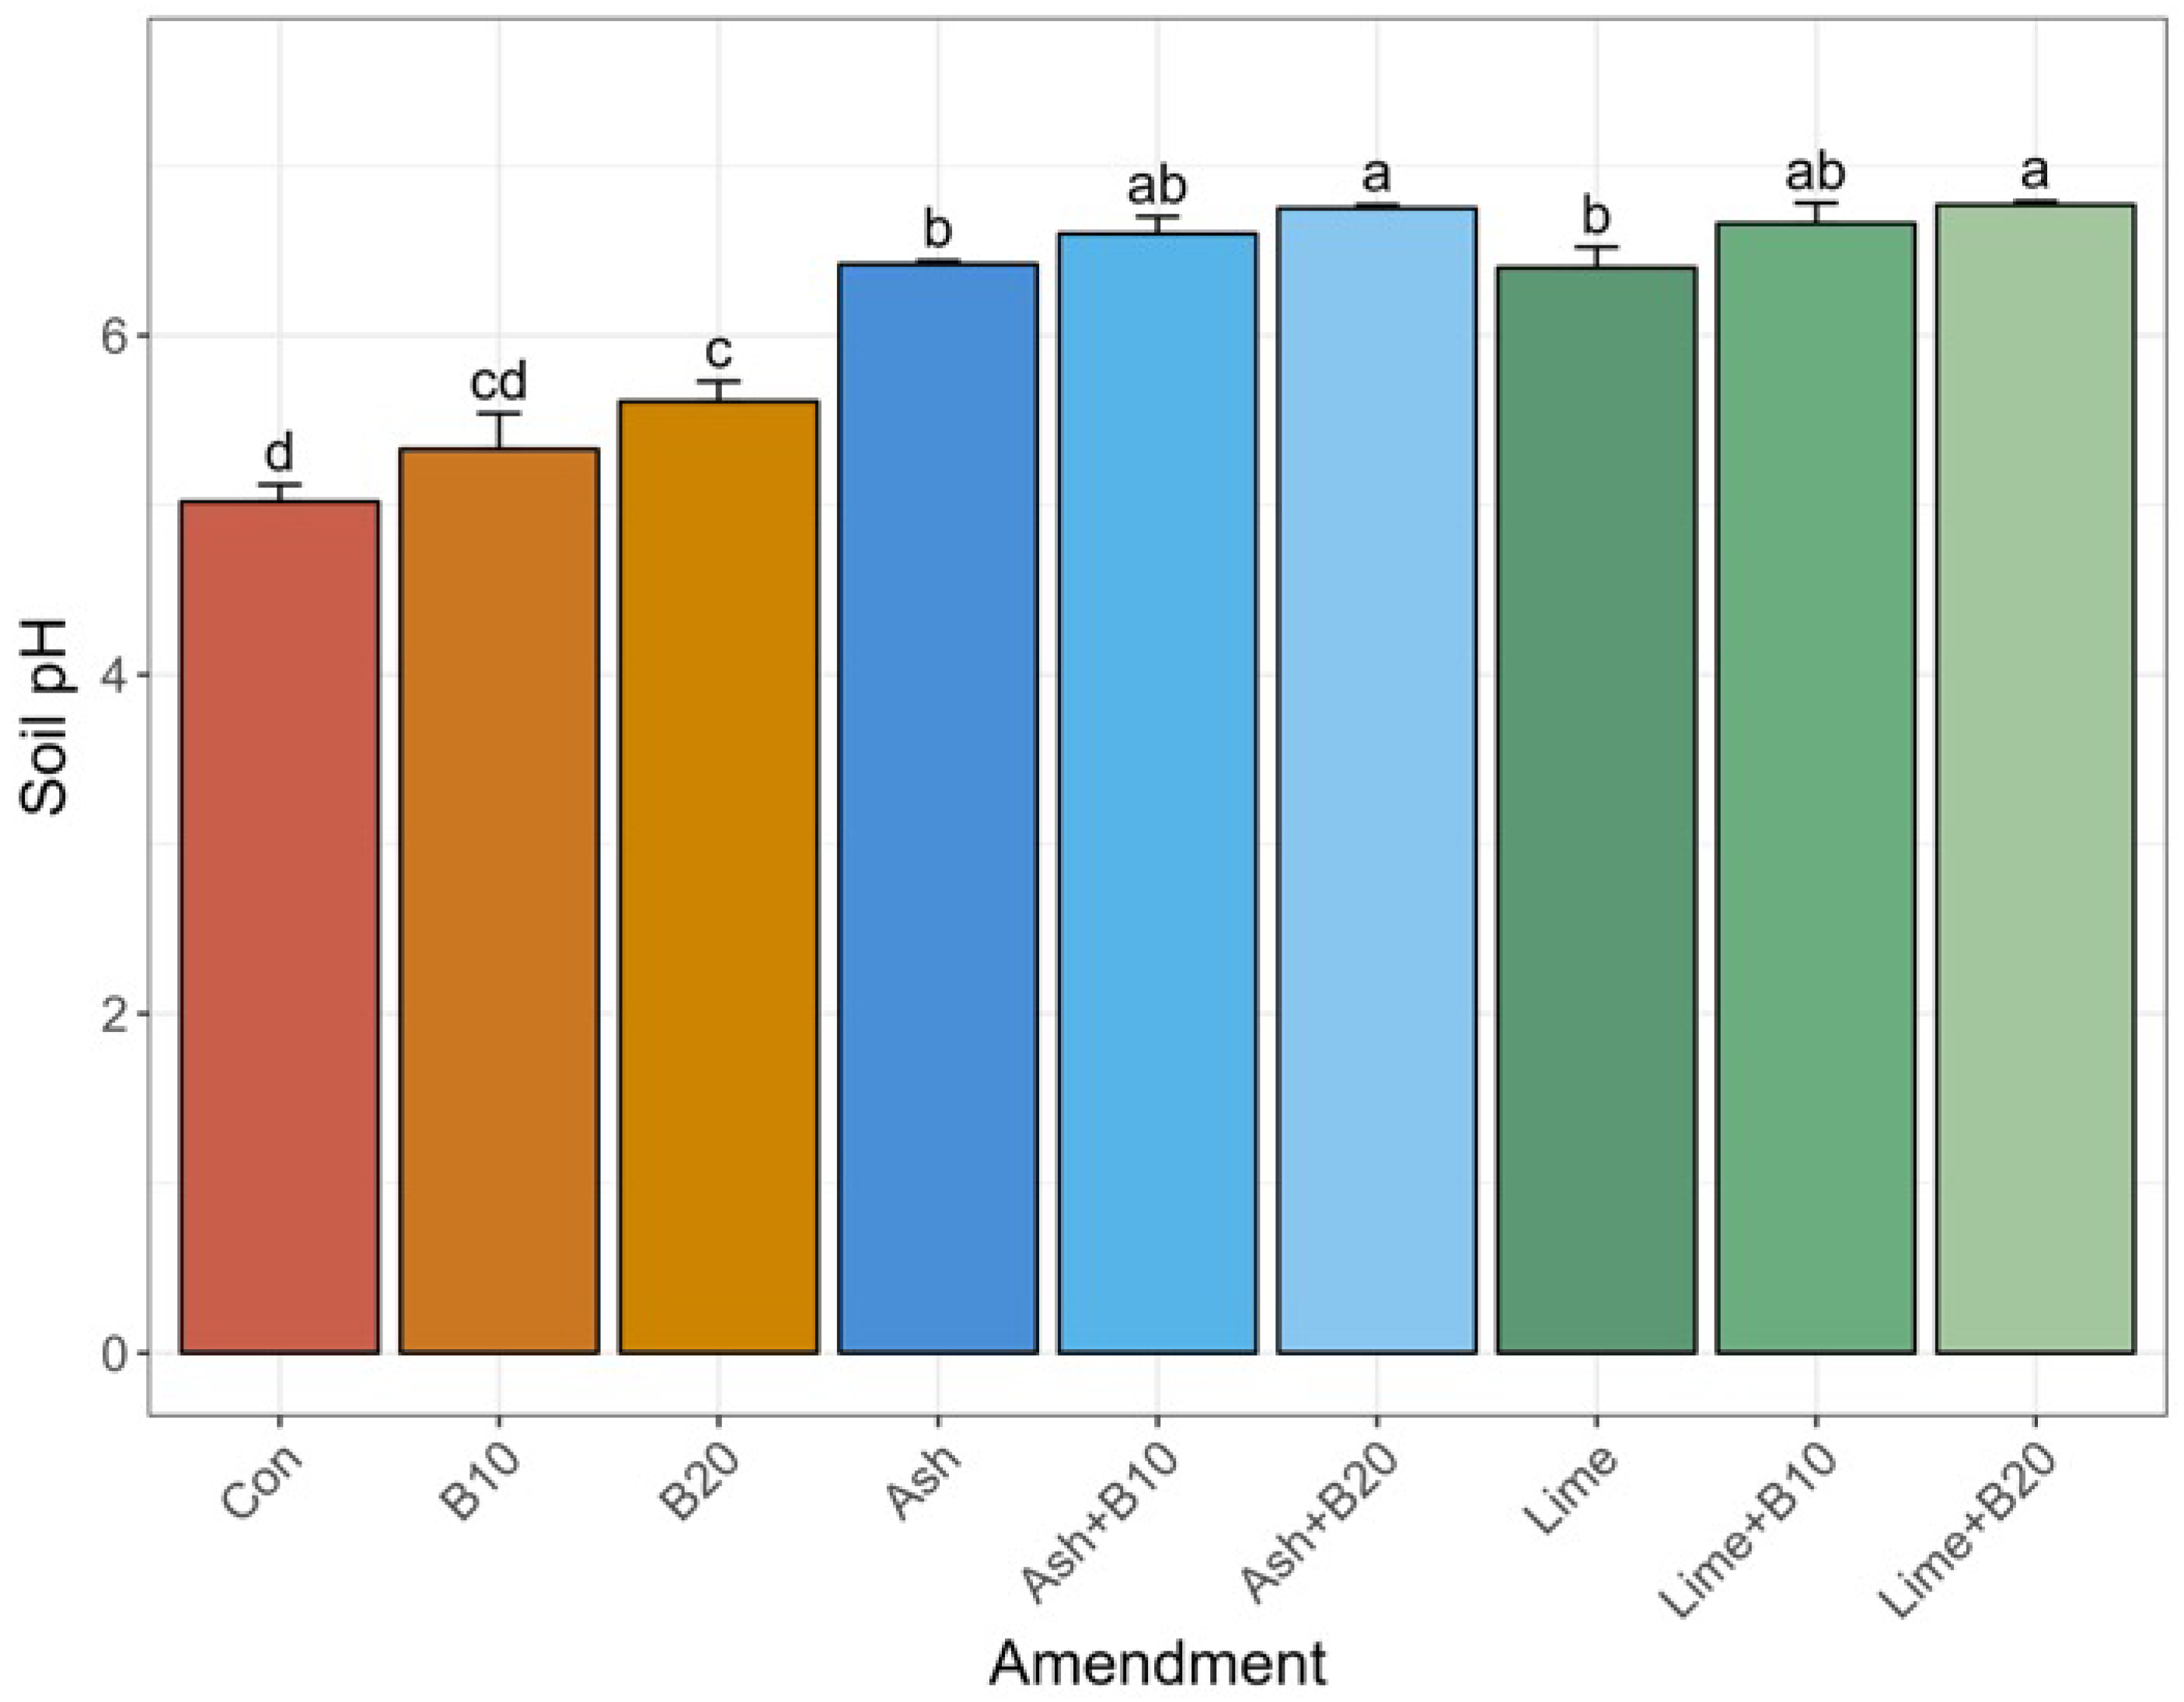
3.1. Treatment Effect on Soil pH

The application of ash and CaCO3 increased the soil pH by a unit of 1.4 relative to the control soil (Figure 1). A further increase in soil pH was observed when biochar was co-applied with either the ash or the CaCO3, providing the highest pH increase of 6.7. The sole addition of 0.5% (w/w) biochar caused a significant pH increase to 5.5 compared with the control soil, but no increase in pH was observed when the biochar was applied at a reduced rate of 0.25% (w/w) (Figure 1). Soil amended with 0.5% (w/w) biochar and kitchen ash or CaCO3 showed a higher soil pH than when each amendment was applied alone.

3.2. Mineral Nitrogen and Phosphorus Concentrations

Adding biochar solely to the weathered acidic soil did not affect the mineral N and P availability (Figure 2A,B). Similarly, the sole addition of CaCO3 increased the mineral N (Nmin) by 10% and P availability by up to 19%, but was not statistically different compared with the control soil. However, with an equivalent rate of ash, the P availability was significantly increased (Figure 2B), whereas up to a 14% increment in mineral N was indicated in the soil (Figure 2B). The co-application of biochar and liming material (ash or CaCO3) had the highest effect on the nutrient bioavailability of the weathered acidic soil with the available P and mineral N content corresponding to the higher application rates. All treatments that involved the co-amendment of biochar and lime significantly (p < 0.05) increased the mineral N and available P of the soil compared with the control (Figure 2A,B). Amongst all treatments, the combined 0.5% (w/w) biochar (B20) and ash had the most profound effect on the bioavailability of P (+60%) and N (+30%) relative to the unamended control.

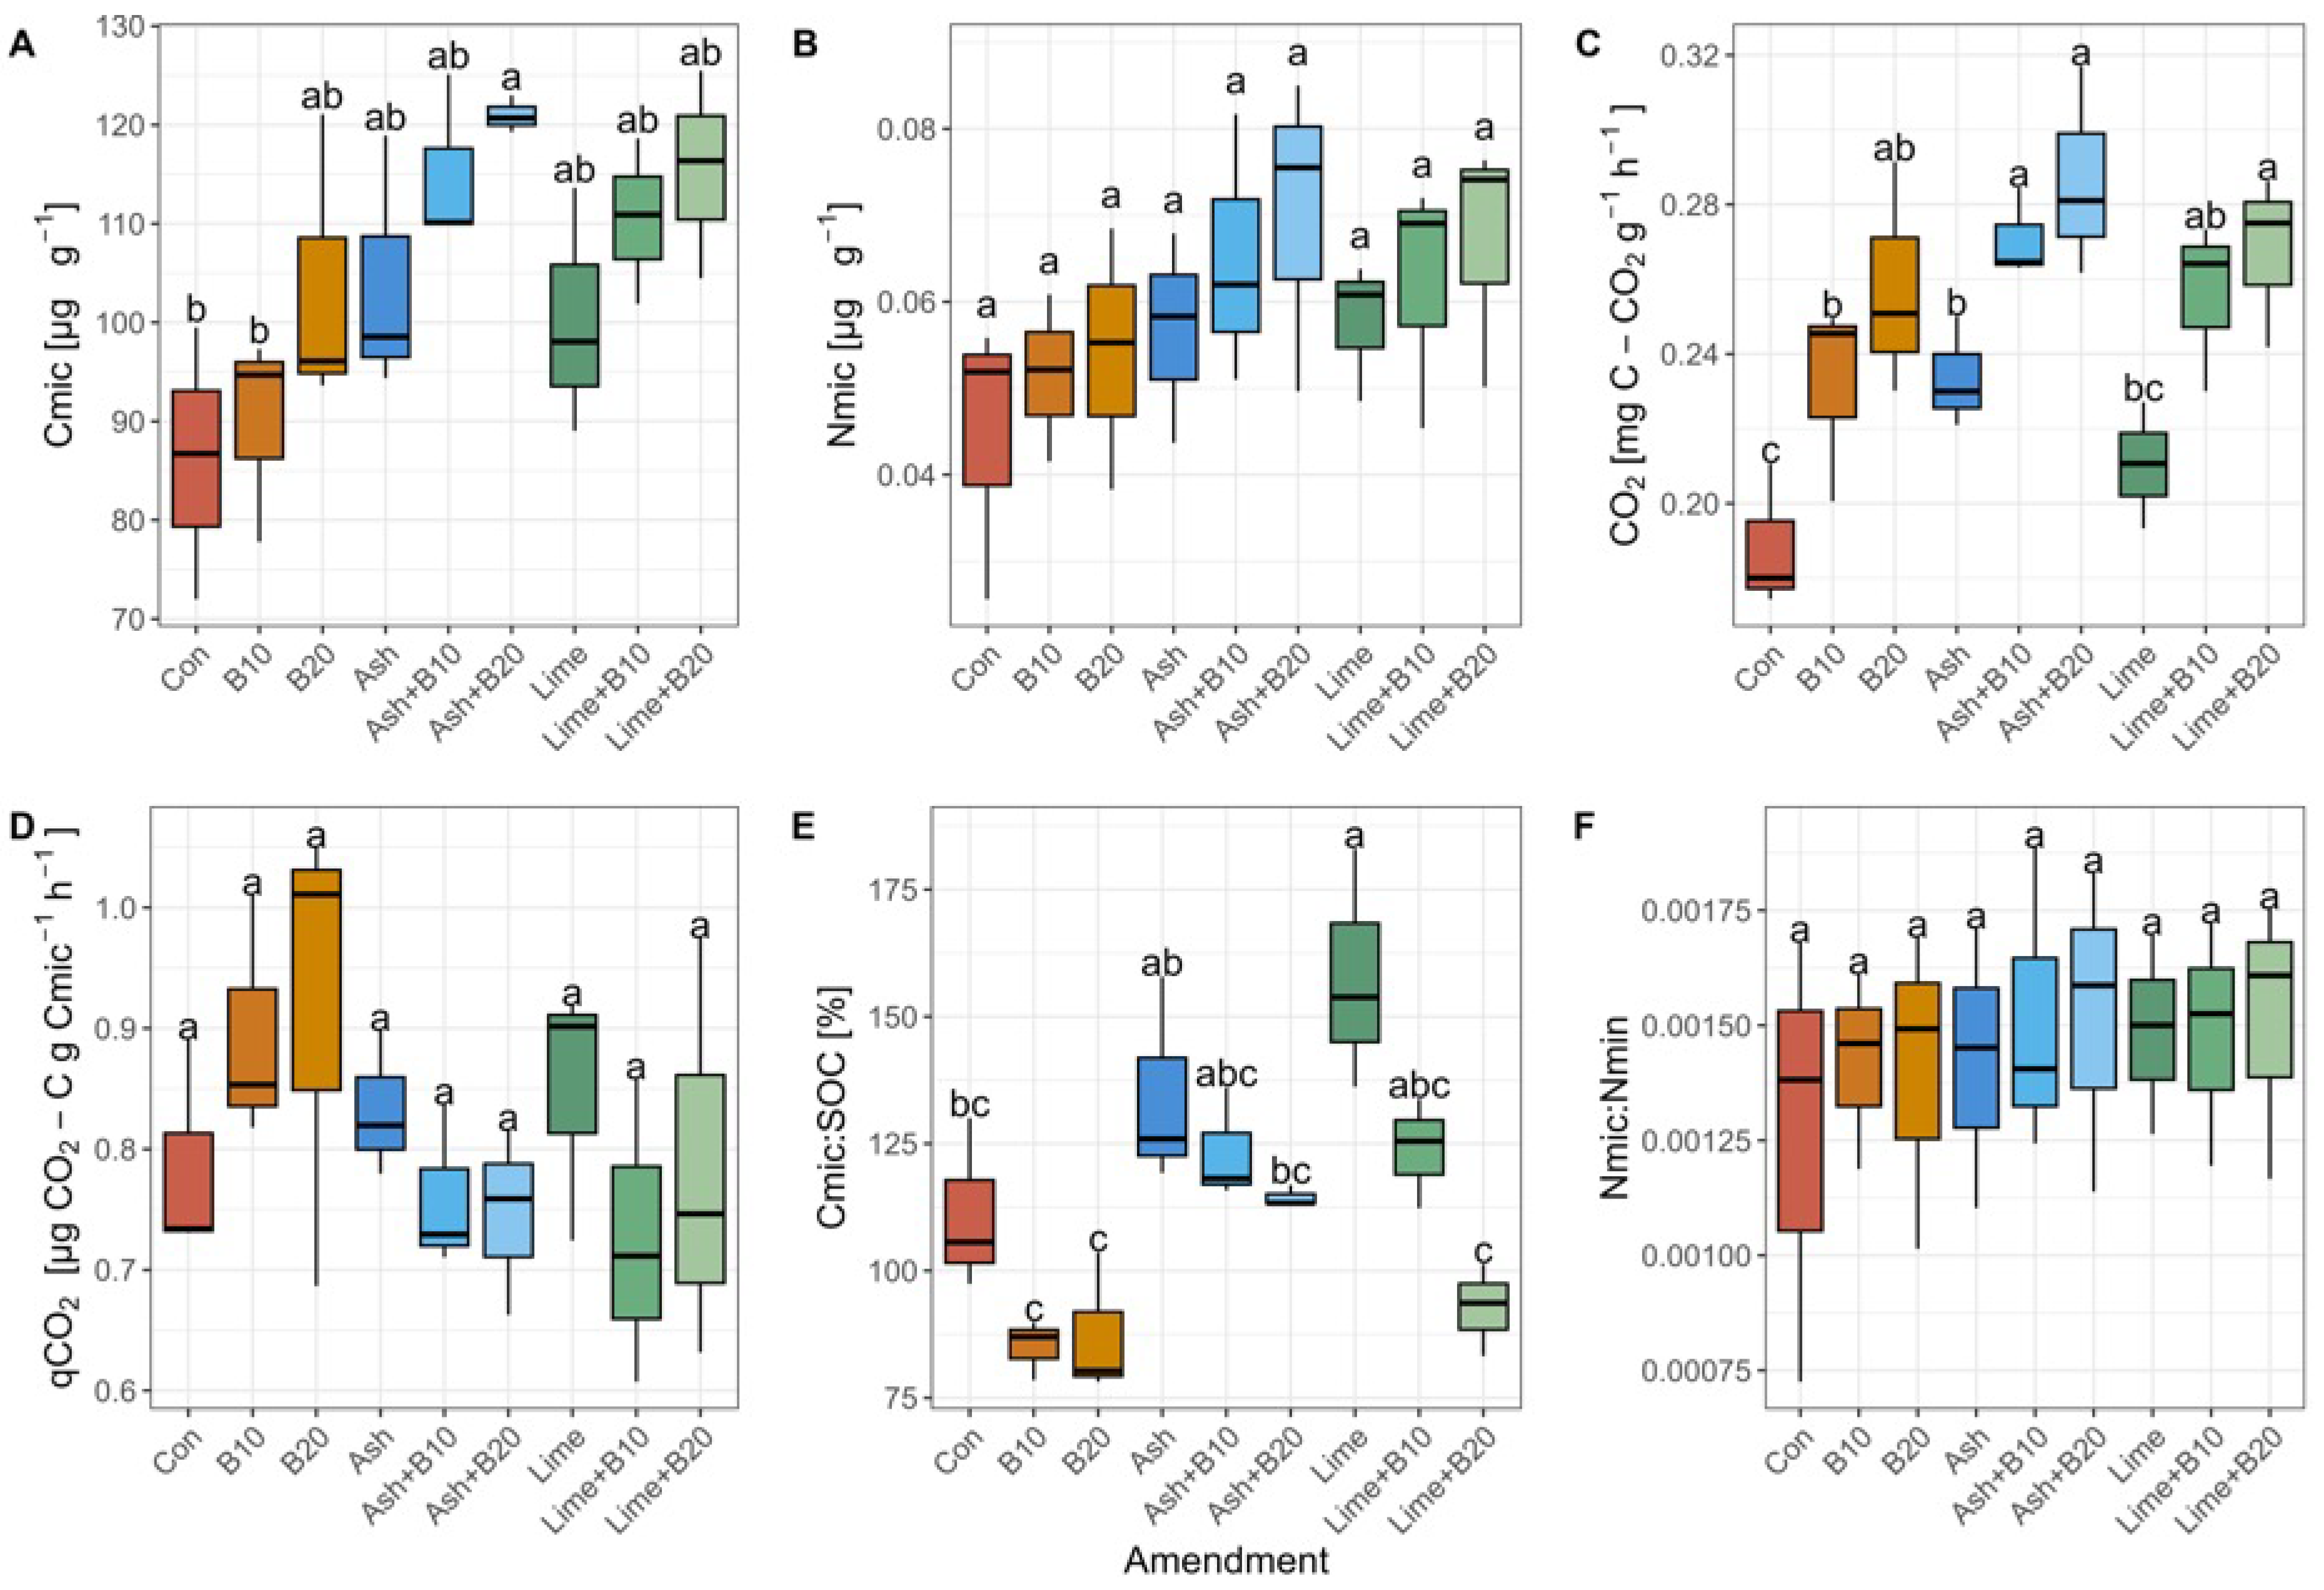
3.3. Microbial Biomass Carbon and Nitrogen, CO2 Emissions, and Metabolic Quotient

The amended soils showed higher microbial biomass carbon (Cmic) contents than the control. However, only combined ash and biochar (Ash + B20) significantly increased the Cmic compared with the control soil (Figure 3A). Relative to the unamended control, the average proportion of Cmic on the SOC (Cmic:SOC) was lower in the biochar-amended soil. Soils treated with lime and ash showed the highest Cmic:SOC (Figure 3E). Microbial biomass N (Nmic) and the proportion of Nmic on mineral N (Nmic:Nmin) were not significant but were comparably higher in soils treated with combined biochar and ash (Figure 3B,F). The cumulative CO2 emissions increased significantly with the increasing biochar rate; thus the 0.25% (B10) and 0.5% (B20) w/w biochar treatments recorded 0.23 and 0.26 mg C-CO2 g−1 soil, respectively, compared with the unamended control with a total CO2 of 0.18 mg C-CO2 g−1 soil. Relatively higher CO2 emissions were observed in the combined ash or CaCO3 and biochar-treated soils (Figure 3C). Total CO2 emissions were higher in soils that received ash than in the CaCO3-treated soils. In soils amended with combined biochar and ash or lime, a slight decrease in the metabolic quotient (qCO2) was shown; however, it was not significantly different from the control (Figure 3D).

3.4. Activities of Soil’s Extracellular Enzymes

The overall activities of the selected extracellular enzymes involved in C and N cycling increased significantly with combined biochar and ash treatment relative to the control (Figure 4). Activities of β-glu and β-cello were the highest (Figure 4A,B), accounting for 56% of the total extracellular enzyme activities, while β-Xyl activity was the lowest and was not influenced by the applied treatments (Figure 4C). Arg-amino and Tyr-amino increased in the biochar-amended soil and were marginally influenced by an increased soil pH (Figure 4D,E). The ash plus biochar increased the activities of β-glu and β-cello relative to the biochar-CaCO3 treated soil (Figure 4A,B). Higher N-acet activity was observed in soil that received sole biochar addition compared with the control (Figure 4F). Generally, liming the soil with ash slightly stimulated the enzyme’s activities compared with when CaCO3 was added (Figure 4).

3.5. Soil Carbon and Nutrient Composition

Biochar addition at 0.25% w/w (+81%) and 0.50 w/w (+114%) significantly increased the total C content compared with the control. However, the sole additions of ash and CaCO3 did not increase the total soil C than the control soil. Only Ash + B20 increased the total soil P compared with the control, whereas all of the other treatments remained unaffected. Furthermore, all of the amendments did not significantly increase the soil total N more than the control. The sole ash-treated soil had a relatively higher K concentration than the CaCO3-treated soils. The combination of ash with 0.50 w/w and 0.25% w/w biochar resulted in the highest K concentrations of 0.87 g kg−1 and 0.95 g kg−1, respectively (Table 2). Similarly, soils that received ash or CaCO3 showed higher Ca concentrations than the control. The total Fe and Al concentrations in the soil slightly increased in the biochar and ash-treated soil, but these were not significantly different from the control.

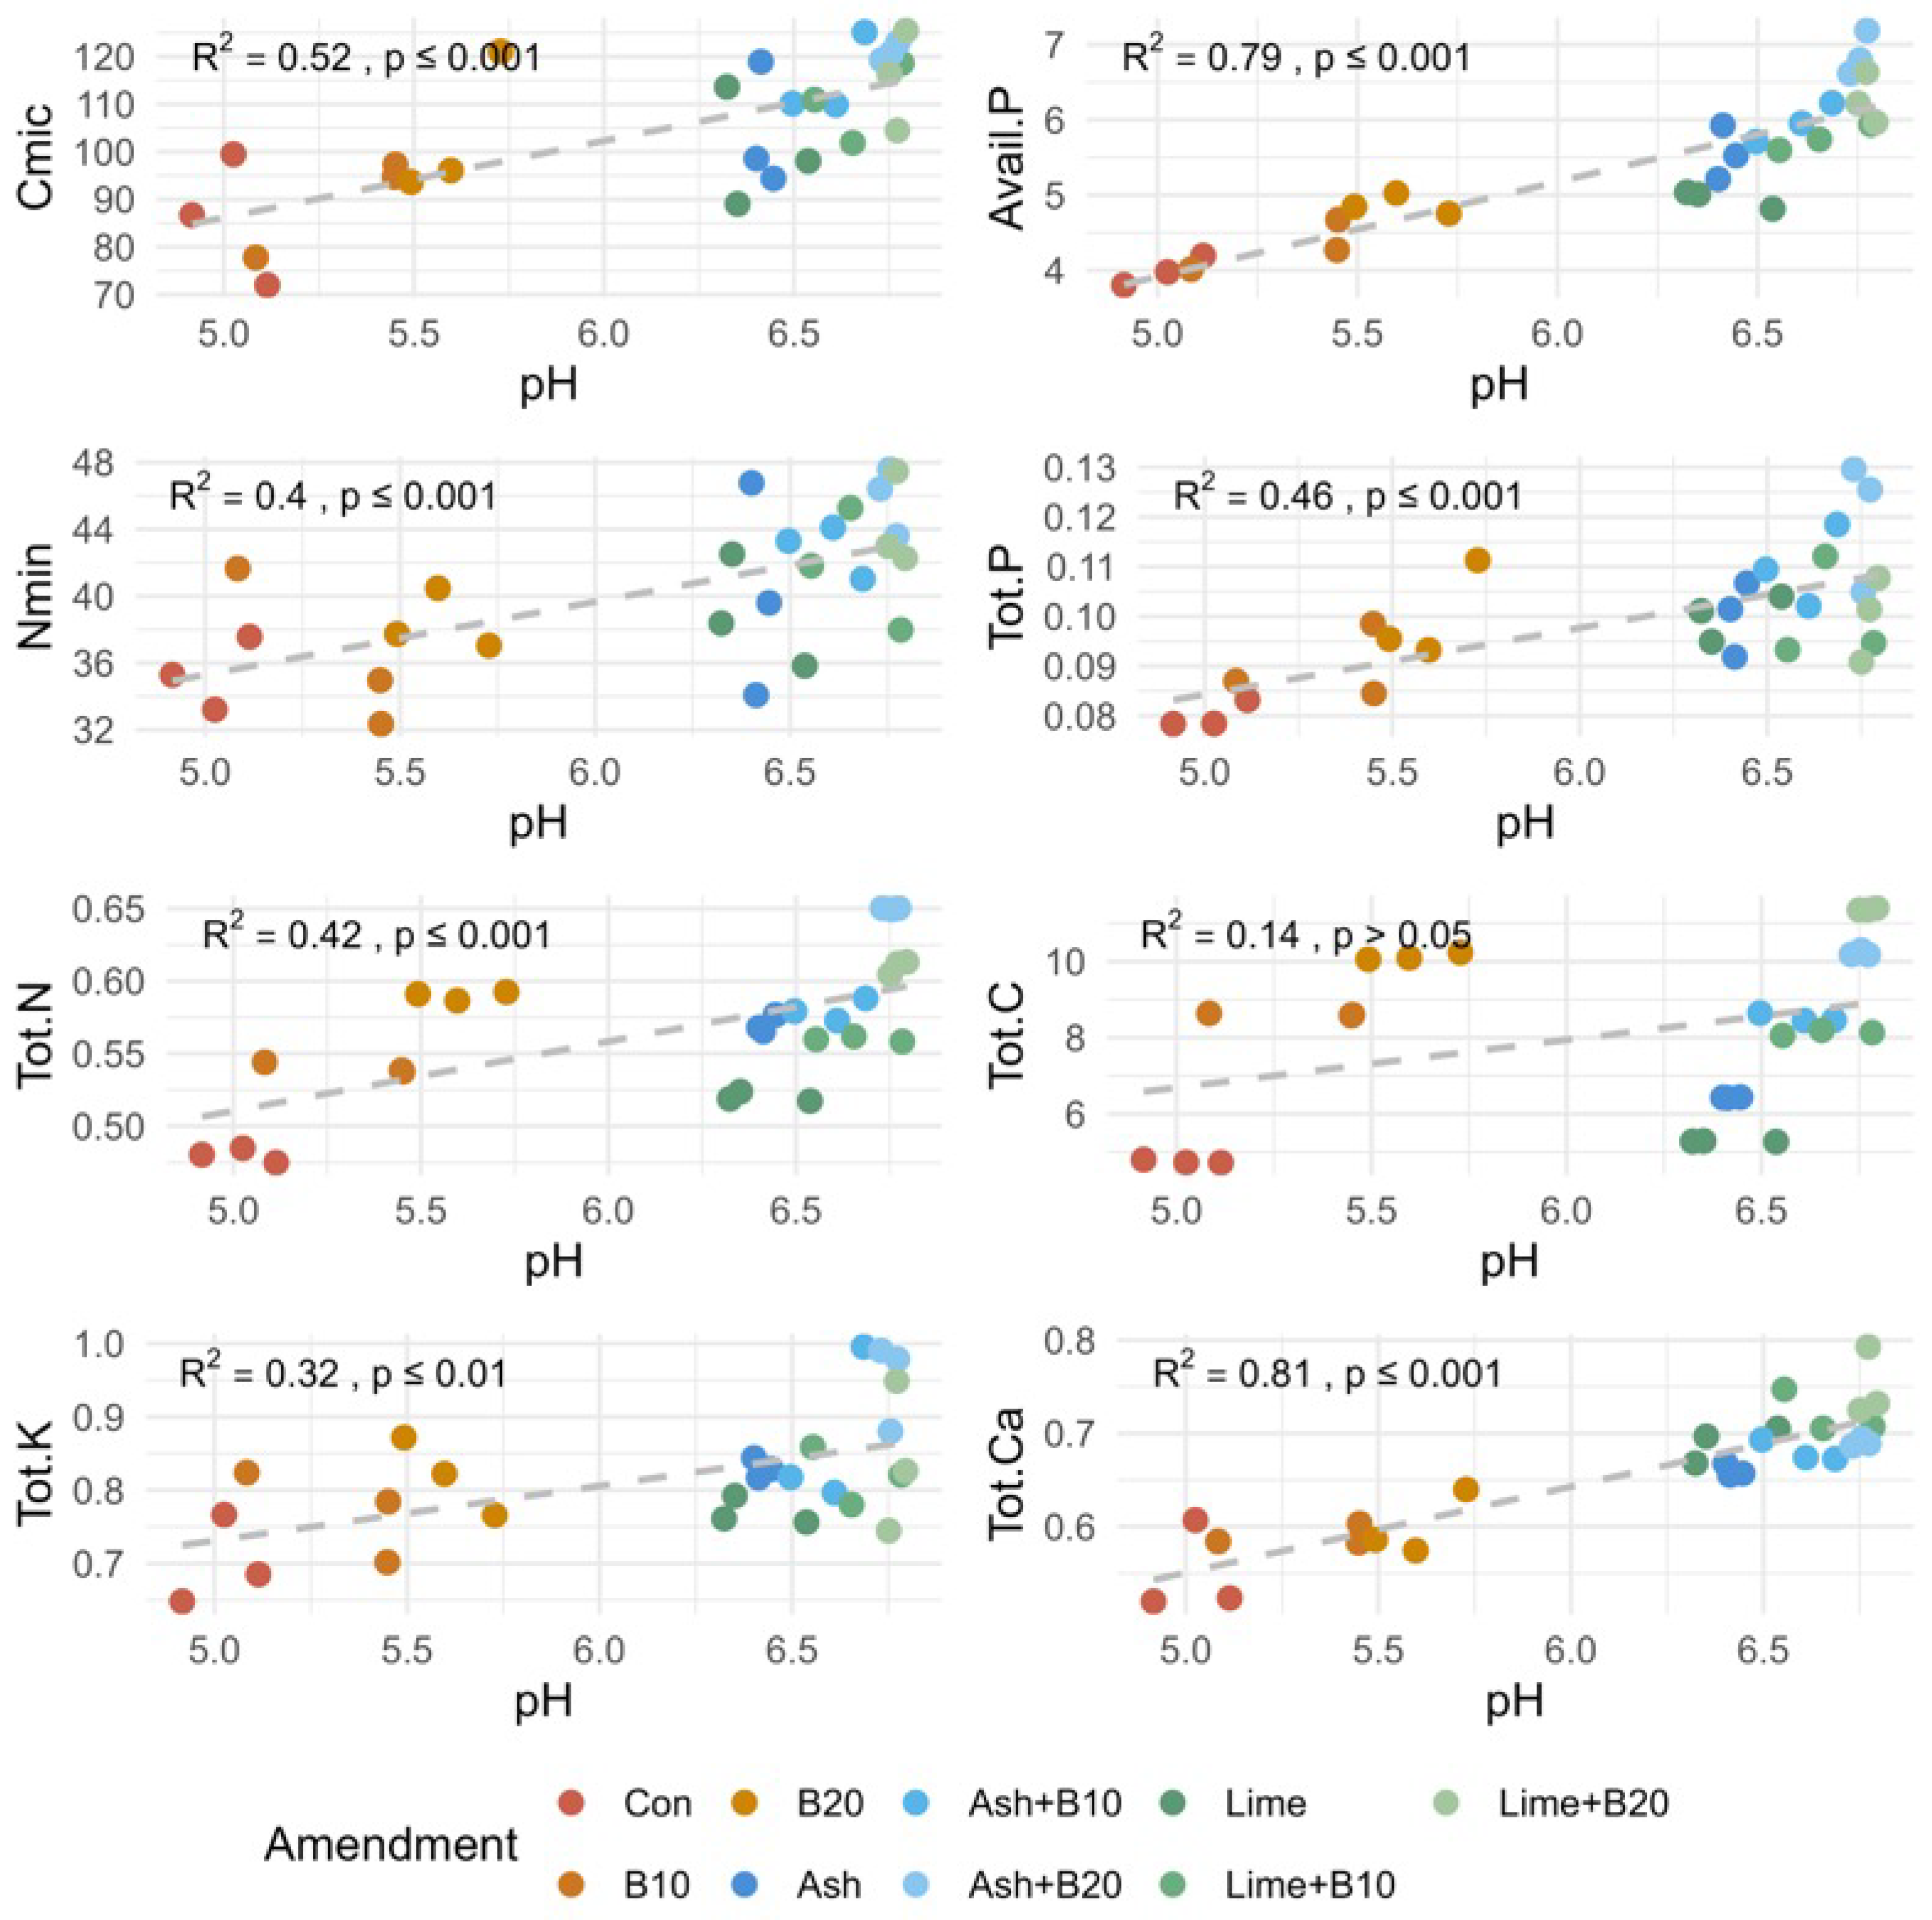
3.6. Principal Component (PCA) and Correlation Analysis

The PCA reduced the variability of the measured parameter to three factors that explained about 76% of the total variance (Figure 5). Soil pH showed the highest eigenvalue of 9.5, followed by available P (2.9), mineral N (1.2), and CO2 emissions (1.1), respectively, whereas all the other parameters had eigenvalues < 1. The first component (PC1, 53%) was positively associated with the pH, mineral P, total N, β-glu, and CO2 emissions. The factor loading of PC 2 (16%) was dominated by SOC, β-cello, and N-acet activity and had the largest negative association with Cmic:SOC and Cmic. Enzyme activities of Arg-amino and Tyr-amino positively dominated the third component (PC3, 6.5%) and had the highest negative association with Cmic and SOC. The soils treated with combined ash or lime and biochar clustered along the first factors, indicating a stronger association with an increased soil parameter.
The strong influence of soil pH was further supported by the Pearson correlation analysis (Figure 6). The clustering of soil samples treated with ash and lime indicates that the increased pH was associated with greater nutrient availability and enhanced microbial biomass production. However, the sole addition of biochar without co-application was clustered along the control at the lower soil pH range.

4. Discussion

4.1. Amelioration of Soil Acidity

The soil pH was measured to assess the amendment’s capacity to neutralize acidity, a primary barrier to nutrient availability and crop productivity in tropical soils. The Ash + B20 treatment increased the pH from 4.8 to 6.7 (40%), outperforming Lime + B20 (6.7) and the sole biochar at B20 (pH 5.5, 14.6% increase). KSA’s superior liming effect stems from its high calcium carbonate equivalent (70%) and additional oxides (Mg, K, P), which enhance cation exchange compared with CaCO3’s primarily Ca-based liming (Table 1). In Petroplinthic Cambisols with high Fe concentrations, redox reactions of Fe3+ release H+, contributing strongly to soil acidity [38]. The dissolution of carbonates of Ca and Mg contained in the ash and lime might have reacted with H+ to release HCO3−, leading to a rise in the soil pH [39]. Sole biochar at 0.25% w/w (B10) showed no pH change, indicating that biochar’s liming potential is dose-dependent and less effective alone at low rates (Figure 6). This finding is in accordance with Frimpong et al. [24], who reported that corncob biochar’s effect on the pH of tropical soil increased with an increasing application rate. The synergy in Ash + B20 likely results from biochar’s porous structure stabilizing the KSA’s mineral inputs, reducing the H+ and Al3+ activities more effectively than CaCO3 or biochar alone. This pH improvement is central to the study’s goal of alleviating soil acidity as it mitigates Fe3+ and Al3+ toxicity, enabling nutrient release for plant uptake.

4.2. Bioavailability of Phosphorus and Nitrogen

The low soil P content observed with the sole biochar applications (0.25% and 0.5% w/w, equivalent to 10 and 20 t ha⁻1) reflects the inherently low P content of corncob-derived biochar, consistent with findings that plant-derived biochar typically requires application rates above 50 t ha⁻1 to enhance the soil P significantly [40]. In contrast, the combined biochar and ash treatment resulted in the highest available P, likely due to the direct P contribution from ash (9.28 g P kg⁻1) and its synergistic effects with biochar. Unlike biochar alone, ash increased the soil pH by 1.4 units, reducing the P fixation by trivalent iron (Fe3+) and aluminum (Al3+) oxides, which is a common limitation in acidic soils where dihydrogen phosphate (H2PO4⁻) precipitates with Fe3+ [38]. This pH-dependent mechanism was evident in the strong correlation (R2 = 0.90, p < 0.05) between P availability and soil pH in the ash-amended soils, supporting findings by Antoniadis et al. [41] and Mkhonza et al. [42] on reduced Fe-P and Al-P precipitation in limed acidic soils. Comparing the amendments, ash outperformed biochar alone due to its higher P content and liming effect, while biochar’s liming ability and cation exchange capacity (CEC) improvement [18] contributed modestly to P availability. The combined treatment’s superior performance suggests a complementary interaction, where ash provides P and pH correction, and biochar enhances CEC, reducing the P sorption to Al and Fe oxides. These findings highlight the combined amendment’s potential to address P deficiency more effectively than individual applications in acidic soils.
The combined biochar and ash treatment also significantly increased the plant-available N, as indicated by higher mineral N (Nmin) and microbial biomass N (Nmic) compared with the control and individual amendments. The ash contributed substantial nutrients (217.57 g Ca kg⁻1, 97.21 g K kg⁻1, 24.87 g Mg kg⁻1, 9.28 g P kg⁻1), reducing nutrient deficiencies and stimulating microbial N mineralization, as evidenced by a higher Nmic:Nmin ratio in the combined treatment. The pH increase by combined ash and biochar created optimal conditions for chemoautotrophic bacteria involved in ammonification and nitrification [43], further enhancing N availability. The lone application of biochar had a limited effect on N mineralization due to its lower nutrient content, while ash alone was less effective than the combined treatment, likely due to the absence of biochar’s organic carbon, which supports microbial activity. The combined amendment’s ability to improve substrate quality and microbial efficiency underscores its advantage over single amendments, as supported by Bang-Andreasen et al. [43], who noted enhanced N cycling with ash additions.

4.3. Microbial Biomass Carbon and CO2 Emissions

The biochar and ash mixture (B20 + Ash) synergistically improved the soil’s substrate quality and nutrient availability, which significantly influenced the microbial biomass contents (Cmic) relative to the control soils (Figure 3A). This increase was attributed to improved substrate quality and nutrient availability, which are essential for microbial proliferation. Unlike biochar alone, which primarily increased the SOC through recalcitrant carbon inputs, the B20 + Ash treatment provided labile carbon and nutrients, fostering microbial growth. The low labile C fraction of biochar for microbial growth was verified when Cmic was normalized to the SOC (Cmic:SOC), showing a lower ratio compared with the control (Figure 3E), reflecting biochar’s limited labile carbon availability for microbes due to its recalcitrant nature [44]. In contrast, the ash and CaCO3 amendments elevated the Cmic:SOC ratio by raising the soil pH, creating a more favorable environment for microbial activity. This pH-driven shift likely favored neutrophilic microbial communities, as supported by Grover et al. [45], who reported a strong correlation between the soil pH and microbial biomass in slightly acidic to neutral conditions.
The biochar application increased the total CO2 emissions, depicting biochar’s ability to stimulate microbial activity, probably from temporary hikes in labile C degradation, especially during the initial stages of incubation [46]. The ash and CaCO3 improved soil pH conditions for microbial degradation of SOM, which subsequently led to increased CO2 emissions (Figure 6). Comparing the effect of adding liming material alone with its combined application with biochar, we found a higher respiration rate when ash was combined with biochar, particularly at 0.5% w/w (Figure 5). The principal component analysis (Figure 5) indicated that this relatively higher emission mainly resulted from the liming effect and greater nutrient supply from the co-combined ash and biochar, which would have promoted a higher C mineralization than in the sole ash or biochar treatment. The improved soil pH and supplement nutrients in the combined treated soils consequently lowered the metabolic quotient (qCO2), indicating reduced microbial stress and higher C-use efficiency [46]. These findings support previous observations by Oladele et al. [47], where when ash-rich biochar was added to tropical acidic soil, the qCO2 was reduced, corresponding to improved soil fertility conditions.

4.4. Extracellular Enzyme Activities

The addition of cellulose-rich corncob biochar increased β-glucosidase (β-glu) and cellobiosidase (β-cello) activities by 10–15% in amended soils compared with non-amended controls. This enhancement can be attributed to higher C substrate availability, as polysaccharides in biochar are depolymerized into cellobiose by β-cello and subsequently cleaved into glucose by β-glu [48]. A similar finding was demonstrated in degraded Alfisols and Vertisols, citing increased C-cycle activities with an increasing cellulose concentration in the soil [49].
Biochar-ash co-application showed a more pronounced effect on N-cycling enzymes, such as N-acetyl-β-D-glucosaminidase (N-acet), with a 20% increase in activity compared with biochar alone. This suggests that ash, by raising the soil pH from 5.01 to 6.40, created a more favorable environment for N-acet, which converts chitin to amines, enhancing N mineralization in N-limited soils [50]. These findings highlight biochar and ash’s complementary roles; biochar primarily boosts C-cycling enzymes, while ash enhances N-cycling through pH optimization. Changes in the soil pH had a limited influence on the β-glu and β-cello activities, likely due to their broad pH tolerance (4.5–7.0) [51]. However, the ash-induced pH increased significantly, which correlated to elevated arginine-aminopeptidase (Arg-amino) and tyrosine-aminopeptidase (Tyr-amino) activities, which were 15% higher in the biochar-ash treatments than in the biochar-only or control soils. The principal component analysis (PCA) confirmed a positive correlation between the soil organic carbon (SOC) and the N-cycling enzymes, explaining the 15% increase in mineral N in the biochar-ash amended soils. This suggests the microbial-mediated mining of N through the increased production of N-related enzymes using carbon as an energy source, corroborating the reduced Cmic:SOC and relatively higher qCO2 in the biochar-amended soils. The result supports the previous study showing a significant increase in N-cycling microbial community and enzyme activities of weathered soil amended with biochar [52]. Compared with CaCO3 liming, which primarily enhances N mineralization through pH changes [53], biochar-ash co-application uniquely couples C substrate provision with pH improvements, an integrated strategy for restoring nutrient cycling in acidic soils.

4.5. Treatment Effect on Total Carbon and Nutrient Concentration

The corncob-derived biochar used in our study contained 84% of C per weight after pyrolysis at a temperature between 350 and 550 °C. Adding this high-C biochar resulted in a significant SOC increase compared with the control soil. According to Lehmann and Joseph [18], biochar can increase both the active carbon pool (weeks to months of turnover time) and the passive C pool (several years of turnover time), depending on the soil type. The impact of active C inputs by biochar was indicated in our short-term study by the increased microbial activities corresponding to higher CO2 emissions compared with soils without biochar treatment. The co-application (Ash + B20) increased the total C more than the individual treatments, likely due to the combined effect of biochar’s organic C and ash’s inorganic C inputs, highlighting the advantage of integrated amendments for carbon sequestration. This finding corroborates Zhao et al. [54], who reported a 12% increase in soil carbon following lime application to weathered soil. The lack of significant effects on the total soil N was attributed to the low N in the plant feedstock, unlike biochar produced from N-rich feedstock such as animal sources. In contrast, the total P significantly increased in the Ash + B20-treated soils due to the combined P inputs from ash (9.28 g kg⁻1 P) and biochar (1.63 g kg⁻1 P). This finding aligns with the studies of Wang et al. [55] and Asirifi et al. [56], who reported increased total P in acidic soil following amendment with ash-rich biochar.
Calcium and potassium are primary plant nutrients in pyrolyzed (biochar) and burned (ash) plant biomass. This was demonstrated by the 9.56 g kg−1 K and 9.32 g kg−1 Ca contained in the biochar and concentrations of 97.21 g kg−1 K and 217.57 g kg−1 Ca in the ash, respectively (Table 1). The direct influence of these amendment products, particularly in the co-applied (Ash + B20) treated soil, explains the significant concentration of total K and Ca in the amended soils compared with the control. With a similar treatment addition to weathered red acidic soil, Paramisparam et al. [57] further discussed the benefits of biochar-ash co-application on the availability of K and Ca than when each was applied alone in a field study. Thus, biochar’s active surface area and porous structure reduce water-soluble K mobility and provide exchangeable sites for enhanced K sorption capacity. The minimal Al and Fe content of the biochar and ash clarifies the insignificant difference in total Al and Fe between the control and amended soil. Neina et al. [14], after characterizing 80 samples of KSA from different households, similarly reported low concentrations of Al, Fe, and other trace elements. Although the soil total Fe and Al were not impacted by the ash and biochar applications, several studies have discussed reduced Al and Fe bioavailable forms after these liming materials improved the pH of acidic soil [58].

5. Conclusions

The study demonstrated that the co-application of biochar with kitchen stove ash can enhance resource use efficiency and the fertility of tropical acidic soil. The mineral nitrogen and phosphorus contents were pH-dependent and showed higher values in the ash and CaCO3-treated soil. Except for the SOC and basal respiration, which were increased by increasing the labile C supply, application at 10 t ha−1 (0.25% w/w) had no significant effect on the measured soil fertility attributes. Even with the addition of 20 t ha−1 (0.5% w/w) of sole biochar, the soil pH increased slightly compared with the unnamed control. However, combining biochar with liming materials (kitchen stove ash and CaCO3) significantly reduced the soil’s acidity and increased the nutrient contents (N and P) and microbial functions. Moreover, the mineral-rich kitchen ash in combination with 0.5% (w/w) biochar supplied the highest amount of essential nutrients and labile C, leading to enhanced respiration and microbial biomass carbon and nitrogen in the weathered acidic soil. Similarly, extracellular enzymes responsible for C and N cycling were more active in the Ash + B20-treated soil than in the other amended and control soils. We conclude that soil fertility in acidic tropical soils can be improved and economically managed by using kitchen waste ash to supplement biochar application in acidic soils under agriculture use. However, long-term field studies are proposed to examine the longevity and sustainability of the observed effects on nutrient uptake and crop yield. In addition, potentially toxic element contamination would need to be examined and monitored more relevantly if the ash is obtained from the uncontrolled burning of waste materials.

Author Contributions

Conceptualization, I.A., S.H. and B.M.; Data curation, I.A., M.H. and L.M.; Formal analysis, I.A. and M.H.; Funding acquisition, I.A. and B.M.; Investigation, I.A. and L.M.; Methodology, I.A., L.M., S.H. and B.M.; Project administration, I.A., K.A.F. and B.M.; Resources, I.A., M.H., S.H. and B.M.; Supervision, K.A.F. and B.M.; Validation, I.A., M.H. and B.M.; Visualization, I.A. and M.H.; Writing—original draft, I.A. and S.H.; Writing—review and editing, I.A., M.H., L.M., S.H., S.W., K.A.F., R.P. and B.M. All authors have read and agreed to the published version of the manuscript.

Funding

This research was funded by the German Academic Exchange Service, grant number 91693279, and the APC was funded by Ruhr-Universität Bochum Research School.

Institutional Review Board Statement

Not applicable.

Informed Consent Statement

Not applicable.

Data Availability Statement

The original contributions presented in this study are included in the article. Further inquiries can be directed to the corresponding author.

Acknowledgments

We thank the German Academic Exchange Services (DAAD) and Ruhr University Bochum, Germany, for their financial support. The authors would like to acknowledge the infrastructural and technical support provided by Heidrun Kerkhoff, Sabine Frölich, and Katja Gonschorek at the Physical Geography Laboratory of Ruhr-Universität Bochum.

Conflicts of Interest

The authors declare no conflicts of interest.

References

  1. Takow, J.A.; Doumbia, M.D.; Hossner, L.R. Acid soil profiles of the semiarid and subhumid tropics in Central and West Africa. In Plant-Soil Interactions at Low pH; Wright, R.J., Baligar, V.C., Murrmann, R.P., Eds.; Springer: Dordrecht, The Netherlands, 1991; pp. 313–320. ISBN 978-94-010-5520-8. [Google Scholar]
  2. Sanchez, P.A. Properties and Management of Soils in the Tropics, 2nd ed.; Cambridge University Press: Cambridge, UK, 2019; ISBN 9781316809785. [Google Scholar]
  3. Sanchez, P.A. Soil fertility and hunger in Africa. Science 2002, 295, 2019–2020. [Google Scholar] [CrossRef]
  4. Obiri-Nyarko, F. Ameliorating soil acidity in Ghana: A concise review of approaches. ARPN J. Sci. Technol. 2012, 2, 1–9. [Google Scholar]
  5. Tully, K.; Sullivan, C.; Weil, R.; Sanchez, P. The State of Soil Degradation in Sub-Saharan Africa: Baselines, Trajectories, and Solutions. Sustainability 2015, 7, 6523–6552. [Google Scholar] [CrossRef]
  6. Buri, M.M.; Issaka, R.N.; Wakatsuki, T. Extent and Management of Low pH Soils in Ghana. J. Soil Sci. Plant Nutr. 2005, 51, 755–759. [Google Scholar] [CrossRef]
  7. Gupta, A.K.; Maheshwari, A.; Khanam, R. Assessment of phosphorus fixing capacity in different soil orders of India. J. Plant Nutr. 2020, 43, 2395–2401. [Google Scholar] [CrossRef]
  8. Fageria, N.K.; Nascente, A.S. Management of Soil Acidity of South American Soils for Sustainable Crop Production. In Management of Soil Acidity of South American Soils for Sustainable Crop Production; Fageria, N.K., Nascente, A.S., Eds.; Elsevier: Amsterdam, The Netherlands, 2014; pp. 221–275. ISBN 9780128021392. [Google Scholar]
  9. Goulding, K.W.T. Soil acidification and the importance of liming agricultural soils with particular reference to the United Kingdom. Soil Use Manage. 2016, 32, 390–399. [Google Scholar] [CrossRef]
  10. Holland, J.E.; White, P.J.; Glendining, M.J.; Goulding, K.W.T.; McGrath, S.P. Yield responses of arable crops to liming—An evaluation of relationships between yields and soil pH from a long-term liming experiment. Eur. J. Agron. 2019, 105, 176–188. [Google Scholar] [CrossRef]
  11. Buni, A. Effects of Liming Acidic Soils on Improving Soil Properties and Yield of Haricot Bean. J. Environ. Anal. Toxicol 2014, 5, 1. [Google Scholar] [CrossRef]
  12. Vassilev, S.V.; Baxter, D.; Vassileva, C.G. An overview of the behaviour of biomass during combustion: Part II. Ash fusion and ash formation mechanisms of biomass types. Fuel 2014, 117, 152–183. [Google Scholar] [CrossRef]
  13. Cerutti, P.O.; Sola, P.; Chenevoy, A.; Iiyama, M.; Yila, J.; Zhou, W.; Djoudi, H.; Atyi, R.E.; Gautier, D.J.; Gumbo, D.; et al. The socioeconomic and environmental impacts of wood energy value chains in Sub-Saharan Africa: A systematic map protocol. Environ. Evid. 2015, 4, 12. [Google Scholar] [CrossRef]
  14. Neina, D.; Faust, S.; Joergensen, R.G. Characterization of charcoal and firewood ash for use in African peri-urban agriculture. Chem. Biol. Technol. Agric. 2020, 7, 5. [Google Scholar] [CrossRef]
  15. Symanowicz, B.; Becher, M.; Jaremko, D.; Skwarek, K. Possibilities for the Use of Wood Ashes in Agriculture. J. Ecol. Eng. 2018, 19, 191–196. [Google Scholar] [CrossRef] [PubMed]
  16. Onwuka, M.I.; Osodeke, V.E. Effects of agricultural wastes ash on nutrients concentration and yield of maize (Zea mays L.) in Haplic Acrisol of Southeastern Nigeria. Agro-Sci. 2015, 11, 1–11. [Google Scholar] [CrossRef]
  17. Bougnom, B.P.; Mair, J.; Etoa, F.X.; Insam, H. Composts with wood ash addition: A risk or a chance for ameliorating acid tropical soils? Geoderma 2009, 153, 402–407. [Google Scholar] [CrossRef]
  18. Lehmann, J.; Joseph, S. Biochar for Environmental Management; Routledge: Oxfordshire, UK, 2015; ISBN 9780203762264. [Google Scholar]
  19. Joseph, S.; Cowie, A.L.; van Zwieten, L.; Bolan, N.; Budai, A.; Buss, W.; Cayuela, M.L.; Graber, E.R.; Ippolito, J.A.; Kuzyakov, Y.; et al. How biochar works, and when it doesn’t: A review of mechanisms controlling soil and plant responses to biochar. GCB Bioenergy 2021, 13, 1731–1764. [Google Scholar] [CrossRef]
  20. Amoakwah, E.; Rahman, M.A.; Islam, K.R.; Frimpong, K.A.; Phares, C.A.; Sackey, L.; Asirifi, I.; Arthur, E. Increased humic materials explain aggregate-protected carbon and nitrogen accumulation in biochar-amended tropical soils. Pedosphere 2024, 34, 1086–1099. [Google Scholar] [CrossRef]
  21. Jeffery, S.; Abalos, D.; Prodana, M.; Bastos, A.C.; van Groenigen, J.W.; Hungate, B.A.; Verheijen, F. Biochar boosts tropical but not temperate crop yields. Environ. Res. Lett. 2017, 12, 53001. [Google Scholar] [CrossRef]
  22. Yeboah, E.; Asamoah, G.; Kofi, B.; Abunyewa, A.A. Effect of Biochar Type and Rate of Application on Maize Yield Indices and Water Use Efficiency on an Ultisol in Ghana. Energy Procedia 2016, 93, 14–18. [Google Scholar] [CrossRef]
  23. Steiner, C.; Bellwood-Howard, I.; Häring, V.; Tonkudor, K.; Addai, F.; Atiah, K.; Abubakari, A.H.; Kranjac-Berisavljevic, G.; Marschner, B.; Buerkert, A. Participatory trials of on-farm biochar production and use in Tamale, Ghana. Agron. Sustain. Dev. 2018, 38, 12. [Google Scholar] [CrossRef]
  24. Frimpong, K.A.; Phares, C.A.; Boateng, I.; Abban-Baidoo, E.; Apuri, L. One-time application of biochar influenced crop yield across three cropping cycles on tropical sandy loam soil in Ghana. Heliyon 2021, 7, e06267. [Google Scholar] [CrossRef]
  25. Galinato, S.P.; Yoder, J.K.; Granatstein, D. The economic value of biochar in crop production and carbon sequestration. Energy Policy 2011, 39, 6344–6350. [Google Scholar] [CrossRef]
  26. WRB (World reference base for soil resources 2014). International Soil Classification System for Naming Soils and Creating Legends for Soil Maps; Food and Agriculture Organization: Rome, Italy, 2014; ISBN 978-92-5-108369-7. [Google Scholar]
  27. Shoemaker, H.E.; McLean, E.O.; Pratt, P.F. Buffer Methods for Determining Lime Requirement of Soils With Appreciable Amounts of Extractable Aluminum. Soil Sci. Soc. Am. J. 1961, 25, 274–277. [Google Scholar] [CrossRef]
  28. Ziadi, N.; Sen Tran, T. Lime requirement. In Soil Sampling and Methods of Analysis Carter, 2nd ed.; Martin, R., Gregorich, E.G., Eds.; CRC Press: Boca Raton, FL, USA; Taylor & Francis: London, UK, 2008; ISBN 9780849335860. [Google Scholar]
  29. Erich, M.S.; Ohno, T. Titrimetric determination of calcium carbonate equivalence of wood ash. Analyst 1992, 117, 993. [Google Scholar] [CrossRef]
  30. Horváth, B.; Opara-Nadi, O.; Beese, F. A Simple Method for Measuring the Carbonate Content of Soils. Soil Sci. Soc. Am. J. 2005, 69, 1066–1068. [Google Scholar] [CrossRef]
  31. Vance, E.D.; Brookes, P.C.; Jenkinson, D.S. An extraction method for measuring soil microbial biomass C. Soil Biol. Biochem. 1987, 19, 703–707. [Google Scholar] [CrossRef]
  32. Joergensen, R.G.; Mueller, T. The fumigation-extraction method to estimate soil microbial biomass: Calibration of the kEN value. Soil Biol. Biochem. 1996, 28, 33–37. [Google Scholar] [CrossRef]
  33. Marx, M.-C.; Wood, M.; Jarvis, S. A microplate fluorimetric assay for the study of enzyme diversity in soils. Soil Biol. Biochem. 2001, 33, 1633–1640. [Google Scholar] [CrossRef]
  34. Bray, R.H.; Kurtz, L.T. Determination of total, organic, and available forms of phosphorus in soils. Soil Sci. 1945, 59, 39–46. [Google Scholar] [CrossRef]
  35. Murphy, J.; Riley, J.P. A modified single solution method for the determination of phosphate in natural waters. Anal. Chim. Acta 1962, 27, 31–36. [Google Scholar] [CrossRef]
  36. R Core Team. R: A Language and Environment for Statistical Computing, Version 4.3.1; R Foundation for Statistical Computing: Vienna, Austria, 2023.
  37. OriginLab Corporation. OriginPro, Version 2022b; OriginLab Corporation: Northampton, MA, USA, 2022. [Google Scholar]
  38. Blume, H.-P.; Brümmer, G.W.; Horn, R.; Kandeler, E.; Kögel-Knabner, I.; Kretzschmar, R.; Schad, P.; Stahr, K.; Wilke, B.-M. Scheffer/Schachtschabel Soil Science; Springer: Berlin, Heidelberg, 2016; ISBN 9783642309410. [Google Scholar]
  39. Briedis, C.; Sá, J.C.d.M.; Caires, E.F.; Navarro, J.d.F.; Inagaki, T.M.; Boer, A.; Ferreira, A.d.O.; Neto, C.Q.; Canalli, L.B.; dos Santos, J.B. Changes in Organic Matter Pools and Increases in Carbon Sequestration in Response to Surface Liming in an Oxisol under Long-Term No-Till. Soil Sci. Soc. Am. J. 2012, 76, 151–160. [Google Scholar] [CrossRef]
  40. Akanji, M.A.; Ahmad, M.; Al-Wabel, M.I.; Al-Farraj, A.S.F. Soil Phosphorus Fractionation and Bio-Availability in a Calcareous Soil as Affected by Conocarpus Waste Biochar and Its Acidified Derivative. Agriculture 2022, 12, 2157. [Google Scholar] [CrossRef]
  41. Antoniadis, V.; Hatzis, F.; Bachtsevanidis, D.; Koutroubas, S.D. Phosphorus Availability in Low-P and Acidic Soils as Affected by Liming and P Addition. Commun. Soil Sci. Plant Anal. 2015, 46, 1288–1298. [Google Scholar] [CrossRef]
  42. Mkhonza, N.P.; Buthelezi-Dube, N.N.; Muchaonyerwa, P. Effects of lime application on nitrogen and phosphorus availability in humic soils. Sci. Rep. 2020, 10, 8634. [Google Scholar] [CrossRef] [PubMed]
  43. Bang-Andreasen, T.; Nielsen, J.T.; Voriskova, J.; Heise, J.; Rønn, R.; Kjøller, R.; Hansen, H.C.B.; Jacobsen, C.S. Wood Ash Induced pH Changes Strongly Affect Soil Bacterial Numbers and Community Composition. Front. Microbiol. 2017, 8, 1400. [Google Scholar] [CrossRef]
  44. Asirifi, I.; Werner, S.; Heinze, S.; Saba, C.K.; Lawson, I.Y.; Marschner, B. Short-term effect of biochar on microbial biomass, respiration and enzymatic activities in wastewater irrigated soils in urban agroecosystems of the West African savannah. Agronomy 2021, 11, 271. [Google Scholar] [CrossRef]
  45. Grover, S.P.; Butterly, C.R.; Wang, X.; Gleeson, D.B.; Macdonald, L.M.; Tang, C. Liming and priming: The long-term impact of pH amelioration on mineralisation may negate carbon sequestration gains. Soil Secur. 2021, 3, 100007. [Google Scholar] [CrossRef]
  46. Shah, T.; Khan, S.; Shah, Z. Soil respiration, pH and EC as influenced by biochar. Soil Environ. 2017, 36, 77–83. [Google Scholar] [CrossRef]
  47. Oladele, S.; Adeyemo, A.; Adegaiye, A.; Awodun, M. Effects of biochar amendment and nitrogen fertilization on soil microbial biomass pools in an Alfisol under rain-fed rice cultivation. Biochar 2019, 1, 163–176. [Google Scholar] [CrossRef]
  48. Inamdar, A.; Sangawe, V.; Adhapure, N. Enzymes in rhizosphere engineering. In Rhizosphere Engineering; Elsevier Academic Press: Amsterdam, The Netherlands, 2022; ISBN 978-0-323-89973-4. [Google Scholar]
  49. Kaurin, A.; Cernilogar, Z.; Lestan, D. Revitalisation of metal-contaminated, EDTA-washed soil by addition of unpolluted soil, compost and biochar: Effects on soil enzyme activity, microbial community composition and abundance. Chemosphere 2018, 193, 726–736. [Google Scholar] [CrossRef]
  50. Lasota, J.; Babiak, T.; Błońska, E. C:N:P stoichiometry associated with biochar in forest soils at historical charcoal production sites in Poland. Geoderma Reg. 2022, 28, e00482. [Google Scholar] [CrossRef]
  51. Wade, J.; Li, C.; Vollbracht, K.; Hooper, D.G.; Wills, S.A.; Margenot, A.J. Prescribed pH for soil β-glucosidase and phosphomonoesterase do not reflect pH optima. Geoderma 2021, 401, 115161. [Google Scholar] [CrossRef]
  52. Wang, H.; Ren, T.; Müller, K.; van Zwieten, L.; Wang, H.; Feng, H.; Xu, C.; Yun, F.; Ji, X.; Yin, Q.; et al. Soil type regulates carbon and nitrogen stoichiometry and mineralization following biochar or nitrogen addition. Sci. Total. Environ. 2021, 753, 141645. [Google Scholar] [CrossRef] [PubMed]
  53. Ndabankulu, K.; Egbewale, S.O.; Tsvuura, Z.; Magadlela, A. Soil microbes and associated extracellular enzymes largely impact nutrient bioavailability in acidic and nutrient poor grassland ecosystem soils. Sci. Rep. 2022, 12, 12601. [Google Scholar] [CrossRef]
  54. Zhao, H.; Zhang, H.; Shar, A.G.; Liu, J.; Chen, Y.; Chu, S.; Tian, X. Enhancing organic and inorganic carbon sequestration in calcareous soil by the combination of wheat straw and wood ash and/or lime. PLoS ONE 2018, 13, e0205361. [Google Scholar] [CrossRef] [PubMed]
  55. Wang, T.; Camps-Arbestain, M.; Hedley, M. The fate of phosphorus of ash-rich biochars in a soil-plant system. Plant Soil 2014, 375, 61–74. [Google Scholar] [CrossRef]
  56. Asirifi, I.; Kaetzl, K.; Werner, S.; Heinze, S.; Abagale, F.K.; Wichern, M.; Marschner, B. Biochar for wastewater treatment and soil improvement in irrigated urban agriculture: Single and combined effects on crop yields and soil fertility. J. Soil Sci. Plant Nutr. 2023, 23, 1408–1420. [Google Scholar] [CrossRef]
  57. Paramisparam, P.; Ahmed, O.H.; Omar, L.; Ch’ng, H.Y.; Johan, P.D.; Hamidi, N.H. Co-Application of Charcoal and Wood Ash to Improve Potassium Availability in Tropical Mineral Acid Soils. Agronomy 2021, 11, 2081. [Google Scholar] [CrossRef]
  58. Hamidi, N.H.; Ahmed, O.H.; Omar, L.; Ch’Ng, H.Y. Combined Use of Charcoal, Sago Bark Ash, and Urea Mitigate Soil Acidity and Aluminium Toxicity. Agronomy 2021, 11, 1799. [Google Scholar] [CrossRef]
Figure 1. Effects of the single or combined application of biochar and ash or lime (CaCO3) on the soil pH. Letters indicate significant differences between treatments (ANOVA, p < 0.05) after post hoc analysis. Error bars denote the standard deviation of the mean (n = 3).
Soilsystems 09 00049 g001
Figure 2. Effects of the single or combined biochar and ash or lime (CaCO3) application on the soil mineral phosphorus (A) and nitrogen (B). Letters indicate significant differences between treatments (ANOVA, p < 0.05) after post hoc analysis. Error bars denote the standard deviation of the mean (n = 3).
Soilsystems 09 00049 g002
Figure 3. Soil amendment effect on (A) microbial biomass carbon (Cmic), (B) microbial biomass nitrogen (Nmic), (C) cumulative C-CO2 emissions, (D) metabolic quotient (qCO2), (E) microbial biomass carbon to SOC ratio (Cmic:SOC) and (F) microbial biomass nitrogen to Nmin ratio (Cmic:SOC). The box range represents the 25% (upper) and 75 (lower) percentiles while whiskers on the bother present the standard deviation. Letters indicate a significant difference between treatments (ANOVA, p < 0.05) after post hoc analysis. Error bars denote the standard deviation of the mean (n = 3).
Soilsystems 09 00049 g003
Figure 4. The activities of (A) beta-glucosidase (β-glu), (B) beta-cellobiosidase (β-cello), (C) beta-xylobiosidase (β-xyl), (D) arginine-aminopeptidase (Arg-amino), (E) tyrosine-aminopeptidase (tyr-amino) and (F) N-acetyl-β-glucosaminidase (n-acet) in the lime and biochar amended soil. Letters indicate a significant difference between treatments (ANOVA, p < 0.05) after post hoc analysis. Error bars denote the standard deviation of the mean (n = 3).
Soilsystems 09 00049 g004
Figure 5. Principal component analysis of the treatment effects on the soil chemical and biological properties. The direction and length of the arrow indicate the slope and degree of influence. The measured parameters include Avail P, available phosphorus; Nmin, mineral nitrogen; Respi, total CO2 emissions; Cmic, microbial biomass carbon; β-glu, beta-glucosidase; β-cello, beta cellobiosidase; β-xyl, beta-xylobiosidase; n-acet, N-acetyl-β-glucosaminidase; arg-amino, arginine-aminopeptidase; tyr-amino, tyrosine-aminopeptidase; Tot. P; total phosphorus; Tot. N, total nitrogen; Tot. C, total nitrogen; Tot. K, total potassium; Tot. Ca, total calcium.
Soilsystems 09 00049 g005
Figure 6. Pearson correlation analysis of the soil pH with chemical and biological properties (n = 27) including the available phosphorus, mineral nitrogen, microbial biomass carbon, total phosphorus, total nitrogen, total potassium, and total calcium. Colors indicate clusters based on the soil amendment types.
Soilsystems 09 00049 g006
Table 1. Chemical properties of the kitchen stove ash and corncob biochar used in the study. Values are reported as mean ± standard deviation (n = 3).
ParameterUnitAshBiochar
pH 11.01 ± 1.327.37 ± 1.10
TC%14.86 ± 1.5584.93 ± 3.76
TIC%6.46 ± 0.020.03 ± 0.00
SOC%0.42 ± 0.0176.65 ± 2.67
N%0.51 ± 0.020.73 ± 0.06
Alg kg−112.18 ± 1.932.60 ± 0.87
Cag kg−1217.57 ± 12.429.32 ± 1.43
Pg kg−19.28 ± 1.351.63 ± 0.21
Kg kg−197.21 ± 14.209.56 ± 1.01
Mgg kg−124.87 ± 3.265.60 ± 1.02
Feg kg−16.21 ± 1.651.61 ± 0.58
Nag kg−12.25 ± 0.640.97 ± 0.04
Mng kg−10.61 ± 0.010.53 ± 0.01
Zng kg−10.10 ± 0.040.14 ± 0.06
Cug kg−10.01 ± 0.000.01 ± 0.00
Table 2. Mean total carbon and nutrient concentrations of biochar, ash, and lime (CaCO3)-treated acidic soil. Groups that do not share the same letter were significantly different from each other (p < 0.05; analysis of variance [ANOVA] and Fisher’s post hoc test). Values after ± represent the standard deviation of means (n = 3).
CNPKCaAlFe
Amendment[g kg−1]
Con4.75 ± 0.44 d0.48 ± 0.05 a0.08 ± 0.01 b0.70 ± 0.06 c0.55 ± 0.05 d4.85 ± 0.37 ab14.15 ± 0.19 a
B108.61 ± 0.96 b0.54 ± 0.02 a0.09 ± 0.01 ab0.77 ± 0.04 bc0.59 ± 0.04 d4.56 ± 0.32 abc13.86 ± 0.24 a
B2010.13 ± 1.10 a0.59 ± 0.08 a0.10 ± 00 ab0.82 ± 0.0 bb0.60 ± 0.02 cd4.34 ± 0.14 bc14.92 ± 0.36 a
Akw6.43 ± 0.70 cd0.57 ± 0.04 a0.10 ± 0.01 ab0.83 ± 0.06 ab0.66 ± 0.02 bc5.28 ± 0.08 a14.71 ± 1.15 a
Lime5.28 ± 0.29 d0.52 ± 0.05 a0.10 ± 0.01 ab0.77 ± 0.10 bc0.69 ± 0.01 ab4.46 ± 0.38 bc14.81 ± 0.97 a
Ash + B108.52 ± 0.28 b0.58 ± 0.01 a0.11 ± 0.01 ab0.87 ± 0.11 ab0.68 ± 0.03 bc3.89 ± 0.33 c14.10 ± 0.54 a
Lime + B108.13 ± 0.10 bc0.56 ± 0.03 a0.10 ± 0.01 ab0.82 ± 0.02 ab0.72 ± 0.01 ab4.49 ± 0.17 bc15.48 ± 0.73 a
Ash + B2010.22 ± 0.66 a0.65 ± 0.06 a0.12 ± 0.01 a0.95 ± 0.01 a0.69 ± 0.01 ab4.89 ± 0.14 c14.12 ± 0.55 a
Lime + B2011.37 ± 0.10 a0.61 ± 0.03 a0.10 ± 0.01 ab0.84 ± 0.06 ab0.75 ± 0.01 a4.60 ± 0.16 abc14.76 ± 0.87 a
p-valuep < 0.05p > 0.05p < 0.05p < 0.05p < 0.05p < 0.05p > 0.05
Disclaimer/Publisher’s Note: The statements, opinions and data contained in all publications are solely those of the individual author(s) and contributor(s) and not of MDPI and/or the editor(s). MDPI and/or the editor(s) disclaim responsibility for any injury to people or property resulting from any ideas, methods, instructions or products referred to in the content.

