Article

Assessing the Global Sensitivity of RUSLE Factors: A Case Study of Southern Bahia, Brazil

by
Mathurin François
1,2,3,
Camila A. Gordon
2,
Ulisses Costa de Oliveira
4,
Alain N. Rousseau
2,* and
Eduardo Mariano-Neto
5
1
Ecologia e Conservação da Biodiversidade, Universidade Estadual de Santa Cruz (UESC), Rodovia Jorge Amado, Km 16, Bairro Salobrinho, Ilheus 45662-900, Brazil
2
Centre Eau Terre Environnement (ETE), Institut National de la Recherche Scientifique (INRS), 490 rue de la Couronne, Québec, QC G1K 9A9, Canada
3
Department of Chemical Engineering and Materials Science, Yuan Ze University (YZU), Chung-Li District, Taoyuan City 32003, Taiwan
4
Department of Hydraulic and Environmental Engineering, Federal University of Ceará, Fortaleza 60455-760, Brazil
5
Biology Institute, Federal University of Bahia (UFBA), Salvador 40170-115, Brazil
*
Author to whom correspondence should be addressed.
Soil Syst. 2024, 8(4), 125; https://doi.org/10.3390/soilsystems8040125
Submission received: 31 July 2024 / Revised: 23 November 2024 / Accepted: 25 November 2024 / Published: 2 December 2024

Abstract

:
Global sensitivity analysis (GSA) of the revised universal soil loss equation (RUSLE) factors is in its infancy but is crucial to rank the importance of each factor in terms of its non-linear impact on the soil erosion rate. Hence, the goal of this study was to perform a GSA of each factor of RUSLE for a soil erosion assessment in southern Bahia, Brazil. To meet this goal, three non-linear topographic factor (LS factor) equations alternately implemented in RUSLE, coupled with geographic information system (GIS) software and a variogram analysis of the response surfaces (VARSs), were used. The results showed that the average soil erosion rate in the Pardo River basin was 25.02 t/ha/yr. In addition, the GSA analysis showed that the slope angle which is associated with the LS factor was the most sensitive parameter, followed by the cover management factor (C factor) and the support practices factor (P factor) (CP factors), the specific catchment area (SCA), the sheet erosion (m), the erodibility factor (K factor), the rill (n), and the erosivity factor (R factor). The novelty of this work is that the values of parameters m and n of the LS factor can substantially affect this factor and, thus, the soil loss estimation.

1. Introduction

Soil erosion can be a natural process where particles are detached by raindrop splash and ensuing transport through successive deposition and reentrainment downslope [1,2]. Notably, soil is a non-renewable resource from the standpoint of the human lifespan, and its degradation directly affects ecosystem services, agricultural sustainability, food security, and the economy [3,4]. For example, in Brazil, the economic impact of soil loss due to nutrient loss was estimated to be USD 15.7 billion in 2021 [5]. Along with natural processes, a set of anthropic factors such as deforestation and timber harvesting with the intent of opening new agricultural lands, overgrazing, and the mismanagement of cropland cause soil erosion [6]. Of note, erosion is one of the global environmental problems leading to reductions in food production [7], and ultimately economic losses [8]. A recent study reported that 75 billion tons of soil are globally lost each year and cost approximately USD 400 billion annually [9]. The problem becomes more and more serious in developing countries and, hence, has been accelerating due to the replacement of forested areas by agricultural areas, which amplify soil erosion and the loss of biodiversity. In some countries, deforestation started with the colonization period. For example, the Atlantic Forest biome, which is the second-largest tropical forest on the American continent [10], underwent serious deforestation as early as 1500, particularly when Portuguese settlers arrived in Brazil [11]. However, so far, this biome still has great diversity of plant and animal species, covering 17 Brazilian states [12], and is home to more than 100 million inhabitants [13]. It is noteworthy that deforestation and agricultural practices are the main causes of soil erosion in the Atlantic Forest.
Previous studies have highlighted that severe soil erosion occurs in agricultural areas, particularly on higher slopes [14,15], and is considered the main problem in the semi-arid region of Northeast Brazil [16]. The destruction of the vegetation cover increases surface runoff and decreases infiltration [17], resulting in soil loss. Northeast Brazil is particularly vulnerable due to land cover alteration, land use, and landscape occupation [18].
The revised universal soil loss equation (RUSLE) is one of the most commonly used empirical methods to assess the average field-scale soil erosion rate, accounting for rainfall erosivity (R factor), soil erodibility (K factor), slope length (L) and slope steepness (S), which are often lumped together and commonly called the topographic factor (i.e., LS factor), cropland management systems (C), and erosion control practice (P) (CP factor). Studies have underscored that the R factor is a major contributor to the erosion rate and, thus, higher rainfall intensity causes higher soil erosion rates [19,20]. For example, a study conducted in South America revealed that the R factor has substantial impact on soil loss [21]. With respect to the K factor, it is directly linked to soil erosion and represents the susceptibility of soil to supply sediments and be transported by surface runoff [22]. The K factor is mainly influenced by soil texture, including permeability, chemical composition, and organic matter [23]. Its value indicates the amount of soil loss per rainfall erosivity index [22]. Moreover, various studies have highlighted that long slope lengths contribute to high erosion rates due to increased water accumulation and sediment detachment [24,25,26]. Similarly, an increase in slope steepness greatly affects the erosive force of water [27] and thus amplifies soil erosion rates [28]. Overall, studies have reported that the LS factor can greatly influence soil erosion, particularly in complex geographic conditions [29,30,31,32]. Like other factors, the CP factor is crucial in soil erosion assessment and quantifying the effect of land use land cover (LULC) on the erosion rate [33]. Therefore, areas with high vegetation can considerably reduce soil loss [34].
Each parameter of RUSLE is plagued with uncertainty. For example, various studies have highlighted that the LS factor is the most uncertain and sensitive one [35,36,37,38]. Like all other factors of RUSLE, any increase in LS results in an increase in soil loss [39]. Accordingly, identifying the sources of uncertainty associated with the LS factor becomes crucial and needs to be reduced. Studies have highlighted that errors and uncertainty in the digital elevation model (DEM) can affect the estimation of the LS factor [40,41]. Of note, uncertainty in DEMs can originate from multiple sources, including positional inaccuracy, calculation error, and interpolation error [36]. Therefore, the spatial effect of the LS factor needs to be quantified and modeled [42]. Studies have pointed out that the slope gradient β and S factors decrease when the grid size increases [43], decreasing the soil loss estimation [44].
Various studies have investigated uncertainties in soil erodibility [45,46,47,48]. Others have assessed the sensitivity of the R factor using various equations [49] and the normalized difference vegetation index-based C factor [50]. A sensitivity analysis (SA) seeks to determine how uncertainty in the output of a model can be attributed to a set of uncertainty sources in model inputs [51,52]. Another study documented that SAs can be used to understand the most influential input variable in a targeted equation to an output behavior as the less or non-contributing inputs [53]. Notably, SAs can either be local or global. Global SA (GSA) is the study that examines how uncertainty in a model’s output, whether numerical or otherwise, can be attributed to various sources of uncertainty within the model’s inputs [54]. GSA considers simultaneously the values of a set of input parameters for the assessment of the output uncertainty [55], whereas a local sensitivity analysis (LSA) accounts for a one-at-a-time variation of input factors. The advantage of GSA over LSA is that GSA considers the entire variation range of the input [51]. To the best of our knowledge, no study has previously evaluated the global sensitivity of RUSLE nor ranked the sensitivity of the parameters of the equations used to compute the LS factor. Therefore, the objective behind this study was to perform a GSA of RUSLE factors as part of a soil erosion assessment in southern Bahia, Brazil.

2. Materials and Methods

2.1. Study Area and Data

This study was conducted in Canavieiras, Southern Bahia (Figure 1a), which has a humid tropical climate [56] with an average annual rainfall, relative humidity, and air temperature of 1830 mm, 80%, and 23.5 °C, respectively [57]. It should be noted that the meteorological stations are shown in Figure 1b. The Pardo River watershed is located between latitudes 15°42′ and 15°45′ South and longitudes 39°9′ and 39°5′ West. A mosaic culture and several types of cocoa, such as shaded cocoa, unshaded cocoa, and organic cocoa, which are considered forests, represent the LULC of the area.
The Pardo River crosses two Brazilian states. It rises in the state of Minas Gerais, mainly in the municipality of Rio Pardo, and completes its course in that of Canavieiras [58]. The drainage area of the Pardo River watershed used in this study is estimated to be 30.07 km2. The topography of the watershed features elevation levels ranging from 5.26 m at the lowest point to 121.96 m at the highest, with an average elevation of 63.79 m. The slope within the watershed varies from 0° to 35.44°, with an average slope of 9.85°. This indicates that the landscape is predominantly flat to gently undulating, with some areas having more pronounced undulations. Slopes reaching up to 35.44° suggest that certain areas are susceptible to erosion, especially during heavy rainfall. It is noted that the part of the Pardo River used in this study is the one with limited riparian buffer.

2.2. Modeling

The LULC map was obtained by accessing MapBiomas [59], a Brazilian project. The MapBiomas was developed using a mosaic of Landsat satellite images of 30 m resolution. Importantly, LULC was automatically classified as follows: forests (native stands and grouped agroforestry systems), pastures, forestry, open areas, urban centers, exposed soil, and water bodies (e.g., rivers, and ponds). The statistical analysis of the global accuracy for MapBiomas showed a result of 82.4% [59].

2.3. Calculation of Soil Loss

Soil erosion was calculated using RUSLE [60] with the support of QGIS tools. Layers of DEM, R, and interpolated K were used to model soil loss [61]. Each raster file had the same resolution (30 m). Soil loss was estimated using Equation (1). After the conversion of vector files into raster ones, a raster calculator was used to calculate soil loss as follows. These vector files contained data on the K and CP factors.
A = R × K × L S × C × P
where R represents the erosivity factor in MJ mm (ha h year)−1, K the erodibility factor expressed in t h (MJ mm)−1, LS the dimensionless slope length and steepness factors, C the crop management factor, and P the support practice factor.

2.4. Rainfall Erosivity (R Factor)

The R factor is a mathematical expression of the erosive power produced by the average rainfall and runoff causing soil erosion at a specific location [62]. In this study, average monthly precipitations were collected from seven climatological stations (Table 1). The data were processed in a spreadsheet software and presented geographically before conversion in the comma-separated value (.csv) format and imported into QGIS for conversion into a shapefile format. Of note, there are several methods (e.g., Inverse Distance Weighting (IDW), Kriging, and Cokriging) that can be used as interpolation techniques to generate the R factor. Studies have suggested to use IDW when there is a lack of environmental information [63,64]. In this study, IDW was used for the spatial interpolation of the R factor, given that we had rainfall data from a limited number of meteorological stations.
To obtain reliable values, Cassol et al. [66] recommended a minimum series of 23 years of precipitation. In this study, the mean precipitation was calculated for the years 1992 to 2021. Due to the absence of data on the erosivity index (EI), we used Equations (2) and (3), as recommended by [67,68,69]:
R = E I
E I = 67.355 r 2 P 0.85
where EI is the monthly mean erosivity index (MJ mm ha−1 h−1), and computed as the sum of the average of the monthly values of erosion indices [67,68,70,71], r is the average monthly precipitation (mm), and P is the average annual precipitation (mm). In Equation (2), the R factor is expressed in MJ mm ha−1 h−1 year−1. In Equations (2) and (3), E and I stand for the kinetic energy of rain and the maximum 30 min intensity (I30), respectively. It should be noted that Equation (3) is applicable in areas with tropical and subtropical climates [70].

2.5. Soil Erodibility (K Factor)

The K factor represents the soil vulnerability to erosional agents; hence, it is limited to a set of sub-factors, including the detachment and transport of soil particles [72]. Soil erodibility spatially changes with LU and land form [6]. In this study, soil’s physical and textural properties were used to estimate erodibility, while the soil map from MapBiomas was used to identify soil types. Previous studies carried out in Brazil have recommended using K factor values from other studies, taking into account the same types of soil for mapping the K factor [65,73,74,75]. In this study, we used the K factor values from published studies conducted in areas with similar soil types in Brazil. The value of each type of soil was taken from the literature and registered in the attribute table before the conversion of this vector file into a raster file.

2.6. Topographical Factor (LS Factor)

The LS factor is the combination of slope length (L factor) and slope steepness (S factor), and thus reflects the effect of topography on erosion [76]. The LS factor is the ratio of soil loss per unit area of a field 22.1 m long and with 9% slope [77,78]. In this study, it was calculated through the 30 m Copernicus DEM previously filled using fill sinks. QGIS was used to calculate the LS factor according to Equations (4a), (4b) and (5), developed by [79,80,81], respectively. Studies have highlighted that the 30 m Copernicus DEM is a clearly more accurate representation of the Earth’s surface when compared to other sources, including TanDEM-X, SRTM, and NASA DEMs [82,83,84].
L S = ( m + 1 ) ( S C A 22.13 ) m   ( S i n β 0.0896 ) n here   m = ( 0.4 0.6 ) and   n = ( 1.0 1.3 )
m = ( 0.2 0.6 ) and   n = ( 1.0 1.3 )
              L S = ( S C A 22.13 ) m   ( S i n β 0.0896 ) n   here   m = ( 0.4 0.56 ) and   n = ( 1.2 1.3 )
where β stands for the slope angle in degrees; m and n for sheet and rill erosion; and SCA for the specific catchment area (m2/m)—that is, the ratio of the upstream catchment area of a contour line to its length [85]. In Equation (4a), m and n vary from 0.4 to 0.6, and from 1.0 to 1.3, respectively [79]. Conversely, the authors of [80] used Equation (4b) and documented that m ranged from 0.2 to 0.6 and n ranged from 1.0 to 1.3. Meanwhile, in Equation (5), m varies from 0.4 to 0.56 and n varies from 1.2 to 1.3 [81]. In this study, we used the mean values of m and n (m = 0.5 and n = 1.15), and (m = 0.4 and n = 1.15) in Equations (4a) and (4b), respectively. In addition, we also used the mean of m (0.48) and n (1.25) in Equation (5). Importantly, m and n are linked to the removal of the soil layer caused by raindrop splash [86]. We used the filled DEM as input to calculate the flow accumulation matrix using the “Flow accumulation” algorithm, which was then used as input for the total catchment area (TCA) to extract the SCA using the algorithm “Flow with and specific catchment area” available in QGIS through hydrology tools in Saga [87]. The multiple flow direction (MFD) method was used to execute this algorithm.

2.7. Crop Management and Support Practice (CP Factor)

The C factor is dimensionless and depends on the degree of vegetation cover, the canopy, the topography of the terrain, and the antecedent LU practice [60], and ranges from 0 (total land cover) to 1 (no land cover) [77]. The P factor is also dimensionless, resulting from the ratio between expected soil losses for a given soil conservation practice and up and down tillage [77]. The combination of the vegetation cover and management factor (C factor) and the support practice (P factor) is often treated as a unique factor when there are not any protective management practices considered. Various researchers have combined factors C and P, commonly referred to as the CP factor, and have sought their values in the literature [88,89,90]. Notably, the C and P factors can be calculated individually when a study aims to minimize their impacts on the study area [91]. However, they can be combined when assessing soil loss due to erosion in a specific area [91]. Based on these studies, we combined the C and P factors to form the CP factor and searched for its values in studies conducted in Brazil with similar LULC. The shapefile of LULC was downloaded from Mapbiomas and then imported into QGIS before being clipped to fit the shape of the study area. It is noted that the LULC values used to generate the CP factor map in this study have been used in various studies in Brazil and are recommended by [61,91,92]. They were inserted into the attribute table (vector layer) before being converted to a raster layer using QGIS.

3. Sensitivity Associated with RUSLE Model

The variogram analysis of the response surfaces (VARSs) was used for the global sensitivity analysis, using as inputs the minimum and maximum values of each RUSLE factor. The inputs used in VARS were the parameter values of the chosen LS equation along those of the CP, R, and K factors (Table 2).

Soil Loss Calculations Based on VARS Sampling

VARS has been acknowledged as computationally efficient and reliable when compared to other GSA approaches [93]. This tool can generate a set of sensitivity indices, such as those based on derivative, variance, and variogram concepts [94], and offers various advantages, including easy integration, low computational cost, and the ability to compare the indicators of Sobol [95], Morris [96], and the Integrated Variogram Across a Range of Scales (IVARSs), which is a perturbation scale in the factor space, measures the change in the model response, and provides a set of sensitivities for the VARS model [97]. Admittedly, some parameters, including factor space (up to a user to define the sampling resolution) and a “star-based” sampling strategy, known as Sensitivity Test Analysis Routines (STARs), should be well defined first, which provides the degree of importance of each factor, along 90% confidence intervals of the factor space. STAR sampling consists of vertices (STAR centers) defining subsets of the factor space from which parameters are randomly sampled across the full set of factor space [98]. The function of STAR is to assess how variations in the input parameters can modify the output. The ranking of the input factor samples does not determine the ranking of the output factor. Indeed, we used 100 stars (resulting in a total of 4600 simulations, i.e., t = 4600) and a sampling resolution of 0.1 (corresponding to 10% of the parameter ranges) for the parameter space to generate the outputs. It is worth noting that an increase in the STAR number results in an increase in the number of simulations. The sampling resolution represents the distance between the locations of pairs of points in the parameter space and also ensures that all the parameter ranges are taken into account in the sampling process [99]. Similarly, other studies recommended the utilization of a sampling resolution of 0.1 to avoid the degradation of the “constant mean assumption” that can occur at larger scales [94,100,101]. Of note, the minimum and maximum values of each should be inserted in the factor space. Razavi et al. [94] recommended running VARS with an extensive amount of time to deal with the problem of factor placement in terms of importance. Thus, there were 4600 maps of the LS factor, as illustrated in Figure 2.
The soil loss calculation was carried out using two different methods. Method 1 involved applying the soil loss equation pixel by pixel, using the LS results and the values of R, K, and CP. Method 1 was thus applied to each pixel included, using the 4600 matrices already calculated for the LS factor, resulting in the same number of maps where each one was made up of 27,799 pixels, resulting in 127,875,400 possible outcomes ( P o = 127,875,400 ). Meanwhile, Method 2 added an extra step by considering the average value of the previous calculations, as presented in Equation (6).
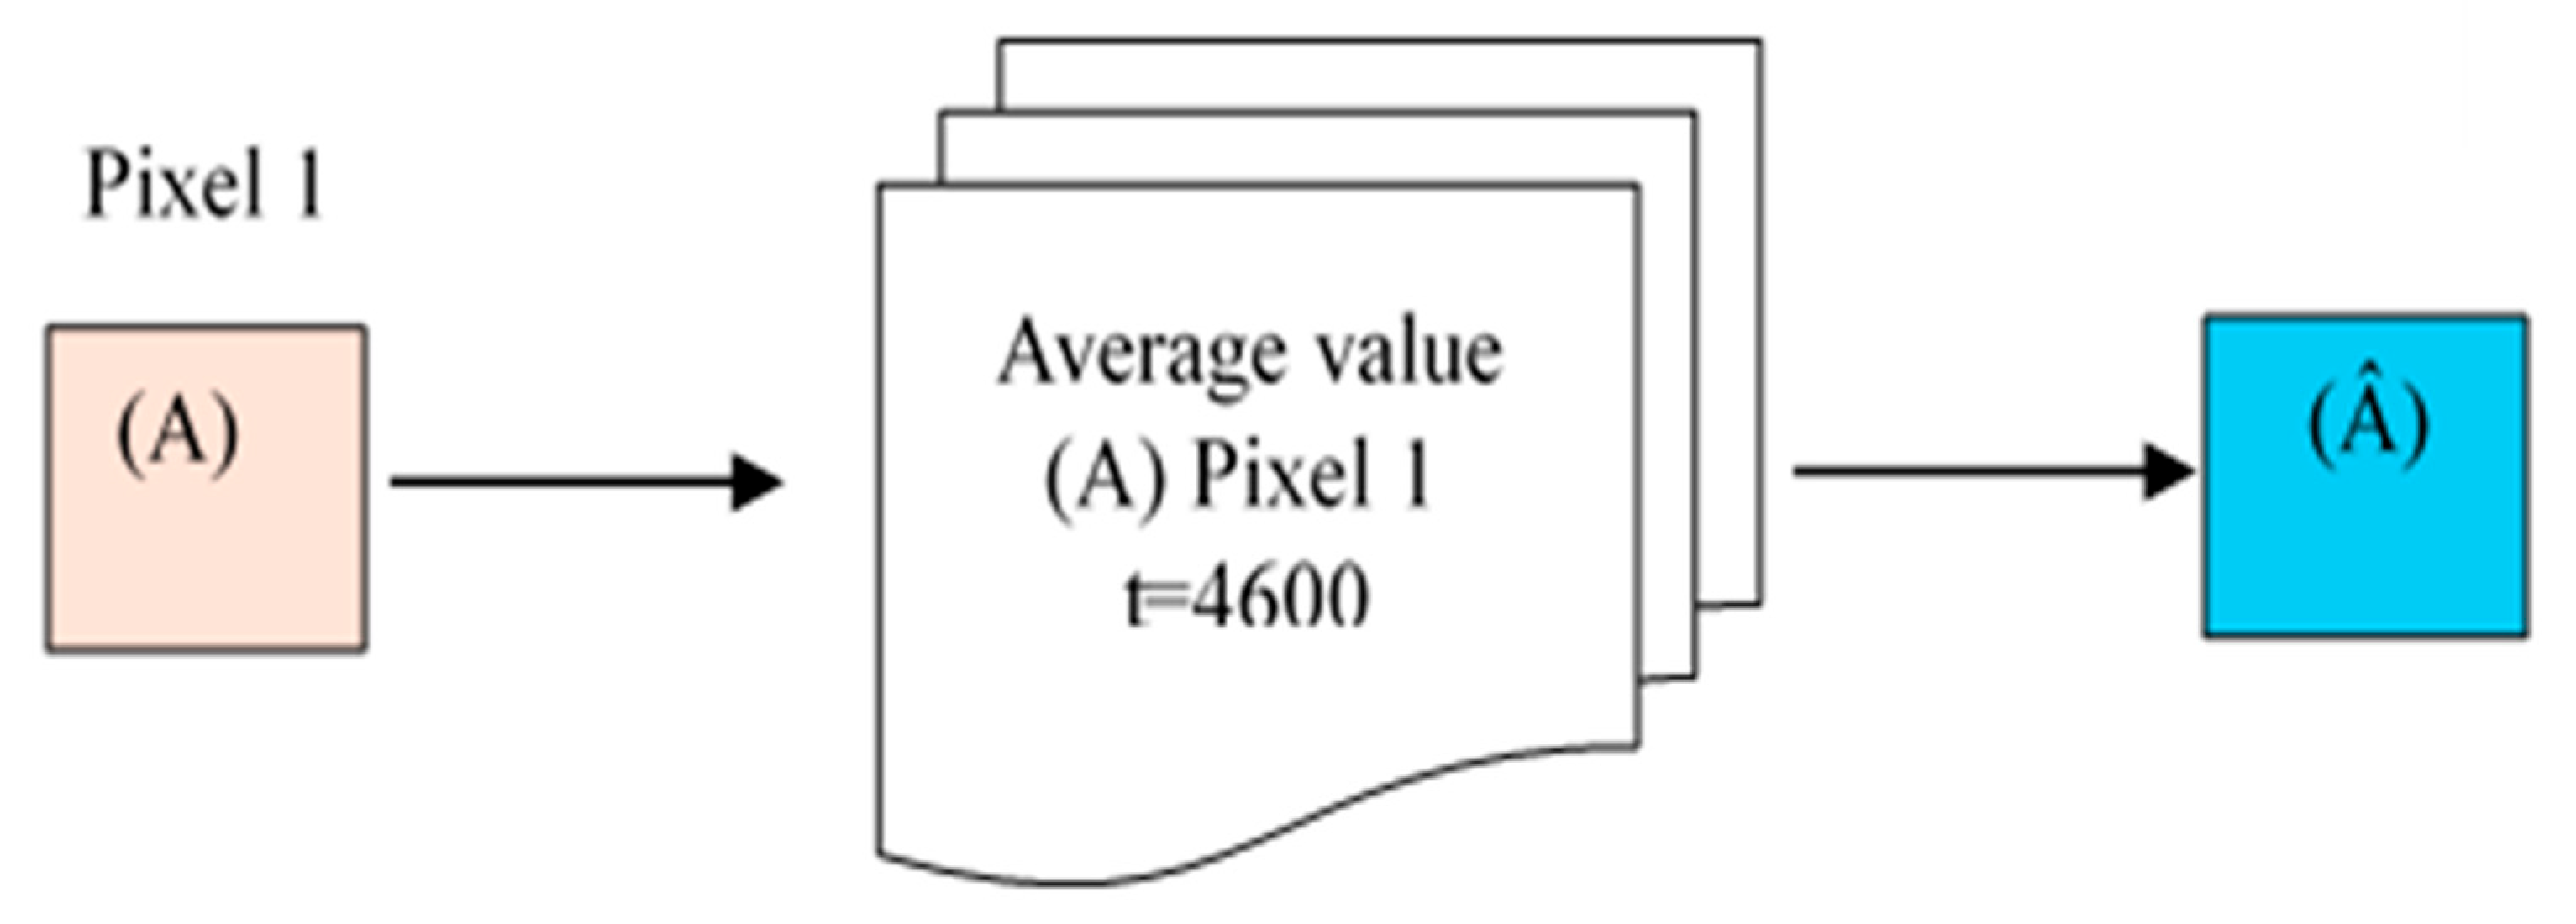
P i x e l   A ^ = 1 4600 i = 1 4600 A i
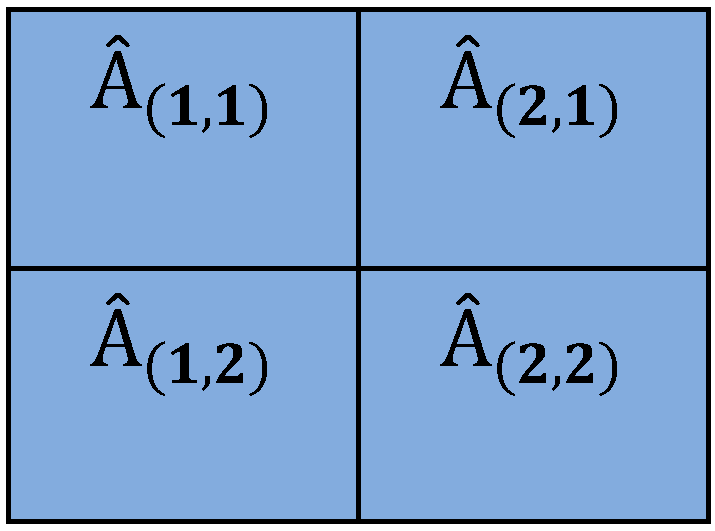
In other words, it aggregated the average of all the values of soil erosion in a pixel. Each pixel thus contained 4600 values for soil erosion, and in this method, the average was calculated to produce a representative map of the value of soil erosion per pixel. Examples of calculations for Methods 1 and 2 are illustrated in Figure 2 and Figure 3. The average value map is composed of pixels where the value of each pixel is the average of the 4600 possibilities, as shown in Figure 4 and Figure 5. It is noted that the map of average values is a uniform map consisting of the average of all pixels.
Importantly, three tests regarding the variation of CP values were conducted: one with values from 0 to 1 (see Figure S1d in Supplementary Materials), another from 0 to 0.15 (as 75% of CP values fall between 0 and 0.15; see Figure S1a,b in Supplementary Materials), and finally, one without changing the CP value of each pixel in VARS, which is the approach used to generate the results introduced later in the manuscript (constant values). Furthermore, we compared Equations (4a), (4b) and (5) for soil loss assessment based on VARS sampling (see Figure S1c in Supplementary Materials).

4. Results and Discussion

This section first introduces the nominal soil losses using each LS equation and then those resulting from the uncertainty analysis. In this manuscript, nominal soil losses refer to the soil erosion estimated using QGIS.

4.1. Nominal Soil Erosion Losses

4.1.1. R Factor

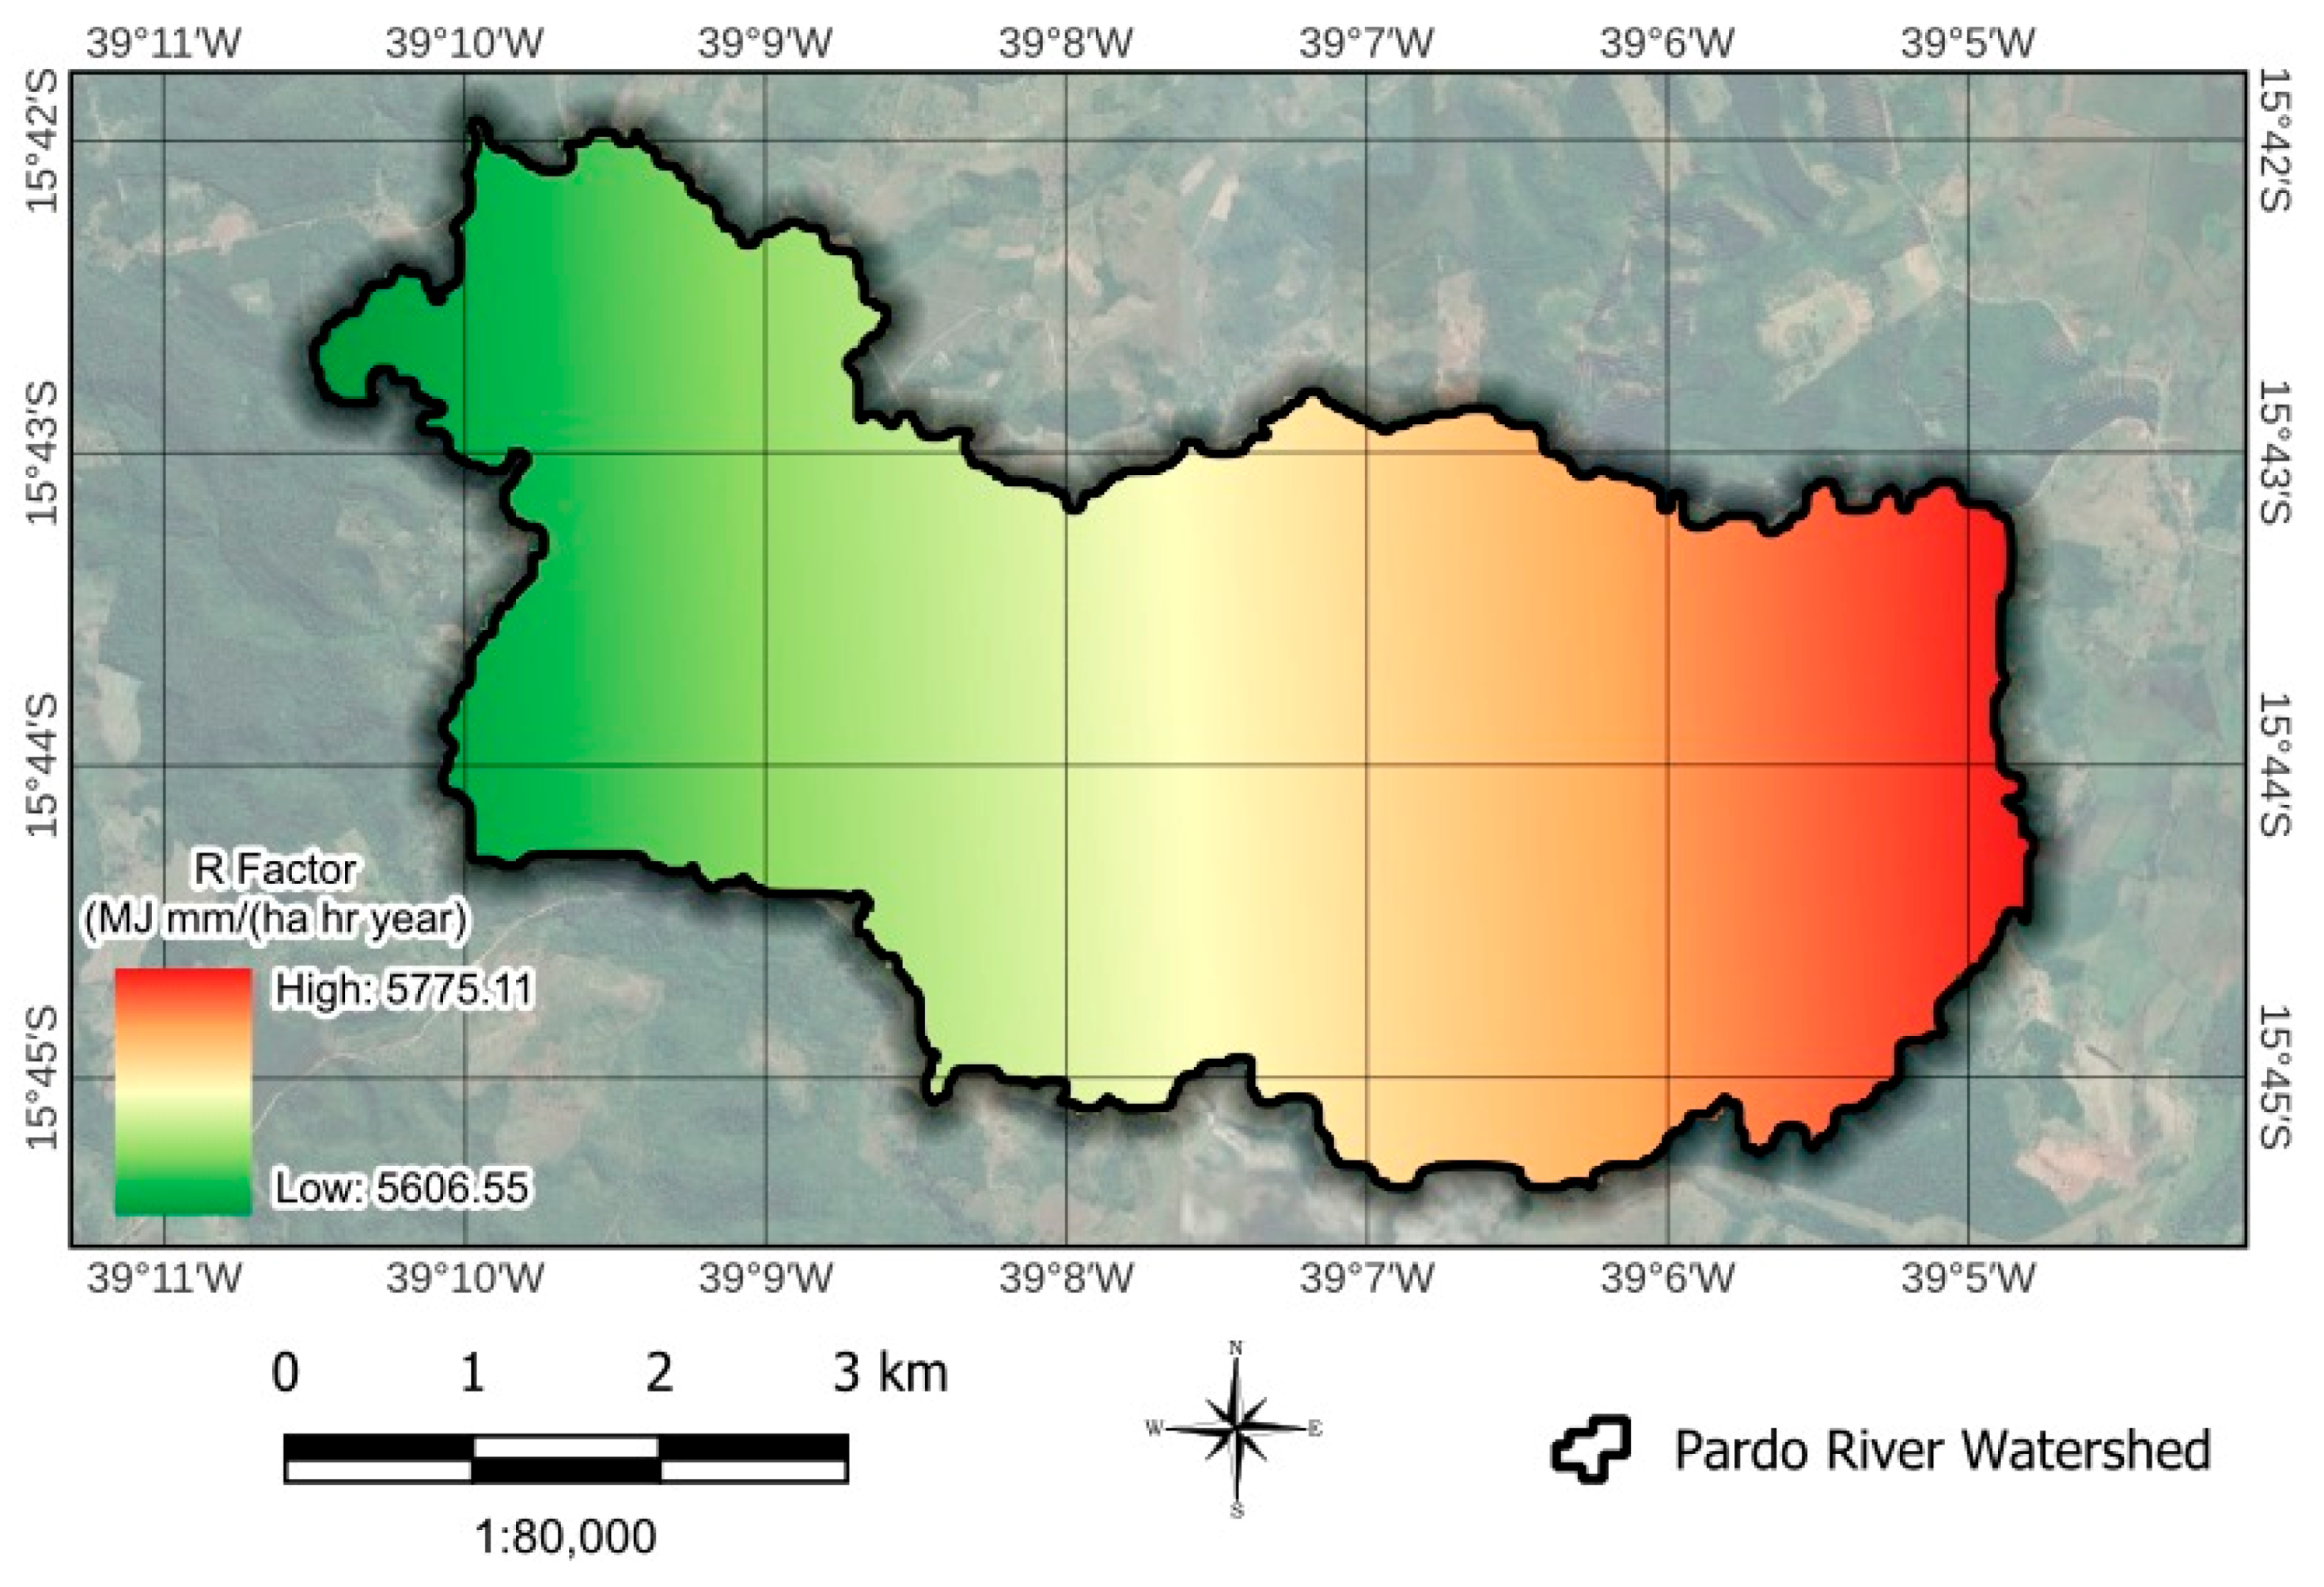
The R factor ranged between 5606.55 and 5775.11 MJ mm ha−1 h−1 year−1, with a mean of 5693.78 and a standard deviation of 43.66 MJ mm ha−1 h−1 year−1 (Figure 6). In this study, the erosivity is considered average/high because the R value is between 5905 and 7357 MJ mm ha−1 h−1 year−1 [102]. This result may indicate that it is one of the factors that substantially contribute to the soil erosion rate in this watershed.
The R value is slightly lower than those of other studies conducted in the extreme west of the Bahia state, particularly in the watershed of the Ondas River, where it varied from 5870 to 6866 MJ mm ha−1 h−1 year−1 [103] and from 6177.36 to 9968.21 MJ mm ha−1 h−1 year−1 [104].

4.1.2. K Factor

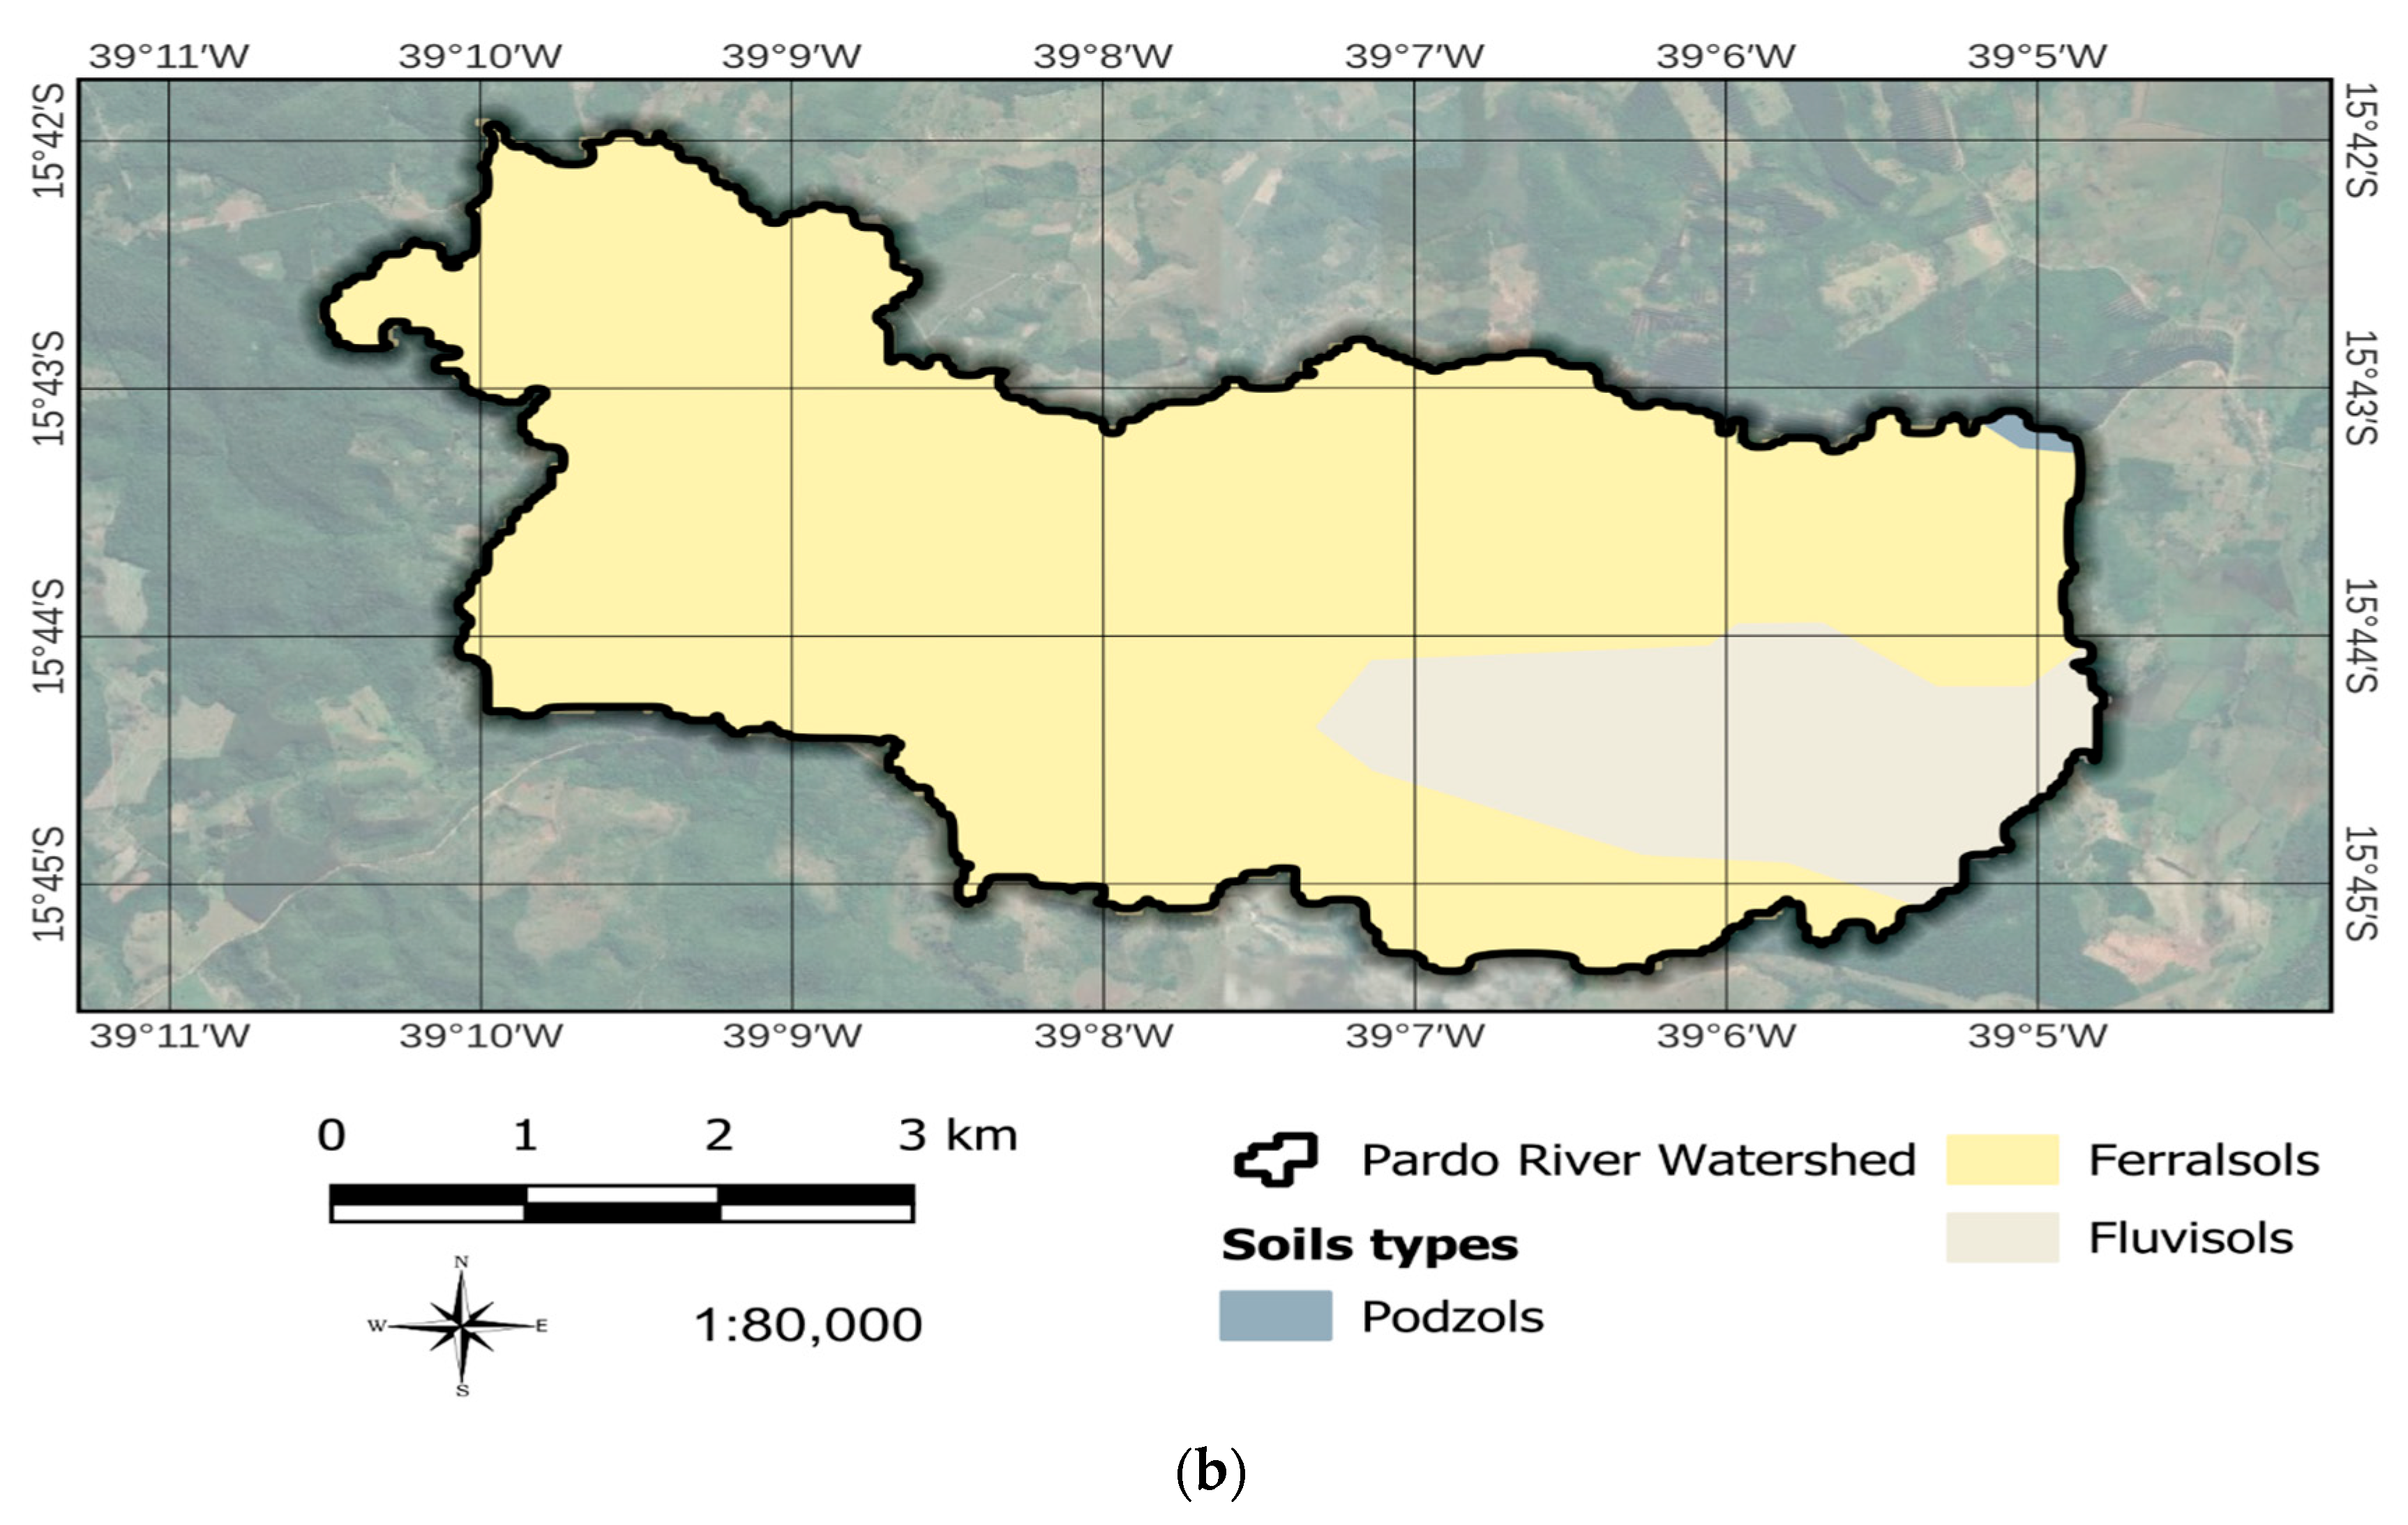
There are three soil types in the study watershed: Ferralsols, Fluvisols, and Podsol, with K values of 0.028, 0.046, and 0.0592 t h (MJ mm)−1, respectively (Figure 7a,b), as displayed in Table 3. These values are consistent with those of the K factor estimated by the USLE in Brazil, which varied from 0.0002 to 0.0636 [105].
A previous study reported that soils in the study area were considered fairly resistant to erosion (K values ranging from 0.0132 to 0.0329), moderately sensitive to erosion (K values between 0.0329 and 0.0461), and fairly sensitive to erosion (K values between 0.0461 and 0.0593) [109]. Based on these erodibility ranges, the soils of this study, Podzols, Ferralsols, and Fluvisols, are classified as resistant to erosion, moderately sensitive to erosion, and fairly sensitive to erosion, respectively. It is noted that the K values vary from one type of soil to another not only because of basic soil properties but also because of human activities [110,111]. Again, based on the previous erodibility ranges, the soil types in this watershed were not the main driver of soil loss.

4.1.3. LS Factor

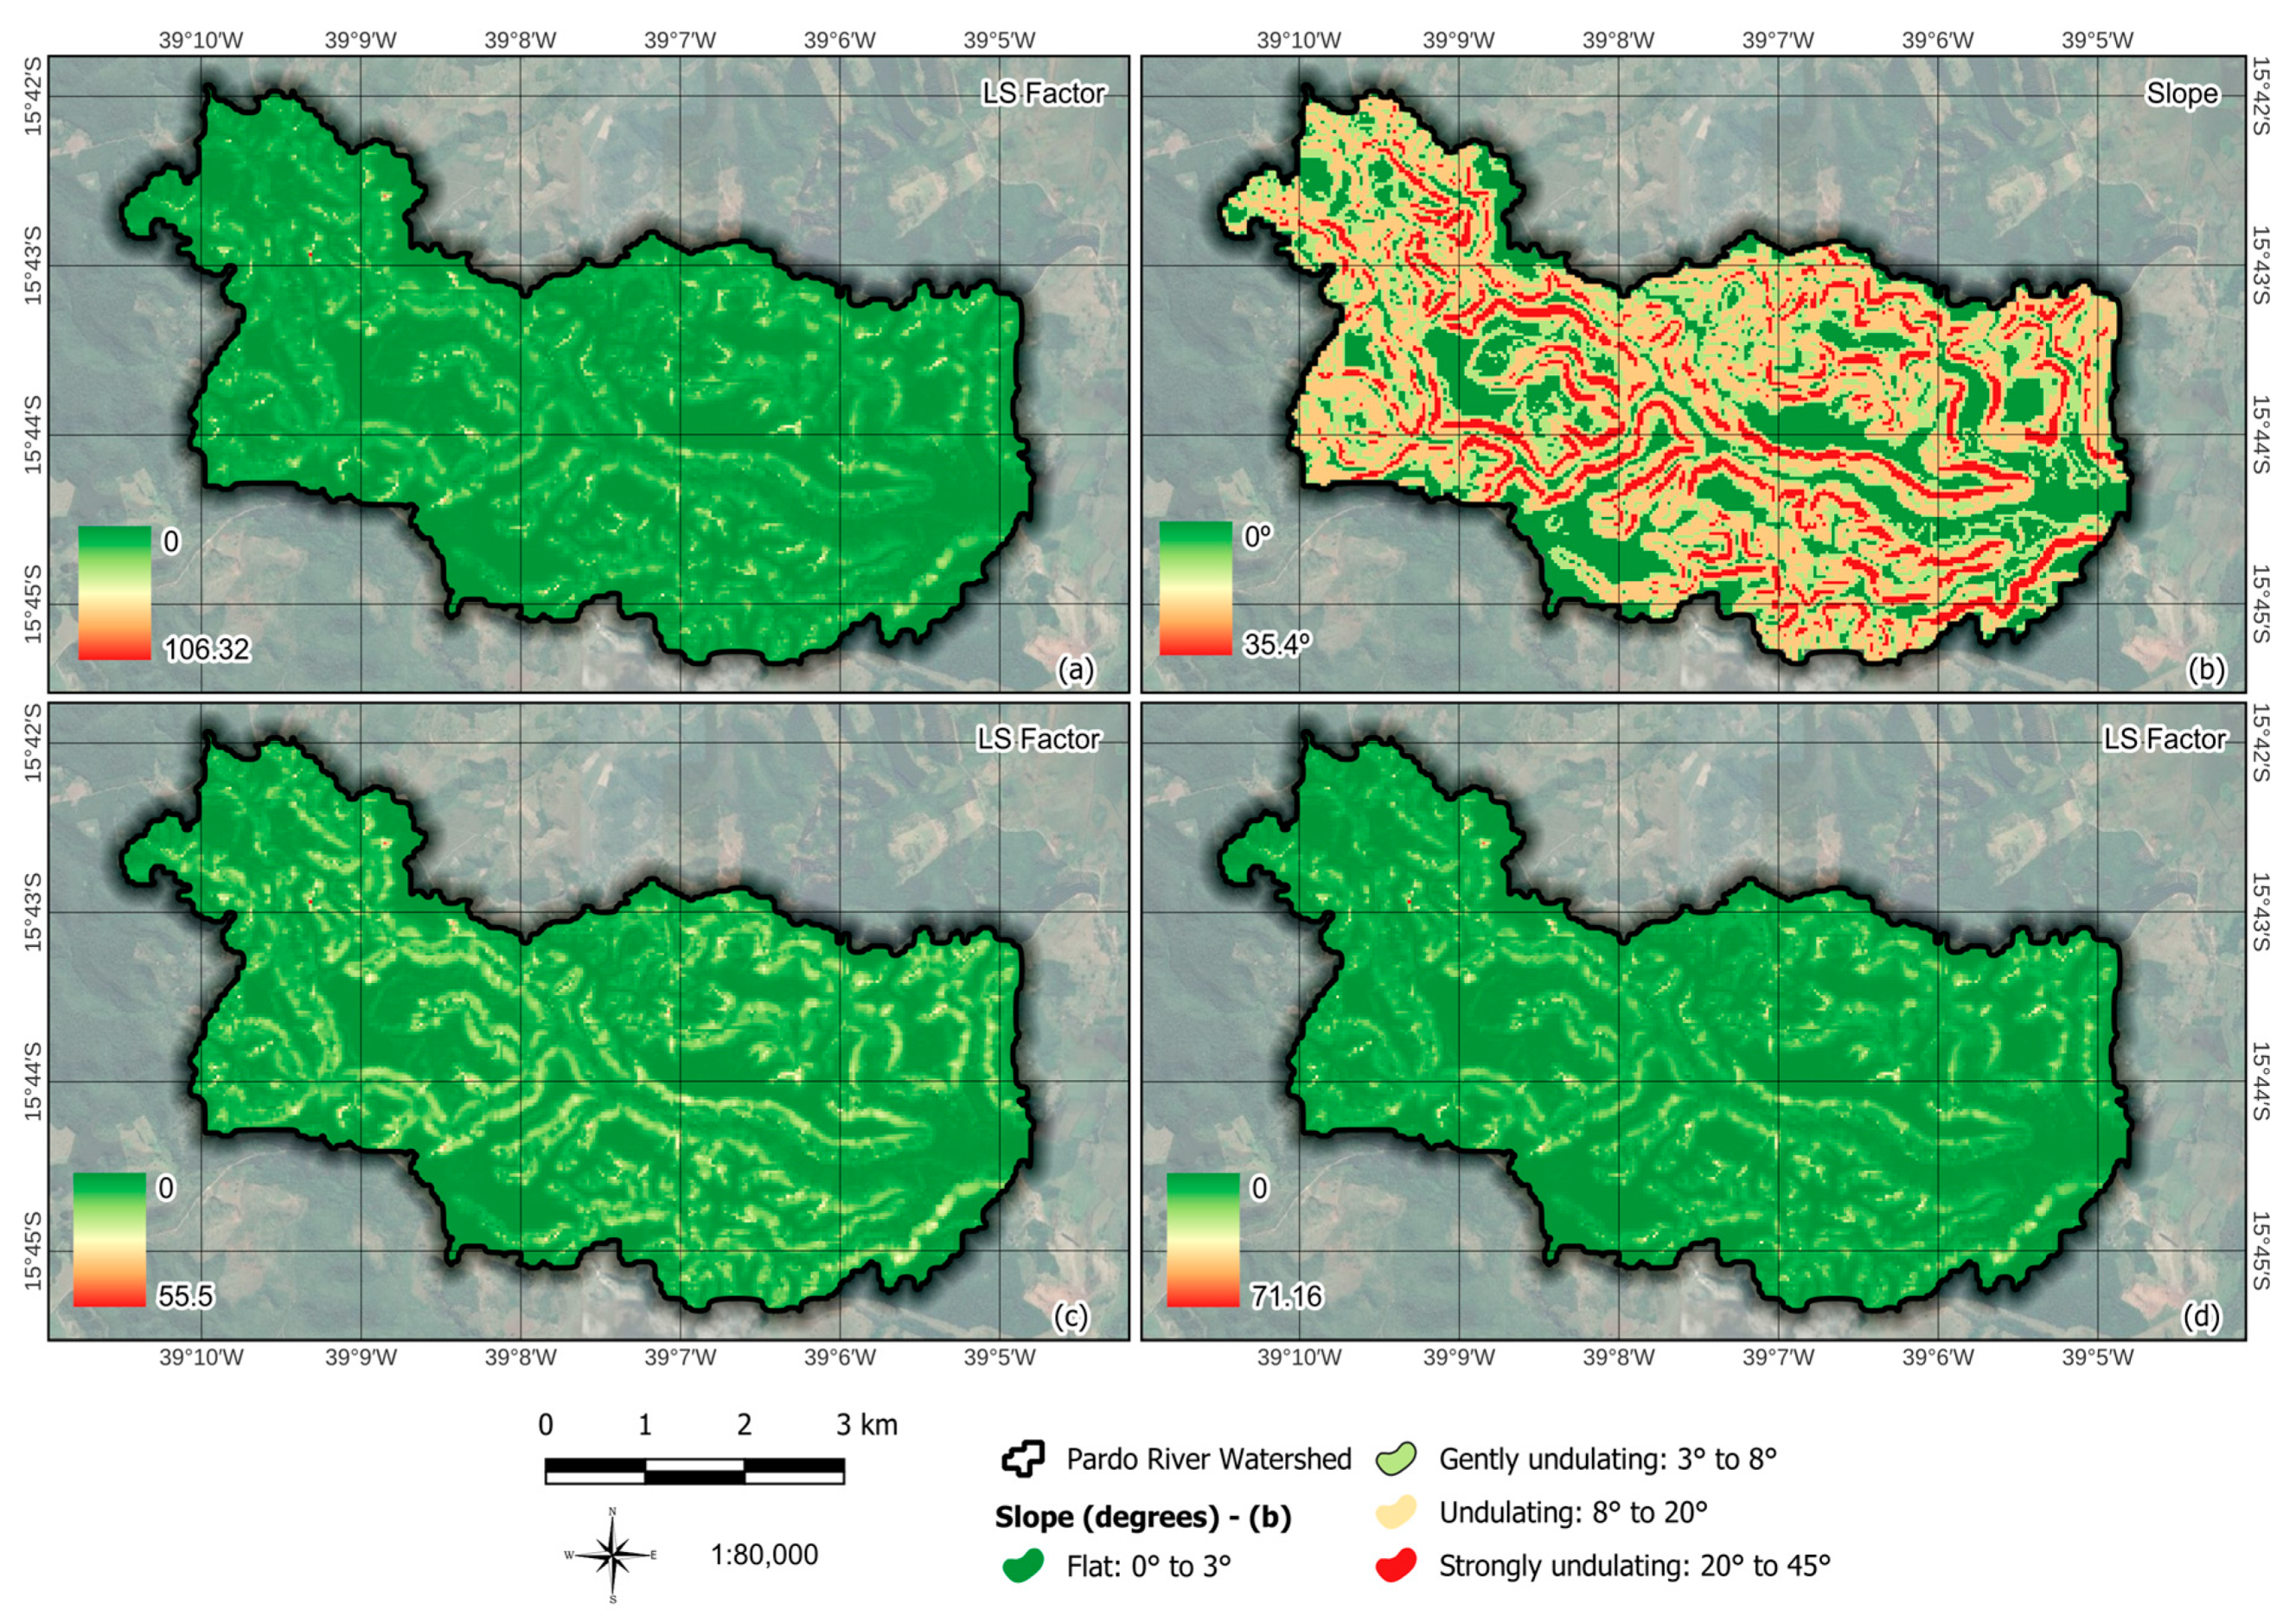
The LS factor is primarily a function of the SCA and the slope. The results showed that the LS factor lied between 0 (latter and lower part) and 106.32 (steeper and upper part) (Figure 8a), between 0 and 55.50 (Figure 8c), and between 0 and 71.16 (Figure 8d), with average values of 7.11, 5.09, and 5.03, respectively (Table 4). Compared with other studies conducted in the state of Bahia by [18,103,104], the LS factor values in this study were higher. Notably, the largest LS values are found at the highest elevations, which have the highest soil erosion.
The slope angle varied from negligible to 35.4° (Figure 8b). The values of the LS factor depend on the equations used, as shown in Figure 8a,c,d, and consequently influence the average soil loss.
The LS values shown in Figure 8a,c,d were calculated via the utilization of Equations (4a), (4b) and (5). It is noted that a larger LS factor value increases potential soil erosion as an increase in slope length accelerates flow velocity [112,113].

4.1.4. CP Factor

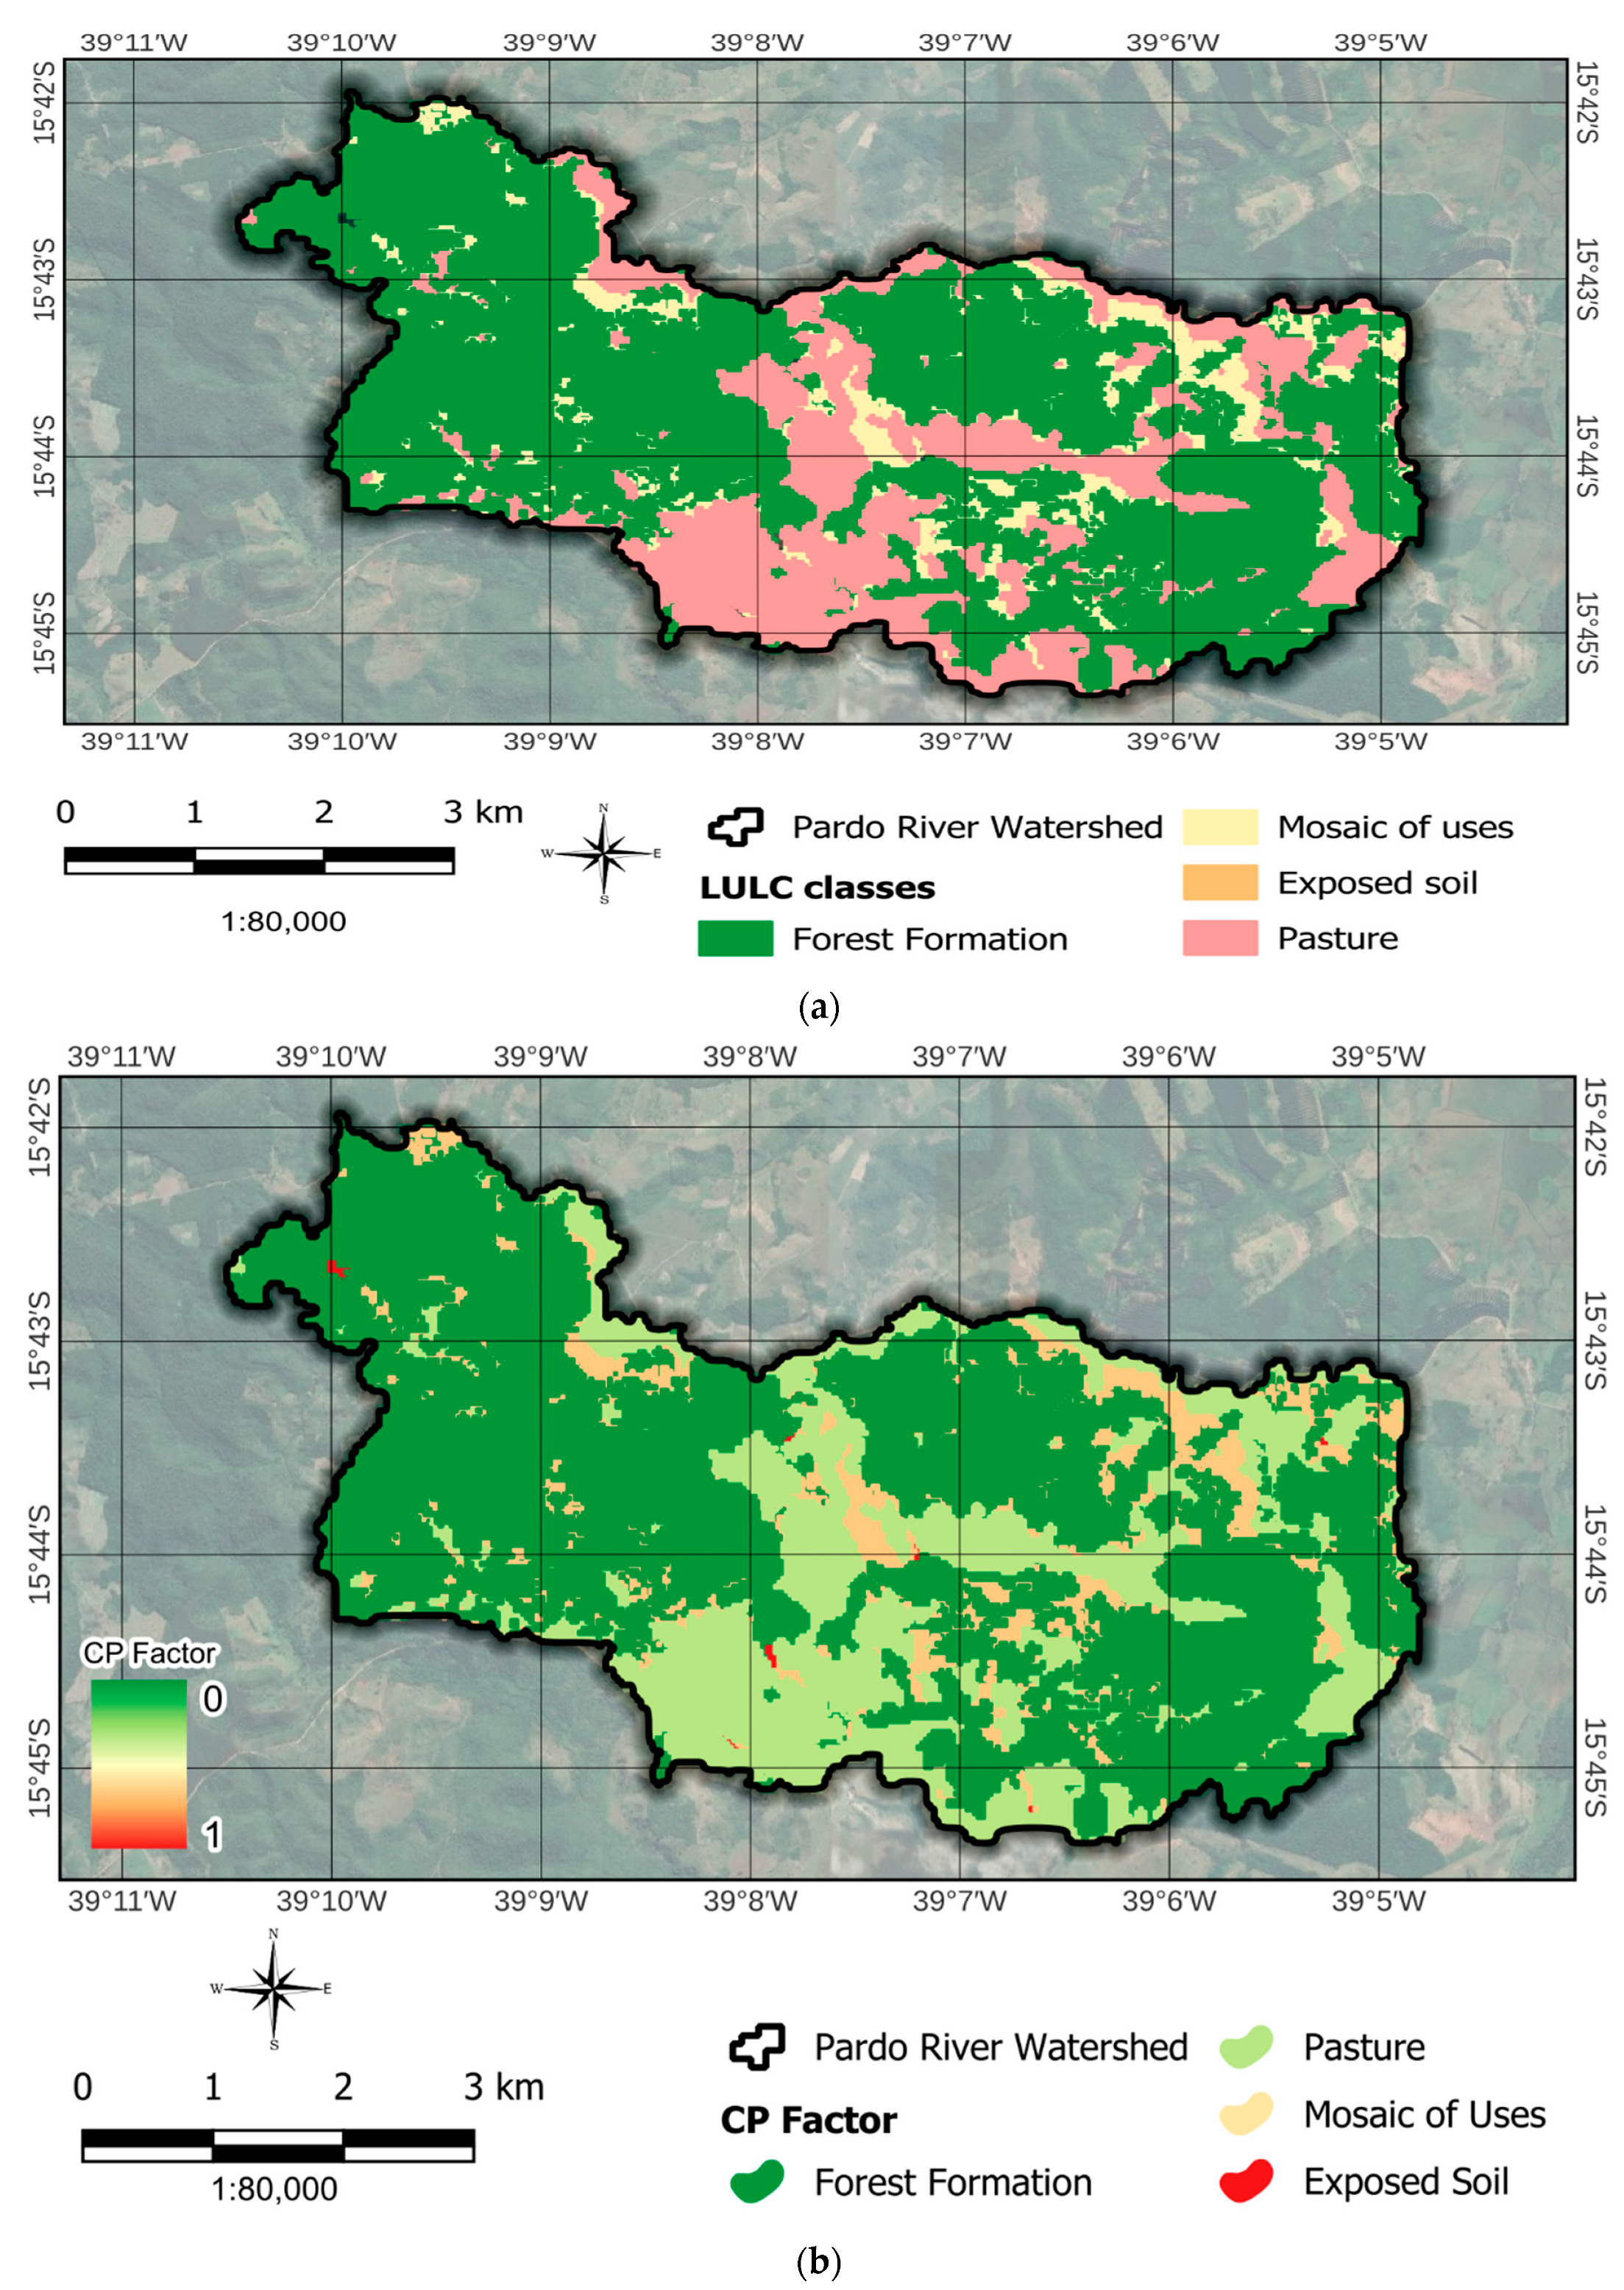
The CP values varied from 0 to 1 (Figure 9b). The highest value (1) corresponded to exposed soil, and the lowest value (0) was water (Figure 9a,b; Table 5). The CP values close to zero indicate that the cropping management and support practice factors provide strong resilience to soil erosion compared to values close to one, which represent exposed soil [61,114], as presented in Table 5.
The finding presented in Table 5 corroborates another study carried out for a watershed of the Northeastern Brazilian Cerrado [115]. These results may indicate that the actual LULC is one of the factors contributing to the soil erosion in the watershed.

4.1.5. Potential Soil Loss

The potential nominal soil loss was assessed via the raster calculator of QGIS. The soil erosion predicted when using the LS equation based on Equation (4a) ranged from 0 to 2733.27 t/ha/year (Figure 10), with an average rate of 29.77 t/ha/year and a standard deviation of 117.52 t/ha/year, whereas those based on Equations (4b) and (5) varied from 0 to 2282.69 and between 0 and 2103.27 t/ha/year, with averages of 23.76 and 21.52 t/ha/year, respectively (Figure 10; Table 6). These results are higher than those from a field study conducted in a 16.31 km2 area of the Riacho Gameleira watershed in the northeastern region of Brazil, specifically in Pernambuco, where the suspended sediment runoff was estimated to be 16.96 t/ha/year [116]. Notably, the soil erosion in this watershed was lower compared with that of another study carried out in the same region, the extreme western region of Bahia, where the annual average was estimated to be 32.69 t/ha/year [103]. In this study, the average soil loss derived from these three equations was estimated to be 25.02 t/ha/year. The mean soil loss in this watershed was higher than the average of that of the Rio Ondas watershed, estimated to be 13.36 t/ha/year, which is located in the extreme western part of the state of Bahia [117], and that of another study conducted in southern Bahia, the Rio da Dona watershed, which had an average of 21.19 t/ha/year [118]. Likewise, the average soil loss in this study was higher than that of another study conducted in southern Bahia, specifically in the Cachoeira River watershed, which reported an estimated mean soil loss of 17.37 t/ha/year [65]. These findings characterize watersheds with different degradation levels. Another aspect that may cause the difference is the equations that were used for the calculation of the LS factor in those studies. Indeed, a previous study highlighted that the LS equations used may have led to overestimated soil losses compared with others [119]. In this study, the high LS values are attributed to the use of the average within the range of m exponent values. It should be noted that any minor increase in m substantially amplifies the slope length values. In other words, even a small increase in slope length can lead to a significant rise in the LS factor [81,120]. Other factors, including the DEM resolution and the algorithm used, may also cause high LS values in this study. The findings of experimental studies have corroborated this assertion [120,121]. For example, a study showed that LS values calculated with a 30 m resolution DEM were higher than those calculated with a 5 m resolution DEM [121]. This indicates that using finer resolutions can lead to more accurate LS values. In other words, the accuracy of LS values is largely influenced by the DEM resolution.
In terms of severity, and according to the classification proposed by [122], soil erosion can be classified as very low, low, moderate, high, very high, and severe (Table 7).
Importantly, most of the study area is considered protected, as most of the area had a soil loss considered low. Depending on the equation used, the severe erosion class in this area varied from 3.84 to 5.27% (Table 7).
Similarly, between 76.69 and 78.80% of this watershed area has a soil loss considered very low, as compared with 68.58% of the Rio de Janeiro watershed, located in the extreme west of Bahia [104]. Based on Table 6 and Table 7 and Figure 10, it is obvious that the soil erosion is only a nominal value that depends exclusively on each factor of RUSLE. These findings may also explain the uncertainties existing in the soil erosion calculation.

4.2. Uncertainty and Global Sensitivity of RUSLE Parameters

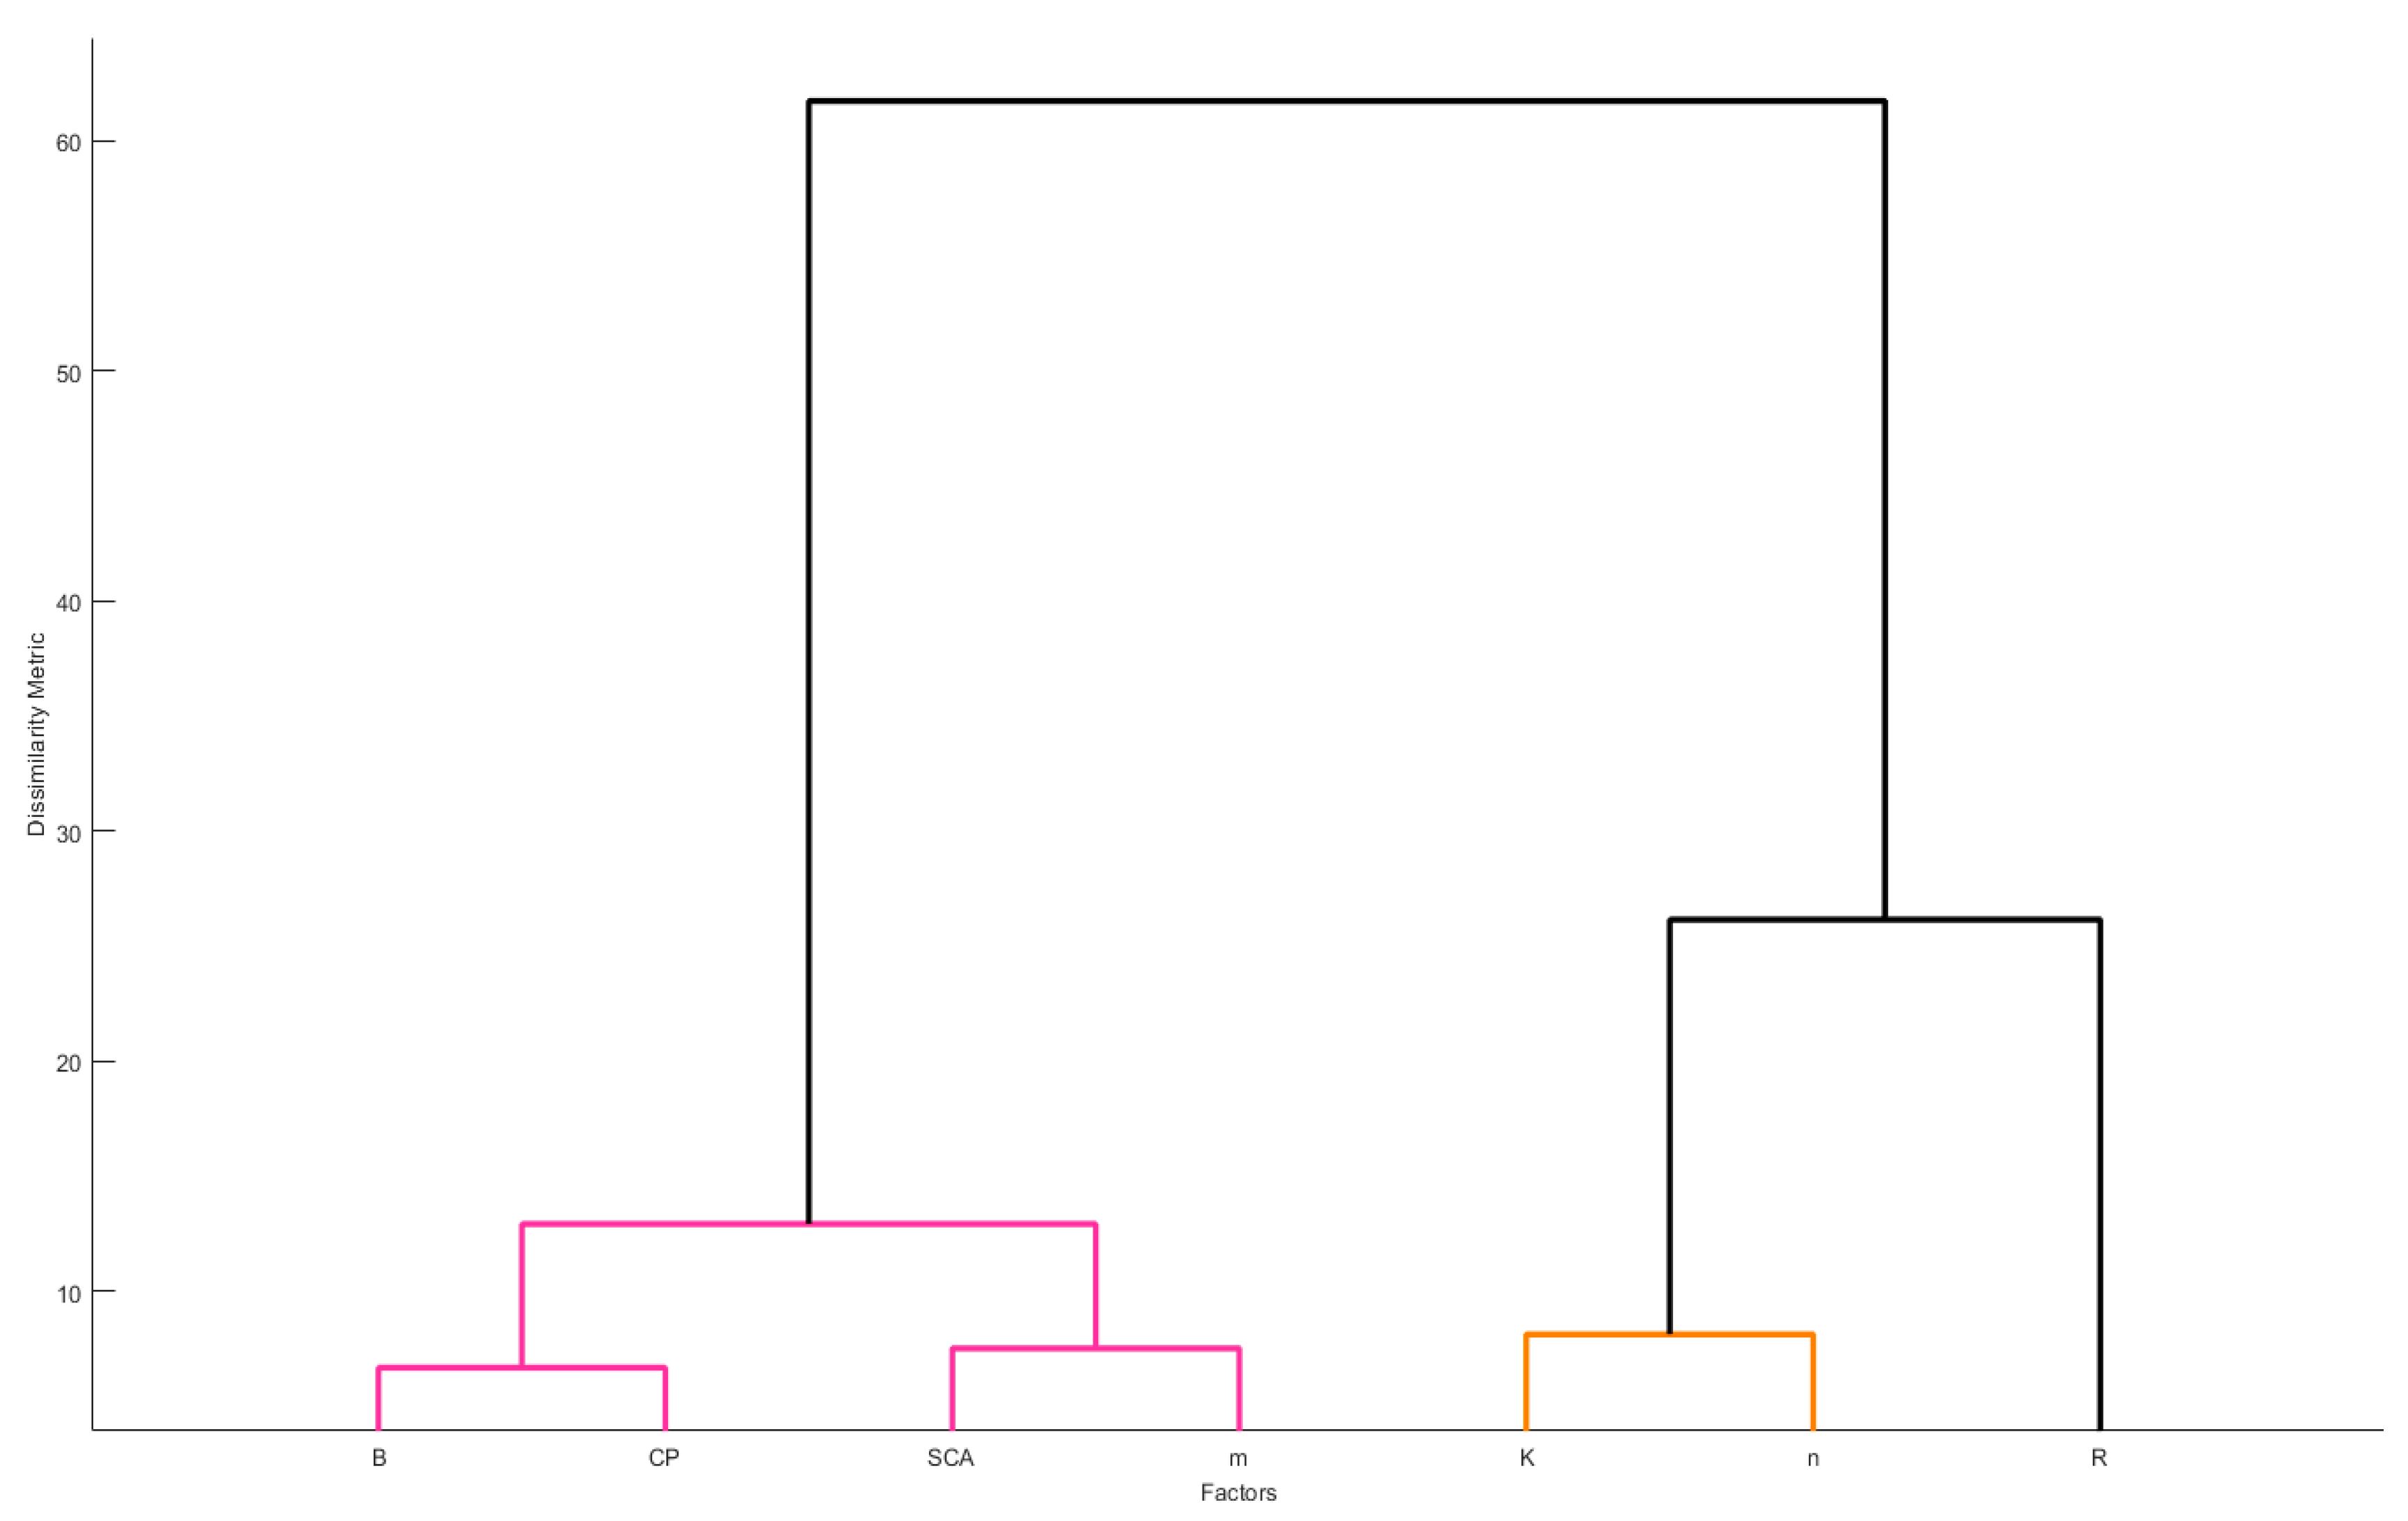
The global sensitivity of the RUSLE factors using VARS showed the importance of each one of them and intrinsically of the parameters of the LS factor (β, m, n, SCA) (Figure 11 and Figure 12) and all the possible soil erosion equations used. The GSA showed that the slope angle (β) was the most sensitive parameter. This result is in line with other studies in the literature, indicating that slope steepness is more sensitive than slope length to the LS factor used in the assessment of soil erosion [42,123]. This study demonstrated that m and n affect the value of LS. Evidently, the sensitivity ranking of LS parameters is as follows (from higher sensitivity to lower): slope angle (β also referred as B in the figures), SCA, n, and m. In terms of GSA, the parameters of RUSLE had the same order of importance when using Equations (4a) and (5) (Figure 11 and Figure 12). One of the reasons that may explain that is because the value of m in both equations is approximately equal (0.5 and 0.48). Conversely, the GSA of RUSLE parameters using Equation (4b) had a different ranking (β, m, CP, SCA, K, n, and R) than the other two. It is noted that, independently of the equation used, we found that the R factor is the least influential parameter of RUSLE. It is noteworthy that the colors (red, pink, and orange) in the dendrogram do not have any special meaning in terms of sensitivity or uncertainty in this study. They are automatically generated by VARS to help distinguish groups of variables using the so-called “elbow method” [124].
Moreover, the GSA showed the importance order of the other parameters as follows: CP, K, and R (Figure 11 and Figure 12). The discrepancies between the minimum and maximum values of each factor can be one of the reasons for the importance of the parameter order. These values vary along with m and n, as the equations used for the LS calculations were all non-linear. These results provide an uncertainty range for the potential soil loss.
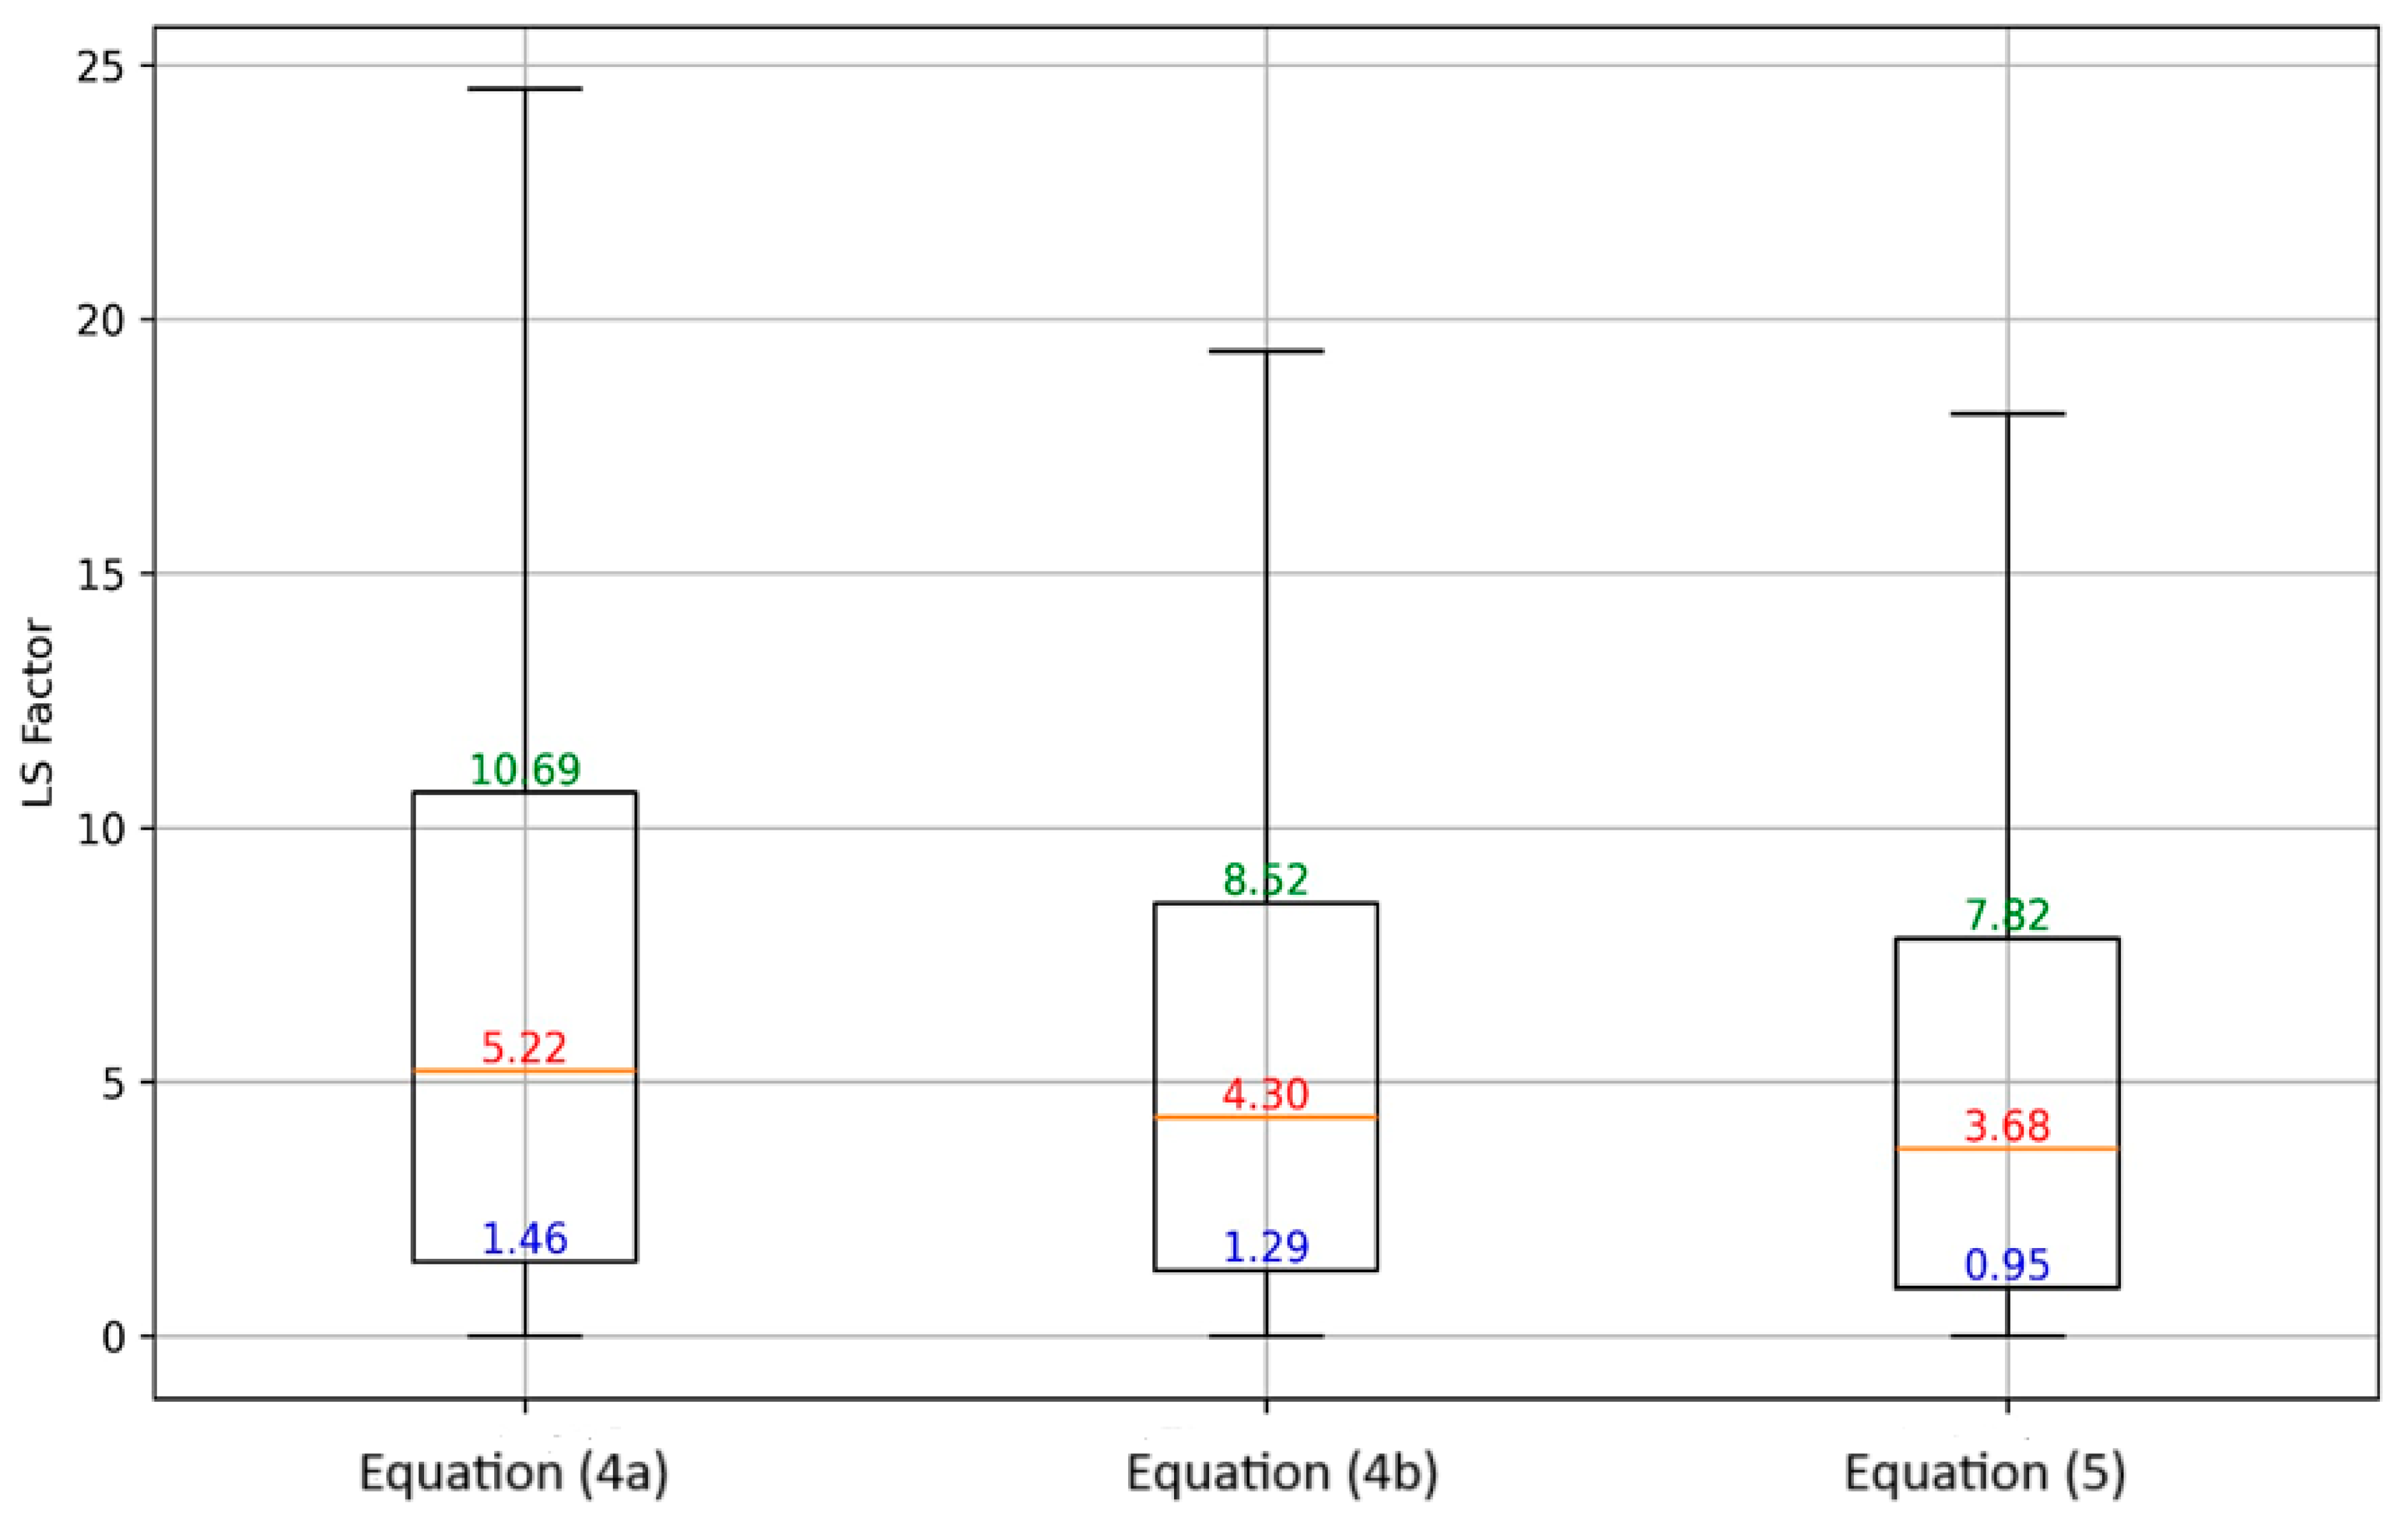
The range of LS values based on VARS sampling is introduced in Figure 13. The sample size of each boxplot corresponds to the total number of pixels available for the calculation. In the boxplots, blue, red, and green values correspond to the second quartile, median, and third quartile in the distribution, respectively.
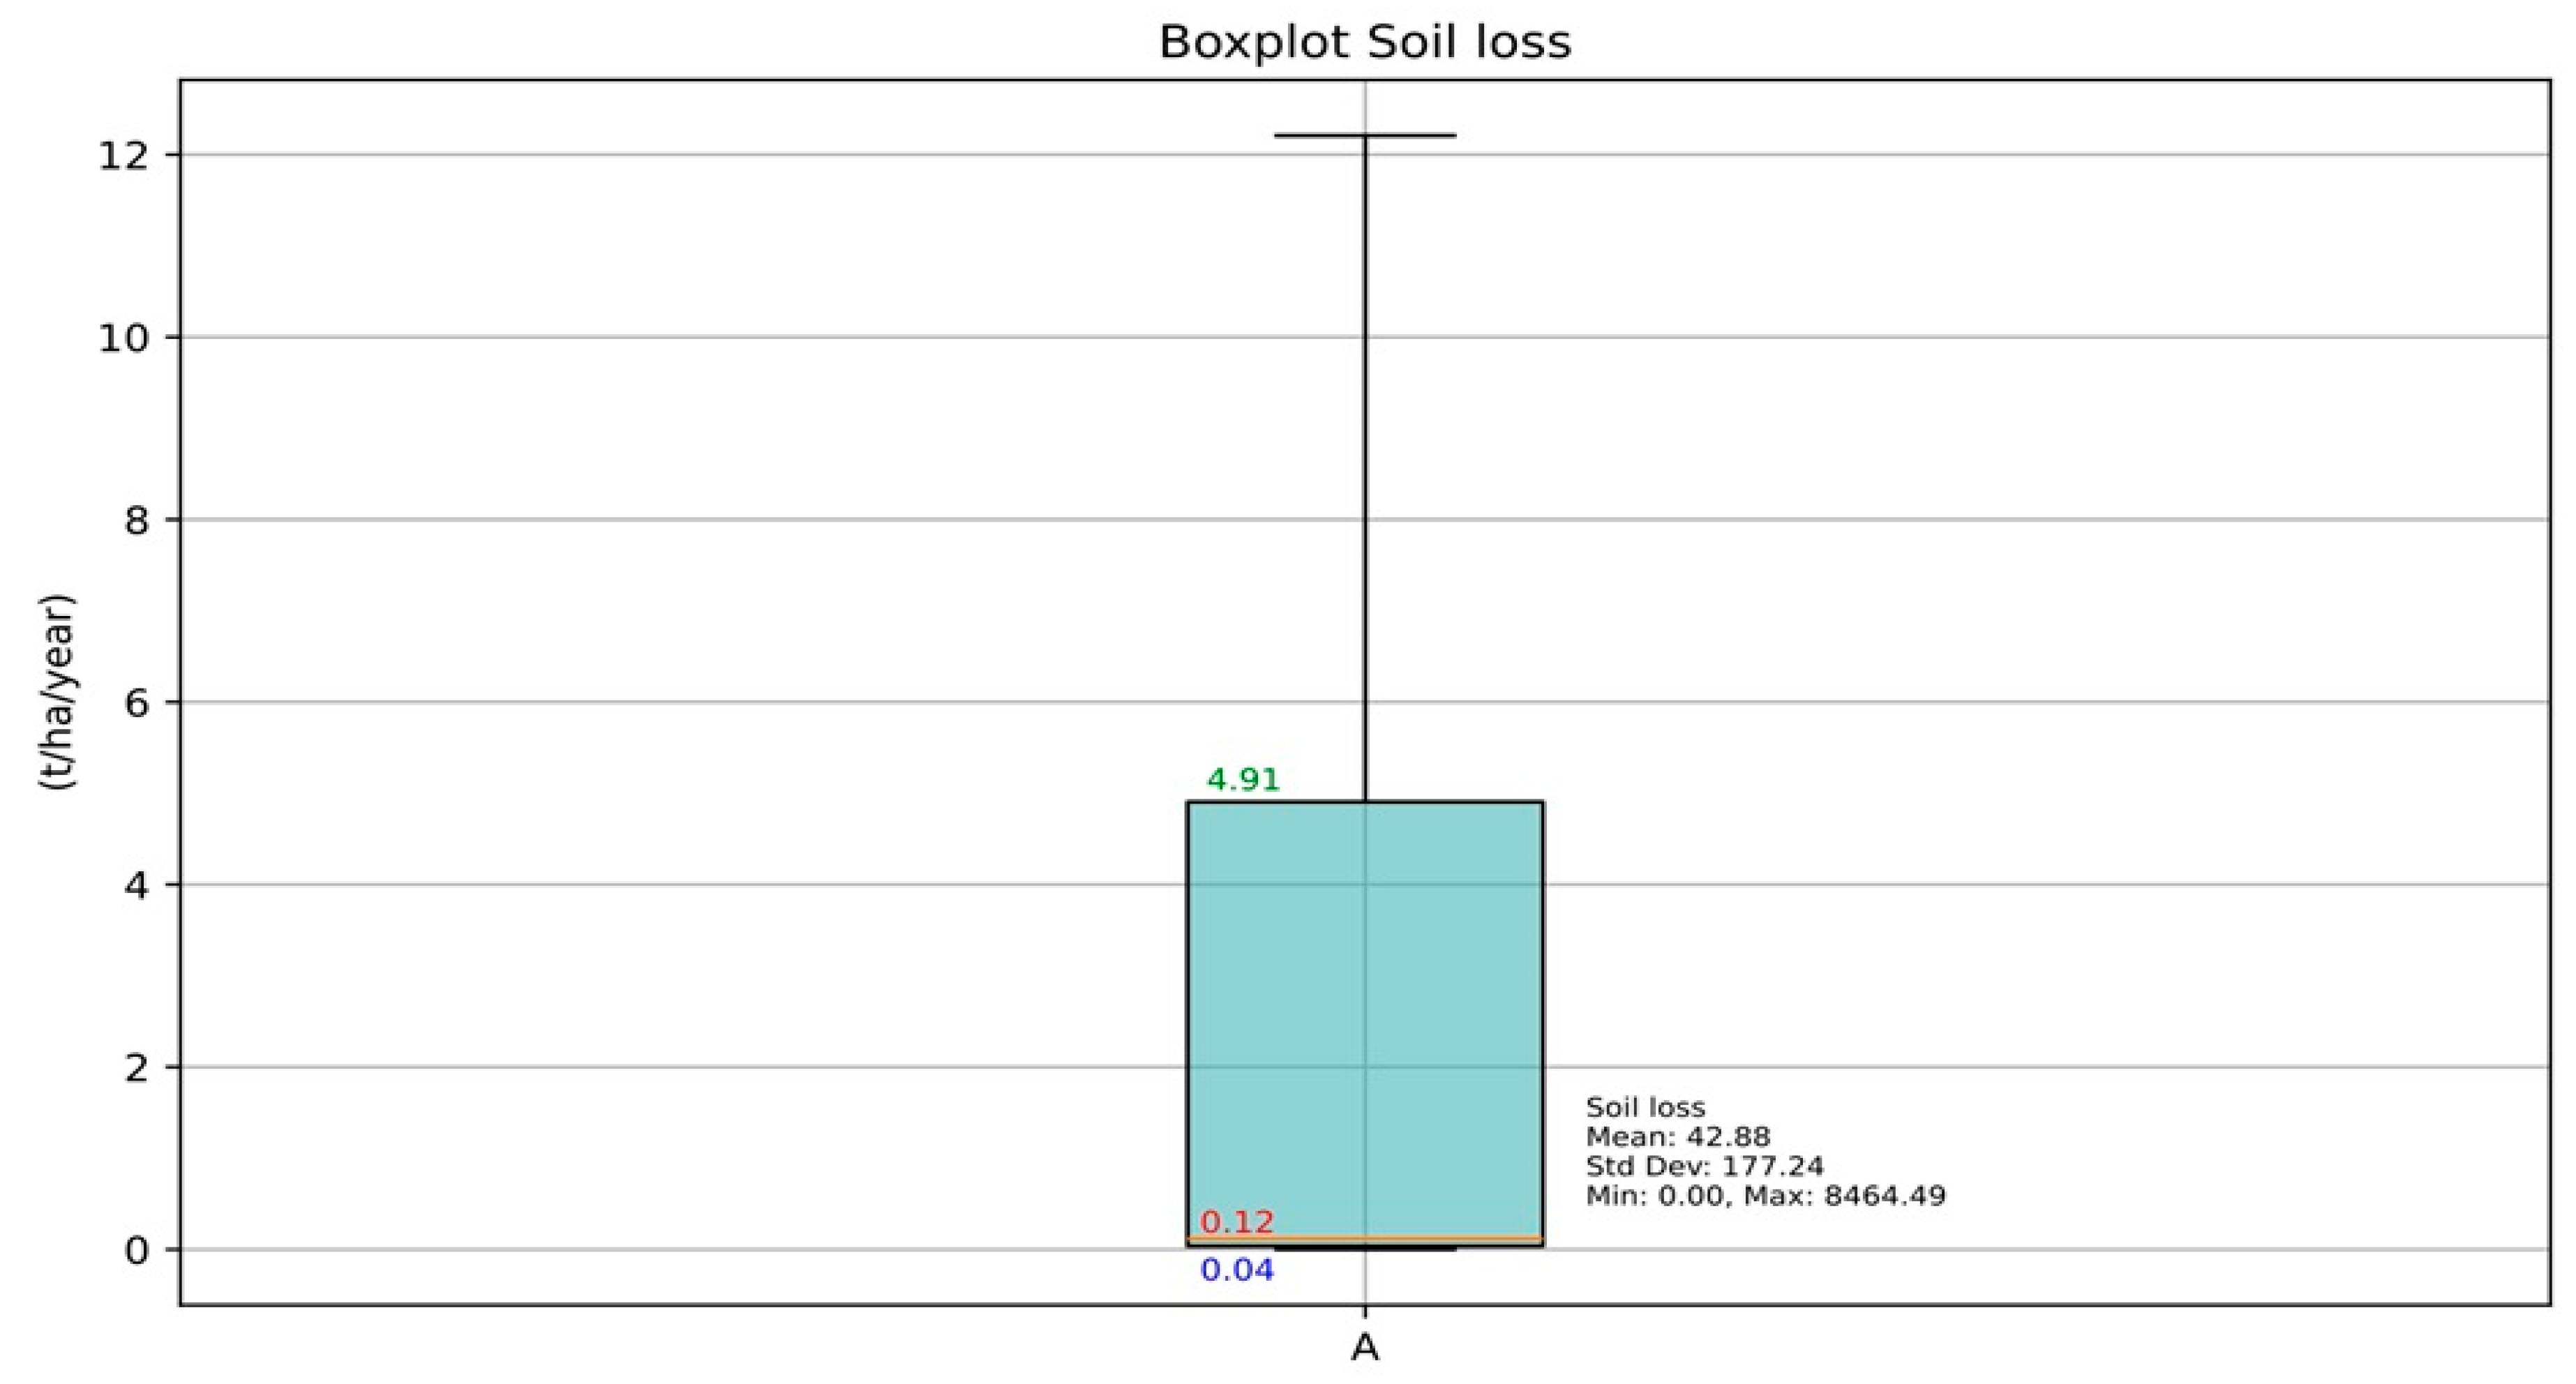
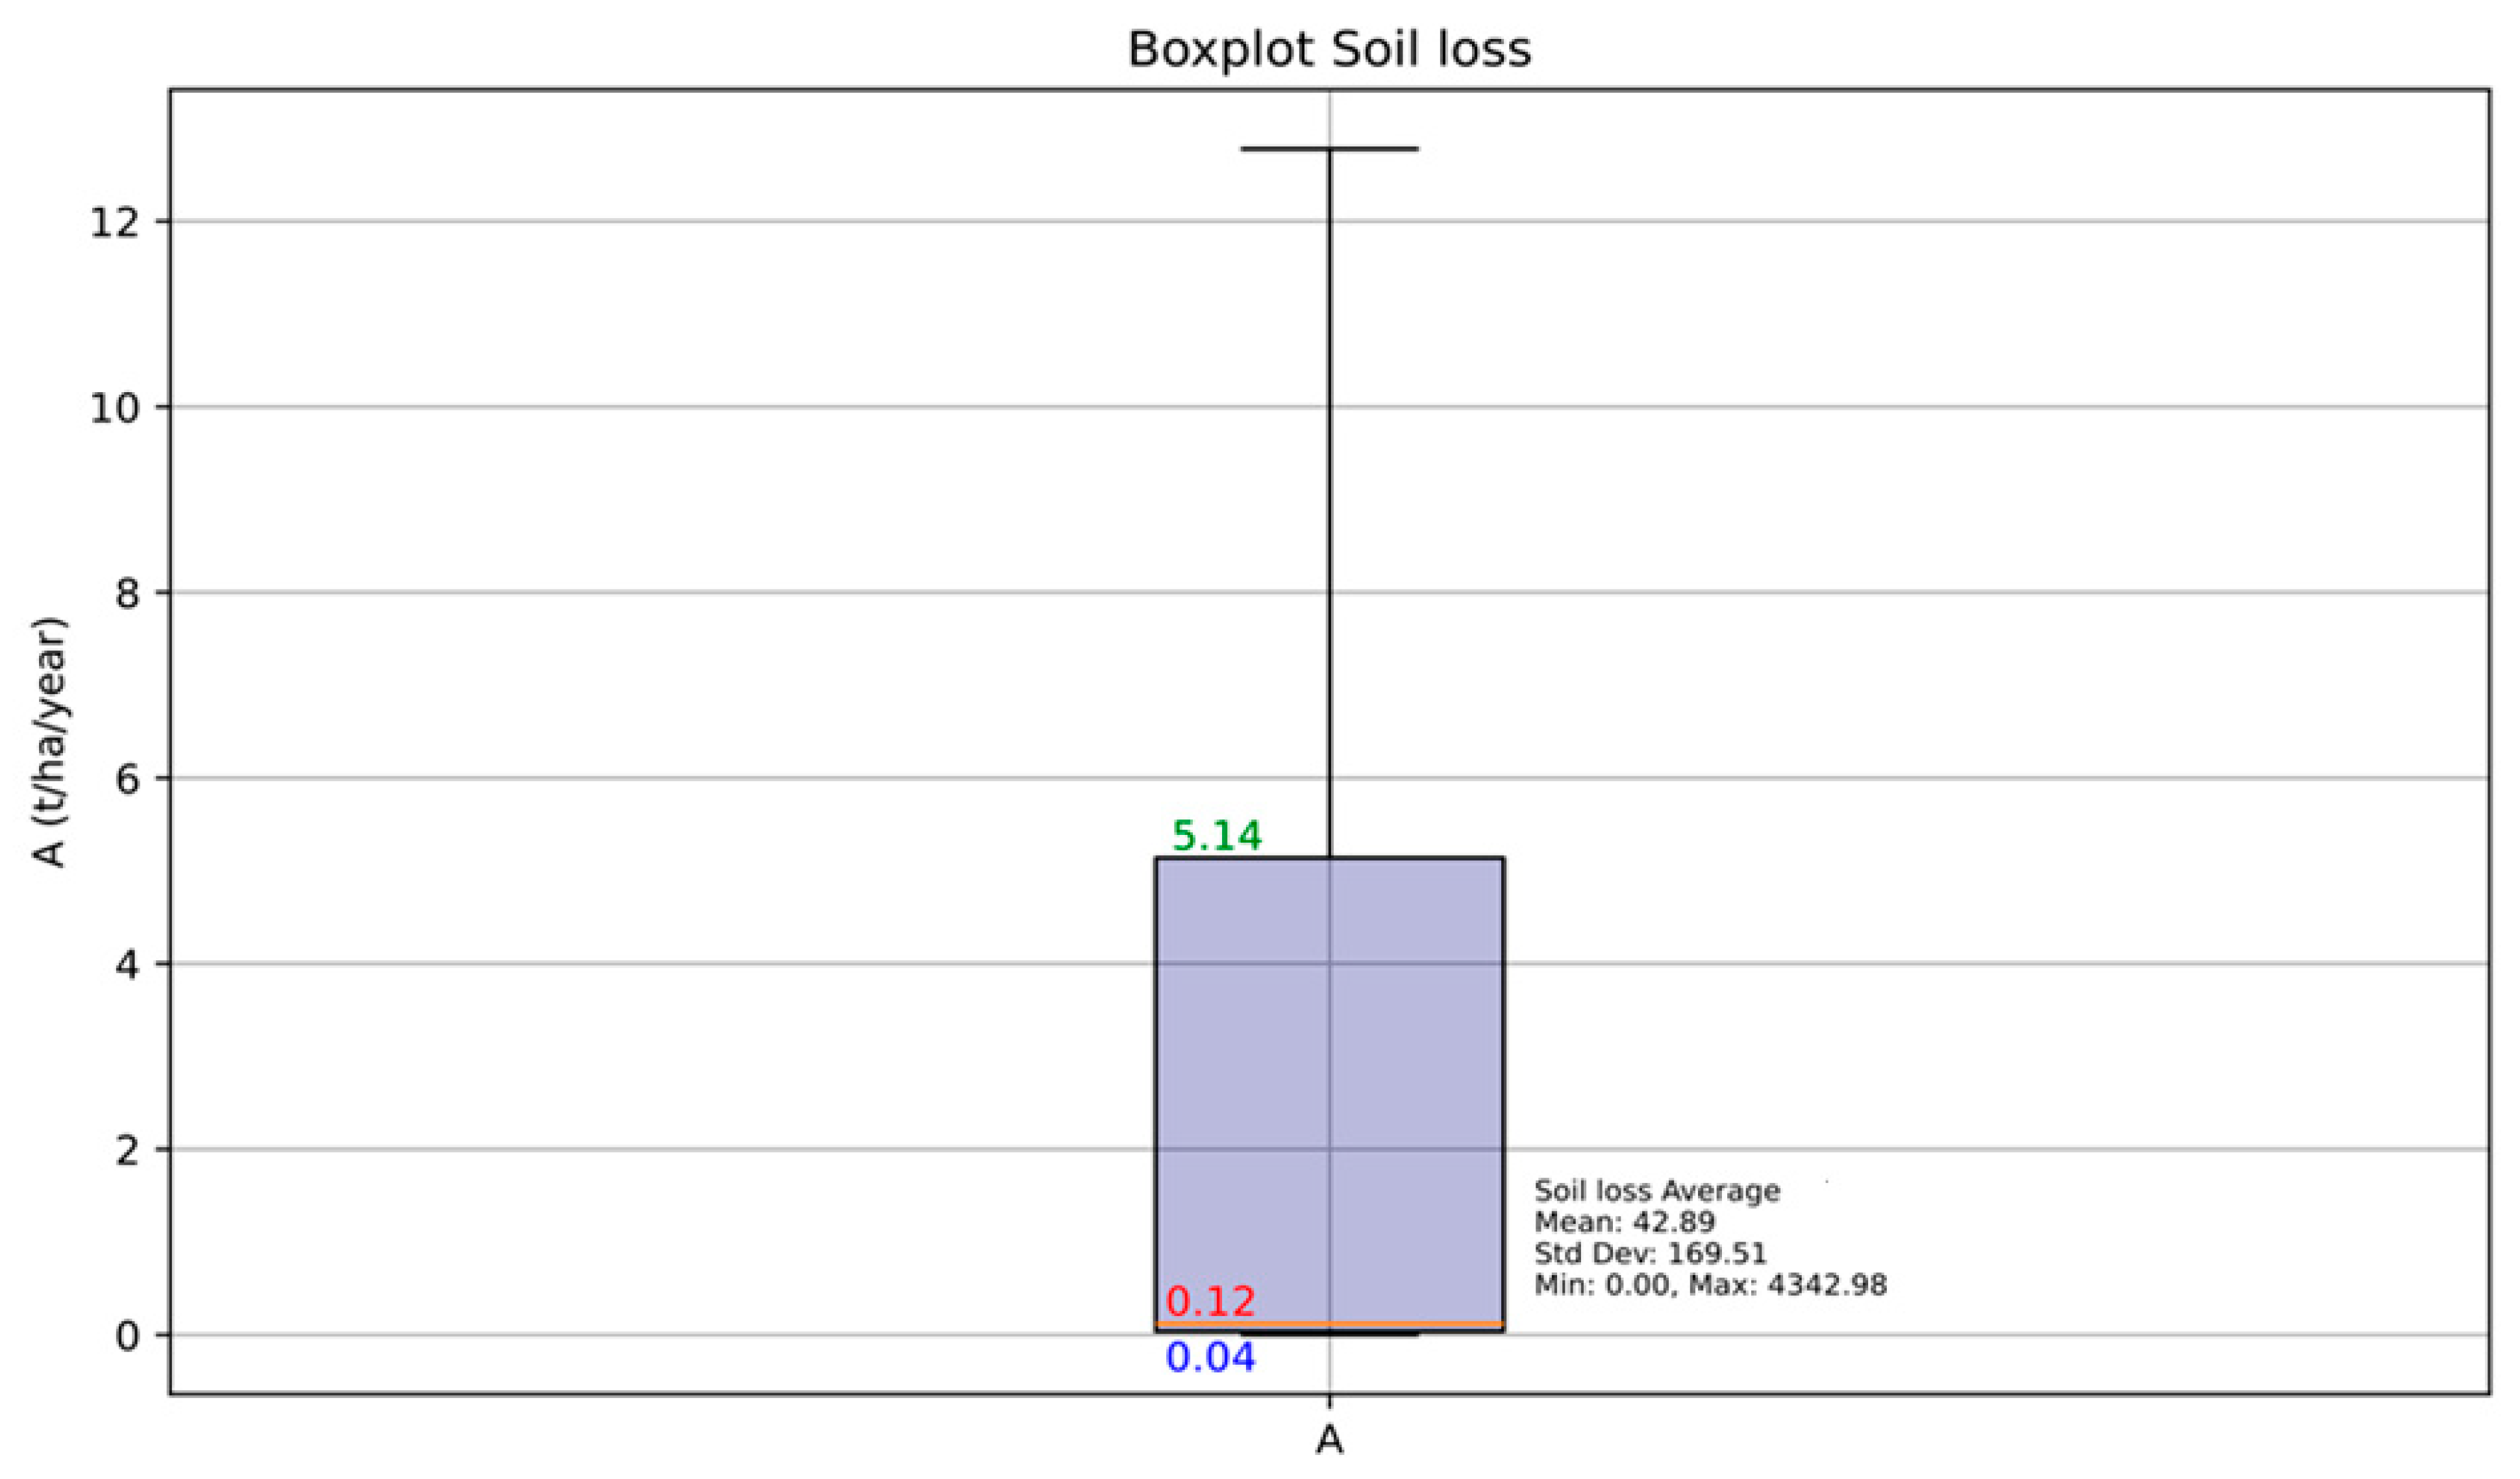
Each box represents the interquartile range (IQR), with the median indicated by a horizontal line. It is noted that the whiskers extend up to 1.5 times the IQR above and below the box, and individual values, or ‘outliers’, have been eliminated for easier visualization. All possible combinations of LS, CP, K, and R values are considered and specified in Table 2. The value of the soil loss was individually calculated for each pixel. The boxplot illustrates the distribution of all the results obtained for the 27,799 pixels contained in the 4600 maps (matrices). The results shown in Figure 14 correspond to those obtained using LS Equation (4a). The results of Method 2 showed that the average value of all pixels within the watershed boundaries ranged from 0 to 4342.98 t/ha/year (Figure 15). This result is lower compared to that of a study conducted in the Indaiá watershed in Mato Grosso do Sul, Brazil, where soil erosion ranged from 0 to 4082.16 t/ha/year [125]. Notably, the results of Method 2 were calculated using the LS Equation (4a) (see Table 4). To better illustrate the distribution of soil erosion values, Figure 16 presents the boxplot of the average values without considering outliers. The range of soil losses calculated through the application of VARS is quite large because it includes all possible outcomes, whereas the soil losses performed by QGIS were based on a pixel-by-pixel calculation.
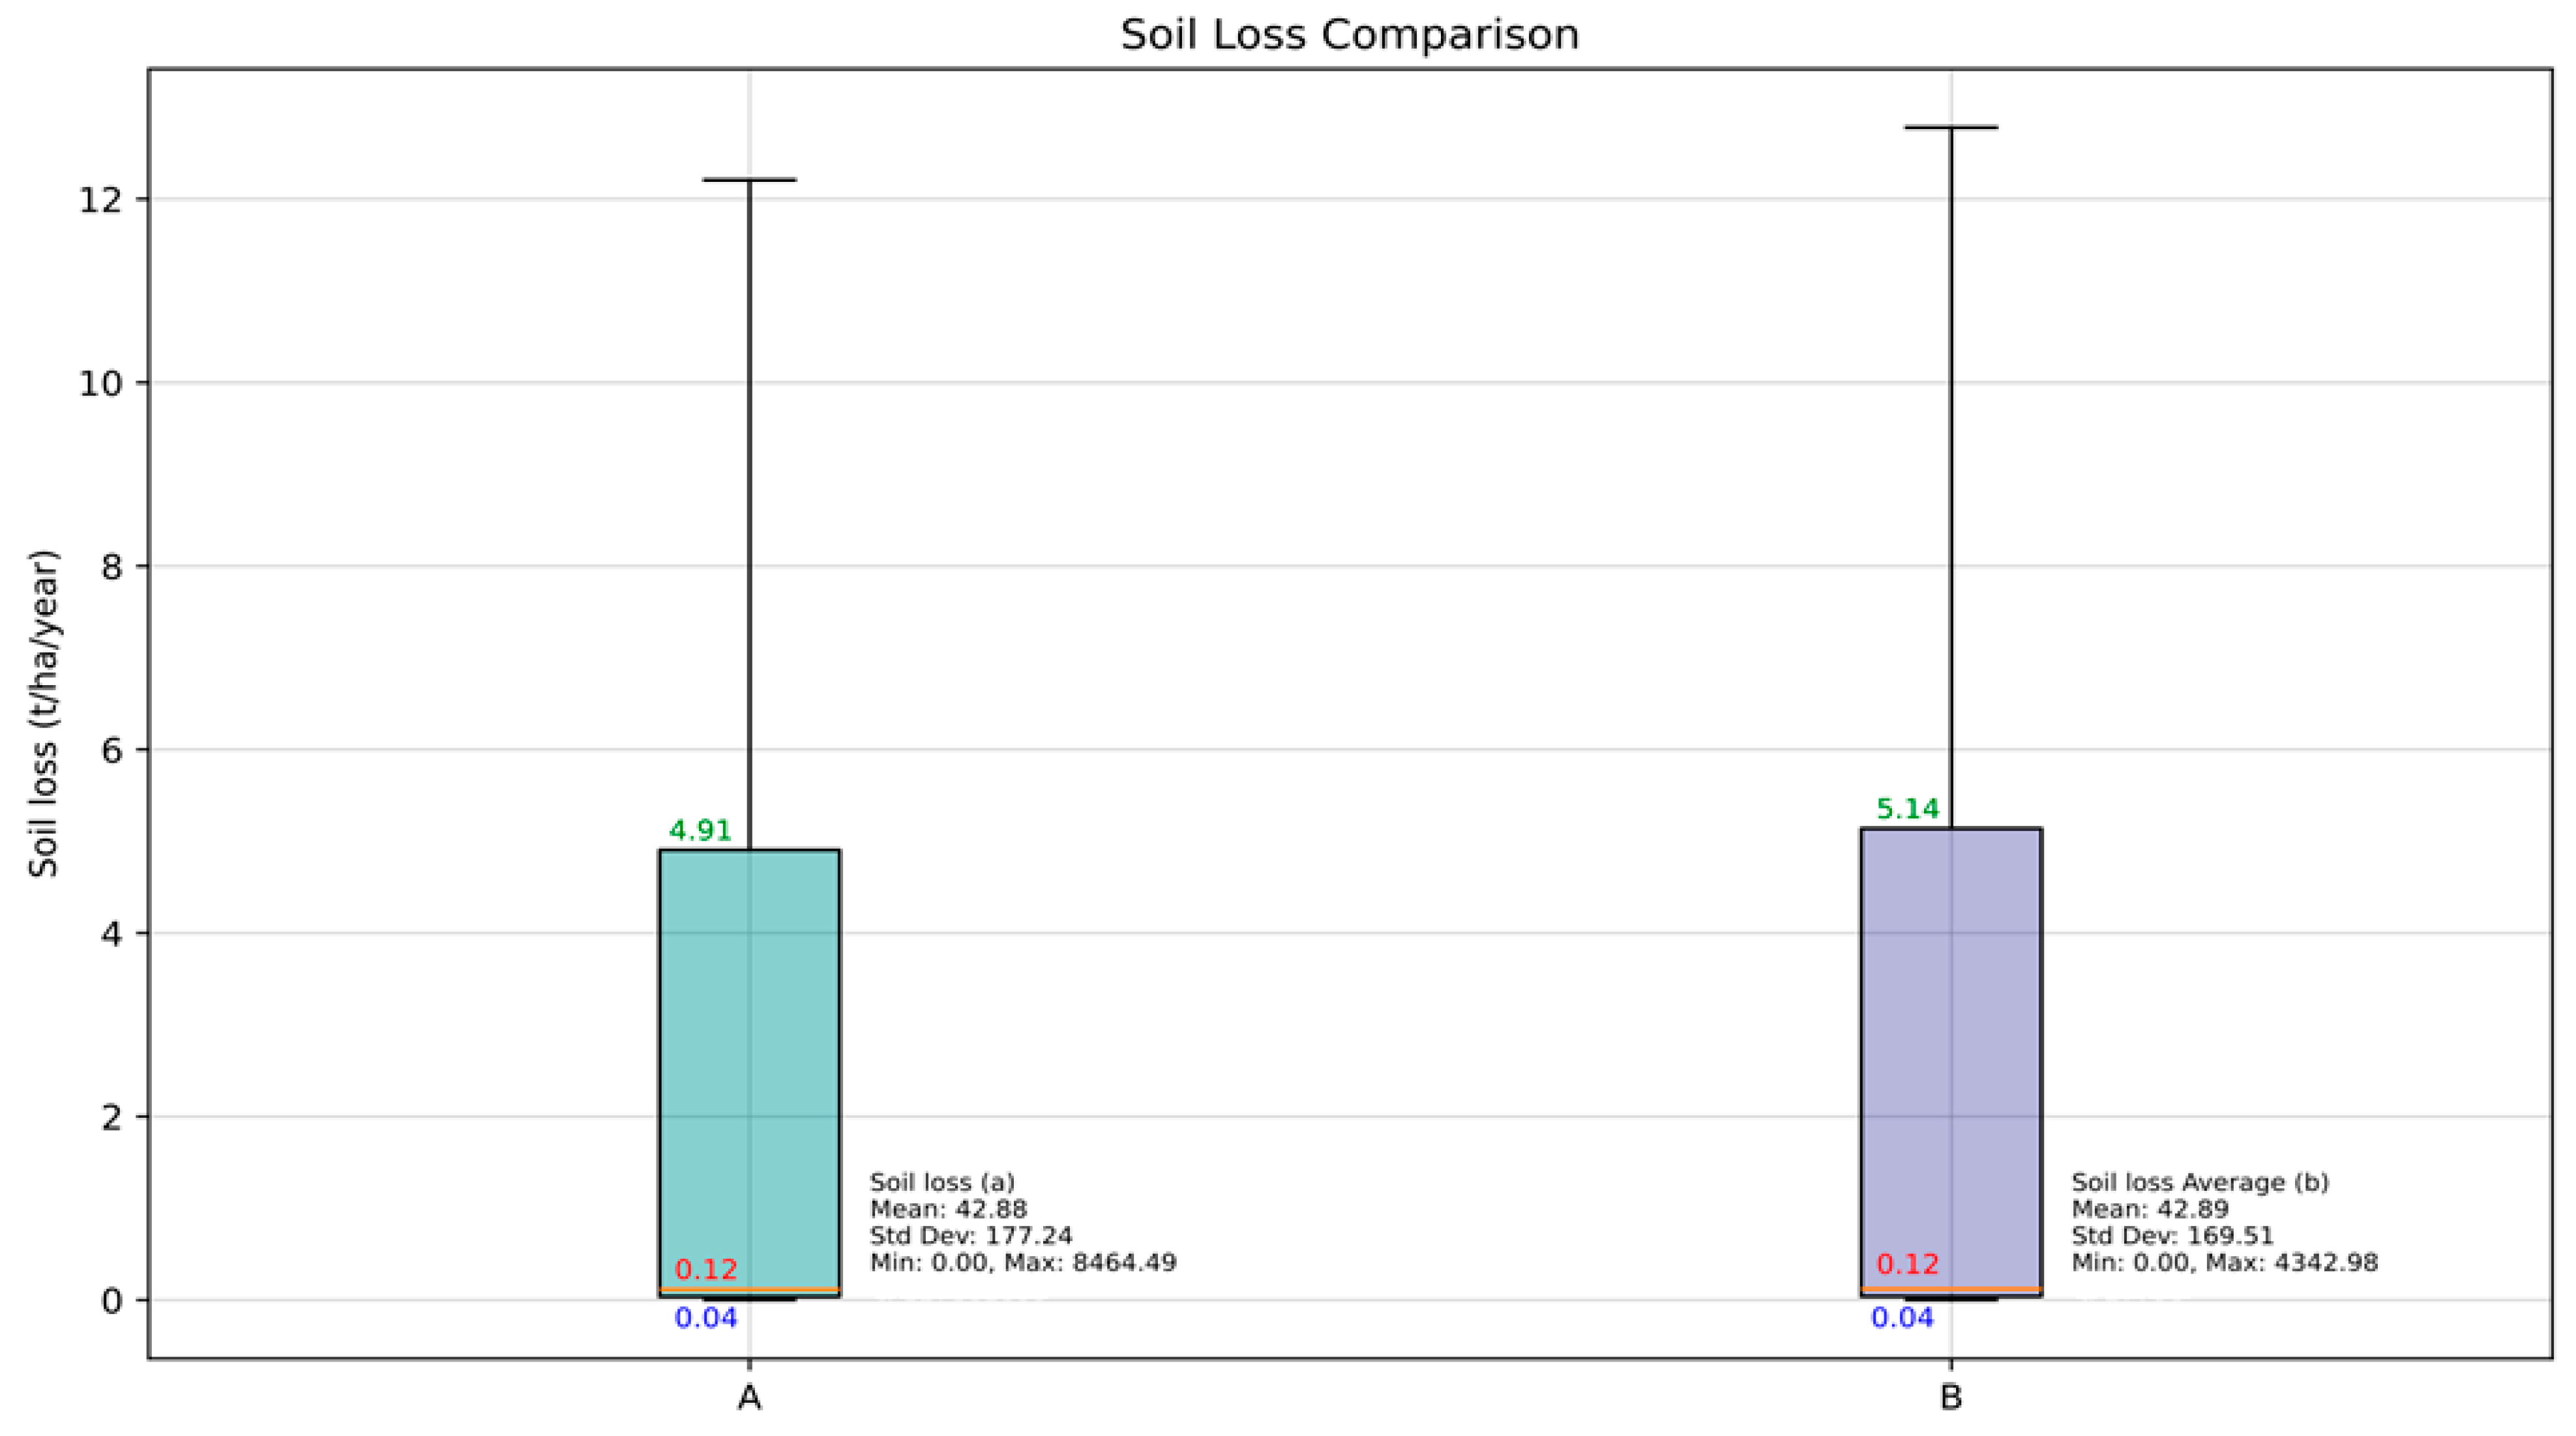
Based on the results of Method 2 and Figure 17, it was found that the average of the soil loss between the second and third quartile values varied from 0.04 to 5.14 t/ha/year. Comparing the distribution of soil erosion values and all the results obtained using Method 1 with that of Method 2 using the LS Equation (4a), we found that the latter led to a higher soil loss average, as shown in Figure 17. Finally, using Method 1, we compared the results of the three LS equations (Equations (4a), (4b) and (5)) (Figure 18).
The median given each LS calculation is as follows: Equation (4a) > Equation (4b) > Equation (5) (Figure 18). Such a finding may indicate that a soil loss value estimated using Equation (5) has a lower uncertainty level compared with that of Equations (4a) and (4b). In other words, the data dispersions of soil loss displayed by Equation (4a) are less regrouped around the median compared to those of Equations (4b) and (5), as shown in Figure 18. The boxplot labeled ‘nominal’ represents the data distribution generated using the QGIS method for soil loss assessment. In terms of average soil losses calculated using VARS, 42.88, 35.12, and 30.47 t/ha/year were found for Equations (4a), (4b) and (5), respectively. These results align with a field study conducted in the Santa Rita watershed (9.10 km2), located in the southern region of Rio Grande do Sul, Brazil, where soil loss was estimated to be 35.94 t/ha/year [126]. The severity classes of the soil erosion calculated via VARS were categorized as weak, moderate, medium, strong, and very strong, as classified by [122], as shown Table 8.
The results introduced in Table 8 show that only 6.35%, 6.02%, and 5.35% of the Pardo River watershed have soil loss severity considered severe when using LS Equations (4a), (4b) and (5), respectively. These results indicate that the percentage of soil loss in a watershed varies depending on the equation used for LS factor calculation, as well as the severity range used to categorize the soil loss. In terms of soil loss severity, the percentages of soil loss obtained using the LS Equation (4a) (6.35%), Equation (4b) (6.02%), and Equation (5) (5.35%)) in this study are higher than those obtained in the Verdinho River watershed, Southwestern Goiás, which was 3.17% [127]. As anticipated, regarding the uncertainty of soil loss severity, the soil loss rate calculated using both QGIS and VARS conveys the same order (Equation (4a) > Equation (4b) > Equation (5)). Additionally, considering all the calculation methods used in this study, no more than 6.35% of the Pardo River watershed experienced soil loss categorized as severe.

5. Conclusions

The average soil erosion calculated via QGIS ranged from 21.52 to 29.77 t/ha/year, whereas the mean of the soil loss estimated via VARS ranged from 30.47 to 42.88 t/ha/year, depending on the equation used for the LS factor. A global sensitivity analysis indicated that the slope angle (β) is the most sensitive parameter, followed by the CP factor, SCA, m, K factor, n, and R factor. It is noteworthy that β, m, n, and SCA are all parameters of the LS factor. The novelty of this study, as compared with others, is the sensitivity analysis of m and n, which is often neglected while it was highlighted that, in the end, they can substantially influence the potential soil erosion estimation. As far as the sensitivity of the parameters of three formulations of the LS factor go, they are in the following order of importance: β, SCA, m, and n. Moreover, the results of this study showed that the soil erosion rate calculated using QGIS is only an estimated (so-called nominal) value that can be put in perspective using a global sensitivity analysis (conducted here using VARS), and that it depends on the equation used and how each parameter of the RUSLE model is calculated, particularly the LS factor. In conclusion, our findings may help assess the uncertainty of any soil erosion assessment, considering the variability of m and n, particularly.

Supplementary Materials

The following supporting information can be downloaded at: https://www.mdpi.com/article/10.3390/soilsystems8040125/s1, Figure S1a: Method 1 for soil loss assessment based on VARS sampling, with CP values ranging from 0 to 0.15; Figure S1b: Method 2 for soil loss assessment based on VARS sampling, with CP values ranging from 0 to 0.15; Figure S1c: Comparison of Equations (4a), (4b) and (5) for soil loss assessment based on VARS sampling; Figure S1d: Comparison of Equations (4a), (4b) and (5) for soil loss assessment based on VARS sampling, with CP values ranging from 0 to 1.

Author Contributions

Conceptualization, M.F., E.M.-N. and A.N.R.; methodology, M.F., A.N.R., U.C.d.O., E.M.-N. and C.A.G.; software, M.F. and C.A.G.; validation, M.F., E.M.-N., A.N.R., C.A.G. and U.C.d.O.; formal analysis, M.F. and C.A.G.; investigation, M.F.; resources, E.M.-N.; data curation, M.F. and C.A.G.; writing—original draft preparation, M.F.; writing—review and editing, M.F. and A.N.R.; visualization, M.F., A.N.R. and C.A.G.; supervision, E.M.-N. and A.N.R.; project administration, E.M.-N.; funding acquisition, E.M.-N. All authors have read and agreed to the published version of the manuscript.

Funding

This research was funded by the National Council for Scientific and Technological Development—CNPq (Grant No. 142018/2020-1) and M.F. was awarded a scholarship from the Brazilian Federal Agency for Support and Evaluation of Graduate Education—CAPES, an agency under the Ministry of Education of Brazil, in order to conduct part of his doctoral research as a Visiting Student at Institut national de la recherche scientifique (INRS), Centre Eau Terre Environnement.

Institutional Review Board Statement

Not applicable.

Informed Consent Statement

Not applicable.

Data Availability Statement

All relevant data are included in the paper; further inquiries can be directed to the corresponding author.

Conflicts of Interest

The authors declare no conflicts of interest. The funder had no role in the design of the study; in the collection, analyses, or interpretation of data; in the writing of the manuscript; or in the decision to publish the results.

References

  1. Fernández-Raga, M.; Palencia, C.; Keesstra, S.; Jordán, A.; Fraile, R.; Angulo-Martínez, M.; Cerdà, A. Splash erosion: A review with unanswered questions. Earth Sci. Rev. 2017, 171, 463–477. [Google Scholar] [CrossRef]
  2. Hajigholizadeh, M.; Melesse, A.M.; Fuentes, H.R. Raindrop-induced erosion and sediment transport modeling in shallow waters: A review. J. Soil Water Sci. 2018, 1, 15–25. [Google Scholar]
  3. Lal, R. Restoring soil quality to mitigate soil degradation. Sustainability 2015, 7, 5875–5895. [Google Scholar] [CrossRef]
  4. Cárceles Rodríguez, B.; Durán-Zuazo, V.H.; Soriano Rodríguez, M.; García-Tejero, I.F.; Gálvez Ruiz, B.; Cuadros Tavira, S. Conservation Agriculture as a Sustainable System for Soil Health: A review. Soil Syst. 2022, 6, 87. [Google Scholar] [CrossRef]
  5. Polidoro, J.C.; De Freitas, P.L.; Hernani, L.C.; Anjos, L.H.C.D.; Rodrigues, R.D.A.R.; Cesário, F.V.; Andrade, A.G.D.; Ribeiro, J.L. Potential impact of plans and policies based on the principles of conservation agriculture on the control of soil erosion in Brazil. Land Degrad Dev. 2021, 32, 3457–3468. [Google Scholar] [CrossRef]
  6. Baskan, O.; Dengiz, O. Comparison of traditional and geostatistical methods to estimate soil erodibility factor. Arid Land Res. Manag. 2008, 22, 29–45. [Google Scholar] [CrossRef]
  7. Den Biggelaar, C.; Lal, R.; Wiebe, K.; Breneman, V. Impact of Soil Erosion on Crop Yields in North America. In Advances in Agronomy; Elsevier: Amsterdam, The Netherlands, 2001; pp. 1–52. [Google Scholar]
  8. Telles, T.S.; Guimarães, M.D.F.; Dechen, S.C.F. The costs of soil erosion. Rev. Bras. Ciênc. Solo 2011, 35, 287–298. [Google Scholar] [CrossRef]
  9. Gupta, G.S. Land degradation and challenges of food security. Rev. Eur. Stud. 2019, 11, 63–72. [Google Scholar] [CrossRef]
  10. Tabarelli, M.; Pinto, L.P.; Silva, J.M.C.; Hirota, M.; Bedê, L. Challenges and Opportunities for Biodiversity Conservation in the Brazilian Atlantic Forest. Conserv. Biol. 2005, 19, 695–700. [Google Scholar] [CrossRef]
  11. Gaspar, M.D.; DeBlasis, P.; Fish, S.K.; Fish, P.K. Sambaqui (shell mound) societies of coastal Brazil. In Handbook of South American Archaeology; Silverman, E., Isbell, W.H., Eds.; Springer: New York, NY, USA, 2008; pp. 319–338. [Google Scholar]
  12. Costa, D.P.; Faria, C.P. Conservation priorities for the bryophytes of Rio de Janeiro State, Brazil. J. Biol. 2008, 30, 133–142. [Google Scholar] [CrossRef]
  13. Scarano, F.R.; Ceotto, P. Brazilian Atlantic Forest: Impact, vulnerability, and adaptation to climate change. Biodivers. Conserv. 2015, 24, 2319–2331. [Google Scholar] [CrossRef]
  14. Salem, H.M.; Valero, C.; Muñoz, M.Á.; Gil-Rodríguez, M.; Barreiro, P. Effect of reservoir tillage on rainwater harvesting and soil erosion control under a developed rainfall simulator. Catena 2014, 113, 353–362. [Google Scholar] [CrossRef]
  15. Ibrahim, G.R.F.; Rasul, A.; Ali Hamid, A.; Ali, Z.F.; Dewana, A.A. Suitable site selection for rainwater harvesting and storage case study using Dohuk Governorate. Water 2019, 11, 864. [Google Scholar] [CrossRef]
  16. Carvalho Junior, W.; Loireau, M.; Fargette, M.; Calderano Filho, B.; Wélé, A. Correlation between soil erodibility and satellite data on areas of current desertifcation: A case study in Senegal. Rev. Ciênc. Tróp. 2017, 41, 51–66. [Google Scholar]
  17. Prosser, I.P.; Williams, L. The effect of wildfire on runoff and erosion in native eucalyptus forest. Hydrol. Processes 1998, 12, 251–265. [Google Scholar] [CrossRef]
  18. Santos, G.J.Y.; Nascimento, R.Q. Efeitos das alterações no uso e ocupação do solo nas perdas de solo da bacia do rio de janeiro, oeste da Bahia: Effects of changes in soil use and occupation on soil losses in the Rio de Janeiro basin, West of Bahia. Bol. Goia. Geogr. 2021, 41, e65397. [Google Scholar]
  19. Panagos, P.; Ballabio, C.; Borrelli, P.; Meusburger, K.; Klik, A.; Rousseva, S.; Tadić, M.P.; Michaelides, S.; Hrabalíková, M.; Olsen, P.; et al. Rainfall erosivity in Europe. Sci. Total Environ. 2015, 511, 801–814. [Google Scholar] [CrossRef]
  20. Panagos, P.; Ballabio, C.; Borrelli, P.; Meusburger, K. Spatio-temporal analysis of rainfall erosivity and erosivity density in Greece. Catena 2016, 137, 161–172. [Google Scholar] [CrossRef]
  21. Riquetti, N.B.; Mello, C.R.; Beskow, S.; Viola, M.R. Rainfall erosivity in South America: Current patterns and future perspectives. Sci. Total Environ. 2020, 724, 138315. [Google Scholar] [CrossRef]
  22. Ganasri, B.P.; Ramesh, H. Assessment of soil erosion by RUSLE model using remote sensing and GIS—A case study of Nethravathi Basin. Geosci. Front. 2016, 7, 953–961. [Google Scholar] [CrossRef]
  23. Efthimiou, N. The new assessment of soil erodibility in Greece. Soil Tillage Res. 2020, 204, 104720. [Google Scholar] [CrossRef]
  24. Gashaw, T.; Tulu, T.; Argaw, M. Erosion risk assessment for prioritization of conservation measures in Geleda watershed, Blue Nile basin, Ethiopia. Environ. Syst. Res. 2018, 6, 1–14. [Google Scholar] [CrossRef]
  25. Millward, A.A.; Mersey, J.E. Adapting the RUSLE to model soil erosion potential in a mountainous tropical watershed. Catena 1999, 38, 109–129. [Google Scholar] [CrossRef]
  26. Desmet, P.J.; Govers, G. A GIS-procedure for the automated calculation of the USLE LS-factor on topographically complex landscape units. J. Soil Water Conserv. 1996, 51, 427–433. [Google Scholar]
  27. Zhang, G.; Liu, B.; Liu, G.; He, X.; Nearing, M.A. Detachment of undisturbed soil by shallow flow. Soil Sci. Soc. Am. J. 2003, 67, 713–719. [Google Scholar] [CrossRef]
  28. Nearing, M.A. A Single, Continuous function for slope steepness influence on soil loss. Soil Sci. Soc. Am. J. 1997, 61, 917–919. [Google Scholar] [CrossRef]
  29. Valle Júnior, R.F.D.; Galbiatti, J.A.; Martins Filho, M.V.; Pissarra, T.C.T. Potencial de erosão da bacia do Rio Uberaba. Eng. Agríc. 2010, 30, 897–908. [Google Scholar] [CrossRef]
  30. Mitasova, H.; Hofierka, J.; Zlocha, M.; Iverson, L.R. Modelling topographic potential for erosion and deposition using GIS. Int. J. Geogr. Inf. Syst. 1996, 10, 629–641. [Google Scholar] [CrossRef]
  31. Moore, I.D.; Burch, G.J. Modeling erosion and deposition: Topographic effects. Trans. ASAE. 1986, 29, 1624–1630. [Google Scholar] [CrossRef]
  32. Prasannakumar, V.; Shiny, R.; Geetha, N.; Vijith, H. Spatial prediction of soil erosion risk by remote sensing, GIS and RUSLE approach: A case study of Siruvani river watershed in Attapady valley, Kerala, India. Environ. Earth Sci. 2011, 64, 965–972. [Google Scholar] [CrossRef]
  33. Adewumi, J.R.; Akomolafe, J.K.; Ajibade, F.O. Development of flood prone area map for Igbokoda Township using geospatial technique. J. Appl. Sci. Process Eng. 2017, 4, 158–178. [Google Scholar] [CrossRef]
  34. Zhou, P.; Luukkanen, O.; Tokola, T.; Nieminen, J. Effect of vegetation cover on soil erosion in a mountainous watershed. Catena 2008, 75, 319–325. [Google Scholar] [CrossRef]
  35. Renard, K.G.; Ferreira, V.A. RUSLE model description and database sensitivity. J. Environ. Qual. 1993, 22, 458–466. [Google Scholar] [CrossRef]
  36. Krishna, A.P.R.; Lalitha, R.; Shanmugasundaram, K.; Nagarajan, M. Assessment of Topographical Factor (LS-Factor) Estimation Procedures in a Gently Sloping Terrain. J. Indian Soc. Remote Sens. 2019, 47, 1031–1039. [Google Scholar] [CrossRef]
  37. Khanifar, J.; Khademalrasoul, A. Multiscale comparison of LS factor calculation methods based on different flow direction algorithms in Susa Ancient landscape. Acta Geophys. 2020, 68, 783–793. [Google Scholar] [CrossRef]
  38. Das, S.; Bora, P.K.; Das, R. Estimation of slope length gradient (LS) factor for the sub-watershed areas of Juri River in Tripura. Model. Earth Syst. Environ. 2022, 8, 1171–1177. [Google Scholar] [CrossRef]
  39. Biesemans, J.; Meivenne, M.V.; Gabriels, D. Extending the RUSLE with Monte Carlo error propagation technique to predict long-term average off-site sediment accumulation. J. Soil Water conserv. 2000, 55, 35–42. [Google Scholar]
  40. Abd Aziz, S.; Steward, B.L.; Kaleita, A.; Karkee, M. Assessing the effects of DEM uncertainty on erosion rate estimation in an agricultural field. Trans. ASABE 2012, 55, 785–798. [Google Scholar] [CrossRef]
  41. Ren, S.-M.; Liang, Y.; Sun, B. Research on sensitivity for soil erosion evaluation from DEM and remote sensing data source of different map scales and image resolutions. Procedia Environ. Sci. 2011, 10, 1753–1760. [Google Scholar] [CrossRef]
  42. Wang, G.; Fang, S.; Shinkareva, S.; Gertner, G.Z.; Anderson, A.B. Spatial uncertainty in prediction of the topographical factor for the revised universal soil loss equation (RUSLE). Trans. ASAE 2002, 45, 109–118. [Google Scholar] [CrossRef]
  43. Lu, S.; Liu, B.; Hu, Y.; Fu, S.; Cao, Q.; Shi, Y.; Huang, T. Soil erosion topographic factor (LS): Accuracy calculated from different data sources. Catena 2020, 187, 104334. [Google Scholar] [CrossRef]
  44. Wu, S.; Li, J.; Huang, G. An evaluation of grid size uncertainty in empirical soil loss modeling with digital elevation models. Environ. Model. Assess. 2005, 10, 33–42. [Google Scholar] [CrossRef]
  45. Basaran, M.; Ozcan, A.U.; Erpul, G.C.; Anga, M.R. Spatial variability of organic matter and some soil properties of mineral topsoil in Çankiri Indagi blackpine (Pinus nigra) plantation region. J. Appl. Sci. 2006, 6, 445–452. [Google Scholar]
  46. Ozcan, A.U.; Erpul, G.; Basaran, M.; Erdogan, H.E. Use of USLE/GIS technology integrated with geostatistics to assess soil erosion risk in different land uses of Indagi Mountain Pass—Çankırı, Turkey. Environ. Geol. 2008, 53, 1731–1741. [Google Scholar] [CrossRef]
  47. Wang, G.; Gertner, G.; Liu, X.; Anderson, A. Uncertainty assessment of soil erodibility factor for revised universal soil loss equation. Catena 2001, 46, 1–14. [Google Scholar] [CrossRef]
  48. Torri, D.; Poesen, J.; Borselli, L. Predictability and uncertainty of the soil erodibility factor using a global dataset. Catena 1997, 31, 1–22. [Google Scholar] [CrossRef]
  49. Sakhraoui, F.; Hasbaia, M. Evaluation of the sensitivity of the RUSLE erosion model to rainfall erosivity: A case study of the Ksob watershed in central Algeria. Water Supply 2023, 23, 3262–3284. [Google Scholar] [CrossRef]
  50. Ayalew, D.A.; Deumlich, D.; Šarapatka, B.; Doktor, D. Quantifying the sensitivity of NDVI-Based C factor estimation and potential soil erosion prediction using spaceborne earth observation data. Remote Sens. 2020, 12, 1136. [Google Scholar] [CrossRef]
  51. Saltelli, A.; Chan, K.; Scott, E.M. Sensitivity Analysis. Wiley Series in Probability and Statistics, 1st ed.; Wiley: New York, NY, USA, 2000; p. 504. [Google Scholar]
  52. Saltelli, A.; Tarantola, S.; Campolongo, F.; Ratto, M. Sensitivity Analysis in Practice: A Guide to Assessing Scientific Models; John Wiley & Sons: New Delhi, India, 2004; pp. 1–219. [Google Scholar]
  53. Iooss, B.; Lemaître, P. A Review on Global Sensitivity Analysis Methods. In Uncertainty Management in Simulation-Optimization of Complex Systems; Operations Research/Computer Science Interfaces Series; Dellino, G., Meloni, C., Eds.; Springer: Boston, MA, USA, 2015; pp. 101–122. [Google Scholar]
  54. Saltelli, A. Global Sensitivity Analysis: An introduction. In Proceedings of the 4th International Conference on Sensitivity Analysis of Model Output (SAMO 2004), Santa Fe, NM, USA, 8–11 March 2005; pp. 1–43. [Google Scholar]
  55. Homma, T.; Saltelli, A. Importance measures in global sensitivity analysis of nonlinear models. Reliab. Eng. Syst. Saf. 1996, 52, 1–17. [Google Scholar] [CrossRef]
  56. Alvares, C.A.; Stape, J.L.; Sentelhas, P.C. Köppen’s climate classification map for Brazil. Meteorol. Z. 2013, 22, 711–728. [Google Scholar] [CrossRef]
  57. Medauar, C.C.; Menezes, A.A.; Ramos, A.; Galvão, M.Í.; De Assis Silva, S. Climatic characterization and evaluation of the need for supplementary irrigation for cacao in southern Bahia, Brazil. Agron. Colomb. 2020, 38, 272–279. [Google Scholar] [CrossRef]
  58. Silva, M.S.; Carvalho, T.S.; Santos, R.B.; Maffei, E.M.D.; Soares, B.D.F. Potencial genotóxico em amostras de água do Rio Pardo (Itapetinga/Ba) pelo teste Allium cepa L. In VIII Seagrus. Os Desafios para a Agricultura no Seculo XXI; UESB: Vitória da Conquista, Brazil, 2017; p. 5. [Google Scholar]
  59. Mapbiomas Brasil|Analise-de-Acuracia. Available online: https://brasil.mapbiomas.org/analise-de-acuracia/ (accessed on 4 November 2024).
  60. Renard, K.G.; Forester, G.R.; Weesies, G.A.; Mccool, D.K.; Yoder, D.C. Predicting soil erosion by water: A guide to conservation planning with the Revised Soil Loss Equation (RUSLE). In Agriculturae Handbook, 703; U.S. Department of Agriculture: Washington, DC, USA, 1997; p. 404. [Google Scholar]
  61. Barbosa, A.F.; Oliveira, E.F.; Mioto, C.L.; Paranhos Filho, A.C. The application of the universal soil loss equation by using free and available softwares. Anu. Inst. Geocienc. 2015, 38, 170. [Google Scholar] [CrossRef]
  62. Farhan, I.; Zregat, D.; Farhan, I. Spatial estimation of soil erosion risk using RUSLE approach, RS, and GIS techniques: A case study of Kufranja watershed, Northern Jordan. J. Water Resource Prot. 2013, 5, 1247–1261. [Google Scholar] [CrossRef]
  63. Shepard, D. A two-dimensional interpolation function for irregularly-spaced data. In Proceedings of the 1968 23rd ACM National Conference, New York, NY, USA, 27–29 August 1968; ACM Press: New York, NY, USA, 1968; pp. 517–524. [Google Scholar]
  64. Guisan, A.; Zimmermann, N.E. Predictive habitat distribution models in ecology. Ecol. Modell. 2000, 135, 147–186. [Google Scholar] [CrossRef]
  65. François, M.; Gonçalves Pontes, M.C.; De Vasconcelos, R.N.; De Oliveira, U.C.; Peixoto Da Silva, H.; Faria, D.; Mariano-Neto, E. Assessing soil erosion and its drivers in agricultural landscapes: A case study in southern Bahia, Brazil. J. Water Clim. Change 2024, 15, 3312–3327. [Google Scholar] [CrossRef]
  66. Cassol, E.A.; Eltz, F.L.F.; Martins, D.; Lemos, A.M.; Lima, V.S.; Bueno, A.C. Erosividade, padrões hidrológicos, período de retorno e probabilidade de ocorrência das chuvas em São Borja, RS. Rev. Bras. Ciênc. Solo 2008, 32, 1239–1251. [Google Scholar] [CrossRef]
  67. Silva, S.A.; Lima, J.S.S.; Souza, G.S.; Oliveira, R.B. Variabilidade espacial do potencial erosivo das chuvas para o estado do Espírito Santo, Brasil. Irriga, Botucatu 2010, 15, 312–323. [Google Scholar] [CrossRef]
  68. Lombardi Neto, F.; Moldenhauer, W.C. Erosividade da chuva: Sua distribuicao e relacao com perdas de solo em Campinas-SP.Bragantia. Campinas 1992, 51, 189–196. [Google Scholar] [CrossRef]
  69. Bertoni, J.; Lombardi Neto, F. Conservação do Solo, 8th ed.; Ícone Editora: São Paulo, Brazil, 2012. [Google Scholar]
  70. Meira, L.; Oliveira, E.; Silva, P.; Tomaz, A. Rainfall erosivity, soil erodibility and natural water erosion potential in the Huambo region, Angola. J. Agr. Rural Develop. Trop. Subtrop. 2021, 122, 269–278. [Google Scholar]
  71. Campos, J.; Lima Neto, I.E.; Studart, T.M.; Campos, J.N.B. Influence of sediment distribution on the relationships among reservoir yield, spill, and evaporation losses. Eng. Sanit. Ambient. 2018, 23, 849–856. [Google Scholar] [CrossRef]
  72. Borselli, L.; Torri, D.; Poesen, J.; Iaquinta, P. A robust algorithm for estimating soil erodibility in different climates. Catena 2012, 97, 85–94. [Google Scholar] [CrossRef]
  73. Beskow, S.; Mello, C.R.; Norton, L.D.; Curi, N.; Viola, M.R.; Avanzi, J.C. Soil erosion prediction in the Grande River Basin, Brazil using distributed modeling. Catena 2009, 79, 49–59. [Google Scholar] [CrossRef]
  74. Mannigel, A.R.; E Carvalho, M.D.P.; Moreti, D.; Medeiros, L.D.R. Fator erodibilidade e tolerância de perda dos solos do Estado de São Paulo. Acta Sci. Agron. 2008, 24, 1335. [Google Scholar] [CrossRef]
  75. Cabral, J.B.P.; Becegato, V.A.; Scopel, I.; Lopes, R.M. Uso de técnicas de geoprocessamento para mapear o potencial natural de erosão da chuva na bacia hidrográfica do reservatório de Cachoeira Dourada—GO/MG. R. RA’E GA 2005, 10, 107–116. [Google Scholar] [CrossRef]
  76. Belasri, A.; Lakhouili, A. Estimation of soil erosion risk using the universal soil loss equation (usle) and geo-information technology in Oued El Makhazine Watershed, Morocco. J. Geogr. Inf. Syst. 2016, 8, 98–107. [Google Scholar] [CrossRef]
  77. Wischmeier, W.H.; Smith, D.D. Predicting rainfall erosion losses: A guide to conservation planning. In Agriculture Handbook; U.S. Department of Agriculture: Washington, DC, USA, 1978; Volume 537, p. 58. [Google Scholar]
  78. Morgan, R.P.C. Soil Erosion and Conservation, 2nd ed.; Addison-Wesley Longman: Edinburgh, UK, 1995; p. 320. [Google Scholar]
  79. Mitasova, H.; Barton, C.M.; Ullah, I.; Hofierka, J.; Harmon, R. GIS-Based Soil Erosion Modeling. In Treatise on Geomorphology; Academic Press: San Diego, CA, USA, 2013; Remote Sensing and GIScience in Geomorphology; Volume 3, pp. 228–258. [Google Scholar]
  80. Griffin, M.L.; Beasley, D.B.; Fletcher, J.J.; Foster, G.R. Estimating soil loss on topographically nonuniform field and farm units. J. Soil Water Conserv. 1988, 43, 326–331. [Google Scholar]
  81. Moore, I.D.; Wilson, J.P. Length-slope factors for the revised universal soil loss equation: Simplified method of estimation. J. Soil Water Conserv. 1992, 47, 423–428. [Google Scholar]
  82. Marešová, J.; Gdulová, K.; Pracná, P.; Moravec, D.; Gábor, L.; Prošek, J.; Barták, V.; Moudrý, V. Applicability of data acquisition characteristics to the identification of local artefacts in global digital elevation models: Comparison of the Copernicus and TanDEM-X DEMs. Remote Sens. 2021, 13, 3931. [Google Scholar] [CrossRef]
  83. Ghannadi, M.A.; Alebooye, S.; Izadi, M.; Ghanadi, A. Vertical accuracy assessment of copernicus dem (case study: Tehran and Jam cities). ISPRS Ann. Photogramm. Remote Sens. Spatial Inf. Sci. 2023, X-4/W1-2022, 209–214. [Google Scholar] [CrossRef]
  84. González-Moradas, M.R.; Viveen, W.; Vidal-Villalobos, R.A.; Villegas-Lanza, J.C. A performance comparison of SRTM v. 3.0, AW3D30, ASTER GDEM3, Copernicus and TanDEM-X for tectonogeomorphic analysis in the South American Andes. Catena 2023, 228, 107160. [Google Scholar] [CrossRef]
  85. Yang, X.; Tang, G.; Xiao, C.; Gao, Y.; Zhu, S. The scaling method of specific catchment area from DEMs. J. Geogr. Sci. 2011, 21, 689–704. [Google Scholar] [CrossRef]
  86. Cerdan, O.; Poesen, J.; Govers, G.; Saby, N.; Le Bissonnais, Y.; Gobin, A.; Vacca, A.; Quinton, J.; Auerswald, K.; Klik, A.; et al. Sheet and Rill Erosion. In Soil Erosion in Europe; Boardman, J., Poesen, J., Eds.; Wiley: Hoboken, NJ, USA, 2006; pp. 501–513. [Google Scholar]
  87. Conrad, O.; Bechtel, B.; Bock, M.; Dietrich, H.; Fischer, E.; Gerlitz, L.; Wehberg, J.; Wichmann, V.; Böhner, J. System for Automated Geoscientific Analyses (SAGA) v. 2.1.4. Geosci. Model Dev. Discuss. 2015, 8, 2271–2312. [Google Scholar] [CrossRef]
  88. Borges, K.M.R.; Carvalho Júnior, O.A.; Martins, E.S.; Gomes, R.A.T.; Guimarães, R.F. Vulnerabilidade natural: A perda de solo da bacia do rio Carinhanha (MG/BA) usando uma abordagem qualitativa da equação universal de perda de solos. Geographia 2013, 14, 101. [Google Scholar] [CrossRef]
  89. Ferreira, A.B.R.; Pereira, G.; Fonseca, B.M.; Costa, J.C.; Cardozo, F.D.S. Estimativa de perda de solo no Oeste da Bahia (Brasil) a partir da alteração do uso e cobertura da terra. Caminhos Geogr. 2019, 20, 560–573. [Google Scholar] [CrossRef]
  90. De Oliveira, U.C.; Cidral, W.R.S.; Silva, I.S.; Evangelista, J.P. Spatial distribution of soil loss in the Itacolomi river hydrographic basin, Ceará, Brazil. Ciênc. Geográfica 2023, 2, 977–989. [Google Scholar]
  91. Stein, D.P.; Donzeli, A.F.; Gimenez, A.F.; Ponçano, W.L.; Lombardi Neto, F. Potencial de erosão laminar, natural e antrópico na bacia do peixe paranapanema. Simpósio Nac. De Controle De Erosão São Paulo 1987, 4, 105–136. [Google Scholar]
  92. Pena, D.S. Influência da Expansão Agrícola Sobre a Perda de Solo no Estado de Goiás. Ph.D. Thesis, Universidade Federal de Goiás, Goiás, Brazil, 2020; p. 141. [Google Scholar]
  93. Bajracharya, A.; Awoye, H.; Stadnyk, T.; Asadzadeh, M. Time variant sensitivity analysis of hydrological model parameters in a cold region using flow signatures. Water 2020, 12, 961. [Google Scholar] [CrossRef]
  94. Razavi, s.; Sheikholeslami, R.; Gupta, H.V.; Haghnegahdar, A. VARS-TOOL: A toolbox for comprehensive, efficient, and robust sensitivity and uncertainty analysis. Environ. Model. Softw. 2019, 112, 95–117. [Google Scholar] [CrossRef]
  95. Sobol, I.M. Global sensitivity indices for nonlinear mathematical models and their Monte Carlo estimates. Math. Comput. Simul. 2001, 55, 271–280. [Google Scholar] [CrossRef]
  96. Morris, M.D. Factorial sampling plans for preliminary computational experiments. Technometrics 1991, 33, 161–174. [Google Scholar] [CrossRef]
  97. Gordon, C.A.; Foulon, E.; Rousseau, A.N. Deriving synthetic rating curves from a digital elevation model to delineate the inundated areas of small watersheds. J. Hydrol. Reg. Stud. 2023, 50, 101580. [Google Scholar] [CrossRef]
  98. Meles, M.B.; Goodrich, D.C.; Gupta, H.V.; Shea Burns, I.; Unkrich, C.L.; Razavi, S.; Guertin, D.P. Multi-criteria, time dependent sensitivity analysis of an event-oriented, physically-based, distributed sediment and runoff model. J. Hydrol. 2021, 598, 126268. [Google Scholar] [CrossRef]
  99. Korgaonkar, Y.; Meles, M.B.; Guertin, D.P.; Goodrich, D.C.; Unkrich, C. Global sensitivity analysis of KINEROS2 hydrologic model parameters representing green infrastructure using the STAR-VARS framework. Environ. Model. Softw. 2020, 132, 104814. [Google Scholar] [CrossRef]
  100. Razavi, S.; Gupta, H.V. A new framework for comprehensive, robust, and efficient global sensitivity analysis: 1. Theory. Water Resour. Res. 2016, 8324, 423–439. [Google Scholar] [CrossRef]
  101. Razavi, S.; Gupta, H.V. A new framework for comprehensive, robust, and efficient global sensitivity analysis: 2. Application. Water Resour. Res. 2016, 52, 440–455. [Google Scholar] [CrossRef]
  102. Carvalho, N.O. Hidrossedimentologia Prática; CPRM: Rio de Janeiro, Brazil, 1994; p. 600. [Google Scholar]
  103. Fistarol, P.H.B.; Santos, J.Y.B.; Nakamura, T.C. Estimativa das perdas de solo na bacia do Rio de Ondas, estado da Bahia. In Proceedings of the XII Encontro Nacional de Engenharia de Sedimentos, Porto Velho, Brazil, 28 November–2 December 2016; p. 8. [Google Scholar]
  104. Nascimento, R.Q.; Santos, J.Y.G. Análise das perdas de solo na bacia do Rio de Janeiro, Bahia. In Proceedings of the XXIII Simpósio Brasileiro de Recursos Hídricos, Foz do Iguaçu, Brazil, 24–28 November 2019; p. 10. [Google Scholar]
  105. Godoi, R.D.F.; Rodrigues, D.B.B.; Borrelli, P.; Oliveira, P.T.S. High-resolution soil erodibility map of Brazil. Sci. Total Environ. 2021, 781, 146673. [Google Scholar] [CrossRef]
  106. Gomes, L.; Simões, S.J.C.; Forti, M.C.; Ometto, J.P.H.B.; Nora, E.L.D. Using Geotechnology to Estimate Annual Soil Loss Rate in the Brazilian Cerrado. J. Geogr. Inf. Syst. 2017, 9, 420–439. [Google Scholar] [CrossRef]
  107. Farinasso, M.; Carvalho Júnior, O.A.D.; Guimarães, R.F.; Gomes, R.A.T.; Ramos, V.M. Avaliação Qualitativa do Potencial de Erosão Laminar em Grandes Áreas por Meio da EUPS Equação Universal de Perdas de Solos Utilizando Novas Metodologias em SIG para os Cálculos dos seus Fatores na Região do Alto Parnaíba PI-MA. Rev. Bras. Geomorfol. 2006, 7, 73–85. [Google Scholar] [CrossRef]
  108. Medeiros, G.D.O.R.; Giarolla, A.; Sampaio, G.; Marinho, M.D.A. Estimates of Annual Soil Loss Rates in the State of São Paulo, Brazil. Rev. Bras. Ciênc. Solo. 2016, 40, e0150497. [Google Scholar] [CrossRef]
  109. Bollinne, A.; Rosseau, P. L’érodibilité des sols de moyenne et haute Belgique. Bull. Soc. Géogr. Liège 1978, 14, 127–140. [Google Scholar]
  110. Benito, E.; Varela, M.E.; Rodriquez-Alleres, M.; Garcia-Corona, R.; Santiago, J.L. Soil erodibility: Influencing factors and their importance in post-fire erosion. In The Environment in Galicia: A Book of Images; Springer: Cham, Switzerland, 2023; pp. 597–614. [Google Scholar]
  111. Huang, X.; Lin, L.; Ding, S.; Tian, Z.; Zhu, X.; Wu, K.; Zhao, Y. Characteristics of soil erodibility k value and its influencing factors in the Changyan Watershed, Southwest Hubei, China. Land 2022, 11, 134. [Google Scholar] [CrossRef]
  112. Rahman, H.U.; Shakir, M. Nexus of land use land cover dynamics and extent of soil loss in the Panjkora River Basin of eastern Hindu Kush. J. Water Clim Change 2023, 14, 4669–4688. [Google Scholar] [CrossRef]
  113. Khan, A.; Rahman, A.; Mahmood, S. Spatial estimation of soil erosion risk using RUSLE model in District Swat, Eastern Hindu Kush, Pakistan. J. Water Clim. Change 2023, 14, 1881–1899. [Google Scholar] [CrossRef]
  114. Dymond, J.R. Soil erosion in New Zealand is a net sink of CO2. Earth Surf. Process. Landforms 2010, 35, 1763–1772. [Google Scholar] [CrossRef]
  115. Barbosa, W.C.D.S.; Guerra, A.J.T.; Valladares, G.S. Soil Erosion Modeling Using the Revised Universal Soil Loss Equation and a Geographic Information System in a Watershed in the Northeastern Brazilian Cerrado. Geosciences 2024, 14, 78. [Google Scholar] [CrossRef]
  116. Paiva, F.M.L.; De Araújo Filho, P.F.; Da Silva, R.M.; Silva, L.P.; Montenegro, S.M.G.L.; de Azevedo, J.R.G. Concentração de sedimentos em suspensão em uma pequena bacia rural no nordeste do Brasil. Simp. Recur. Hídr. Nordeste 2010, 1–15. Available online: https://www.academia.edu/40986856/CONCENTRA%C3%87%C3%83O_DE_SEDIMENTOS_EM_SUSPENS%C3%83O_EM_UMA_PEQUENA_BACIA_RURAL_NO_NORDESTE_DO_BRASIL (accessed on 1 November 2024).
  117. Fistarol, P.H.B.; Santos, J.Y.G. Implicações das alterações no uso e ocupação do solo nas perdas de solo da Bacia do Rio de Ondas, estado da Bahia. Ver. OKARA Geogr. Debate. 2020, 14, 81–103. [Google Scholar] [CrossRef]
  118. Trindade, L.D.S. Estimativa de perda de solos na bacia hidrográfica do rio da Dona—BA. Bachelors’ Thesis, Universidade Federal do Recôncavo da Bahia—UFRB, Cruz das Almas, Brazil, 2018; p. 57. [Google Scholar]
  119. Michalopoulou, M.; Depountis, N.; Nikolakopoulos, K.; Boumpoulis, V. The significance of digital elevation models in the calculation of ls factor and soil erosion. Land 2022, 11, 1592. [Google Scholar] [CrossRef]
  120. Raj, A.R.; George, J.; Raghavendra, S.; Kumar, S.; Agrawal, S. Effect of DEM resolution on LS factor computation. Int. Arch. Photogramm. Remote Sens. Spatial Inf. Sci. 2018, XLII–5, 315–321. [Google Scholar] [CrossRef]
  121. Wang, C.; Shan, L.; Liu, X.; Yang, Q.; Cruse, R.M.; Liu, B.; Li, R.; Zhang, H.; Pang, G. Impacts of horizontal resolution and downscaling on the USLE LS factor for different terrains. Int. Soil Water Conserv. Res. 2020, 8, 363–372. [Google Scholar] [CrossRef]
  122. İrvem, A.; Topaloğlu, F.; Uygur, V. Estimating spatial distribution of soil loss over Seyhan River Basin in Turkey. J. Hydrol. 2007, 336, 30–37. [Google Scholar] [CrossRef]
  123. Wang, G.; Gertner, G.; Parysow, P.; Anderson, A. Spatial prediction and uncertainty assessment of topographic factor for revised universal soil loss equation using digital elevation models. ISPRS J. Photogramm. Remote Sens. 2001, 56, 65–80. [Google Scholar] [CrossRef]
  124. Sheikholeslami, R.; Razavi, S.; Gupta, H.V.; Becker, W.; Haghnegahdar, A. Global sensitivity analysis for high-dimensional problems: How to objectively group factors and measure robustness and convergence while reducing computational cost. Environ. Modell. Softw. 2019, 111, 282–299. [Google Scholar] [CrossRef]
  125. Da Cunha, E.R.; Bacani, V.M.; Panachuki, E. Modeling soil erosion using RUSLE and GIS in a watershed occupied by rural settlement in the Brazilian Cerrado. Nat Hazards. 2017, 85, 851–868. [Google Scholar] [CrossRef]
  126. Zanchin, M.; Moura, M.M.D.; Nunes, M.C.M.; Tuchtenhagen, I.K.; Lima, C.L.R.D. Assessment of soil loss susceptibility in Santa Rita watershed in southern Brazil. Eng. Agríc. 2021, 41, 485–495. [Google Scholar] [CrossRef]
  127. Alves, W.S.; Martins, A.P.; Morais, W.A.; Pôssa, É.M.; Castro, R.M.; Borges de Moura, D.M. USLE modelling of soil loss in a Brazilian cerrado catchment. Remote Sens. Appl. Soc. Environ. 2022, 27, 100788. [Google Scholar] [CrossRef]
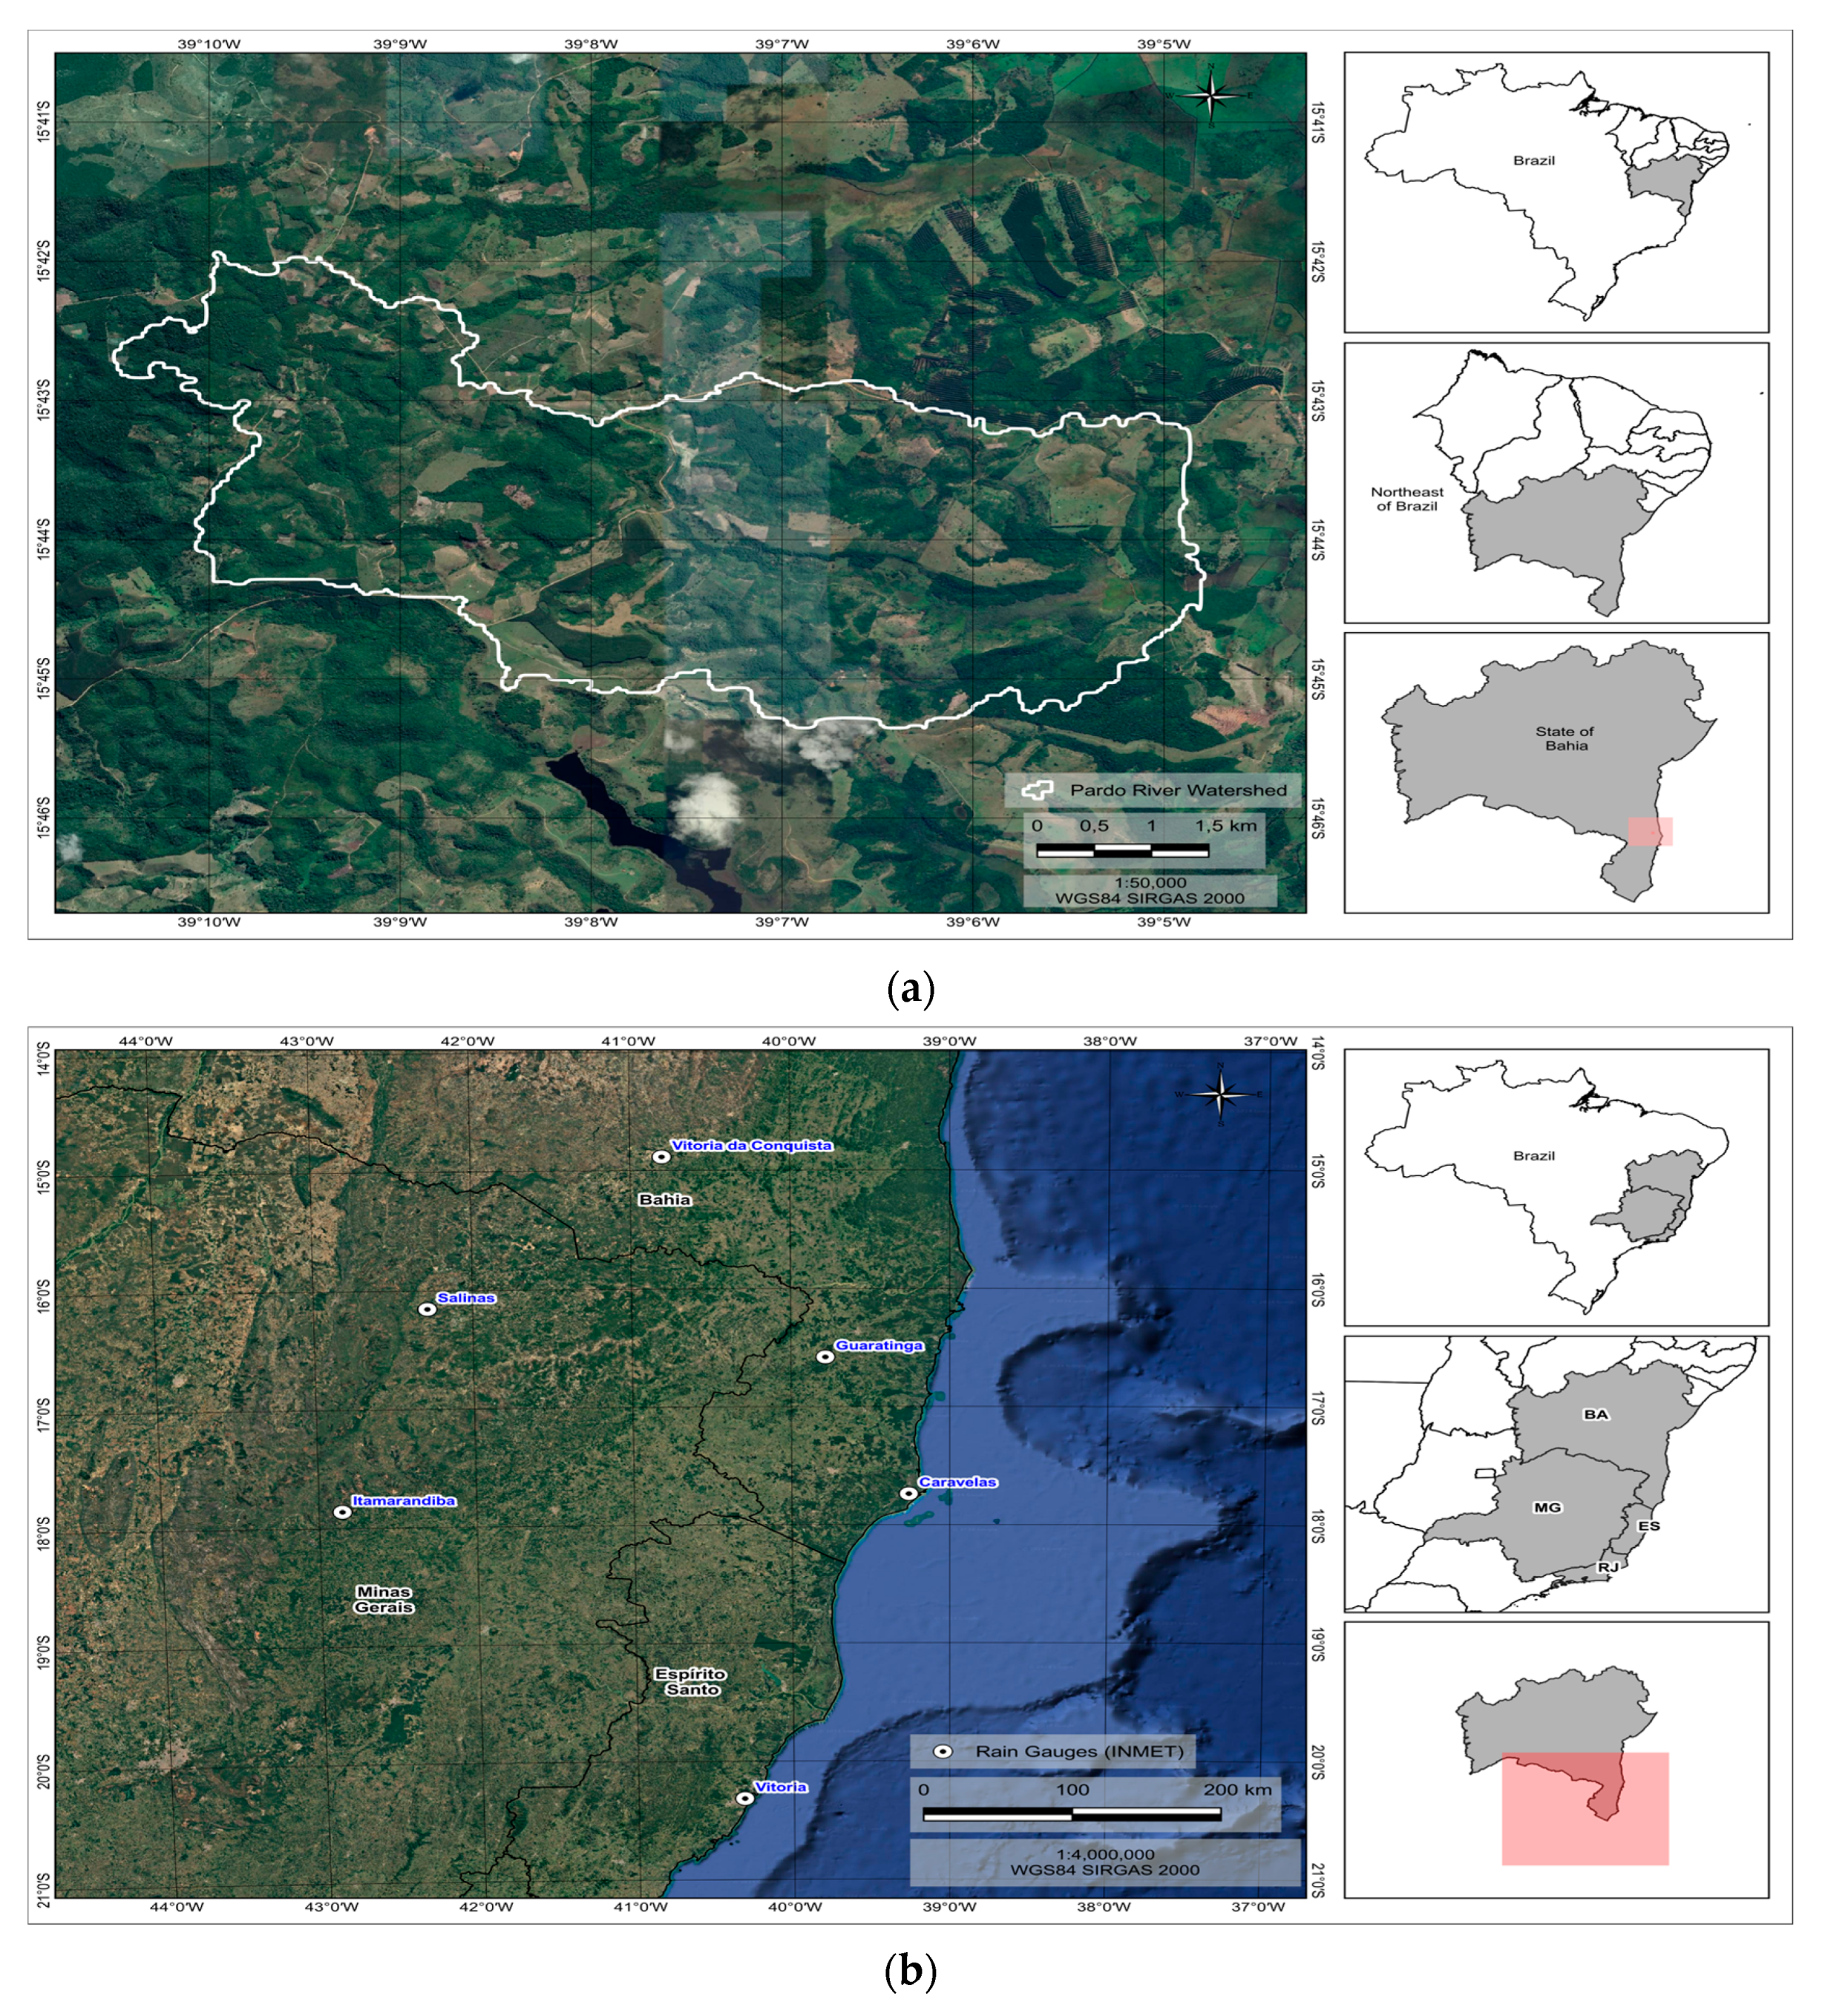
Figure 1. (a) Location of the 30.07 km2 Pardo River watershed in the municipality of Canavieiras and (b) map of meteorological stations.
Soilsystems 08 00125 g001
Figure 2. Example of calculation of the LS factor for each pixel.
Soilsystems 08 00125 g002
Figure 3. Method 1—calculation of the soil loss for each pixel.
Soilsystems 08 00125 g003
Figure 4. Method 2—calculation of 4600 soil loss maps.
Soilsystems 08 00125 g004
Figure 5. Average of 4600 possibilities of the pixels.
Soilsystems 08 00125 g005
Figure 6. Erosivity map of the Pardo River watershed.
Soilsystems 08 00125 g006
Figure 7. (a) Soil types and (b) K factor map.
Soilsystems 08 00125 g007aSoilsystems 08 00125 g007b
Figure 8. (a,c,d) LS factor maps and (b) slope angle (β or b) for the Pardo River watershed.
Soilsystems 08 00125 g008
Figure 9. (a) LULC map and (b) CP factor map.
Soilsystems 08 00125 g009
Figure 10. Soil erosion maps calculated using LS equations: (a) Equation (4a), (b) Equation (4b), and (c) Equation (5).
Soilsystems 08 00125 g010
Figure 11. Dendrogram of factors generated by VARS.
Soilsystems 08 00125 g011
Figure 12. Visualization of directional variograms. This figure illustrates sensitivity using a series of scale perturbations and bar charts, highlighting the significance of the factors based on derivative, variance, and covariogram approaches.
Soilsystems 08 00125 g012
Figure 13. Comparison of LS factors of the Equations (4a), (4b) and (5) based on VARS sampling. The data sample includes Po = 127,875,400.
Soilsystems 08 00125 g013
Figure 14. Method 1—potential soil erosion calculation results for all 4600 LS maps using Equation (4a) (Po = 127,875,400).
Soilsystems 08 00125 g014
Figure 15. Method 2—map of average values per pixel of the soil erosion.
Soilsystems 08 00125 g015
Figure 16. Soil loss rate: boxplot using method 2—box plot of average values of soil erosion (Â).
Soilsystems 08 00125 g016
Figure 17. Comparison of two calculation methods of soil erosion—(A) Method 1 and (B) Method 2.
Soilsystems 08 00125 g017
Figure 18. Comparison of results for the three LS equations. Each boxplot consists of 127,875,400 values.
Soilsystems 08 00125 g018
Table 1. Location of the climatological stations used in this study [65].
LocationsLatitudeLongitudeAltitude (m)Annual Mean (mm/year)Period
Caravelas−17.73944444−39.2586111161426.611992–2021
Guaratinga−16.58081−39.783182199872.41992–2021
Itamarandiba−17.85972222−42.852777779201006.861992–2021
Salinas−16.154862−42.284921477833.651992–2021
Salvador (Ondina)−13.00583333−38.50583333531847.891992–2021
Vitoria−20.31583333−40.31694443321294.081992–2021
Vitoria da Conquista−14.88638888−40.80138888880709.941992–2021
Table 2. The inputs used in VARS for global sensitivity analysis.
Input
Factors
(F1)(F2)(F3)
MinMaxMinMaxMinMax
CP0.01.00.01.00.01.0
R5606.555775.115606.555775.115606.555775.11
K0.0280.05920.0280.05920.0280.0592
m0.40.60.20.60.40.56
n1.01.31.01.31.21.3
β035.436035.436035.436
SCA8.78615,535.1538.78615,535.1538.78615,535.153
Notes: F1, F2, and F3 are inputs of RUSLE parameters used with the LS Equations (4a), (4b) and (5) of [79,80,81], respectively. The values of the input factors m, n, β, and SCA were used to calculate the LS factor, where m and n were obtained from sampling from VARS, and the other two parameters were kept constant given the use of one DEM only.
Table 3. Values of K factor used in Pardo River watershed.
Types of SoilsK (t h MJ−1 mm−1)Ref.
Ferralsols0.028[106]
Fluvisols0.046[107]
Podsols0.0592[108]
Table 4. Statistics of LS factors based on various equations.
Equation NoLS Equations[m, n]MinMaxSTD-Dev
(4a) ( m + 1 ) ( S C A 22.13 ) m   ( S i n β 0.0896 ) n [0.5, 1.15]0.0106.327.07
(4b) [0.4, 1.15]0.055.505.03
(5) ( S C A 22.13 ) m   ( S i n β 0.0896 ) n [0.48, 1.25]0.071.165.05
Notes: Min: “minimum”; Max: “maximum”, STD-Dev: “standard deviation”.
Table 5. The values of CP factor used in Pardo River watershed.
ClassesCP FactorRef.
Forest formation0.00004[91]
Pasture0.01[91]
Mosaic of uses0.15[92]
Water0[61]
Exposed soil1.0[61,114]
Table 6. Estimation of soil erosion based on several equations.
LSRUSLE[m, n]MinMaxMeanSTD-Dev
(4a) R × K × C P × ( m + 1 ) ( S C A 22.13 ) m   ( S i n β 0.0896 ) n [0.5, 1.15]0.02733.2729.77117.52
(4b) R × K × C P × ( m + 1 ) ( S C A 22.13 ) m   ( S i n β 0.0896 ) n [0.4, 1.15]0.02282.6923.7691.94
(5) R × K × C P × ( S C A 22.13 ) m   ( S i n β 0.0896 ) n [0.48, 1.25]0.02103.2721.5285.67
Notes: Min: “minimum”; Max: “maximum”, STD-Dev: “standard deviation”.
Table 7. Severity range and severity class of soil loss in Pardo River watershed.
Severity Range
t.(ha.year)−1
Severity ClassesUsing LS (4a)Using LS (4b)Using LS (5)
Area
(km2)
Area
(%)
Area
(km2)
Area
(%)
Area
(km2)
Area (%)
<5Very low19.1876.6919.3677.4419.7078.80
5 12Low1.365.441.596.361.586.32
12 50Moderate2.228.881.907.61.676.68
50 100High0.371.480.351.40.411.64
100 200Very high0.562.240.662,640.692.76
>200Severe1.325.271.144.560.963.84
Table 8. Severity range and severity class of soil loss in Pardo River watershed using Method 1 given LS Equations (4a), (4b) and (5).
Severity Range
t.(ha.year)−1
Severity ClassesUsing LS (4a)Using LS (4b)Using LS (5)
Area
(km2)
Area
(%)
Area
(km2)
Area
(%)
Area
(km2)
Area (%)
<5Very low18.7274.8718.8775.4719.1976.74
5 12Low1.154.581.234.931.315.25
12 50Moderate2.6210.462.5710.272.309.19
50 100High0.441.770.321.270.321.27
100 200Very high0.391.550.461.820.512.04
>200Severe1.596.351.516.021.345.35
Disclaimer/Publisher’s Note: The statements, opinions and data contained in all publications are solely those of the individual author(s) and contributor(s) and not of MDPI and/or the editor(s). MDPI and/or the editor(s) disclaim responsibility for any injury to people or property resulting from any ideas, methods, instructions or products referred to in the content.