Article

Evaluation of Industrial Hemp Cultivar and Biochar Rate to Remediate Heavy-Metal-Contaminated Soil from the Tar Creek Superfund Site, USA

by
Dietrich V. Thurston
1,
Kristofor R. Brye
1,*,
David M. Miller
1,
Philip A. Moore, Jr.
2,
Donald M. Johnson
3 and
Mike Richardson
4
1
Department of Crop, Soil, and Environmental Sciences, University of Arkansas, Fayetteville, AR 72701, USA
2
United States Department of Agriculture, Agricultural Research Service, University of Arkansas, Fayetteville, AR 72701, USA
3
Department of Agricultural Education, Communications and Technology, University of Arkansas, Fayetteville, AR 72701, USA
4
Department of Horticulture, University of Arkansas, Fayetteville, AR 72701, USA
*
Author to whom correspondence should be addressed.
Soil Syst. 2024, 8(4), 114; https://doi.org/10.3390/soilsystems8040114
Submission received: 30 September 2024 / Revised: 31 October 2024 / Accepted: 6 November 2024 / Published: 8 November 2024
(This article belongs to the Special Issue Soil Bioremediation)

Abstract

:
Soil contamination by cadmium (Cd), lead (Pb), and zinc (Zn) at the Tar Creek superfund site in northeast Oklahoma, United States, remains a threat to the environment and local ecosystem. Phytoremediation with industrial hemp (Cannabis sativa L.) and the use of biochar (BC) have been independently shown to be effective methods to remediate heavy-metal-contaminated soils. The objective of this greenhouse study was to evaluate the effects of industrial hemp cultivar (‘Carmagnola’ and ‘Jinma’), biochar rate (0, 2, 5, and 10% by volume), soil contamination level (low, medium, and high), and their interactions on above- (AG) and belowground dry matter (DM) and AG tissue concentrations, as well as uptakes of Cd, Pb, and Zn after 90 days of growth in naturally contaminated soils from the Tar Creek superfund site. Aboveground DM was the largest (p < 0.01) in the low- (0.06 g cm−2) and smallest in the high-contaminated soil (0.03 g cm−2), and was unaffected (p > 0.05) by cultivar or BC rate. Averaged across BC rates, AG tissue Pb and Zn concentrations from the high-’Carmagnola’ and -’Jinma’ combinations were at least 2.4 times greater than from the other four soil–cultivar combinations. Averaged across cultivars, AG tissue Pb uptake in the high-5 and high-10% BC combinations were at least 2.7 times greater than in the high-0 and high-5% BC combinations, which did not differ. The results indicated that both ‘Carmagnola’ and ‘Jinma’ may be suitable choices for phytoremediation of mixed Cd-, Pb-, and Zn-contaminated soil when grown in combination with 5 or 10% (v/v) BC.

1. Introduction

Lead (Pb) and zinc (Zn) ore mining became prominent in northeastern Oklahoma, southeastern Kansas, and southwestern Missouri in the early 1900s [1]. Picher, Oklahoma became an epicenter of mining activity, in an area formally known as the Picher Field [2,3,4], for arms manufacturing in the United States (US) during World Wars I and II [5].
Mining activities resulted in the surface accumulation of chat, a bulky granular aggregate waste material containing Pb, Zn, and cadmium (Cd). Chat piles contain appreciable quantities of Pb, Zn, and Cd, and many of the chat piles themselves are ~60 m tall [5,6,7]. A survey conducted in 2005 estimated that the total surface volume of chat exceeded 23.7 × 10⁶ m3 [3]. Between leachate from chat piles and mine shafts filling with environmental water (i.e., rainfall runoff and groundwater), a substantial volume of acid mine drainage (AMD) developed in the area of Picher, Oklahoma [8]. Acid mine drainage is often laden with large concentrations of toxic heavy metals leached from piles of processed, mine-excavated materials exposed to precipitation, and can be acidic if exposed to sulfide minerals while underground [9].
The chat piles themselves, the surrounding contaminated soils, and the AMD have become primary sources for the incorporation of Pb, Zn, and Cd into the local ecosystem, causing major environmental degradation. Furthermore, the exposure to and potential consumption of Pb, Zn, and/or Cd represents serious risks to human health. Consequently, in 1984, a large area near Picher, Oklahoma was established as a superfund site [5], which is presently known as the Tar Creek Superfund site. The Tar Creek Superfund site is among the top 10% of superfund sites on the National Priority Listing [8], requiring long-term remediation due to (i) the quantity of contaminants onsite, and (ii) the human health and environmental hazards associated with the onsite contaminants [5].
Traditional remediation activities at former mining sites with contamination include removing and relocating contaminated materials to designated containment areas, burying the contaminated materials in abandoned mines, or treating the contaminated materials with chemicals to remove the toxic heavy metals [3]. However, traditional remediation strategies are often expensive [3,4]. Consequently, lower-cost alternatives to traditional remediation and clean-up strategies warrant investigation.
One such potential alternative strategy is to use a phytoremediation process to bioaccumulate soil contaminants in plant tissues [10]. In the context of removing heavy metals from contaminated soil, phytoremediation involves ion transportation from the soil into root cytoplasm. The heavy metal ions are then translocated into the cellular membranes of stem and leaf tissues through plant transpiration [11]. There are currently more than 400 species of plants known to be effective at phytoremediating contaminants from soil and water [12]. Attributes such as annual life cycle, contaminant tolerance and adaptability, rapid growth rate, extensive roots, and large aboveground biomass are typical for each of the known remediator plant species [11].
Industrial hemp (Cannabis sativa L.) is one plant species known for its affinity to accumulate toxic heavy metals into its tissues [13,14,15]. Previous experiments demonstrated that industrial hemp is an effective phytoremediator of soils containing heavy metals, radionuclides, and polyfluoroalkyls [13,16,17]. Industrial hemp is an attractive option for phytoremediation because the plant produces fiber that can be used in the construction, architecture, and textile industries [18,19,20]. Thus, industrial hemp may serve dual purposes as a phytoremediator of heavy metals and as a potentially economically useful end-product.
Along with phytoremediation, an additional remediation strategy is containment stabilization through the use of biochar (BC), which is a carbonaceous material made by the pyrolysis of various types of organic materials, due to biochar’s known ability to adsorb heavy metal cations from contaminated soils [21,22,23]. Biochar can provide a surface area range of 800 to 2500 m2 g−1 [24,25] for chemical reactions, generally enhancing the soil’s collective adsorption capacity, when oxidized, due to the formation of carboxylic functional groups [26]. Previous studies have indicated that biochar also promoted heavy metal immobilization via a general increase in soil pH, which reduces the solubility of Cd, Pb, and Zn, and may encourage complexation and precipitation reactions [18,27].
Considering the known phytoremediation potential of industrial hemp and the known adsorptive capacity of biochar, the simultaneous use of industrial hemp and biochar may improve the ability to remediate heavy-metal-contaminated soils in situ as an alternative to traditional, more expensive remediation strategies. However, little is known about the interactive effects of industrial hemp and biochar in soils with large concentrations of Zn, Pb, and Cd, such as those present in the soils at the Tar Creek Superfund site. The objective of this greenhouse study was to evaluate the effects of industrial hemp cultivar (‘Carmagnola’ and ‘Jinma’), biochar rate (0, 2, 5, and 10% by volume), soil contamination level (low, medium, and high; defined with specific concentrations below), and their interactions on above- and belowground and total plant dry matter, aboveground tissue Cd, Pb, and Zn concentrations and uptakes, and Cd, Pb, and Zn bioconcentration factors (BCFs) after 90 days of growth in contaminated soils from the Tar Creek Superfund site.
Though a reported accumulator of toxic heavy metals [15,16,18], industrial hemp may be negatively impacted by soil contamination levels too large to sustain healthy plant growth. Consequently, it was hypothesized that above- and belowground dry matter will be smallest in the high-contaminated soil, and will sequentially increase according to decreasing soil contamination level (e.g., high < medium < low). It was hypothesized that measured Zn, Pb, and Cd tissue concentrations and uptakes and calculated BCFs for all treatment combinations should be largest in the high-contaminated soil, and should sequentially decrease according to increasing soil contamination level (e.g., high > medium > low). Aligning with previous studies where biochar was reported to reduce plant availability of heavy metals [16,27], it was also hypothesized that industrial hemp tissue concentrations, uptakes, and BCFs for Cd, Pb, and Zn will be smallest in the 10% and largest in the 2% BC treatments.

2. Materials and Methods

2.1. Soil Collection, Processing, and Analyses

On 18 June 2021, seven, 18.9-L buckets of soil and chat-pile-derived-sediment mixtures in unknown proportions, hereafter referred to as soil, were manually collected from approximately the top 10 to 15 cm at three locations within an approximate area of 22 ha in a decommissioned chat processing area associated with the Tar Creek Superfund site [5] near Picher, Oklahoma (Figure 1). Field estimates of heavy metal (HM) concentrations (i.e., Pb, Zn, and Cd) using a field-portable, X-ray fluorescence spectrometer conducted several days before soil collection identified three areas qualitatively categorized as low (~550–600 mg Pb kg−1, <1000 mg Zn kg−1, and <20 mg Cd kg−1), medium (~1500–1800 mg Pb kg−1, ~2000 mg Zn kg−1, and ~60 mg Cd kg−1), and high (~5500 mg Pb kg−1, ~13,000 mg Zn kg−1, and ~123 mg Cd kg−1) levels of heavy-metal contamination.
Samples of low-contaminated soil were collected from the bed of a dry stormwater retention pond, where the bottom was approximately 0.5 m below the surrounding natural soil surface, ~100 m to the west of the nearest chat pile and ~30 m to the south and east of a raised dike utilized for the retention of surface water (Figure 1). Samples of medium-contaminated soil were collected from stormwater-induced alluvium, immediately adjacent to a chat pile (Figure 1). The medium-contaminated soil collection site was located in an alluvial fan feature of a stormwater runoff channel approximately 50 m to the south and east of the nearest chat pile. Samples of high-contaminated soil were collected from a stream bank in close proximity to Tar Creek itself (Figure 1). The high-contaminated soil collection site was located approximately 20 m to the south and east of a human-made diversion channel for Tar Creek. Collected soils were transported to the Milo J. Shult Agricultural Research & Extension Center (AREC) in Fayetteville, AR for temporary storage and further processing.
All soil was initially sieved field-moist through hardware cloth with 6.4 mm openings and laid out to air-dry on greenhouse benches at air temperatures inside the greenhouse ranging from 29 to 40.5 °C for 21 days. Soil was periodically manually turned and mixed to achieve uniform drying. Once air-drying was complete, all soil within a contamination level was homogenized in separate, clean, round, 207.9 L metal containers with tight-sealing lids. Soil-filled containers were placed horizontally on the ground and manually rolled to achieve 50 complete revolutions of the containers, whereby rolling was conducted in opposite directions for each revolution.
Once homogenized, three random sub-samples (~200 g) of each soil were collected for initial physical and chemical property characterization. Based on prior methods [28], sub-samples of air-dried soil were weighed, oven-dried in a forced-draft oven for 48 h at 70 °C, reweighed for gravimetric moisture determination, then manually crushed with a mortar and pestle and sieved through a 2 mm mesh screen. Particle-size analyses were conducted using a modified 12 h hydrometer procedure [29]. Soil pH and electrical conductivity (EC) were measured potentiometrically in a 1:2 soil-to-water suspension [30,31]. Soil organic matter (SOM) was determined by loss-on-ignition [32]. Total carbon (TC) and total nitrogen (TN) concentrations were determined by high-temperature combustion using a Variomax C/N analyzer (Elementar Americas Inc., Mt. Laurel, NJ, USA). The soil C:N ratio was calculated from the measured TC and TN concentrations. Samples were extracted with water and Mehlich-3 [33] solution in a 1:10 ratio (i.e., 2 g and 20 mL of solution) and analyzed for extractable P, K, Na, Zn, Pb, and Cd concentrations by inductively coupled plasma optical emission spectrometry (ICP-OES; Arcos l, 160 SOP model FHS16, Spectro Analytical Instruments Inc., Wilmington, MA, USA).
Total recoverable Zn, Pb, and Cd concentrations were determined according to the procedure for acid digestion of sediments, sludges, and soils [34]. Briefly, 1 g sub-samples were placed into 100 mL glass digestion tubes and were cold-soaked with 10 mL of 70% nitric acid for 24 h. Samples were then dosed with three 5 mL aliquots of 30% hydrogen peroxide and refluxed twice at 160 °C using a Tecator 2040 digestor with a Tecator 2000 remote controller (Foss-Tecator, Hilleroed, Denmark) before being diluted with deionized water to a final volume of 100 mL. The final solution was filtered through 125 mm-diameter Whatman 42 quantitative ash-less filter paper (Cytiva Life Sciences, Marlborough, MA, USA). Filtered solutions were analyzed by ICP-OES. Table 1 summarizes the initial physical and chemical properties among the three soils used in this greenhouse experiment.

2.2. Treatments Evaluated and Experimental Design

In addition to the three soils (i.e., low, medium, and high), this study evaluated the effects of four biochar rates [i.e., 0, 2, 5, and 10% by volume, which equated to approximately 0, 0.5, 1.25, and 2.5% by mass, respectively, assuming a biochar density of 0.25 g cm−3 (USDA, 2021)] and two hemp cultivars used typically for fiber production (i.e., ‘Carmagnola’ and ‘Jinma’). The biochar treatments used in this study were equivalent to field application rates of 0, 4.2, 10.4, and 20.8 Mg ha−1 for the 0, 2, 5, and 10% by volume treatments, respectively, which were mixed into the top 15 cm of soil. A complete factorial set of four replications of each soil–biochar–cultivar treatment combination was prepared, for a total of 96 experimental units (i.e., pots), and organized into a completely random design.

2.3. Biochar Characterization

The biochar used in this experiment was produced from a Douglas fir (Pseudotsuga menziesii) feedstock that was prepared using a slow pyrolysis kiln, though the exact pyrolysis temperature used is unknown. Selected initial physical and chemical properties of the biochar were provided by the manufacturer (Biochar Now, LLC, Berthoud, CO, USA) and assessed by an independent laboratory (Control Laboratories, Watsonville, CA, USA). The biochar was identified as “medium” size by the manufacturer and consisted of ~3 to 5 mm flakes.
In order to directly determine initial Cd, Pb, and Zn concentrations in the biochar, 50 mL of 1 N hydrochloric (HCl) acid were added to 0.5 g sub-samples of biochar and were agitated with an end-over-end shaker at 30 revolutions per minute (rpm) for two hours. Samples were filtered through Whatman 42 filter paper (GE Healthcare, Buckinghamshire, UK) into 20 mL vials and analyzed for Cd, Pb, and Zn concentrations by ICP-OES. Table 2 summarizes the initial physical and chemical properties of the biochar used in this study.

2.4. Pot Preparation

A combined soil–biochar mass of 2000 g (dry-mass basis) was selected for addition to plastic pots that had a base diameter of 12 cm, height of 18 cm, and top inside diameter of 17.5 cm. Soil masses were weighed into plastic bags. Biochar rates were determined on a per volume basis (v/v) at rates of 0, 2, 5, and 10%. Respective biochar masses were added to each soil-containing plastic bag and manually shaken vigorously for approximately 2 min in a repetitive cyclical manner to thoroughly mix the biochar within the total mass of soil to simulate incorporation in the field by tillage.
Because soil fertility recommendations for industrial hemp are not yet widely established, soil fertility recommendations for wheat (Triticum aestivum L.) were used as a reasonable substitute for growing hemp [38]. Therefore, using the mean measured Mehlich-3 extractable soil P and K concentrations for each of the three soils (Table 1) and the fertilizer-N (207 kg N ha−1), -P (112 kg P ha−1), and -K (0, 67.2, or 101 kg K ha−1) recommendations for wheat production in Arkansas [39], target N, P, and K application rates per pot were determined based on the surface area of soil in the pots (i.e., 153.2 cm2). Following wetting and settling, the target fertilizer application rates were increased by 20% [38] to ensure adequate plant access to nutrients. The resulting final fertilizer applications were equivalent to rates of 249 and 58.7 kg ha−1 for N and P, respectively, for all pots and rates of 0, 66.9, and 100 kg ha−1 K for the low-, medium-, and high-contaminated soils, respectively. Urea [fertilizer grade (N-P2O5-K2O): 46-0-0], triple superphosphate (TSP; fertilizer grade: 0-46-0), and muriate of potash (fertilizer grade: 0-0-60) were used as the N, P, and K sources. Consequently, each soil–biochar bag received 0.38 g N (0.83 g urea) and 0.09 g P (0.21 g TSP), while the low-, medium-, and high-contaminated soils received 0, 0.10 (0.12 g potash), and 0.15 (0.19 g potash) g K, respectively. The urea, TSP, and potash fertilizers were first weighed into plastic cups and were then added to their respective soils at the same time that biochar was added. Each final soil–biochar–fertilizer mixture was vigorously mixed, as previously described, to effectively homogenize all ingredients in preparation for adding to the pots.
On 5 August 2021, bags containing the dry soil–biochar–fertilizer mixtures were added to pots. Discs of glass-fiber filter paper were cut to size, slotted to fit the uneven bottoms of the pots, and placed at the bottom of each pot prior to adding the soil–biochar–fertilizer mixtures to prevent soil loss through the small drainage holes at the bottoms of the pots. On 8 August 2021, pots were wetted to approximately field capacity (described below) using tap water and allowed to settle for 24 h prior to initial seeding.

2.5. Initial Seeding, Plant Establishment, and Pot Management

The initial seeding of two cultivars (‘Jinma’ and ‘Carmagnola’) into the amended soil–biochar–fertilizer mixtures occurred on 14 August 2021 to a planting depth of 1.9 cm [40]. ‘Carmagnola’ and ‘Jinma’ seeds were hand-placed into pre-made holes with a sharpened pencil and lightly pressed to the bottom of the hole with the eraser end of the pencil. Once the seed was in place, the hole was lightly, manually pinched shut and lightly, manually pressed vertically downward to create good soil–seed contact for germination. However, the initial seed germination rates were undesirable (i.e., ‘Carmagnola’ = 38% and ‘Jinma’ = 67% germination) due to the combination of non-ideal air temperature (>35 °C; optimal = 15 to 25 °C) and humidity (<20%; optimal = ~60%) conditions in the greenhouse in August, likely resulting in heat stress. Therefore, pots containing the contaminated soils were covered. The soil water content was checked on a weekly basis, and water was added as necessary before viable seedlings could be produced, which allowed additional time for the soil–biochar mixtures to equilibrate.
Three months after the initial seeding, a new seeding activity began in trays of potting soil inside the greenhouse. Seedling trays contained 48, small, evenly partitioned cells capable of holding ~100 cm3 of growth medium. Commercially available Miracle Gro potting mix (product number 75678304, The Scotts Company, Marysville, OH, USA) was used, which contained an allocation of fertilizer appropriate for seed germination and seedling development. The N content of the mix was derived from 11.3% ammoniacal N and 9.7% nitrate-N, the P content was derived from P2O5, and the K content was derived from K2O. A total of 96 seeds of each cultivar were planted to a depth of 1.9 cm. Once successful germination occurred, based on a target germination rate of 70 to 91% in a temperature range of 10 to 36 °C [41], and plants were provided three drops of a solution containing water and 23% N as urea. Once plants transitioned from the seed–leaf to the vegetative state of growth, seedlings were transplanted into the pots containing the original soil–biochar–fertilizer mixtures.
Plants selected for transplant were removed from their seeding flat with the use of a cutting implement. Once removed, the cube-shaped cells of the seeding flat were cut longitudinally along the full length of two corners to expose the seedling’s root mass. A spoon was used to excavate a small shallow cavity in the soil of each to approximate the size of the seedling root mass. Seedlings and root balls were carefully, manually transferred from the prepared starter tray to the soil cavity in a pot. The excavated soil removed during the creation of the transplant cavity was used to cover the potting-mix-ladened root mass.
A total of 14 plants survived the initial seeding from August and 82 plants were transplanted into the original soil–biochar–fertilizer mixtures at various times. The unifying characteristic of plant growth was that all plants were grown in/exposed to the soil–biochar–fertilizer mixture for 90 consecutive days prior to destructive sampling. However, the 90-consecutive-day period did not occur simultaneously for all plants.
A fungus gnat (Bradysia spp.) infestation that affected all plants occurred during the middle stage of the 90-day growth period. Physical, chemical, and biological control measures were taken to control the gnats and their in situ larvae in the soil. Any foliage that dropped from the plants was collected, oven-dried for 48 h at 65 °C, and stored separately by individual pot for later dry mass determination.
The climate-buffered greenhouse contained incandescent lighting that was sufficient for promoting plant growth (Metalarc M1000/U/BT37, Sylvania, Wilmington, MA, USA). Climate buffering during the warm season (i.e., April through September) consisted of forced-air evaporative cooling in conjunction with exhaust fans on the opposite end of the building. Air movement was supplemented using up to two variable-speed, oscillating pedestal fans (model S18607, Lasko, Inc., West Chester, PA, USA) per greenhouse bench, which were set on low speed. Fans were primarily used to reduce canopy heat stress during periods of elevated (i.e., >40 °C) daytime temperatures. During periods of colder weather (i.e., October through March), air temperature was controlled using a ceiling-mounted, natural-gas-operated, electronically controlled radiant heater.
For the duration of the greenhouse experiment, artificial lighting intervals consisted of a 12 h split between light and dark periods. A timer was adjusted to turn the lights on at 0600 h and off at 1800 h. Lights were positioned above the greenhouse benches at a distance of approximately 2 m for the duration of the experiment. Benches with the pots needed to be lowered on two different occasions to maintain the 2 m distance between the top of the growing plant canopy and the light source. Temperature and humidity were measured and periodically recorded throughout the duration of the plant growth phase in the greenhouse.

2.6. Plant Watering Scheme

Since the soils used in this trial had different initial sand, silt, and clay and SOM concentrations, it was necessary to conduct plant watering separately by soil treatment, up to a consistent soil water content for optimal plant growth. Based on the mean measured sand, clay, and SOM concentrations for each soil, the volumetric moisture content at field capacity was estimated using the Soil, Plant, Water, Atmosphere (SPAW) model’s soil water characteristics sub-routine [42] separately for the three soils, which resulted in 0.35, 0.23, and 0.27 cm3 cm−3 (i.e., 0.26, 0.15, and 0.23 g g−1) for the low-, medium-, and high-contaminated soils, respectively. After initial wetting of the air-dried soil to the estimated field capacity water content, and subsequent soil settling prior to initial seeding, the mean bulk density achieved was estimated for each soil–biochar combination.
Using the estimated bulk densities after initial settling and the estimated gravimetric water contents at field capacity from the SPAW model for each soil, a Theta Probe (SM150T, Dynamax, Inc., Houston, TX, USA) was used to measure the volumetric soil water content in the top 6 cm of soil and was calibrated to determine the target Theta-Probe-measured volumetric water content required to result in an approximate field capacity soil water content in each pot. Based on an initial Theta Probe measurement prior to each watering, a look-up chart was developed for each soil to specify the volume of water, to the nearest milliliter, that needed to be added to each pot to achieve the approximate target field capacity soil water content. Theta Probe measurements and the subsequent watering of plants occurred on an every-other-day basis. Watering requirements were determined using the Theta Probe to determine the soil moisture content on three randomly selected pots of each soil for each watering period. The three replicate soil moisture readings were averaged, and the result was entered into the look-up chart to determine soil-specific watering requirements.

2.7. Plant Measurements and Sample Collection, Processing, and Analyses

All plants were grown in and exposed to the naturally contaminated soil–biochar mixtures for a total of 90 days, despite having several different seeding/transplanting dates. At the completion of the 90-day growth period, plant height was measured from the soil surface to the approximate apical tip of the plant, and plant harvest occurred. Both above- and belowground plant tissues were harvested separately.
Stems were cut at the soil surface and the aboveground plant material was collected. Roots were collected from the soil and any remaining soil was gently hand-washed away from the root tissues using tap water. The soil–biochar mixture from each pot was placed into a plastic bag and placed on a greenhouse table. The bags of soil were kept unsealed for 7 days to reduce the soil water content. After 7 days, the bags of soil were sealed and transferred to the laboratory for the extraction and analysis of biochar (described below).
Aboveground and root tissues were oven-dried at 65 °C for 48 h. All dried samples were weighed to determine dry matter mass. Aboveground tissue samples were then finely ground and sieved through a 2 mm mesh screen. Ground plant tissues were weighed to 1 g and placed into 100 mL glass digestion tubes. Initially, samples were cold-soaked in 10 mL of nitric acid for 36 h, treated with 3 mL of 30% hydrogen peroxide and, following a 24 h reaction period, heated in accordance with the procedure for the acid digestion of plant materials by ICP-OES [43,44]. Subsequent tissue digestions occurred with 24 h time periods between applications of 30% hydrogen peroxide (i.e., 3, 1-mL doses per sample), instead of 3 mL at one time, to reduce the risk of contamination between samples and to enhance digestion efficiency. Digested tissues were diluted to 25 mL with deionized water and filtered through Whatman 42 filter paper into 20 mL scintillation vials and analyzed by ICP-OES for total Cd, Pb, and Zn concentrations.
Above- and belowground dry matter were summed to calculate total plant dry matter. Aboveground HM uptake was calculated from the measured dry matter, measured MH concentrations, and the pot surface area (cm2), on a pot-by-pot basis, for each soil–cultivar–biochar rate combination.
The bioconcentration factor (BCF) was used for the assessment of the metal concentration in the aboveground tissue relative to the initial soil concentration [45]. According to Yoon et al. [45], plants with a BCF > 1 are adept at hyperaccumulating heavy metals from soil. The BCF was calculated by dividing the aboveground Cd, Zn, and Pb tissue concentrations (mg kg−1), on a pot-by-pot basis, by the mean initial water-soluble Cd, Zn, and Pb concentrations (mg kg−1) for each soil used, which represented a deviation from Yoon et al. [45] who used the total recoverable soil concentration. Initial water-soluble Cd, Pb, and Zn concentrations (Table 1) were used in the BCF calculation instead of total recoverable concentrations because it was assumed that water-soluble HM concentrations would be a more appropriate indicator of environmentally available HM concentrations.

2.8. Biochar Collection, Processing, and Analyses

Once the plant material was removed, the remaining soil–biochar mixtures were air-dried for 7 days at ambient greenhouse temperatures (21 to 32 °C) in preparation for quantitative biochar removal from the soil. Pieces of biochar were removed manually with forceps under a magnifying glass until a target mass of 1.7 g of biochar had been collected. The 1.7 g target biochar mass was selected to compensate for the mass of soil particles that were likely adhering to the biochar particles and to ensure that enough material was available to prepare a second sample for analysis, if necessary. To remove adsorbed soil particles from the collected biochar, 0.5 g of each biochar sample were placed into linen tea bags and immersed in a 1% solution of sodium hexametaphosphate (SHMP). Samples were agitated in an end-over-end shaker set to 30 rpm for two hours to ensure complete dispersion and removal of soil particles from the biochar. The SHMP used in the sediment dispersion process was decanted, discarded, and replaced with 50 mL of deionized water to rinse any remaining sediments from the biochar materials. Washed biochar sample bags were again agitated on an end-over-end shaker at 30 rpm for two hours in sealed containers containing 50 mL of 1 N HCl so that H+ ions would replace HM cations on the biochar adsorption sites. After agitation, the 50 mL HCl solutions were decanted into 50 mL centrifuge tubes for Zn, Pb, and Cd analysis by ICP-OES. Biochar-HM uptake was calculated by multiplying the measured biochar-HM concentrations by the mass of biochar added to each pot for each separate biochar rate and divided by the soil surface area for each soil–cultivar–biochar rate combination.

2.9. Statistical Analyses

A one-factor analysis of variance (ANOVA) was performed using the PROC GLIMMIX procedure in SAS (version 9.4, SAS Institute, Inc., Cary, NC, USA) to evaluate the initial physical and chemical property differences among the three contaminated soils. Based on a completely random design, a three-factor ANOVA was performed using the PROC GLIMMIX procedure in SAS to evaluate the effects of hemp cultivar, biochar rate, soil contamination level, and their interactions on final plant, biochar, and soil properties (i.e., final plant height; above- and belowground and total plant dry matter; aboveground Cd, Pb, and Zn tissue concentrations and uptakes; BCF for Cd, Pb, and Zn; Cd, Pb, and Zn concentrations and uptakes of the biochar isolated from each pot). A gamma distribution was used for all data analyses, for which a log-transformation was conducted by SAS to achieve data normality. Significance was judged at the 0.05 level. When appropriate, treatment means were separated by least significant difference.

3. Results and Discussion

3.1. Initial Soil Properties

All initial physical and chemical properties differed (p < 0.03) among soils used in this greenhouse experiment (Table 1). Both Mehlich-3 and total recoverable Cd, Pb, and Zn concentrations differed (p < 0.01) among soils, which were lowest in the low-, intermediate in the medium-, and largest in the high-contaminated soil (Table 1). Total recoverable soil Cd, Pb, and Zn concentrations measured among the three contamination sites were similar to concentrations reported by Beattie et al. (2017) from a soil contamination survey conducted in and around Picher, Oklahoma. However, water-soluble Pb, Zn, and Cd concentration differences among soils were not as distinct as for Mehilch-3 and total recoverable concentrations (Table 1). Water-soluble Pb was largest for the high- and lowest for the low- and medium-contaminated soils, which did not differ (Table 1). In contrast, water-soluble Zn differed among all three soils, but was largest in the medium- and lowest in the low-contaminated soil, with the high-contaminated soil being intermediate (Table 1). Water-soluble Cd was largest for the medium- and high-contaminated soil, which did not differ, and was lowest for the low-contaminated soil (Table 1).
Measured sand, silt, and clay percentages indicated that the three soils had different textural classes (Table 1). The low-contaminated soil was a clay loam with 28% clay. The medium-contaminated soil was a loam with 11% clay. The high-contaminated soil was a silt loam with 9% clay. Though all three soils were initially slightly acidic, between 6.2 and 6.6, soil pH was largest in the high- and lowest in the low- and medium-contaminated soils, which did not differ (Table 1). In contrast, though large in all three soils, soil EC was largest in the low- and lowest in the medium- and high-contaminated soil, which did not differ (Table 1). Initial soil organic matter and TN concentrations differed among the three soils and were largest in the high-, intermediate in the low-, and lowest in the medium-contaminated soil (Table 1). In contrast, initial TC concentration was largest in the high-, intermediate in the medium-, and lowest in the low-contaminated soil (Table 1). Consequently, the resulting soil C:N ratio was largest in the high-, intermediate in the medium-, and lowest in the low-contaminated soil (Table 1), which meant that the low-contaminated soil likely provided the more optimal combination of soil C and N for sustaining microbial activity in the contaminated soils. The combination of differing properties among the contaminated soils, particularly the varying initial Pb, Zn, and Cd concentrations, contributed to numerous differential plant responses.

3.2. Aboveground and Belowground Plant Response

All aboveground plant properties [i.e., plant height, aboveground dry matter (DM), and Cd, Pb, and Zn concentrations and uptakes] were affected (p < 0.05) by one or more treatment effect (Table 3). Final plant height differed among soils (p < 0.01) and differed between cultivars (p < 0.01), but was unaffected (p > 0.05) by biochar rate (Table 3). Averaged across cultivars and biochar rates, plant heights in the low (87.6 cm) and medium (78.9 cm) soils, which did not differ, were at least 1.2 times taller than in the high-contaminated soil (65.5 cm; Table 4). The large HM concentration in the high-contaminated soil clearly negatively affected hemp growth [18,46]. Variations in plant height in this study were similar to the results of Stonehouse et al. [15], where aboveground biomass of industrial hemp was significantly (p < 0.05) reduced when grown in greenhouse soils amended with 80 µmol selenium (Se), but were unaffected by soils amended with Se concentrations between 10 and 40 µmol.
Averaged across soils and biochar rates, plant height was 1.3 times higher for ‘Carmagnola’ (87.5 cm) than for ‘Jinma’ (67.4 cm). The 90-day plant growth period occurred mostly between October and February. The greenhouse had a climate-buffering capacity, but was noticeably cooler during this time period compared to in August when the first planting was attempted. ‘Carmagnola’ is a cultivar that is broadly used throughout the industrial hemp industry and is reliably predicted to obtain an average height of between 4.5 and 5.5 m at full growth [47]. In contrast to ‘Carmagnola’, the ‘Jinma’ cultivar was only recently introduced to the North American industrial hemp industry, resulting in far fewer available data to reliably predict full-growth plant height potential. According to the recent industrial hemp trials in Georgia, ‘Jinma’ may be expected to grow to a height of between 2 and 4 m at full growth [48]. During the early stages of the experiment, greenhouse temperatures occasionally exceeded the optimal temperature range for growing industrial hemp (15 to 28 °C), and occasionally dropped below the optimal temperature range during the later portion of the experiment. The measured plant height may indicate that ‘Carmagnola’ is more suited for growth in temperature conditions towards the lower end of the ideal temperature range. Additionally, the plant height measured for ‘Carmagnola’ was similar to that reported by Candilo et al. [49], who reported that ‘Carmagnola’ had the greatest height among all industrial hemp cultivars used in a Pb and Zn phytoremediation study.
Aboveground dry matter (AGDM) varied (p < 0.01) among soils, but was unaffected (p > 0.05) by biochar and cultivar (Table 3). In contrast to other phytoremediation studies, such as that by Juraszek et al. [50] and Antonangelo and Zhang et al. [27], AGDM (i.e., biomass) did not differ among biochar amendments. For similar HM-contaminated soil from Picher, Oklahoma, Antonangelo and Zhang et al. [27] reported that greater ryegrass (Lolium perenne) biomass occurred at low rather than large biochar rates.
Averaged across biochar rates and cultivars, AGDM differed among all three soils, where AGDM in the low-contaminated soil was 1.2 and 2.0 times greater than in the medium- and high-contaminated soils, respectively (Table 4). This AGDM response was consistent with the initial hypothesis. The differences in plant height and AGDM were likely a manifestation of the increasing phytotoxicity of the HM, as the concentrations of Cd, Pb, and Zn in the high-contaminated soil were at least 3.9 and 23 times greater than in the low- and medium-contaminated soils, respectively (Table 1). Results of the current study are similar to those of Stonehouse et al. [15], who reported hemp seedlings and mature plants showed reduced growth as the level of soil Se concentration increased, and Picchi et al. [14], who reported decreased hemp biomass when grown in arsenic (As)-contaminated soil compared to an uncontaminated control soil.
In contrast to AGDM, and somewhat unexpectedly, belowground DM (BGDM) was unaffected (p > 0.05) by soil, cultivar, or biochar rate (Table 3). Belowground DM ranged from 0.009 g cm−2 in the medium-contaminated soil with 0% BC from ‘Carmagnola’ to 0.020 g cm−2 in the medium-contaminated soil with 2% BC from ‘Jinma’, and averaged 0.014 g cm−2 across all treatments. However, Picchi et al. [14] reported the decreased root length of hemp grown in As-contaminated soil relative to an uncontaminated control soil in a series of microcosm experiments.
In contrast to height and AGDM, AG tissue Cd (AGT-Cd) concentrations differed (p < 0.01) among soil–cultivar–biochar rate combinations (Table 3). Aboveground tissue Cd concentration was largest in the high-’Carmagnola’-5% BC (47.1 mg kg−1), which did not differ from that in the high-’Jinma’-10% BC, high-’Carmagnola’-10% BC, and high-’Jinma’-0% BC combinations, and was lowest in the low-’Carmagnola’-5% BC and low-’Jinma’-0% BC combinations (1.1 mg kg−1), which did not differ (Table 5). Within the high-contaminated soil, AGT-Cd concentrations were similar between cultivars in the 10, 2, and 0% BC, while the AGT-Cd concentration in the 5% BC was 2.4 times greater for ‘Carmagnola’ than for ‘Jinma’ (Table 5). Similarly, within the high-contaminated soil, AGT-Cd concentrations were generally greater in the 5 and 10% than in the 0 and 2% BC treatments across cultivars (Table 5). In the medium-contaminated soil, AGT-Cd concentrations were generally at least numerically lower than in the high-contaminated soil in each cultivar–biochar rate combination, with the exception of the ‘Carmagnola’-0% BC combination (Table 5). Similarly, within the medium-contaminated soil, AGT-Cd concentrations did not differ among any biochar rates for ‘Jinma’ and were similar to those for ‘Carmagnola’ in the 2, 5, and 10% BC treatments, but were 1.9 times greater in the ‘Carmagnola’-0% BC than in the ‘Carmagnola’-2% BC combination (Table 5). Within the low-contaminated soil, all AGT-Cd concentrations were lower than those from the high- and medium-contaminated soils, and there were no effects of cultivar or biochar rate on AGT-Cd concentration, thus all AGT-Cd concentrations were similar among cultivar-biochar rate combinations, ranging from 1.1 to 1.8 mg kg−1 (Table 5). The AGT-Cd concentration response was consistent with the initial hypothesis that AG tissue concentrations of heavy metal would be largest in the high- and smallest in the low-contaminated soil, thus leading to decreased plant growth as soil-contamination level increased, as evidenced by both plant height and AGDM responses (Table 4). However, the results here were generally inconsistent with the results of Cui et al. [51], who reported that AGT-Cd concentrations for winter wheat were reduced as the result of biochar application.
In contrast to AGT-Cd, AGT-Pb and -Zn concentrations differed (p < 0.04) among soil–cultivar combinations (Table 3). Averaged across biochar rate, AGT-Pb concentration was largest from the high-’Carmagnola’ (331 mg kg−1), which did not differ from the high-’Jinma’ combination, and was smallest from the low-’Carmagnola’ (13.8 mg kg−1) combination, which did not differ from the low-’Jinma’ combination (Figure 2A). Aboveground tissue Pb concentrations from the high-’Carmagnola’ and -’Jinma’ combinations were at least 3.2 times greater than from the other four combinations (Figure 2A). Aboveground tissue Pb concentrations in the medium-contaminated soil were at least 3.0 times greater from ‘Carmagnola’ than from ‘Jinma’, where both were at least 1.9 times greater than from both cultivars in the low-contaminated soil (Figure 2A). Aboveground tissue Pb concentrations did not differ between cultivars in the high- and low- contaminated soils (Figure 2A).
Similar to AGT-Pb, averaged across biochar rate, AGT-Zn concentration was largest from the high-’Carmagnola’ (1715 mg kg−1), which did not differ from the high-’Jinma’ combination, and was smallest from the low-’Jinma’ (104 mg kg−1) combination, which did not differ from the low-’Carmagnola’ combination (Figure 2B). Aboveground tissue-Zn concentrations from the high-’Carmagnola’ and -’Jinma’ combinations were at least 2.4 times greater than from the other four combinations (Figure 2B). Aboveground tissue Zn concentrations in the medium-contaminated soil were at least 2.1 times greater from ‘Carmagnola’ than from ‘Jinma’, where both were at least 2.9 times greater than from both cultivars in the low-contaminated soil (Figure 2B). Similar to AGT-Pb, AGT-Zn concentrations did not differ between cultivars in the high- and low-contaminated soils (Figure 2B). Both the AGT-Pb and -Zn results in the current study agreed with results of Stonehouse et al. (2020) [15], who reported larger tissue Se concentrations in plants grown in soils containing larger soil Se concentrations.
Aboveground tissue Pb concentrations also differed (p < 0.01) among biochar rates within soils (Table 3). Averaged across cultivar, AGT-Pb concentration was largest in the high-10% BC (779 mg kg−1), which did not differ from the high-5% BC, and was smallest in the low-0% BC (11.0 mg kg−1), which did not differ from the low-2, low-5, and low-10% BC combinations (Figure 3A). Aboveground tissue Pb concentrations in the high-5 and high-10% BC combinations were at least 5.1 times greater than in the high-0 and high-5% BC combinations, which did not differ (Figure 3A). Aboveground tissue Pb concentrations in the high-0 and high-2% BC combinations were at least 2.8 times greater than in the medium-2 and medium-10% BC combinations, which did not differ (Figure 3A). Aboveground tissue-Pb concentrations in the medium-2 and medium-10% BC combinations were at least 2.9 times greater than in the low-0, low-2, and low-5% BC combinations, which did not differ (Figure 3A). In contrast to the high-contaminated soil, AGT-Pb concentrations did not differ among biochar rates in the low- or medium-contaminated soil (Figure 3A).
In contrast to AGT-Cd and -Zn concentrations, AGT-Cd and -Zn uptakes differed (p < 0.01) among soils, but were unaffected (p > 0.05) by cultivar and biochar rate (Table 3). Averaged across cultivar and biochar rate, AGT-Cd uptake was largest in the high-contaminated soil, which did not differ from the medium-contaminated soil, while AGT-Cd uptake from both was at least 8.3 times greater than from the low-contaminated soil (Table 4). Similarly, AGT-Zn uptake differed among each soil, where, averaged across cultivar and biochar rate, AGT-Zn uptake was 2.1 and 7.3 times larger from the high-contaminated soil than from the medium- and low-contaminated soils, respectively, and was 3.5 times larger from the medium- than from the low-contaminated soil (Table 4).
In contrast to AGT-Cd and -Zn uptakes, but similar to AGT-Pb concentration, AGT-Pb uptake differed among biochar rates within soils (Table 3). Averaged across cultivar, AGT-Pb uptake was largest in the high-10% BC (0.016 mg cm−2), which did not differ from the high-5% BC, and was smallest in the low-0% BC (<0.001 mg cm−2), which did not differ from the low-2, low-5, and low-10% BC combinations (Figure 3B). Aboveground tissue Pb uptakes in the high-5 and high-10% BC combinations were at least 2.7 times greater than in the high-0 and high-5% BC combinations, which did not differ (Figure 3B). Aboveground tissue Pb uptakes in the high-0 and high-2% BC combinations were similar to those for all biochar rates in the medium-contaminated soil, which did not differ, and were at least 3.2 times greater than all biochar rates in the low-contaminated soil, which also did not differ (Figure 3B). Aboveground tissue Pb uptakes in the medium-0 and medium-5% BC combinations were at least 2.5 times greater than in the low-0, low-2, and low-5% BC combinations, which did not differ (Figure 3B). In contrast to the high-contaminated soil, AGT-Pb uptakes did not differ among biochar rates in the low- or medium-contaminated soil (Figure 3B). There appears to be a threshold that was exceeded with a BC rate greater than 2% (v/v) (i.e., 5 and 10% BC) in the high-contaminated soil to allow for greater hemp Pb uptake, which was not exceeded in the low- and medium-contaminated soils for any BC rate that controlled Pb uptake (Figure 3B). Though not immediately obvious, a plausible explanation for this occurrence may be related to significantly larger initial soil Pb concentrations in the high- compared to the low- and medium-contaminated soils (Table 1) to produce a larger Pb gradient between the soil and the BC and thus stimulate greater Pb availability for hemp uptake.
Antonangelo and Zhang et al. [27] reported that Cd, Pb, and Zn bioavailability for ryegrass decreased as biochar rate increased in similar HM-contaminated plants from Picher, Oklahoma, which differs from the results of the current study. Similarly, Fellet et al. [52] reported that biochar reduced the available Cd, Pb, and Zn concentrations in mine-tailings-contaminated soil, while Xu et al. [53] reported that biochar lowered Pb and Cd contents in ryegrass shoots. However, the HM-contaminated soil used by Antonangelo and Zhang et al. [27] was collected from near a chat pile in a residential yard and had lower total recoverable soil Cd, Pb, and Zn concentrations than the medium-contaminated soil used in the current study.
In general, HM concentrations and uptakes in the AG tissue were the largest in the high- and smallest in the low-contaminated soil, which is consistent with the initial hypothesis. These results were primarily due to the high-contaminated soil containing the largest and the low-contaminated soil containing the smallest collective HM concentrations (Table 1). The results of the current study are also similar to the results from Candilo et al. [49], who reported that AGT-Cd, -Pb, and -thallium (Tl) concentrations in ‘Carmagnola’ were larger in the soil with greater contamination and smaller in soils with less contamination.
Based on the AG HM uptake during the 90-day exposure in this study, HM uptake was estimated on a per-hectare basis for hemp grown in the high-contaminated soil with 10% BC. It was estimated that, averaged across cultivars, industrial hemp grown in the high-contaminated soil with 10% BC would accumulate ~0.1 kg Cd ha−1, ~1.6 kg Pb ha−1, and ~6.2 kg Zn ha−1 from 90 days of contaminated soil exposure. The area-scaled Cd accumulation estimate for the current study was similar to that reported by Linger et al. [54] for hemp in Germany [126 g ha−1 (vegetation period)−1]. Area-scaled accumulation estimates suggest that phytoremediation with industrial hemp grown in 10% BC in highly contaminated soil may be a worthwhile consideration as a combined remediation strategy, which also agrees with the recommendation of Linger et al. [54].
In contrast to the initial hypothesis are the general results for the effects of biochar rate on AGT concentrations and uptakes. It was expected that AG tissue concentrations and uptakes would be smallest in the 10% and largest in the 0 and/or 2% BC-amended soils. However, though AGT-Zn concentration and uptake were unaffected by biochar rate, the results show that AG tissue Cd and Pb concentrations and Pb uptakes were generally at least numerically the largest in the 5 or 10% BC and smallest in the 0 or 2% BC for the high-contaminated soil, but not generally in the medium- or low-contaminated soils. Consequently, the results suggest that the Douglas fir-derived biochar used in this study promoted the absorption and uptake of Cd and Pb by industrial hemp plants grown in combination with 5 or 10% BC.
Similar to the results of the current study, in a phytoremediation study that involved mine tailings containing Cd, Pb, and Zn, biochar derived from Douglas fir and three non-woody plant species [i.e., kidney vetch (Anthyllis vulneraria), round-leaved penny cress (Thlaspi rotundifolium), and alpine bluegrass (Poa alpina)], Fellet et al. [55] reported that biochar produced from Douglas fir pellets applied at rates of 1.5 and 3% (v/v) resulted in AGT-Cd, -Pb, and -Zn uptakes greater than tissue HM uptakes in the unamended control for kidney vetch and round-leaved penny cress, but not for alpine bluegrass. These results suggest that certain plant species may be more selective than others for HM absorption from the soil, and may indicate that biochar produced from a Douglas fir feedstock promotes greater HM uptake than less-selective plant species.
In contrast to the results of the current study, the ability of biochar to reduce AGT-HM concentrations and uptakes has been previously reported [27,50,56,57], and has been attributed primarily to pH-induced HM complexation and precipitation and biochar’s large capacity for HM adsorption to limit plant root exposure the HMs. However, a plausible explanation for increasing plant uptake with increasing biochar rate, as measured in the current study, may be related to the immediate development of a large concentration gradient between the HM-contaminated soil and the biochar itself, which was initially essentially devoid of Cd and Pb, but had a small initial concentration (Table 2) that stimulated the desorption and liquid-phase diffusion of dissolved HMs from the soil towards the biochar flakes, thus rendering the soluble HMs available for plant uptake while diffusing before biochar adsorption. Soil amended with the larger biochar rates created greater concentration gradients in all directions from each biochar flake compared to soil amended with the lower biochar rates.
Ferreiro et al. [58] suggested that biochar HM adsorption is closely linked to biochar’s large surface area and the effect of increasing alkalinity brought about by biochar addition to soils, especially from biochar produced using high-temperature pyrolysis, which tends to increase biochar pH. Similarly, Park et al. [23] reported that biochar immobilization of soil Cd and Pb may result from surface sorption by carbonyl and hydroxyl groups. According to Park et al. [23], biochar may have a greater capacity to immobilize Pb by complexation, as the result of introducing carbonate, phosphate, and/or sulfate into the soil. Furthermore, Chen et al. [56] indicated that biochar reduces HM mobility by processes such as adsorption, ion exchange, complexation, and/or precipitation, and that biochar addition may induce changes in soil properties, such as pH, which can directly alter the ability of soil particles to adsorb, precipitate, and/or complex HMs, similar to the direct effects of the biochar itself.
The plausible concentration gradient effect may be enhanced by the size fraction of biochar that was used for this study. Previous studies, such as Antonangelo and Zhang [27], prepared the biochar amendment by grinding the initial biochar to a size of ~0.025 mm prior to incorporation in the soil. In contrast, the biochar used in the current study was used in its original form from the manufacturer, which consisted of flaked material ~3 to 5 mm in size, without any additional manipulation. The decision to use the original form of biochar was intentional so that the biochar flakes could be separated from the soil for HM analysis at the conclusion of the plant growth period (discussed below). Therefore, the size of the biochar particles used in this study likely had less overall surface area and contact with soil particles than finely ground biochar particles, which may have contributed to a weaker effect of both pH and adsorption compared to results of studies using finely ground biochar.
According to Liao and Thomas [59], it has become common practice to use ground or small-particle-size biochar to enhance soil contact surface area and the mixing of soil with biochar particles. In a study comparing soil pH, water retention, and phosphorus availability induced using different biochar particle sizes, Sarfraz et al. [60] reported that fine-sized biochar (≤0.5 mm) increased soil pH more than large-particle-sized (1 to 2 mm) biochar. Liao and Thomas [59] suggested that the greater liming effect from biochar with a small particle size was due to the greater soil–biochar contact surface area. Biochar, particularly produced from a large-particle-sized feedstock (e.g., trees), is generally low in adsorptive functional groups and has a large concentration of alkaline earth metals [61]. However, biochar produced from a small-particle-sized feedstock typically has a greater concentration of adsorptive functional groups and lower C concentration due to typically lower pyrolysis temperatures [61]. In contrast, biochar produced from large-particle-sized feedstocks requires pyrolysis temperatures greater than 500 °C, resulting in the loss of hydroxyl (-OH) groups from dehydration and the loss of C-bound O and H from de-stabilization associated with high pyrolysis temperatures [61]. Similarly, and because of the greater amount of heat required to produce biochar from large-particle-sized feedstocks, the C concentration tends to be larger and the associated ash content is significantly lower than biochar produced at lower temperatures, which tends to have greater ash and less C [62]. Therefore, biochar produced from a large-particle-sized feedstock, such as Douglas fir, should have a lower ash concentration and therefore a reduced effect on soil pH compared to a biochar with a greater ash concentration.

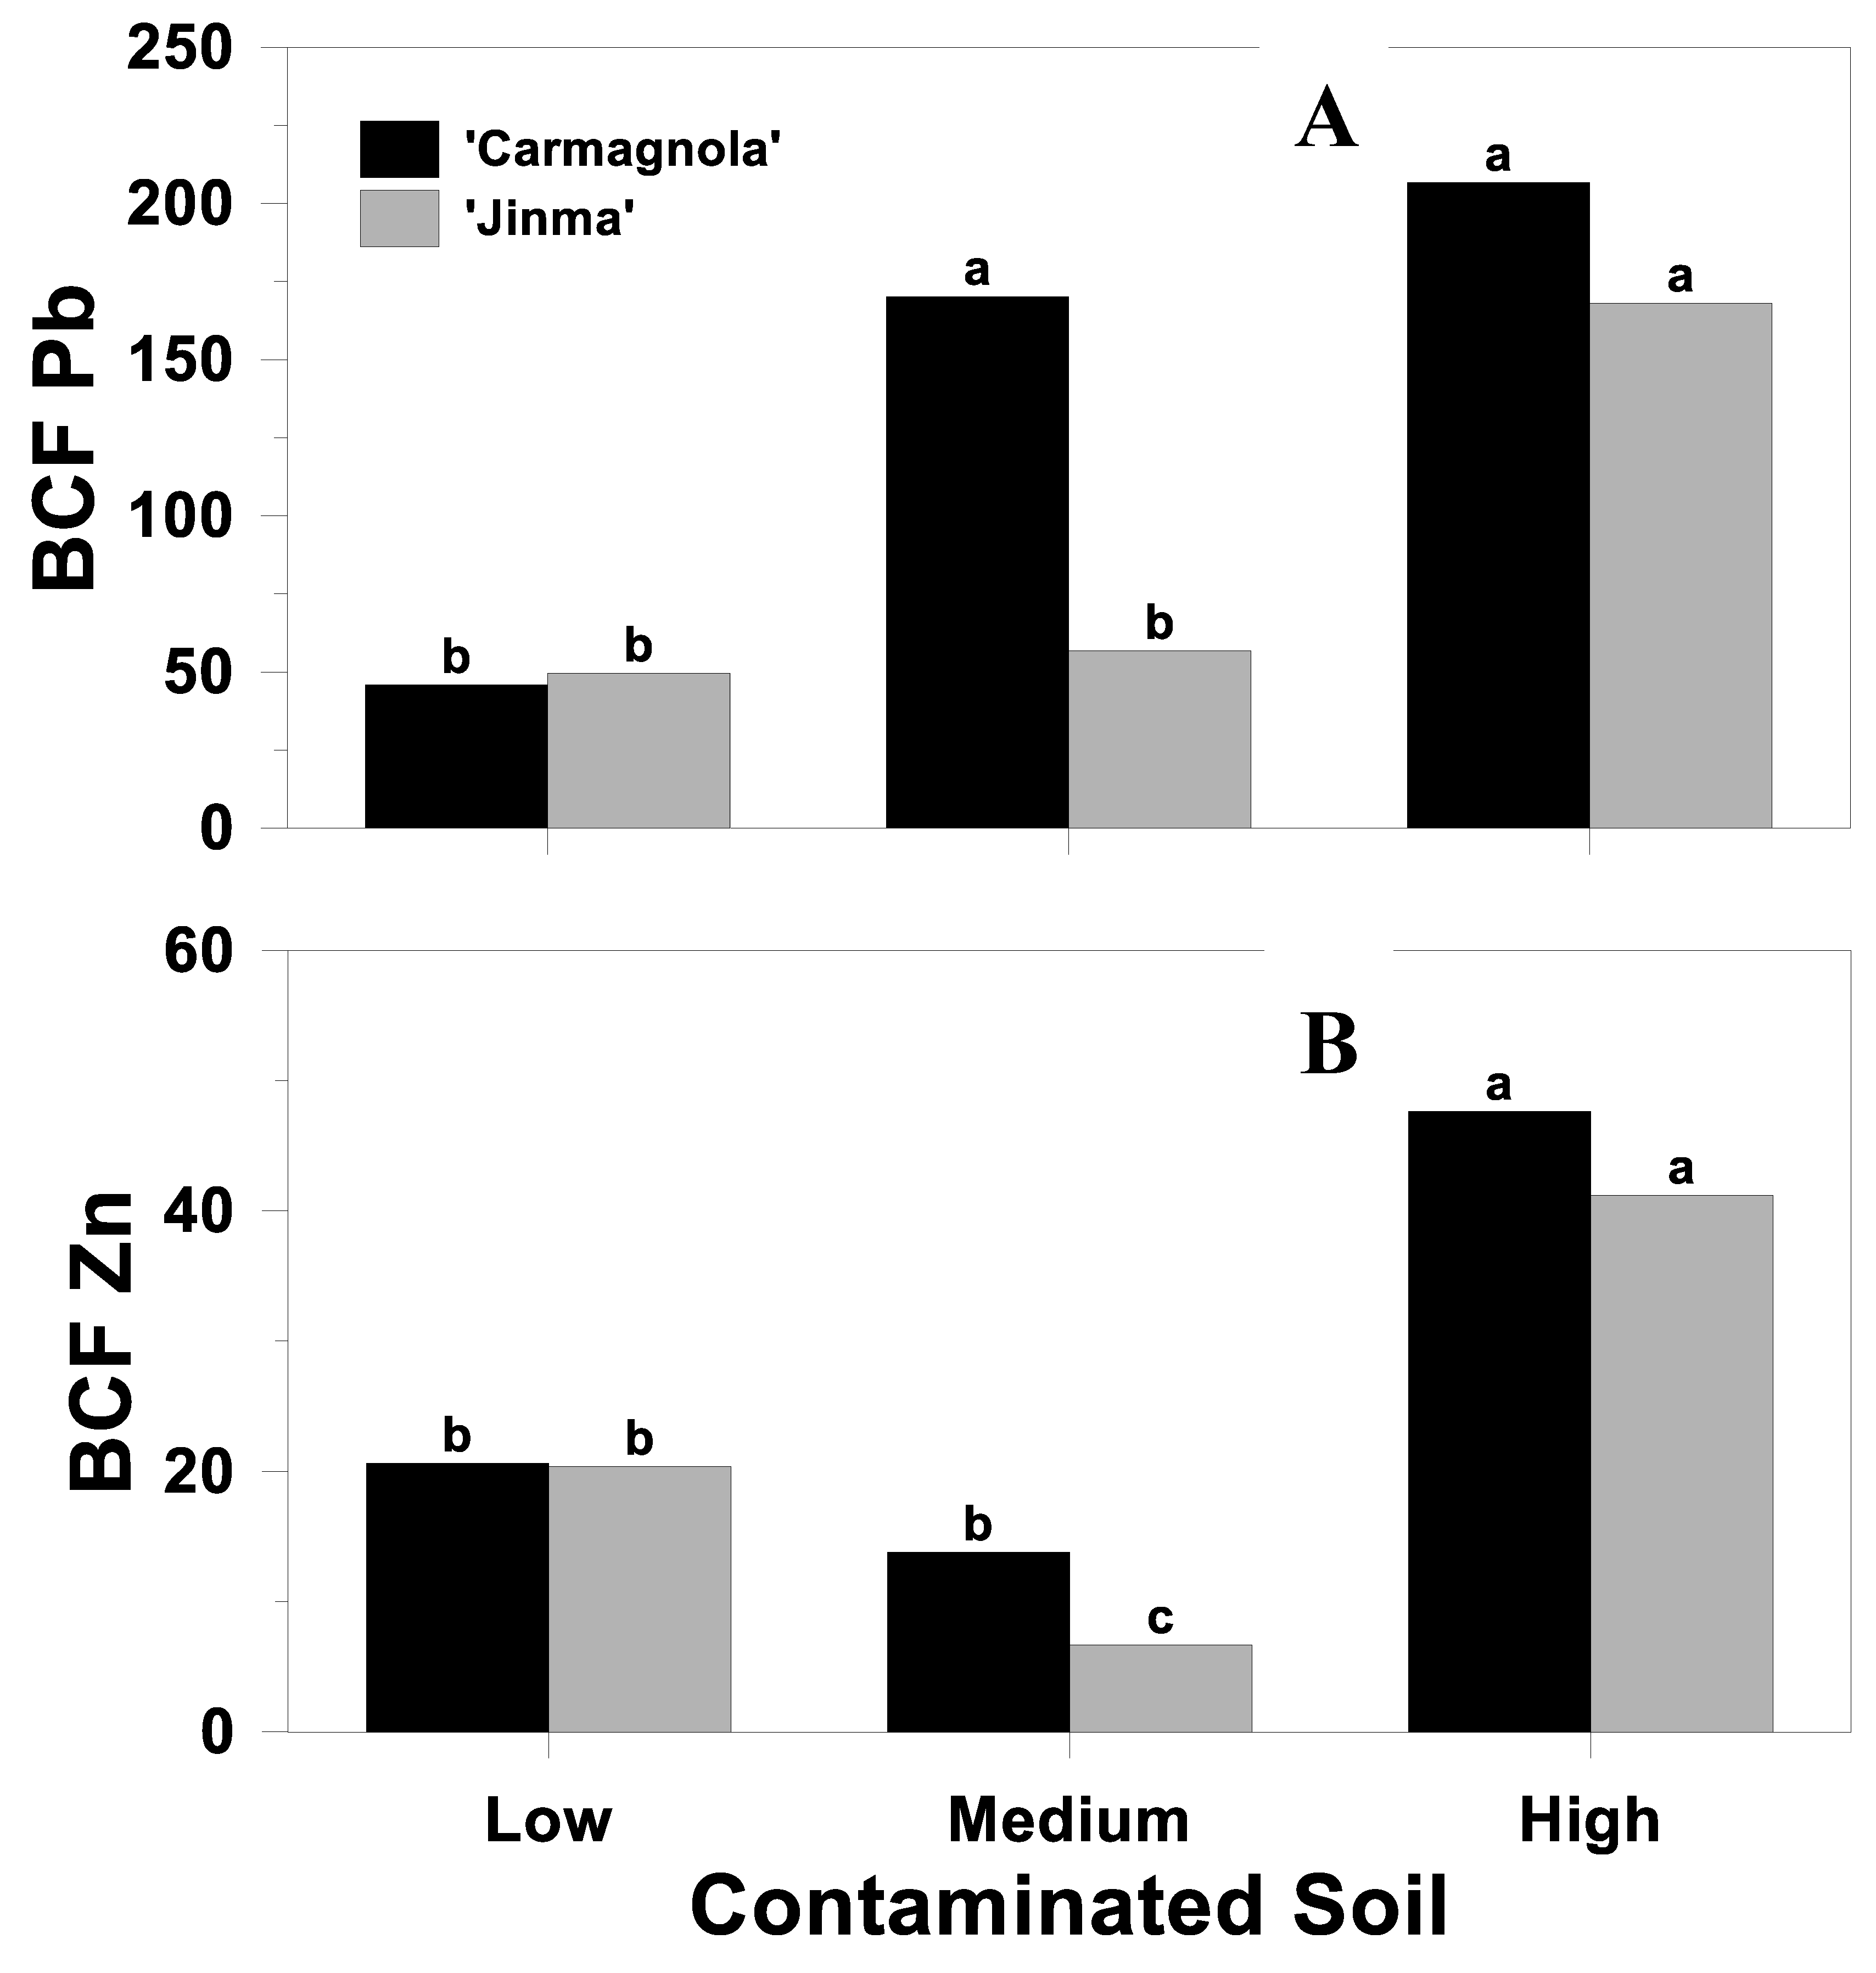
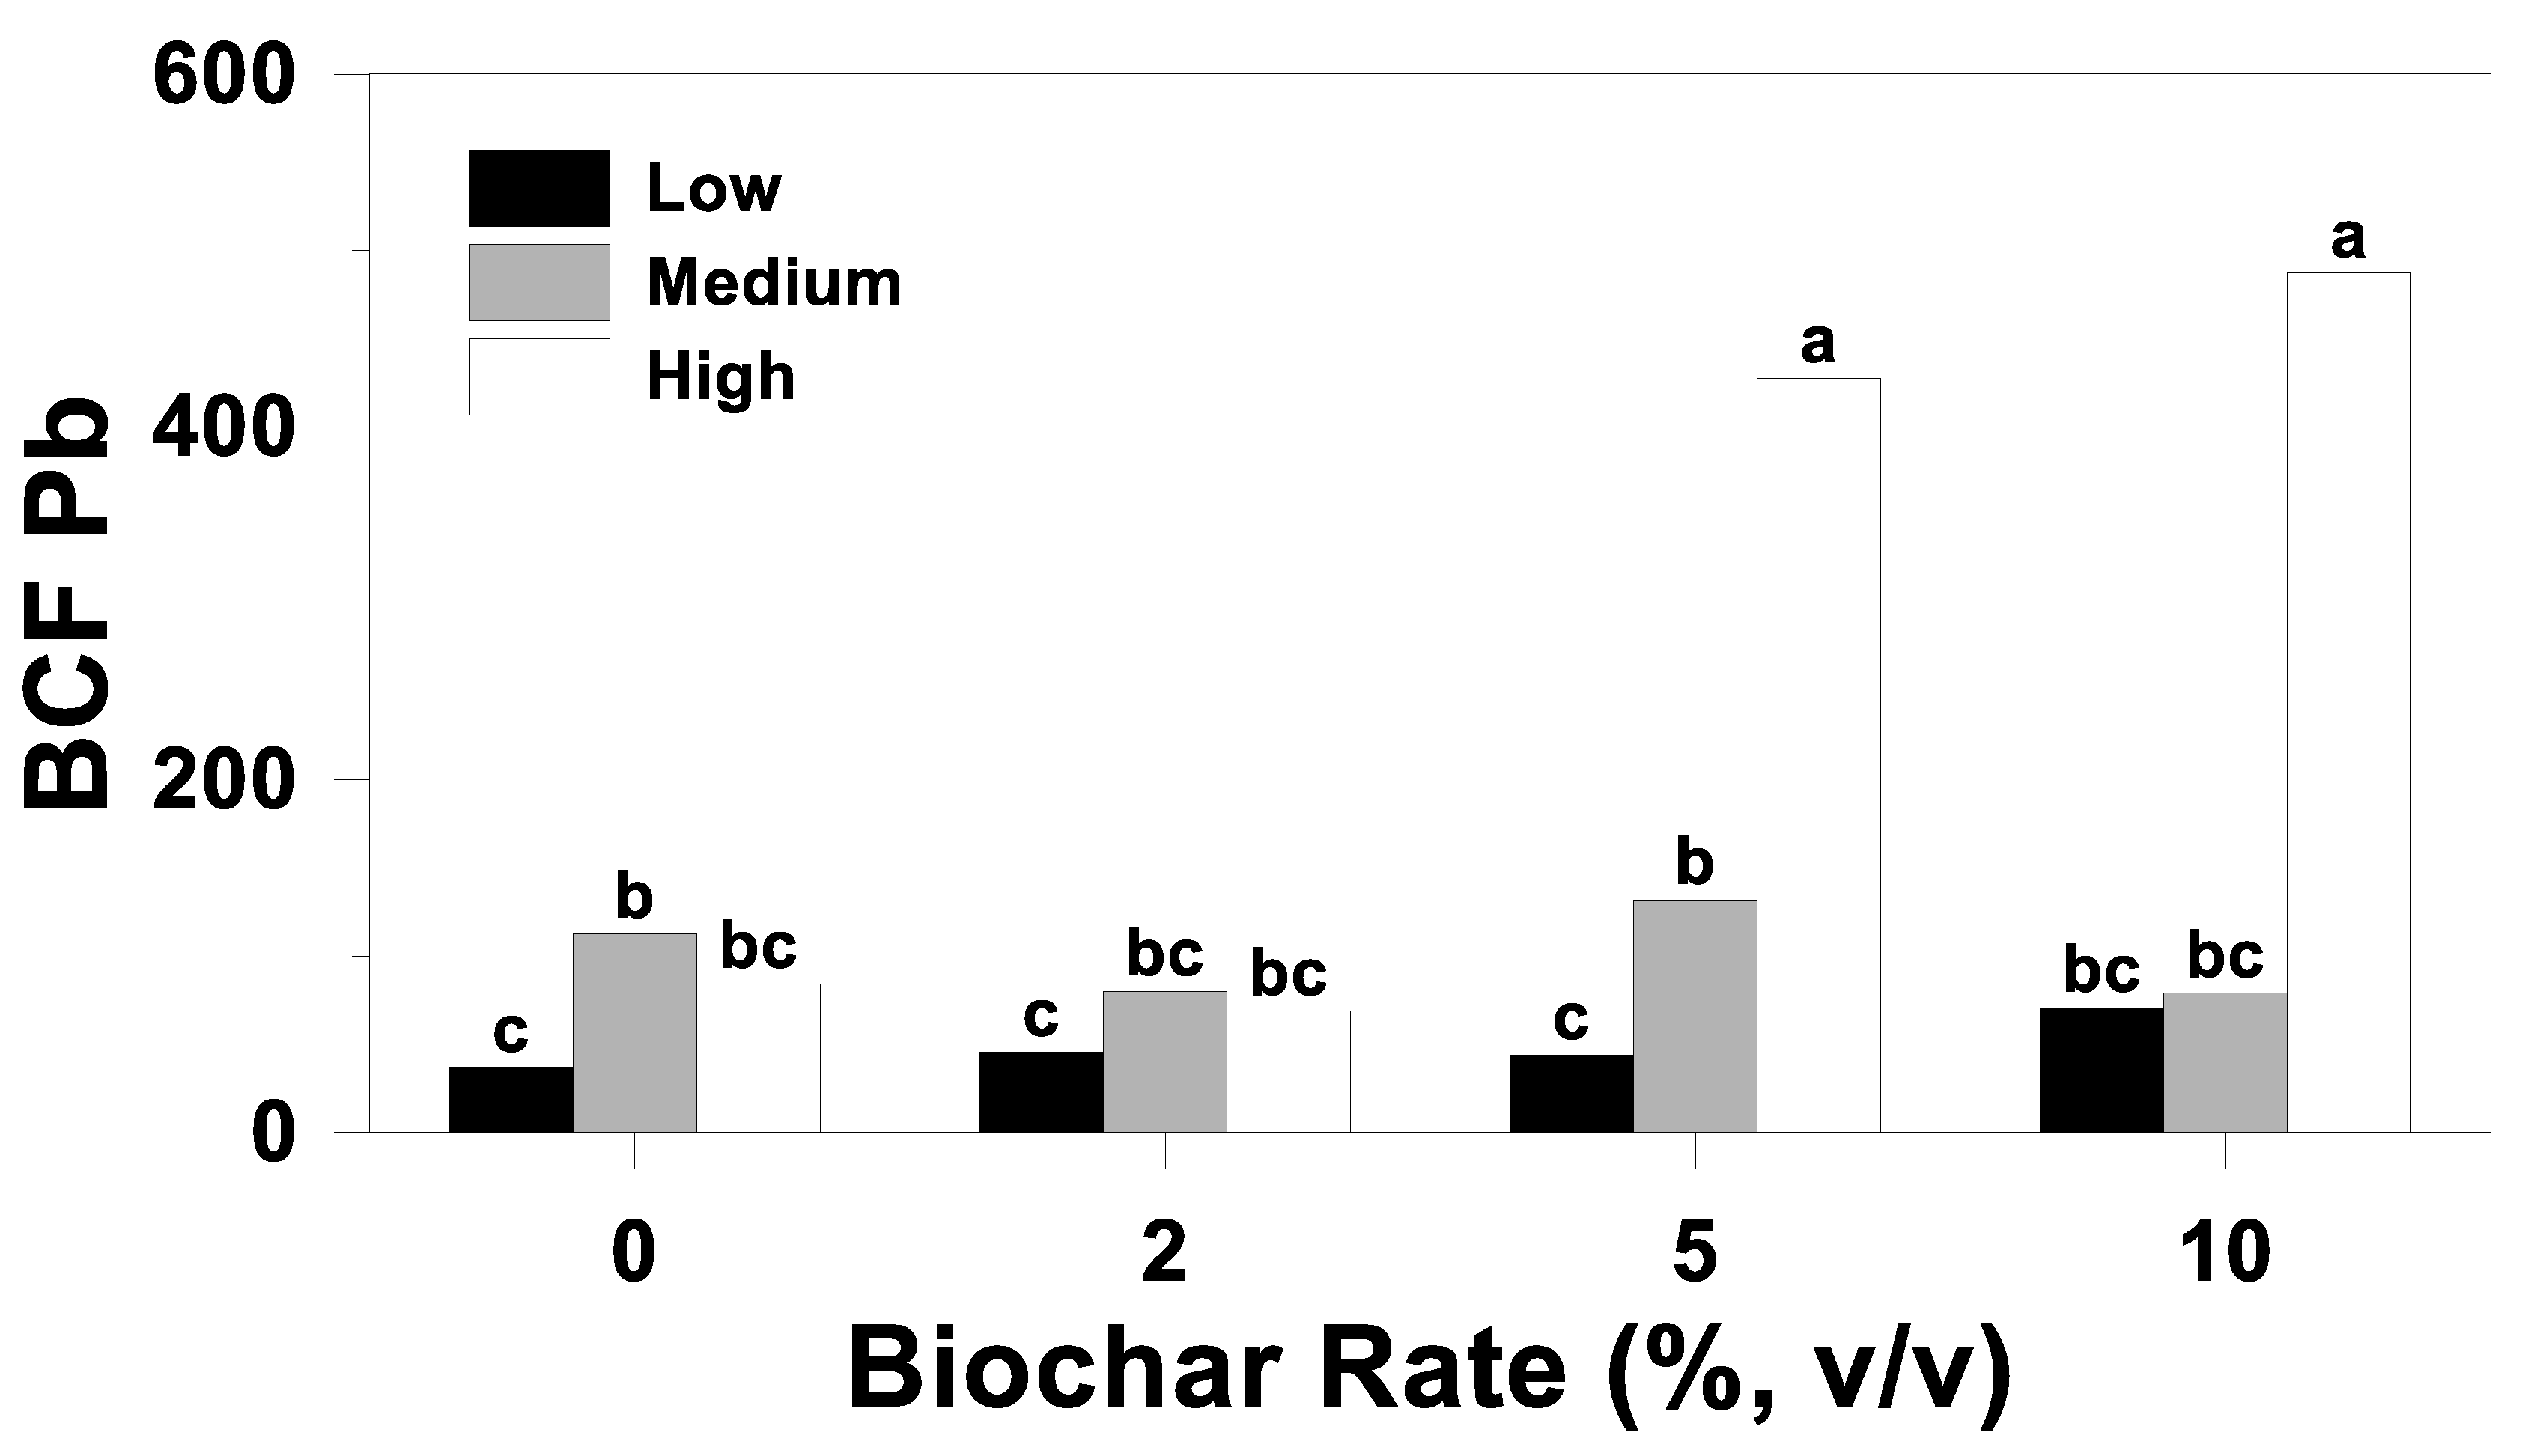
3.3. Bioconcentration Factor

Bioconcentration factors, calculated as the ratio of AGT HM concentration to the initial water-soluble soil HM concentration, were affected (p < 0.05) by soil, cultivar, biochar rate, or their interactions (Table 6). Similar to AGT-Cd concentration, Cd BCF differed (p < 0.04) among soil–cultivar–biochar rate combinations (Table 6). Cadmium BCF was largest in the high-’Carmagnola’-5% BC (42.9), which did not differ from that in the high-’Jinma’-10% BC, high-’Carmagnola’-10% BC, and high-’Jinma’-0% BC combinations (Table 5). Cadmium BCF was lowest in the low-’Jinma’-0% BC combination (5.3), which did not differ from any other cultivar–biochar rate combinations in the low-contaminated soil and the ‘Carmagnola’-2% BC and ‘Jinma’-5 and ‘Jinma’-10% BC combinations (Table 5). Within the high-contaminated soil, Cd BCFs were similar between cultivars in the 10, 2, and 0% BC, while the Cd BCF in the 5% BC was 2.4 times greater for ‘Carmagnola’ than for ‘Jinma’ (Table 5). Similarly, within the high-contaminated soil, Cd BCFs were greater in the 5 or 10% than in the 0 or 2% BC treatments for both cultivars (Table 5). In the medium-contaminated soil, Cd BCFs were generally at least numerically lower than from the high-contaminated soil in each cultivar–biochar rate combination, with the exception of the ‘Carmagnola’-0% BC combination (Table 5). Similarly, within the medium-contaminated soil, Cd BCFs did not differ among any biochar rates for ‘Jinma’ and were similar to those for ‘Carmagnola’ in the 2, 5, and 10% BC treatments, but were 1.9 times greater in the ‘Carmagnola’-0% than in the ‘Carmagnola’-2, ‘Jinma’-5, and ‘Jinma’-10% BC combination (Table 5). Within the low-contaminated soil, all Cd BCFs were at least numerically lower than those from the high- and medium-contaminated soils for each biochar rate, and Cd BCF did not differ among any cultivar–biochar rate combinations (Table 5).
In contrast to Cd, both Pb and Zn BCF differed (p < 0.04) between cultivars within soils (Table 6). Averaged across soils, Pb BCF was largest for ‘Carmagnola’ in the high-contaminated soil (207), which did not differ from ‘Carmagnola’ in the medium- or ‘Jinma’ in the high-contaminated soil, and was smallest for ‘Carmagnola’ in the low-contaminated soil (45.9), which did not differ from ‘Jinma’ in the low- and ‘Jinma’ in the medium-contaminated soil (Figure 4A). Lead BCF for ‘Carmagnola’ and ‘Jinma’ in the high- and ‘Carmagnola’ in the medium-contaminated soil were at least 3.0 times greater than for ‘Carmagnola’ and ‘Jinma’ in the low- and ‘Jinma’ in the medium-contaminated soil (Figure 4A). Lead BCF did not differ between cultivars in the low- or high-contaminated soils, but was 3.0 times greater for ‘Carmagnola’ than for ‘Jinma’ in the medium-contaminated soil (Figure 4A).
Averaged across soils, Zn BCF was largest for ‘Carmagnola’ in the high-contaminated soil (47.6), which did not differ from ‘Jinma’ in the high-contaminated soil, and was smallest for ‘Jinma’ in the medium-contaminated soil (6.7; Figure 4B). Zinc BCF for ‘Carmagnola’ and ‘Jinma’ in the high-contaminated soil were at least 2.0 times greater than for ‘Carmagnola’ and ‘Jinma’ in the low- and ‘Carmagnola’ in the medium-contaminated soil, which did not differ, and 6.2 times greater than for ‘Jinma’ in the medium-contaminated soil (Figure 4B). Zinc BCF for ‘Carmagnola’ and ‘Jinma’ in the low-contaminated soil and ‘Carmagnola’ in the medium-contaminated soil were at least 2.1 times greater than for ‘Jinma’ in the medium-contaminated soil (Figure 4B). Zinc BCF did not differ between cultivars in the low- or high-contaminated soils, but was 2.1 times greater for ‘Carmagnola’ than for ‘Jinma’ in the medium-contaminated soil (Figure 4B).
In contrast to Cd and Zn BCF, but similar to AGT-Pb concentrations and uptakes, Pb BCF also differed (p < 0.01) among biochar rates within soils (Table 6). Averaged across cultivar, Pb BCF was largest for the high-contaminated soil, with 10% BC (487), which did not differ from the high-contaminated soil with 5% BC, and was smallest for the low-contaminated soil, with 0% BC (36.7), which did not differ from the low-contaminated soil with 2, 5, or 10% BC or the medium-contaminated soil with 2 and 10% BC, or the high-contaminated soil with 0 and 2% BC (Figure 5). Lead BCFs for the high-contaminated soil with 5 and 10% BC were at least 3.2 times greater than for all other soil–biochar rate combinations (Figure 5). Lead BCFs for the medium-contaminated soil with 0 and 5% BC were at least 2.5 times greater than for the low-contaminated soil with 0, 2, and 5% BC (Figure 5). Lead BCFs did not differ among any biochar rates in the low- and medium-contaminated soils, but were at least 5.1 times greater in the 5 and 10% BC than in the 0 and 2% BC in the high-contaminated soil (Figure 5).
Though Zn BCF was unaffected by biochar rate, results for Cd and Pb generally support the initial hypothesis that BCF would be largest in the high-contaminated soil and decrease as the level of initial soil contamination decreased. However, results for Cd and Pb differed from the initial hypothesis that BCF would be smallest in the 10% and largest in the 2% BC treatments.
According to Antonangelo and Zhang [27] and Yoon et al. [45], the principal use of the BCF is to determine a particular plant species’ suitability for phytoremediation. Additionally, BCFs > 1 are generally considered to indicate plant species that are HM hyperaccumulators [45]. Regardless of significant treatment effects (Table 5, Figure 4A,B and Figure 5), all BCFs calculated for Cd, Pb, and Zn, based on their initial water-soluble soil concentrations (Table 1), exceeded 1, indicating that both ‘Carmagnola’ and ‘Jinma’ could be considered a Cd, Pb, and Zn hyperaccumulator in the low-, medium-, and high-contaminated soils. Consequently, based on BCFs calculated from initial water-soluble soil concentrations, it appears that both ‘Carmagnola’ and ‘Jinma’ may be reasonable choices for the phytoremediation of mixed Cd-, Pb-, and Zn-contaminated soils, which supports the recent interpretation of Rheay et al. [63] that hemp has the ability to reduce soil Cd, Pb, and Zn concentrations. Linger et al. [54] arrived at a similar conclusion for Cd accumulation by hemp grown in HM-contaminated soil. Linger et al. [54] also reported relatively large tissue Cd concentrations in hemp leaves, which was attributed to efficient xylem sap transport from roots to aboveground tissue. However, had BCFs been calculated based on Mehlich-3-extractable HM concentrations, for which Mehlich-3-extractable soil nutrient concentrations are considered to be most closely related to plant-available concentrations, only 7 of a possible 94 replicates across all treatment combinations would have had a BCF > 1 for Cd, and there were none for Pb or Zn. Furthermore, had BCFs been calculated based on total recoverable HM concentrations, only 2 of a possible 94 replicates across all treatment combinations would have had a BCF > 1 for Cd, and there were none for Pb or Zn.
Though not formally compared, BCFs for Pb (Figure 4A and Figure 5) were numerically larger than those for Cd (Table 5) or Zn (Figure 4B). These results may indicate that the effect of increased soil alkalinity, as a result of the biochar addition, increased soil Pb solubility more than the soil Cd or Zn solubilities. These results were similar to those of Sauve et al. [64], who reported that 80 to 99% of dissolved Pb is present as a complex with soluble organic matter at near-neutral soil pH.
An additional use of the BCF for this study was to further evaluate whether plant HM concentrations increased as the biochar rate increased. The BCF can be considered a measure of the plant’s efficiency at accumulating HMs in the AG tissue. In general, using this principle, the BCF for Pb was unaffected by biochar rate in both the low- and medium-contaminated soils for both cultivars (Figure 5), and the BCF for Cd was unaffected by biochar rate in the low- and generally unaffected by biochar rate in the medium-contaminated soil for both cultivars (Table 5). However, Cd BCF in the high-contaminated soil for both cultivars (Table 5) and Pb BCF (Figure 5) generally at least numerically increased as biochar rate increased. Interpreting BCFs in this manner corroborates the indication that the Douglas fir-derived biochar used in this study enhanced aboveground HM uptake, which was contrary to the initial hypothesis.

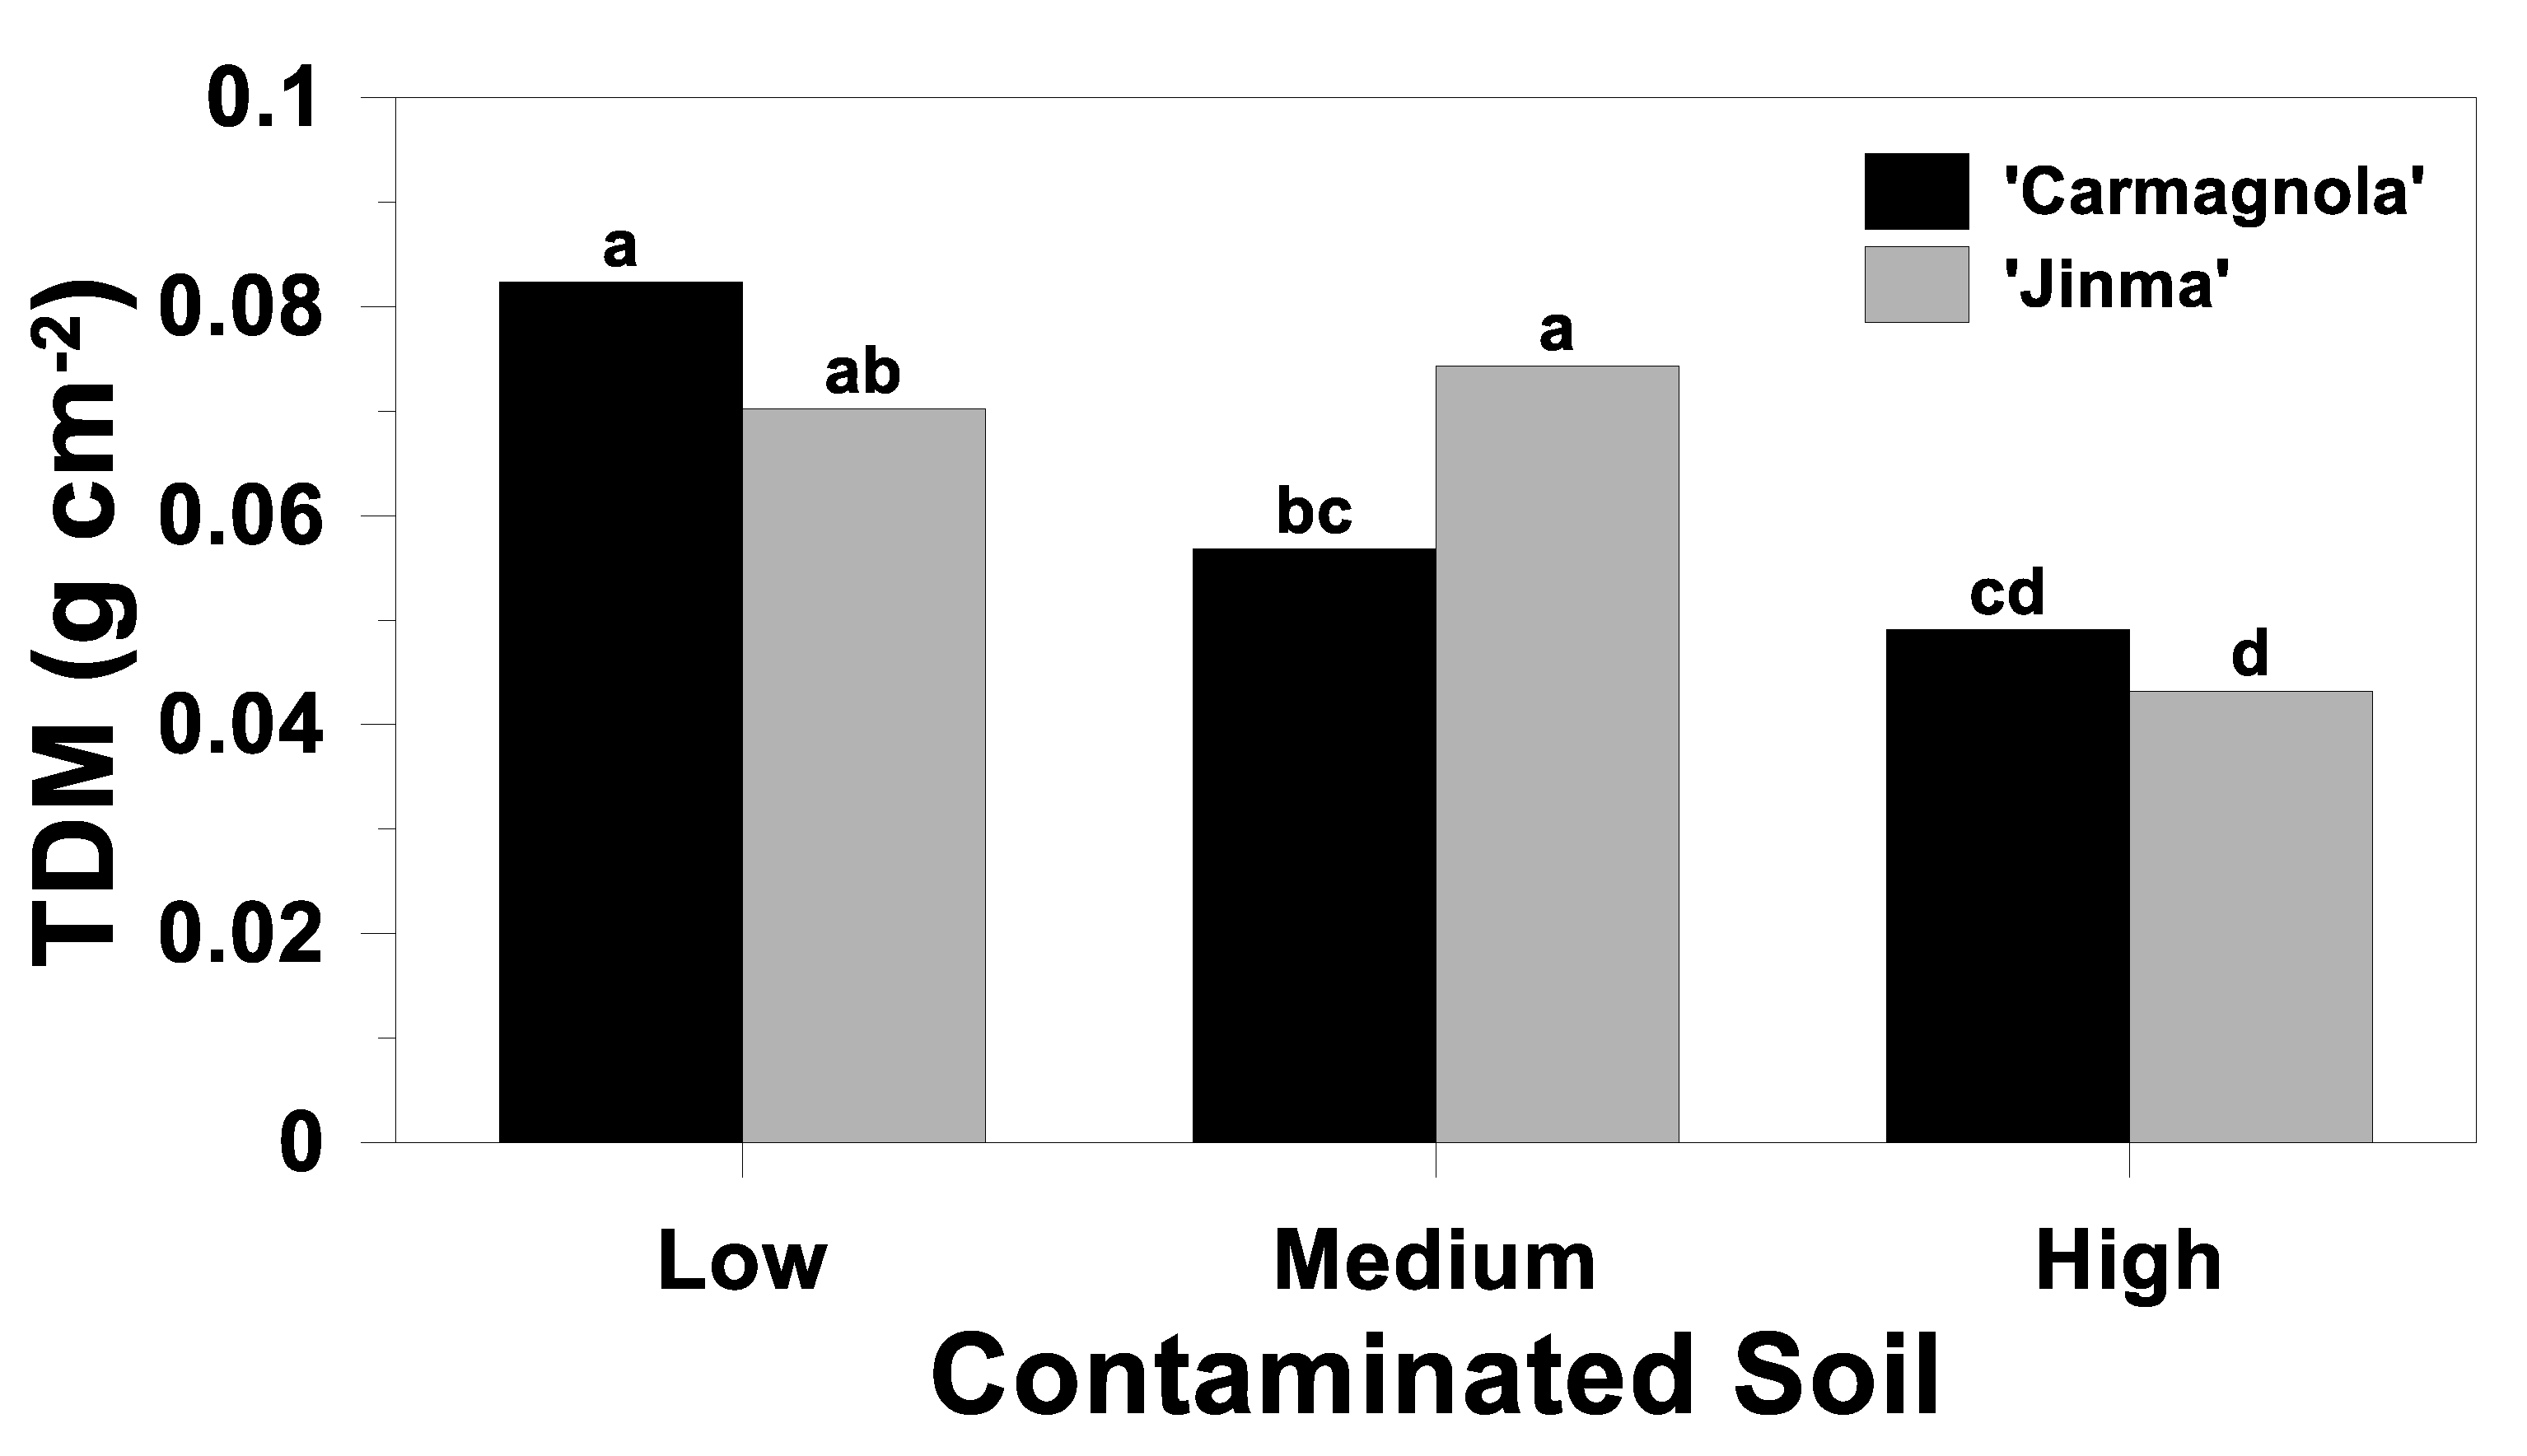
3.4. Whole-Plant Response

In contrast to AG- and BGDM, total plant DM differed among soil–cultivar combinations (p = 0.03), but, similar to AG- and BGDM, was unaffected (p > 0.05) by biochar rate (Table 3). Averaged across biochar rates, total DM was numerically largest for ‘Carmagnola’ in the low-contaminated soil, which did not differ from ‘Jinma’ in the low- and medium-contaminated soils (Figure 6). The numerically smallest total DM was for ‘Jinma’ in the high-contaminated soil, which did not differ from ‘Carmagnola’ in the medium- and high-contaminated soils (Figure 6). Total DM was unaffected by cultivar in the low- and high-contaminated soils, while total DM for ‘Jinma’ was 1.3 times greater than ‘Carmagnola’ in the medium-contaminated soil (Figure 6).
Results for total DM were consistent with the initial hypothesis, where DM was expected to be smallest in the soil with the greatest and largest in the soil with the smallest HM concentrations of Cd, Pb, and Zn, which was indicative of the negative effect on plant health and growth induced by exposure to the HM-contaminated soil. The results for total DM were also similar to results reported by Chibuike and Obiora [65], who concluded that reduced plant growth in soils contaminated with Pb, Cd, mercury (Hg), arsenic (As), and Zn occur as the result of reduced photosynthesis, replacement of beneficial nutrients at exchange sites by HM cations, and reduced soil enzyme activity. Chibuike and Obiora [65] also reported that wheat root and shoot growth were unaffected by soil Cd < 5 mg kg−1, but were affected at soil Cd ≥ 5 mg kg−1. Similarly, Chibuike and Obiora [65] showed that cluster bean (Cyamopsis tetragonoloba) root and shoot growth were unaffected at soil Zn < 25 mg kg−1, but were significantly affected when soil Zn was ≥50 mg kg−1.

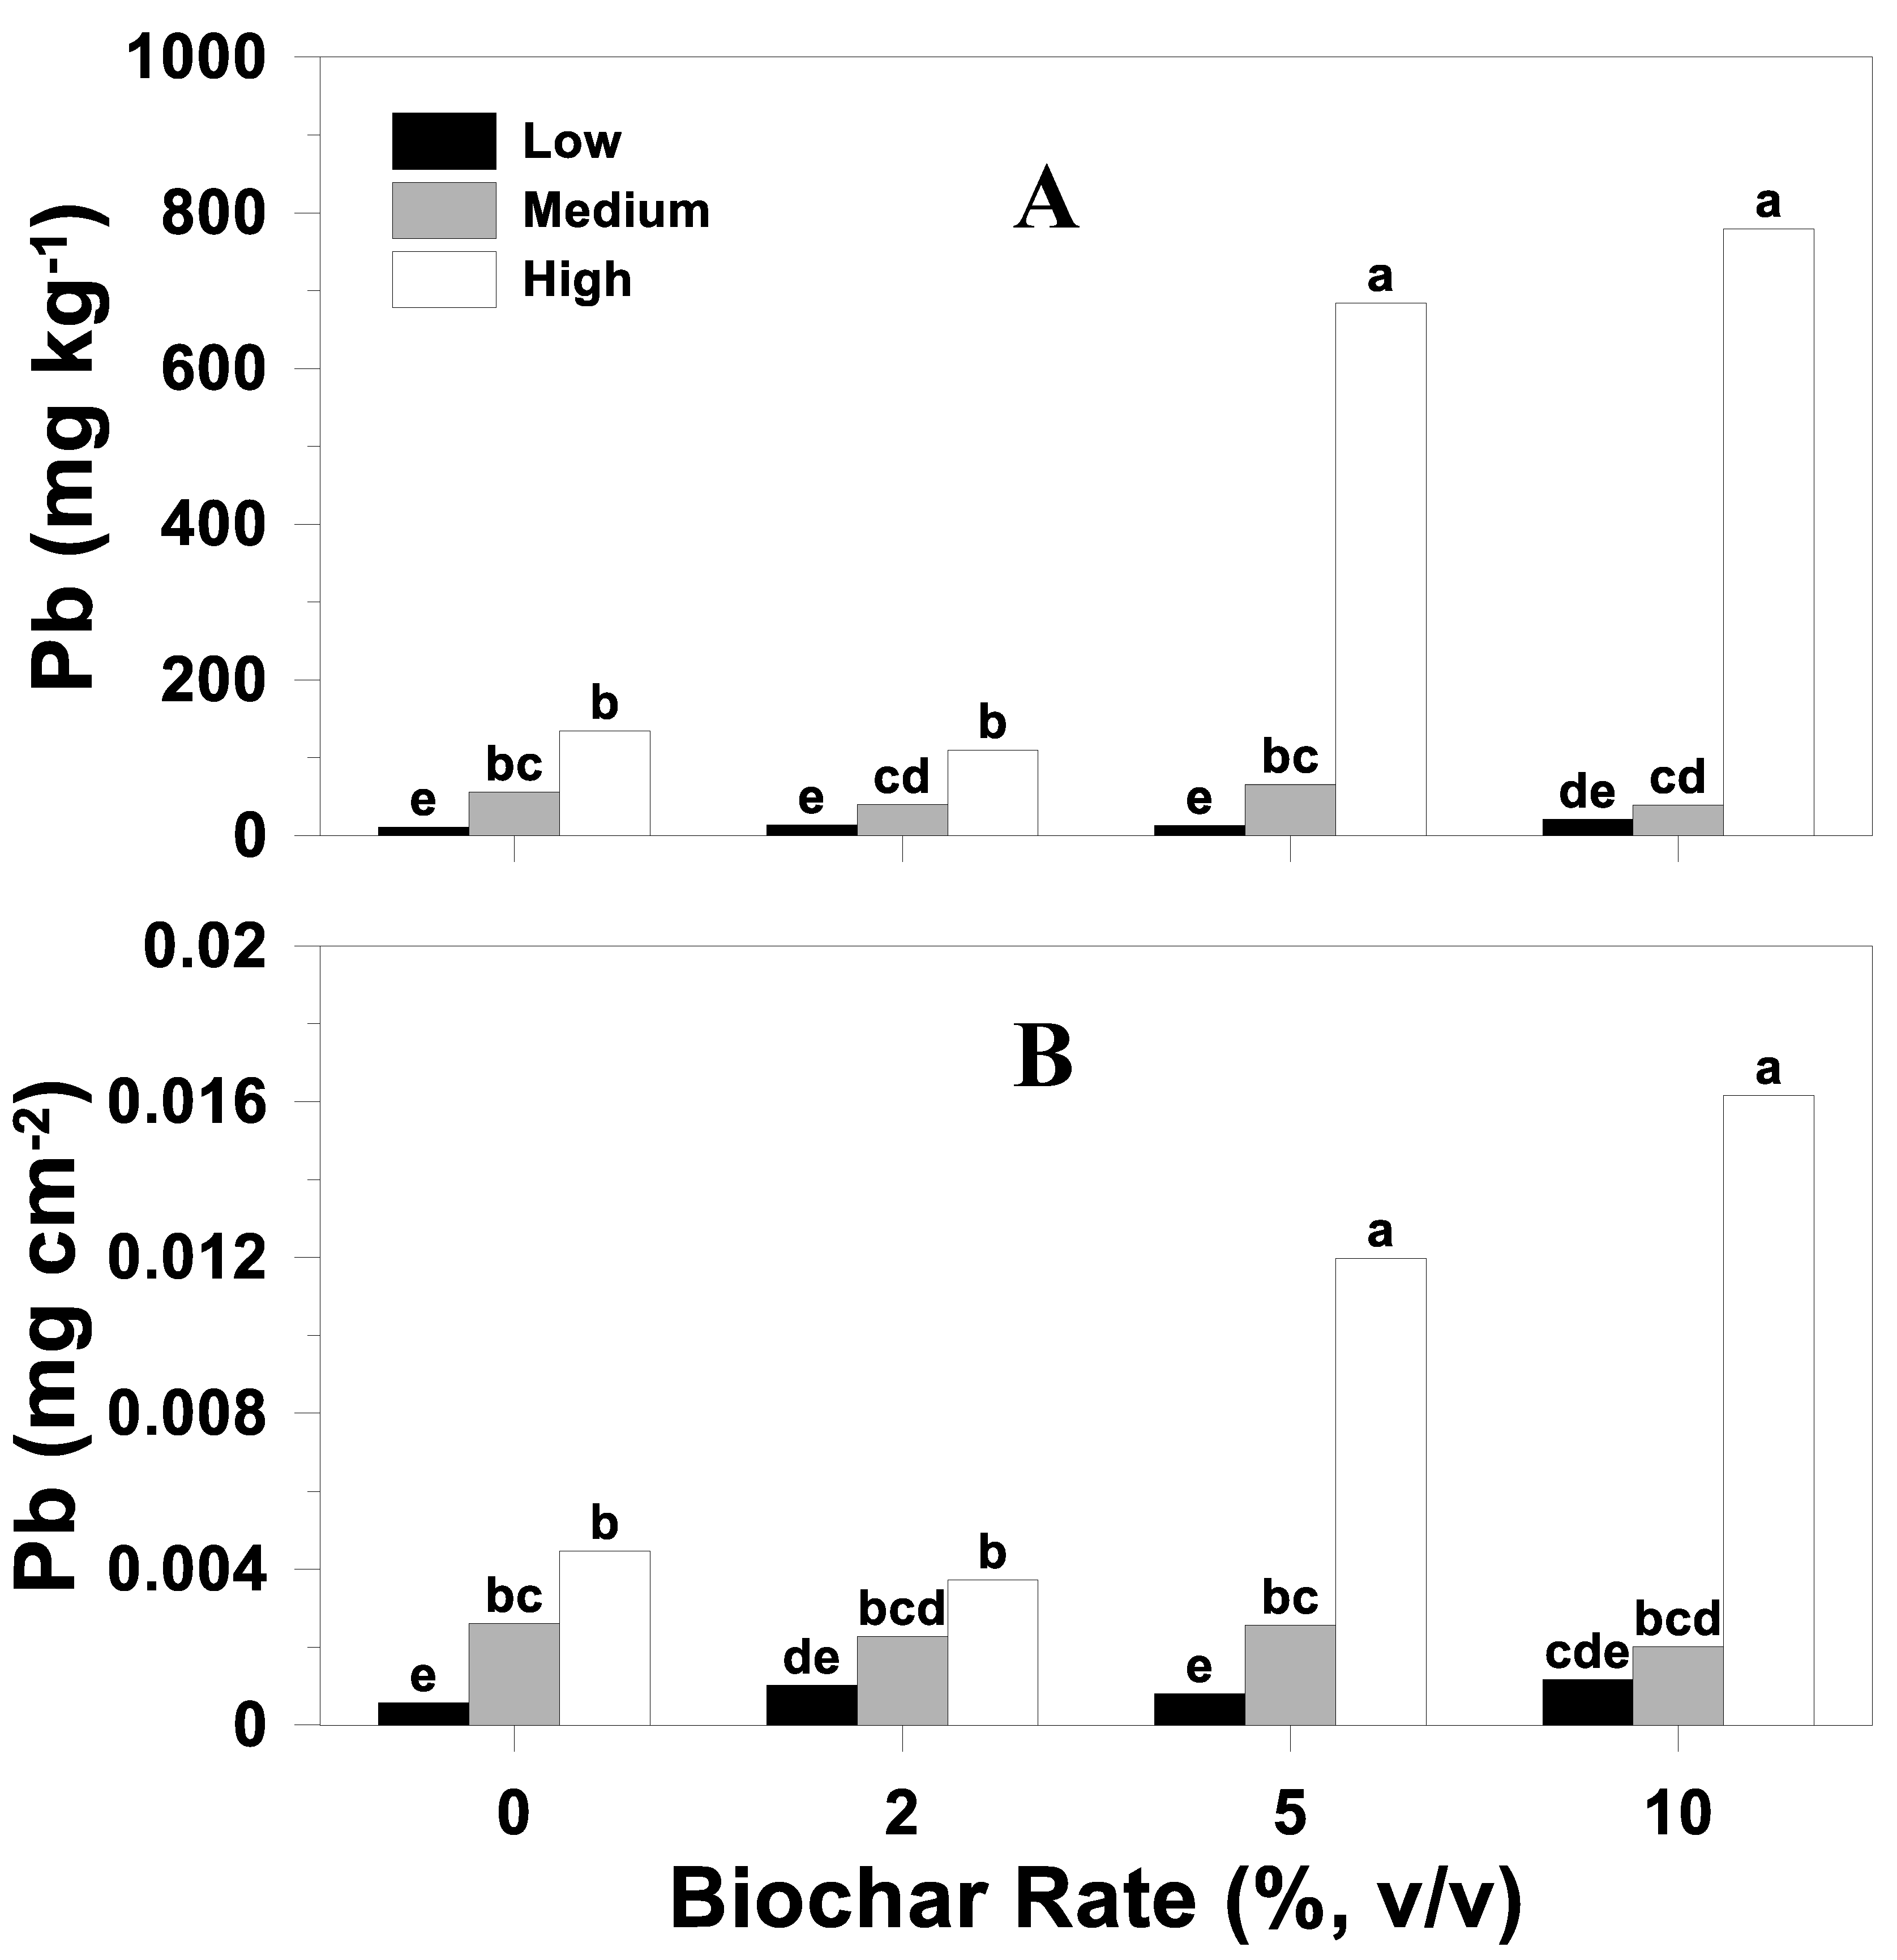
3.5. Biochar Heavy-Metal Response

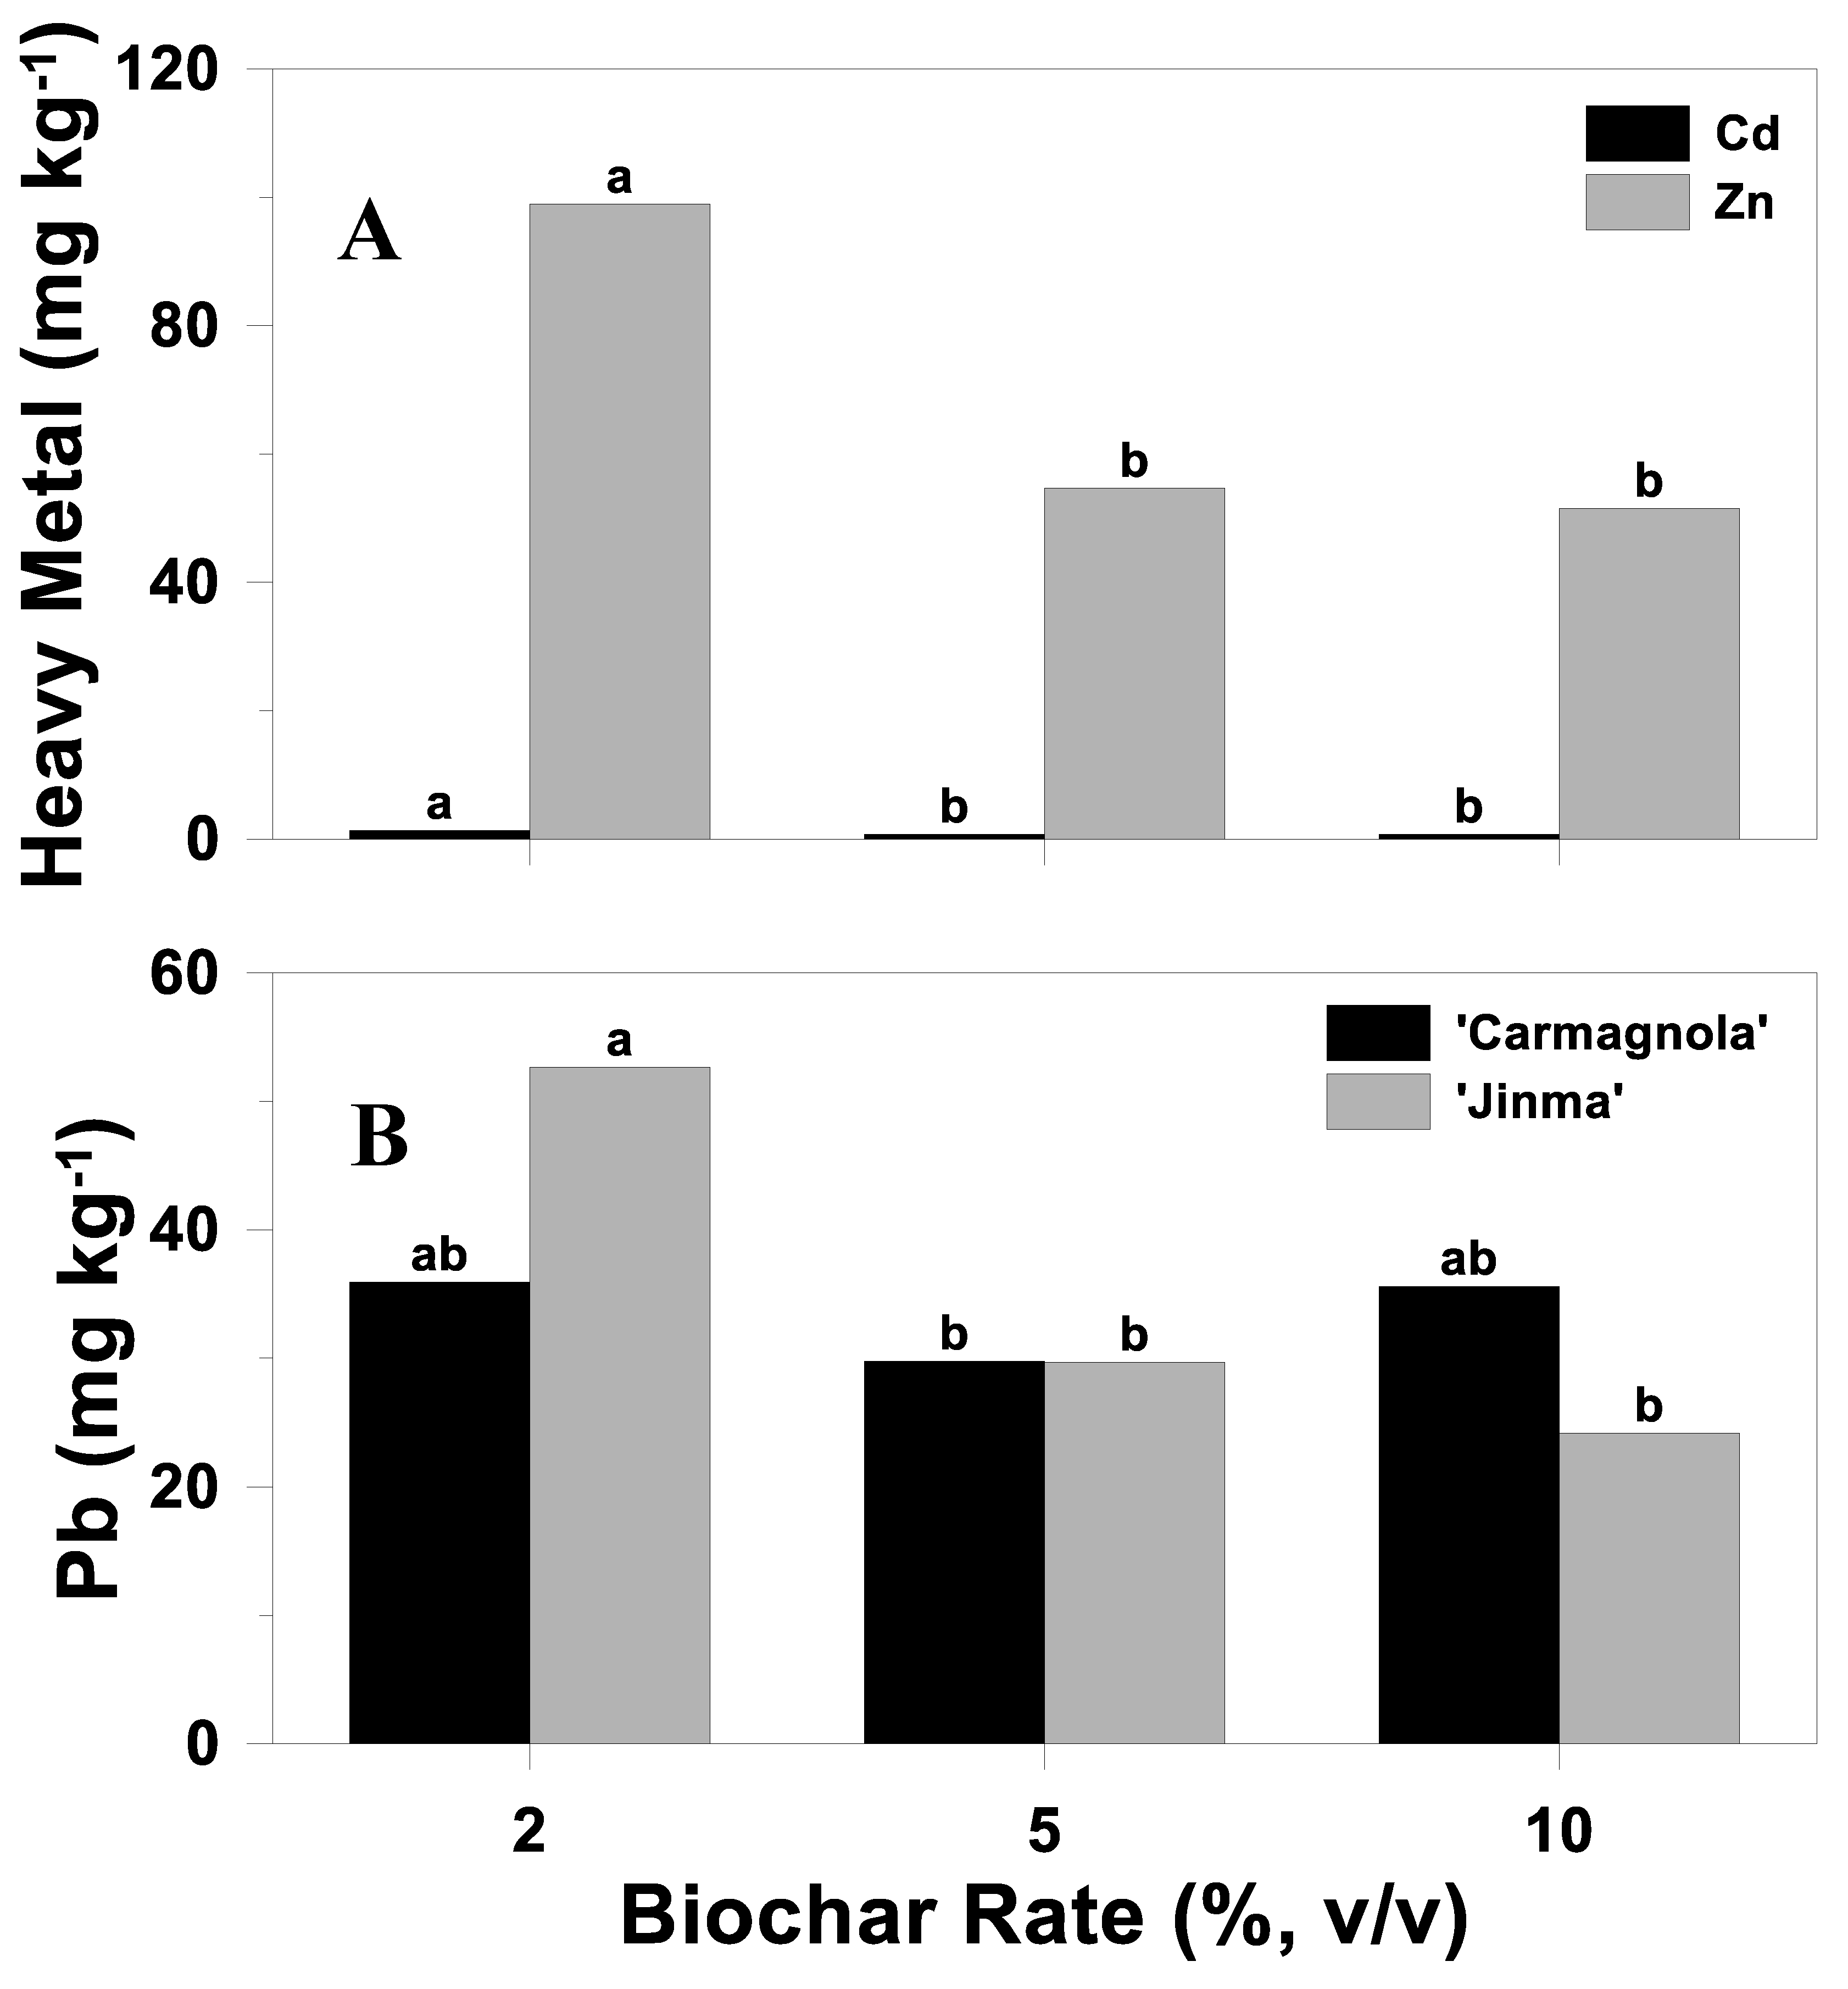
3.5.1. Concentration
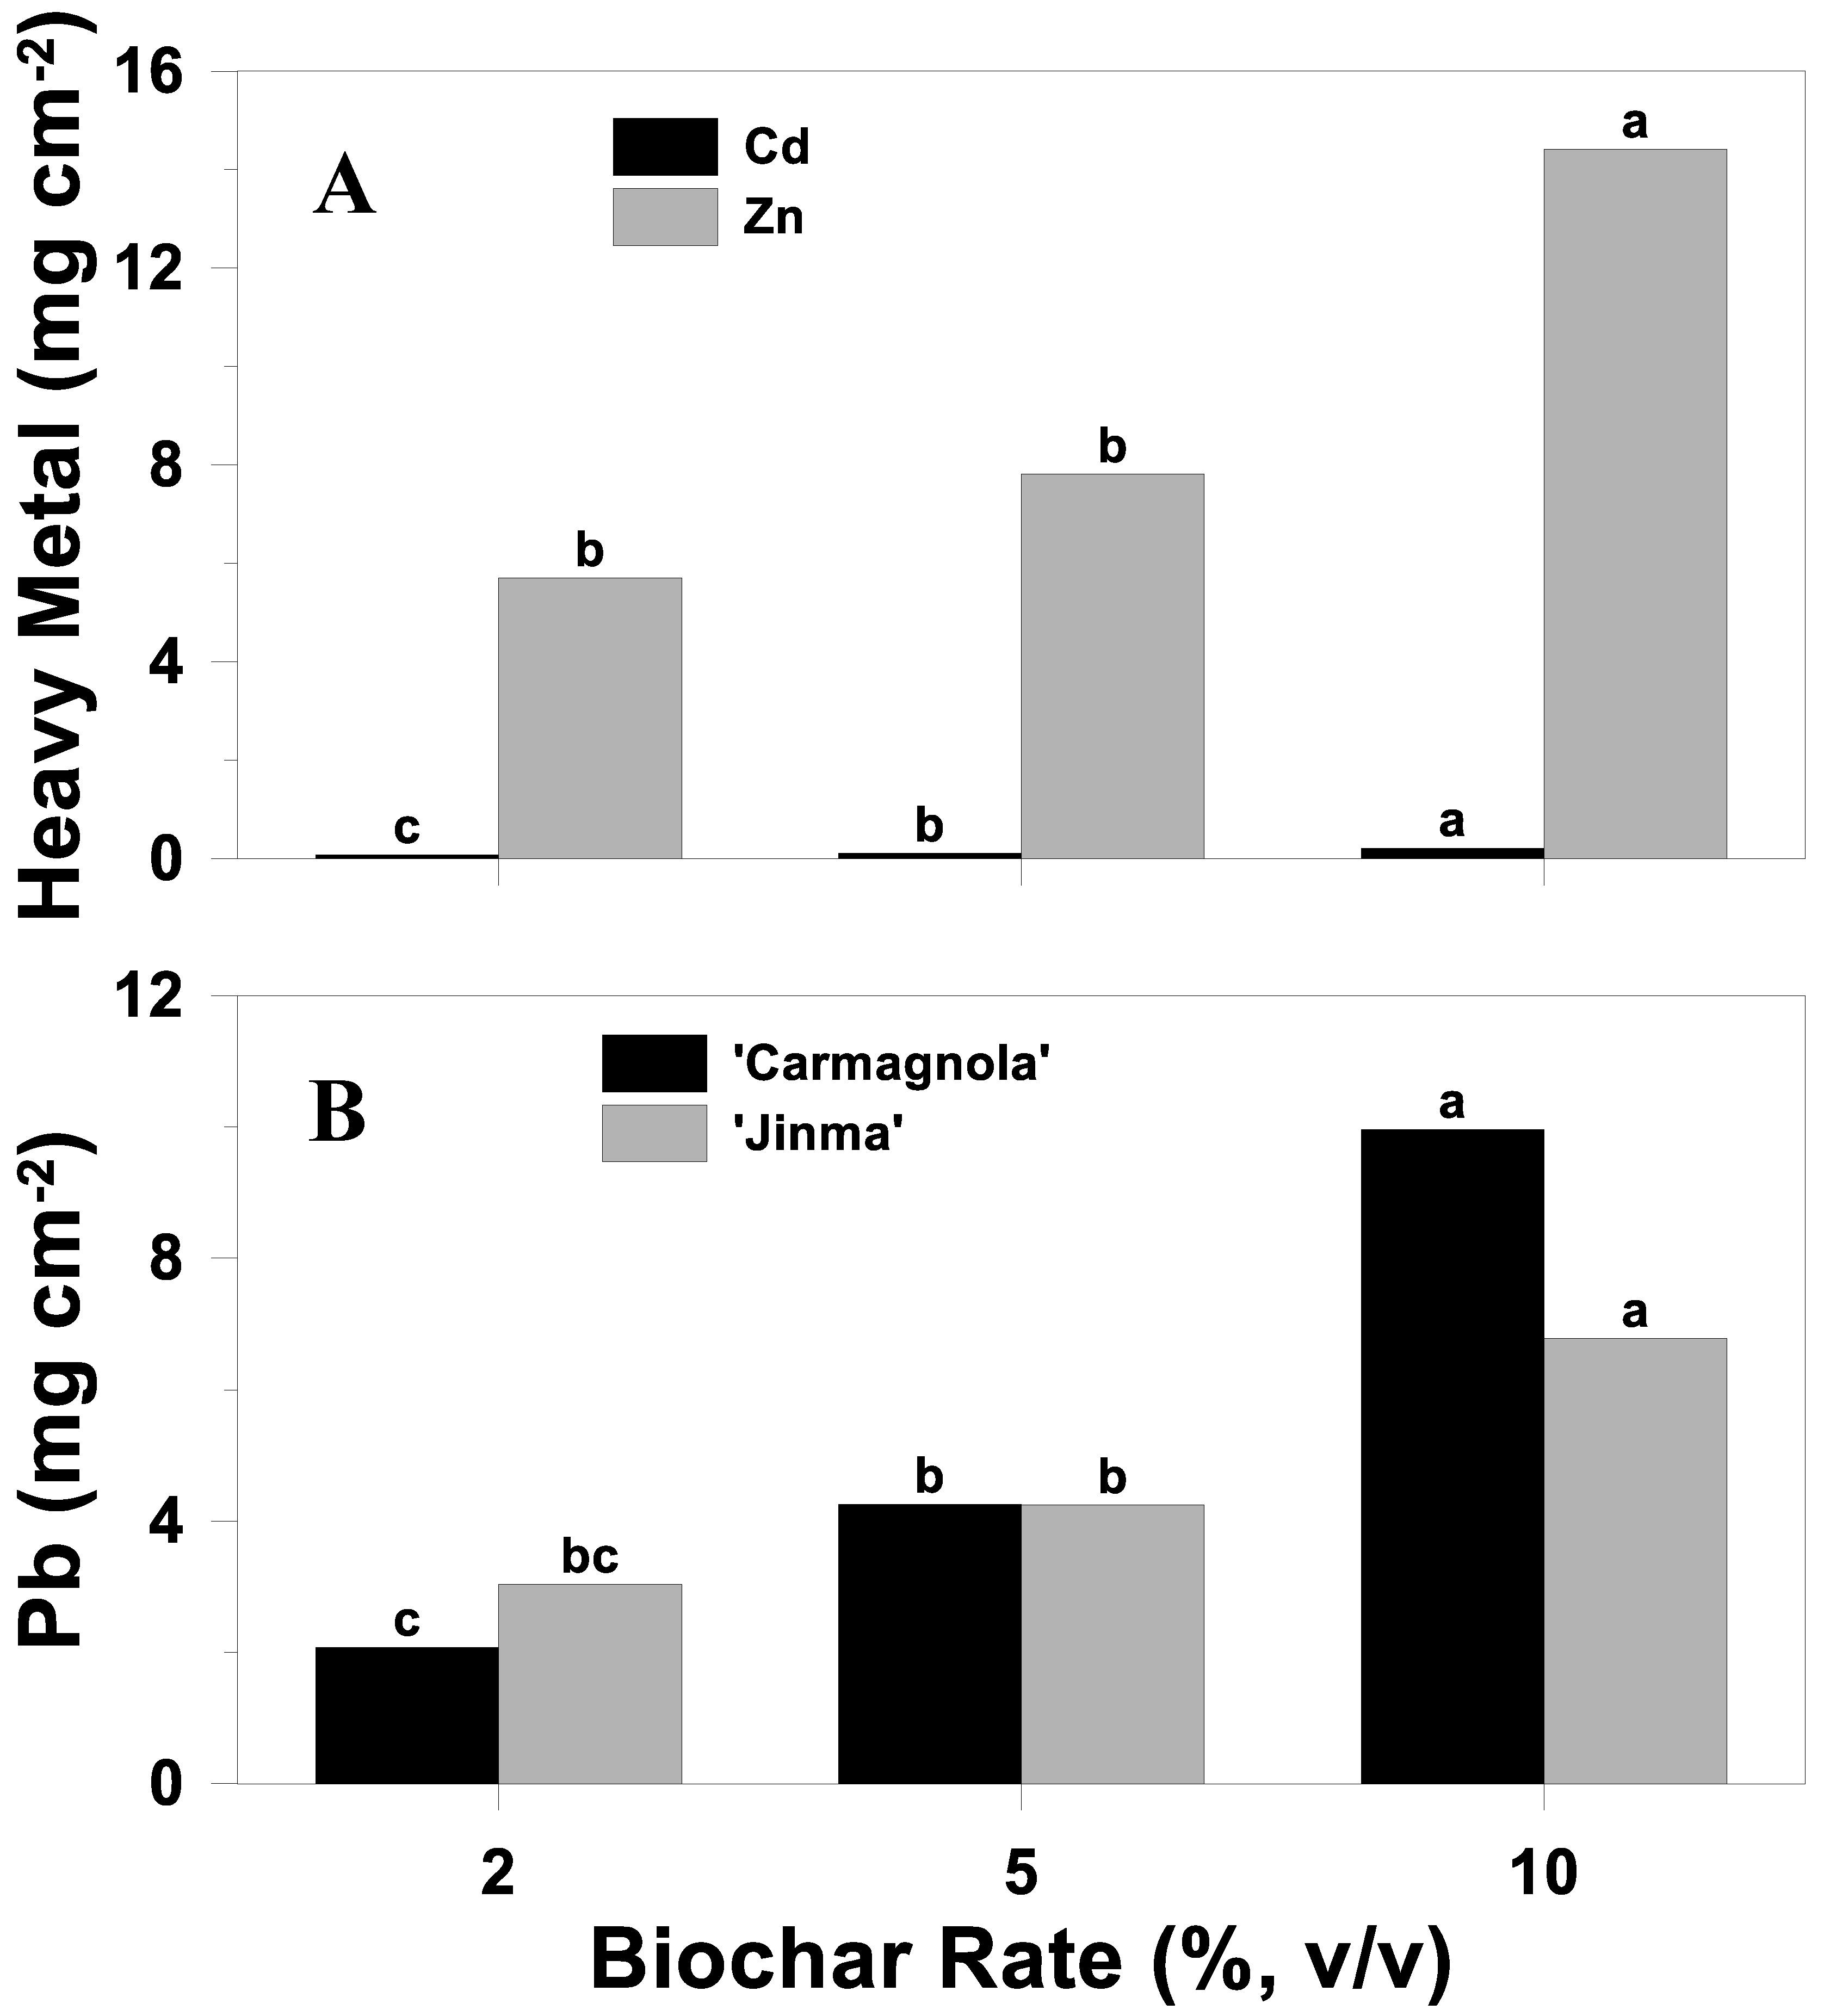
Various methods have been reported for evaluating biochar’s HM adsorptive ability. The most common method is to perform a microwave-assisted soil digestion and ICP analysis of HMs [55] or an analysis of HMs following DTPA extraction [27]. These methods directly determine biochar HM concentrations, and in so doing indicate the quantities of HMs adsorbed by the biochar during the course of the incubation. One limitation of this method is that the DTPA-HM extractions are often conducted on the soil–biochar mixture rather than on the biochar alone after careful separation from the soil. Consequently, no study has reported biochar HM analyses solely on the biochar itself, in the absence of soil, following exposure to contaminated soil.
To directly evaluate HM adsorption by the biochar, a mass of biochar was meticulously, manually picked from the final soil–biochar mixture after AG and BG tissues were removed. The separated biochar was washed with SHMP solution to remove adhered soil particles and then washed with 1 N HCl to extract adsorbed HMs. Biochar Cd, Pb, and Zn concentrations differed (p < 0.01) among soils, biochar Cd and Zn concentrations differed (p < 0.01) among biochar rates, and biochar Pb concentration also differed (p = 0.04) among cultivar–biochar rate combinations (Table 7). In contrast to Pb, biochar Cd and Zn concentrations were unaffected (p > 0.05) by cultivar (Table 7). Averaged across cultivars and biochar rates, biochar Cd concentration was 3.9 times greater in the high- than in the medium-contaminated soil, and was 39 times greater in the high- than in the low-contaminated soil (Figure 7A). Biochar Pb concentration was 8.5 times greater in the high-contaminated soil than in the medium-contaminated soil and was 44 times greater in the high- than in the low-contaminated soil (Figure 7A). Biochar-Zn concentration was 4.3 times greater in the high- than in the medium-contaminated soil and was 30 times greater in the high- than in the low-contaminated soil (Figure 7A). Similar to AGT concentrations and uptakes and similar to the initial hypothesis, biochar Cd, Pb, and Zn concentration responses among soils were consistent with the initial soil conditions, where the high-contaminated soil had the largest and the low-contaminated soil contained the smallest biochar Cd, Pb, and Zn concentrations (Table 1).
Averaged across soils and cultivars, both biochar Cd and Zn concentrations were largest in the 2% and numerically smallest in the 10% BC, which did not differ from that in 5% BC (Figure 8A). The biochar Cd concentration was 1.7 times greater in the 2% than in the 5 and 10% BC, while biochar Zn concentration was also 1.8 and 1.9 times greater in the 2% than in the 5 and 10% BC, respectively (Figure 8A). However, the biochar HM concentration results were inconsistent with the initial hypothesis, which was that biochar HM concentrations would be largest in the 10% and smallest in the 2% BC.
In contrast to Cd and Zn, averaged across soils, biochar Pb concentration was numerically largest in 2% BC for ‘Jinma’, which did not differ from that in 2% and 10% BC for ‘Carmagnola’, and was numerically smallest in the 10% BC for ‘Jinma’, which did not differ from that in 5% BC for both cultivars (Figure 8B). Biochar Pb concentration did not differ between cultivars in any single biochar rate, but was at least 1.8 times greater in 2% BC for ‘Jinma’ than in 5% BC for ‘Carmagnola’ and ‘Jinma’ and 10% BC for ‘Jinma’ (Figure 8B).
In general, and in contrast to the initial hypothesis, across all treatment combinations, biochar HM concentrations were the largest in the 2% and smallest in the 10% BC. These results were likely influenced by the combination of the size of biochar used in the experiment (i.e., ~3 to 5 mm flakes), the subsequent surface area of biochar exposed to the soil, and the strength of the resulting HM concentration gradient following biochar addition to the soil. With a greater abundance of biochar particles in the high- than in the medium-contaminated soil and greater in the medium- than in the low-contaminated soil, there was likely a dilution effect decreasing the HM concentration gradient from the soil to the added and mixed biochar flakes as biochar rate increased. However, biochar HM concentrations are not an adequate measure of the ability of biochar to remove soluble, plant-available HMs without consideration of the total mass of biochar applied per unit of soil. Therefore, it was necessary to convert biochar HM concentrations to biochar HM uptakes.

3.5.2. Uptake

Similar to concentrations, biochar Cd, Pb, and Zn uptakes had identical significant effects, where biochar Cd, Pb, and Zn uptakes differed (p < 0.01) among soils, biochar Cd and Zn uptakes differed (p < 0.01) among biochar rates, and biochar Pb uptake also differed (p = 0.04) among cultivar–biochar rate combinations (Table 7). Similar to concentrations, biochar Cd and Zn uptakes were unaffected (p > 0.05) by cultivar (Table 7). Averaged across cultivars and biochar rates, biochar HM uptakes differed among each soil, where biochar Cd uptake was largest in the high- (0.62 mg cm−2) and smallest in the low-contaminated soil (0.02 mg cm−2; Figure 7B). Biochar Cd uptake in the high-contaminated soil was 3.6 times larger than in the medium- (0.17 mg cm−2) and 36 times larger than the low-contaminated soil (Figure 7B). Biochar-Pb uptake was largest in the high-contaminated soil (30 mg cm−2) and smallest in the low-contaminated soil (0.74 mg cm−2; Figure 7B). Biochar Pb uptake in the high-contaminated soil was 7.8 times larger than in the medium- (3.9 mg cm−2) and 41 times larger than in the low-contaminated soil (Figure 7B). Biochar Zn uptake was largest for the high- (41.3 mg cm−2) and smallest for the low-contaminated soil (0.19 mg cm−2; Figure 7B). Biochar Zn uptake in the high-contaminated soil was 4 times larger than in the medium- (10.4 mg cm−2) and 217 times larger than in the low-contaminated soil (0.19 mg cm−2; Figure 7B). In contrast to the interpretations for biochar HM concentrations, biochar HM uptake results were consistent with the initial hypothesis and followed the HM contamination level among the three soils.
Though biochar HM uptakes had identical significant effects among biochar rates as biochar HM concentrations (Figure 8), the resulting interpretations were opposite and support the original hypothesis. Averaged across cultivars and soils, biochar Cd uptake was largest in the 10% BC (0.22 mg cm−2) and smallest in 2% BC (0.08 mg cm−2) (Figure 9A). Biochar Cd uptake in the 10% biochar was 2.0 times larger than in the 5% BC (0.11 mg cm−2) and 2.9 times larger than in the 2% BC. Biochar Zn uptake was largest in the 10% BC (14.4 mg cm−2) and smallest in the 2% BC (5.7 mg cm−2), which did not differ from the result in the 5% BC (7.8 mg cm−2) (Figure 9A). Biochar Zn uptake in the 10% BC was 1.8 times larger than in the 5% and 2.5 times larger than in the 2% BC (Figure 9A). These results were similar to those from previous biochar phytoremediation studies [27,56,57] that reported biochar has the capacity to reduce plant-available HM concentrations through biochar’s HM adsorptive capacity.
Biochar Pb uptake was numerically largest for ‘Carmagnola’ in the 10% BC (10.0 mg cm−2), while it did not differ from ‘Jinma’ in the 10% BC (6.8 mg cm−2), and was numerically smallest for ‘Carmagnola’ in the 2% BC (2.1 mg cm−2), which did not differ from ‘Jinma’ in the 2% BC (Figure 9B). Biochar Pb uptake was also unaffected by cultivar in each individual biochar rate (Figure 9B).
The few combined biochar phytoremediation studies that have been conducted [27,50,55,66] identified biochar’s effect on plant-available HMs by determining the difference between HM accumulations in plants grown with and without biochar amendment. The current study deviated from the commonly used methods by meticulously manually separating biochar from soil and directly measuring adsorbed HMs, as described in the biochar concentration section above. Additionally, measured biochar concentrations of adsorbed HMs were converted to uptakes as an alternative to evaluate the effect of biochar on HM adsorption on a larger scale. As expected, across all treatments, biochar applied at the 10% rate resulted in the largest HM adsorption by biochar. Therefore, the biochar HM uptake results from the 10% BC rate only were up-scaled to make a hypothetical determination of biochar HM uptake per hectare. The biochar uptakes for Cd and Zn differed among biochar rates only (Table 7). Therefore, averaged across soils and cultivars, the 10% BC amendment resulted in an equivalent biochar uptake of 21.6 kg Cd ha−1 and 1440 kg Zn ha−1 from ~90 days of expose to heavy-metal-contaminated soil. Since biochar Pb uptake differed among cultivar–biochar rate combinations (Table 7), averaged across soils, the biochar uptake of Pb in the 10% BC resulted in ~990 kg Pb ha−1 when used with ‘Carmagnola’ and ~1300 kg Pb ha−1 when used with ‘Jinma’. Up-scaling the biochar adsorption results provides insight into the approximate larger-scale capability of the biochar used in this study for reducing the plant availability and environmental exposure and risks of Cd, Pb, and Zn.

4. Implications

Using industrial hemp at locations contaminated by Cd, Pb, and Zn may provide a dual advantage: (i) a low-cost remediation strategy, and (ii) a potential economic benefit associated with hemp fiber production. According to Linger et al. [18], heavy-metal-contaminated soils have no significant influence on the strength, fineness, thickness, or width of hemp fibers. However, industrial hemp fiber from plants grown in HM-contaminated soils exceeded the regulatory standards set for clothing [18]. Despite this, industrial hemp fiber may remain usable in the architectural and construction industries, where HM-contaminated tissues can be semi-permanently incorporated into various materials, such as insulation, concrete, lacquer, or industrial oils, which may mitigate the risk of potential human exposure [18,19,20].
Remediating the contaminated soil assessed in the current study using phytoremediation methods alone would likely take an inordinately long time due to low (i.e., <1%) HM tissue concentrations [49]. However, industrial hemp production on HM-contaminated land may render the land a useful resource instead of an expensive burden. Much of the HM-contaminated soil area, such as that at Tar Creek, is not used for any type of economically beneficial activity, thus the contaminated soil area will remain an environmental and economic burden unless remediated; according to 2020 estimates, traditional remediation methods cost approximately USD 16 million per year [2]. However, based on the results of this study, an alternative long-term approach may be to implement a combination of industrial hemp and biochar for at least partial soil remediation.
Similar to previous findings [21,23,27,50], reduced availability of Cd, Pb, and Zn to plants was reported resulting from biochar additions in some soil–cultivar combinations, but not in all. Furthermore, in the current study, initial soil HM concentrations (Table 1), even in the low-contaminated soil, were likely too large for the biochar to have substantially limited HM tissue concentrations and uptakes. Results of this study, relative to results of previous studies, also suggest that, in addition to biochar feedstock, biochar particle size may be a significant factor controlling biochar’s chemical behavior in soil with varying physical and chemical properties. Furthermore, though this study did not include a non-HM-contaminated soil as a true control treatment, results clearly demonstrate that biochar rate and hemp cultivar affected industrial hemp properties in varying levels of HM-contaminated soil.
It is important to note that all previous studies reporting that biochar limits plant-available HMs were performed using extraction techniques that differed from those in the current study. Biochar was reported to reduce plant-available HMs for perennial ryegrass and jack bean (Canavalia ensiformis) in soils contaminated with Cd, Pb, and Zn in research studies using diethylenetriamine pentaacetate (DTPA) extraction [27,57]. Similarly, biochar reduced plant extractability of Cu, Pb, and Zn for Silvergrass (Miscanthus giganteus) in a study using acetic acid as an extractant [50]. Additionally, biochar was reported to reduce AGT-Cd concentrations in winter wheat from calcium chloride extraction [51]. Consequently, differences in HM extractants could have contributed to some of the inconsistent results among various studies.

5. Conclusions

The objective of this greenhouse study was to evaluate the effects of industrial hemp cultivar (‘Carmagnola’ and ‘Jinma’), biochar rate (0, 2, 5, and 10% by volume), soil contamination level (low, medium, and high contamination with Cd, Pb, and Zn), and their interactions on plant height, above- and belowground and total plant dry matter, and aboveground plant tissue concentrations and uptakes of Cd, Pb, and Zn from contaminated soils from the Tar Creek superfund site. In addition, unlike most previous studies using biochar, biochar concentrations and uptakes of Cd, Pb, and Zn in the current study were directly quantified after the plant growth phase of the greenhouse experiment.
Results of this study generally support the initial hypothesis that AGDM and Cd, Pb, and Zn concentrations and uptakes would be affected by soil contamination level; specifically, AGDM and plant height would follow low- > medium- > high-contaminated soil, and HM tissue concentrations and uptakes would follow low- < medium- < high-contaminated soil. However, in contrast to the hypothesis, there was no effect of any treatment on BGDM. Results of this study did not support the hypothesis that biochar adsorption, measured as both the concentration and uptake of Cd, Pb, and Zn, would be largest in the 10% BC and smallest in the 2% BC, as biochar Cd, Pb, and Zn concentrations were generally largest in the 2% BC and smallest in the 10% BC. Results did not support the hypothesis that AGT-Cd, -Pb, and -Zn concentrations and uptakes would be smallest in the 10% BC and largest in 2% BC, as AGT-Cd and -Pb concentrations and uptakes were often largest in the 5 or 10% BC and smallest in the 0 or 2% BC and AGT-Zn concentrations, and uptakes were unaffected by biochar rate. Results did not support the hypothesis that there would be no differences between cultivars, as numerous measured properties differed significantly between cultivars in one or more soil contamination levels.
Both cultivars of industrial hemp evaluated in this study (i.e., ‘Carmagnola’ and ‘Jinma’) appear to be viable options for phytoremediation of Tar Creek soils naturally contaminated at varying levels with a mixture Cd, Pb, and Zn. Furthermore, biochar may promote plant uptake of cationic, heavy metal species from a contaminated soil environment. More specifically, the addition of 5 or 10% (v/v) BC derived from Douglas fir, a high-lignin feedstock, appears to be suitable for combination with ‘Carmagnola’ or ‘Jinma’ for the remediation of HM-contaminated soil. However, since initial soil pH and/or any soil pH change that may occur due to alkaline biochar addition may greatly influence HM solubility and mobility, further research is recommended to determine the optimal combination of soil pH level and rate of biochar amendment to maximize phytoremediation by industrial hemp.

Author Contributions

D.V.T.: methodology, formal analysis, investigation, data curation, writing—original draft preparation. K.R.B.: conceptualization, methodology, formal analysis, investigation, writing—review and editing, supervision, project administration. D.M.M.: conceptualization, methodology, investigation, writing—review and editing, supervision, project administration, funding acquisition. P.A.M.J.: methodology. D.M.J.: writing—review and editing. M.R.: writing—review and editing. All authors have read and agreed to the published version of the manuscript.

Funding

This work was partially financially supported by Native Health Matters and BiocharNow supplied the biochar used for this project.

Institutional Review Board Statement

Not applicable.

Informed Consent Statement

Not applicable.

Data Availability Statement

Data presented in this article are available upon request.

Conflicts of Interest

The authors declare no conflicts of interest. The funders had no role in the design of the study; in the collection, analyses, or interpretation of data; in the writing of the manuscript; or in the decision to publish the results.

References

  1. McKnight, T.; Fischer, R. Geology and Ore Deposits of the Oklahoma and Kansas Picher. Available online: https://pubs.usgs.gov/pp/0588/report.pdf (accessed on 29 September 2024).
  2. United States Environmental Protection Agency. Tar Creek Superfund Site Strategic Plan, Cleanup Progress, and Plans for the Future. Available online: https://semspub.epa.gov/work/06/100017221.pdf (accessed on 29 September 2024).
  3. United States Environmental Protection Agency. Review of Peer-Reviewed Documents on Treatment Technologies Used at Mining Waste Sites. Available online: https://semspub.epa.gov/work/HQ/100002899.pdf (accessed on 29 September 2024).
  4. United States Environmental Protection Agency. Tar Creek (Ottowa County). Available online: https://cumulis.epa.gov/supercpad/SiteProfiles/index.cfm?fuseaction=second.Cleanup&id=0601269#bkground (accessed on 29 September 2024).
  5. Oklahoma Department of Environmental Quality. Tar Creek Superfund Site. Available online: https://www.deq.ok.gov/land-protection-division/cleanup-redevelopment/superfund/tar-creek-superfund-site/ (accessed on 29 September 2024).
  6. Beattie, R.E.; Henke, W.; Davis, C.; Mottaleb, M.A.; Campbell, J.H.; McAliley, L.R. Quantitative analysis of the extent of heavy-metal contamination in soils near Picher, Oklahoma, within the Tar Creek superfund site. Chemosphere 2017, 172, 89–95. [Google Scholar] [CrossRef]
  7. Neuberger, J.S.; Hu, S.C.; Drake, K.D.; Jim, R. Potential health impacts of heavy-metal exposure at the Tar Creek Superfund site, Ottowa County, Oklahoma. Environ. Geochem. Health 2009, 31, 47–59. [Google Scholar] [CrossRef] [PubMed]
  8. United States Environmental Protection Agency. Superfund: National Priorities List (NPL). Available online: https://www.epa.gov/superfund/superfund-national-priorities-list-npl (accessed on 29 September 2024).
  9. United States Geological Survey. Acid Mine Drainage. Available online: https://www.usgs.gov/mission-areas/water-resources/science/mine-drainage (accessed on 29 September 2024).
  10. Schaider, L.A.; Senn, D.B.; Brabander, D.J.; McCarthy, K.D.; Shine, J.P. Characterization of zinc, lead, and cadmium in mine waste: Implications for transport, exposure, and bioavailability. Environ. Sci. Technol. 2007, 41, 4164–4171. [Google Scholar] [CrossRef] [PubMed]
  11. Arthur, E.L.; Rice, P.J.; Rice, P.J.; Anderson, T.A.; Baladi, S.M.; Henderson, K.L.D.; Coats, J.R. Phytoremediation—An overview. Crit. Rev. Plant Sci. 2007, 24, 109–122. [Google Scholar] [CrossRef]
  12. Salt, D.E.; Blaylock, M.; Kumar, N.; Dushenkov, V.; Ensley, B.D.; Chet, I.; Raskin, I. Phytoremediation: A novel strategy for the removal of toxic metals from the environment using plants. Biotechnology 1995, 13, 468–474. [Google Scholar] [CrossRef]
  13. Nanda-Kumar, N.A.; Dushenkov, V.; Motto, H.; Raskin, I. Phytoextraction: The use of plants to remove heavy metals from soils. Environ. Sci. Technol. 1995, 29, 1232–1238. [Google Scholar] [CrossRef]
  14. Picchi, C.; Giorgetti, L.; Morelli, E.; Landi, M.; Rosellini, I.; Grifoni, M.; Franchi, E.; Petruzzelli, G.; Barbafieri, M. Cannabis sativa L. and Brassica juncea L. grown on arsenic-contaminated industrial soil: Potentiality and limitation for phytoremediation. Environ. Sci. Pollut. Res. 2021, 11, 15983–15998. [Google Scholar] [CrossRef]
  15. Stonehouse, G.C.; McCarron, B.J.; Guignardi, A.F.M.; Lima, L.W.; Sirine, C.F.; Pilon-Smits, E.A.H. Selenium metabolism in hemp (Cannabis sativa L.)—Potential for phytoremediation and biofortification. Environ. Sci. Technol. 2020, 54, 4221–4230. [Google Scholar] [CrossRef]
  16. Ahmad, R.; Tehsin, Z.; Malik, S.T.; Asad, S.A.; Shahzad, M.; Bilal, M.; Shah, M.M.; Khan, A.A. Phytoremediation potential of hemp (Cannabis sativa L.): Identification and characterization of heavy metals responsive genes. CLEAN Soil Air Water 2016, 44, 195–201. [Google Scholar] [CrossRef]
  17. Nason, S.L.; Stanley, C.J.; Peterpaul, C.E.; Blumenthal, M.F.; Zuverza-Mena, N.; Silliboy, R.J. A community based PFAS phytoremediation project at the former Loring Air Force Base. iScience 2021, 24, 102777. [Google Scholar] [CrossRef]
  18. Linger, P.; Ostwald, A.; Haensler, J. Cannabis sativa L. growing on heavy metal contaminated soil: Growth, cadmium uptake and photosynthesis. Biol. Plant. 2005, 49, 567–576. [Google Scholar] [CrossRef]
  19. Awwad, E.; Mabsout, M.; Hamad, B.; Farran, M.T.; Khatib, H. Studies on fiber-reinforced concrete using industrial hemp fibers. Construct. Build. Mat. 2012, 35, 710–717. [Google Scholar] [CrossRef]
  20. Crini, G.; Lichtfouse, E.; Chanet, G.; Morin-Crini, N. Applications of hemp in textiles, paper industry, insulation and building materials, horticulture, animal nutrition, food and beverages, nutraceuticals, cosmetics and hygiene, medicine, agrochemistry, energy production and environment: A review. Environ. Chem. Lett. 2020, 18, 1451–1476. [Google Scholar] [CrossRef]
  21. Lee, H.S.; Shin, H.S. Competitive adsorption of heavy metals onto modified biochars: Comparison of biochar properties and modification methods. Environ. Manag. 2021, 299, 113651. [Google Scholar] [CrossRef]
  22. Niu, L.Q.; Jia, P.; Li, S.; Kuang, J.-L.; He, X.; Zhou, W.; Liao, B.; Shu, W.; Li, J. Slash-and-char: An ancient agricultural technique holds new promise for management of soils contaminated by Cd, Pb, and Zn. Environ. Pollut. 2015, 205, 333–339. [Google Scholar] [CrossRef]
  23. Park, J.H.; Choppala, G.; Lee, S.J.; Bolan, N.; Chung, J.W.; Edraki, M. Comparative sorption of Pb and Cd by biochars and its implication for metal immobilization in soils. Water Air Soil Pollut. 2013, 224, 1711. [Google Scholar] [CrossRef]
  24. Lao, E.J.; Mbega, E.R. Biochar as a feed additive for improving the performance of farm animals. Malaysian J. Sustain. Agric. 2020, 4, 86–93. [Google Scholar] [CrossRef]
  25. United States Department of Agriculture. Biochar Technical Report. Available online: https://www.ams.usda.gov/sites/default/files/media/NOPBiocharTechnicalReport.pdf (accessed on 29 September 2024).
  26. Weil, R.R.; Brady, N.C. The Nature and Properties of Soils; Pearson, Pearson, Edinburgh Gate: Harlow, Essex, UK, 2017. [Google Scholar]
  27. Antonangelo, J.A.; Zhang, H. Heavy metal phytoavailability in a contaminated soil of northeastern Oklahoma as affected by biochar amendment. Environ. Sci. Pollut. Res. 2019, 26, 33582–33593. [Google Scholar] [CrossRef]
  28. Brye, K.R.; Slaton, N.A. Carbon and nitrogen storage in a typic albaqualf as affected by assessment method. Commun. Soil Sci. Plant Anal. 2003, 34, 1637–1655. [Google Scholar] [CrossRef]
  29. Gee, W.G.; Or, D. Particle size analysis. In Methods of Soil Analysis, Part 4, Physical Methods; Dane, J.H., Topp, G.C., Eds.; Soil Science Society of America: Madison, WI, USA, 2002; pp. 255–293. [Google Scholar]
  30. Sikora, F.J.; Kissel, D.E. Soil pH. In Soil Test Methods from the Southeastern United States; Sikora, F.J., Moore, K.P., Eds.; University of Georgia: Athens, GA, USA, 2014; pp. 48–53. [Google Scholar]
  31. Wang, J.J.; Provin, T.; Zhang, H. Measurement of soil salinity and sodicity. In Soil Test Methods from the Southeastern United States; Sikora, F.J., Moore, K.P., Eds.; University of Georgia: Athens, GA, USA, 2014; pp. 185–193. [Google Scholar]
  32. Zhang, H.; Wang, J. Loss on ignition. In Soil Test Methods from the Southeastern United States; Sikora, F.J., Moore, K.P., Eds.; University of Georgia: Athens, GA, USA, 2014; pp. 155–157. [Google Scholar]
  33. Zhang, H.; Hardy, D.H.; Mylavarapu, R.; Wang, J. Mehlich-3. In Soil Test Methods from the Southeastern United States; Sikora, F.J., Moore, K.P., Eds.; University of Georgia: Athens, GA, USA, 2014; pp. 101–110. [Google Scholar]
  34. United States Environmental Protection Agency. Method 3050B: Acid Digestion of Sediments, Sludges, and Soils. Available online: https://www.epa.gov/esam/epa-method-3050b-acid-digestion-sediments-sludges-and-soils (accessed on 29 September 2024).
  35. Rajkovich, S.; Enders, A.; Hanley, K.; Hyland, C.; Zimmerman, A.R.; Lehmann, J. Corn growth and nitrogen nutrition after additions of biochars with varying properties to a temperate soil. Biol. Fert. Soils 2012, 48, 271–284. [Google Scholar] [CrossRef]
  36. McLaughlin, H.; Shields, F.; Jagiello, J.; Thiele, G. Analytical Options for Biochar Adsorption and Surface Area. Available online: https://mcl.mse.utah.edu/wp-content/uploads/sites/84/2024/03/Analytical-Options-for-BioChar-full-paper-2012.pdf (accessed on 29 September 2024).
  37. ASTM-D1762-84; American Society for Testing and Materials. Standard Test Method for Chemical Analysis of Wood Charcoal. Available online: www.astm.org/catalogsearch/result/?q=d1762 (accessed on 29 September 2024).
  38. Williams, D.W.; Mundell, R. Agronomic recommendations for Industrial Hemp Production in Kentucky. Available online: https://www.kyagr.com/marketing/documents/HEMP_APP_UK-agronomic-recommendations.pdf (accessed on 29 September 2024).
  39. University of Arkansas Extension. Wheat Production in Arkansas. Available online: https://www.uaex.uada.edu/farm-ranch/crops-commercial-horticulture/wheat/ (accessed on 29 September 2024).
  40. Roseberg, R.J.; Jeliazkov, V.D.; Angima, S.D. Soil, Seedbed Preparation and Seeding for Hemp. Available online: https://www.researchgate.net/publication/336232127_Soil_Seedbed_Preparation_and_Seeding_for_Hemp (accessed on 29 September 2024).
  41. Geneve, R.L.; Janes, E.W.; Kester, S.T.; Hildebrand, D.F.; Davis, D. Temperature limits for seed germination in Industrial Hemp (Cannabis sativa L.). Crops 2022, 2, 415–427. [Google Scholar] [CrossRef]
  42. United States Department of Agriculture. Soil-Plant-Atmosphere-Water Field, and Pond Hydrology. Available online: https://www.nrcs.usda.gov/resources/tech-tools/spaw-version-602 (accessed on 29 September 2024).
  43. Huang, Y.L.; Schulte, E.E. Digestion of plant tissue for analysis by ICP emission spectroscopy. Commun. Soil Sci. Plant Anal. 1985, 16, 943–958. [Google Scholar] [CrossRef]
  44. Zarcinas, B.A.; Cartwright, B.; Spouncer, L. Nitric acid digestion and multi-element analysis of plant material by inductively coupled plasma spectrometry. Commun. Soil Sci. Plant Anal. 1987, 18, 131–146. [Google Scholar] [CrossRef]
  45. Yoon, J.; Cao, X.; Zhou, O.; Ma, L.Q. Accumulation of Pb, Cu, and Zn in native plants growing on a contaminated Florida site. Sci. Total Environ. 2006, 368, 456–464. [Google Scholar] [CrossRef]
  46. Dalvi, A.A.; Bhalerao, S.A. Response of plants towards heavy metal toxicity: An overview of avoidance, tolerance and uptake mechanism. Annals Plant Sci. 2013, 2, 362–368. [Google Scholar]
  47. Farmtiva. Jinma Hemp Fiber Seeds. Available online: www.farmtiva.com/2022-seed-catalog/inma-fiber-seeds (accessed on 29 September 2024).
  48. Coolong, T.; Bagby, T. Fiber Hemp Production in Georgia. Available online: https://secure.caes.uga.edu/extension/publications/files/pdf/C%201236_1.PDF (accessed on 29 September 2024).
  49. Candilo, M.D.; Ranalli, P.; Re, L.D. Heavy metal tolerance and uptake of Cd, Pb, and Tl by hemp. Adv. Hort. Sci. 2004, 18, 138–144. [Google Scholar]
  50. Juraszek, A.M.; Rivier, P.A.; Rasse, D.; Joner, E.J. Biochar affects heavy metal uptake in plants through interactions in the rhizosphere. J. Appl. Sci. 2020, 10, 5105. [Google Scholar] [CrossRef]
  51. Cui, L.; Pan, G.; Li, L.; Yan, J.; Zhang, A.; Bian, R.; Chang, A. The reduction of wheat Cd uptake in contaminated soil via biochar amendment: A two-year field experiment. BioResources 2012, 7, 5666–5676. [Google Scholar] [CrossRef]
  52. Fellet, G.; Marchiol, L.; Vedove, G.D.; Peressotti, A. Application of biochar on mine tailings: Effects and perspectives for land reclamation. Chemosphere 2011, 83, 1262–1267. [Google Scholar] [CrossRef]
  53. Xu, P.; Sun, C.-K.; Ye, X.-Z.; Xiao, W.-D.; Zhang, Q.; Wang, Q. The effect of biochar and crop straws on heavy metal bioavailability and plant accumulation in a Cd and Pb polluted soil. Ecotox. Environ. Safety 2016, 132, 94–100. [Google Scholar] [CrossRef]
  54. Linger, P.; Mussig, J.; Fischer, H.; Kobert, J. Industrial hemp (Cannabis sativa L.) growing on heavy metal contaminated soil: Fibre and phytoremediation potential. Indust. Crops Prod. 2002, 16, 33–42. [Google Scholar] [CrossRef]
  55. Fellet, G.; Marmiroli, M.; Marchiol, L. Elements uptake by metal accumulator species grown on mine tailings amended with three types of biochar. Sci. Total Environ. 2014, 468–469, 598–608. [Google Scholar] [CrossRef] [PubMed]
  56. Chen, D.; Liu, X.; Bian, R.; Cheng, K.; Zhang, X.; Zheng, J.; Joseph, S.; Crowley, D.; Pan, G.; Li, L. Effects of biochar on availability and plant uptake of heavy metals—A meta-analysis. J. Environ. Manag. 2018, 222, 76–85. [Google Scholar] [CrossRef] [PubMed]
  57. Puga, A.P.; Abreu, C.A.; Melo, L.C.A.; Beesley, L. Biochar application to a contaminated soil reduces the availability and plant uptake of zinc, lead, and cadmium. J. Environ. Manag. 2015, 159, 86–93. [Google Scholar] [CrossRef]
  58. Ferreiro, J.P.; Lu, H.; Fu, S.; Mendez, A.; Gasco, G. Use of phytoremediation and biochar to remediate heavy metal polluted soils: A review. Solid Earth 2014, 5, 65–75. [Google Scholar] [CrossRef]
  59. Liao, W.; Thomas, S.C. Biochar particle size and post-pyrolysis mechanical processing affect soil pH, water retention capacity, and plant performance. Soil Syst. 2014, 3, 14. [Google Scholar] [CrossRef]
  60. Sarfraz, R.; Yang, W.; Wang, S.; Zhou, B.; Xing, S. Short term effects of biochar with different particle sizes on phosphorus availability and microbial communities. Chemosphere 2020, 256, 12582. [Google Scholar] [CrossRef]
  61. Novak, J.M.; Lima, I.; Xing, B.; Gaskin, J.W.; Steiner, C.; Das, K.C.; Ahmedna, M.; Rehrah, D.; Watts, D.W.; Busscher, W.J.; et al. Characterization of designer biochar produced at different temperatures and their effects on a loamy sand. Ann. Environ. Sci. 2009, 3, 195–206. [Google Scholar]
  62. Domingues, R.R.; Trugilho, P.F.; Silva, C.A.; Cristina de Melo, I.; Melo, L.C.A.; Magriotis, Z.M.; Sanchez-Monedero, M.A. Properties of biochar derived from wood and high-nutrient biomasses with the aim of agronomic and environmental benefits. PLoS ONE 2017, 12, e0176884. [Google Scholar] [CrossRef]
  63. Rheay, H.T.; Omondi, E.C.; Brewer, C.E. Potential of hemp (Cannabis sativa L.) for paired phytoremediation and bioenergy production. Global Change Biol. Bioenergy 2021, 13, 525–536. [Google Scholar] [CrossRef]
  64. Sauve, S.; McBride, M.; Hendershot, W. Soil solution speciation of lead (II): Effects of organic matter and pH. Soil Sci. Soc. Am. J. 1998, 62, 618–621. [Google Scholar] [CrossRef]
  65. Chibuike, G.U.; Obiora, S.C. Heavy metal polluted soils: Effect on plants and bioremediation methods. Appl. Environ. Soil Sci. 2014, 14, 752708. [Google Scholar] [CrossRef]
  66. Kim, H.S.; Kim, K.R.; Kim, H.J.; Yoon, J.H.; Yang, J.E.; Ok, Y.S.; Owens, G.; Kim, K.H. Effect of biochar on heavy metals immobilization and uptake by lettuce (Lactuca sativa L.). Environ. Earth Sci. 2015, 74, 1249–1259. [Google Scholar] [CrossRef]
Figure 1. Aerial view of soil sampling locations approximately 2.4 km to the northwest of Picher, Oklahoma. Sampling locations for low- (A), medium- (B), and high-contaminated soil (C) are marked. The large white deposit in the upper-center of the image is a chat pile. The body of water in the right-side of the picture is Tar Creek. The width of the image is approximately 680 m.
Soilsystems 08 00114 g001
Figure 2. Aboveground tissue lead (Pb; (A)) and zinc (Zn; (B)) concentrations among soil–cultivar combinations. Different letters atop bars in the same panel are different at p < 0.05.
Soilsystems 08 00114 g002
Figure 3. Aboveground tissue lead (Pb) concentrations (A) and uptakes (B) among soil–biochar rate combinations. Different letters atop bars in the same panel are different at p < 0.05.
Soilsystems 08 00114 g003
Figure 4. Bioconcentration factor (BCF) among soil–cultivar combinations for lead (Pb; (A)) and zinc (Zn; (B)). Different letters atop bars in the same panel are different at p < 0.05.
Soilsystems 08 00114 g004
Figure 5. Bioconcentration factor (BCF) among soil–biochar rate combinations for lead (Pb). Different letters atop bars are different at p < 0.05.
Soilsystems 08 00114 g005
Figure 6. Total plant dry matter as affected by soil–cultivar combinations for industrial hemp grown in heavy-metal-contaminated soil for 90 days. Different letters atop bars are different at p < 0.05.
Soilsystems 08 00114 g006
Figure 7. Biochar cadmium (Cd), lead (Pb), and zinc (Zn) concentrations (A) and uptakes (B) among contaminated soils. Different letters atop bars in the same panel are different at p < 0.05.
Soilsystems 08 00114 g007
Figure 8. Biochar cadmium (Cd) and zinc (Zn) concentrations among biochar rates (A) and biochar lead (Pb) concentrations among cultivar–biochar rate combinations (B). Different letters atop bars for the same heavy metal in panel A or among all bars in panel B are different at p < 0.05.
Soilsystems 08 00114 g008
Figure 9. Biochar cadmium (Cd) and zinc (Zn) uptakes among biochar rates (A) and biochar lead (Pb) uptakes among cultivar–biochar rate combinations (B). Different letters atop bars of the same heavy metal in panel A or among all bars in panel B are different at p < 0.05.
Soilsystems 08 00114 g009
Table 1. Summary of initial soil physical and chemical properties, by soil contamination level, used in the greenhouse experiment.
Soil Propertyp-ValueSoil Contamination Level
LowMediumHigh
Sand (g g−1)<0.010.23 c0.44 a0.35 b
Silt (g g−1)<0.010.48 b0.45 b0.56 a
Clay (g g−1)<0.010.28 a0.11 b0.09 b
pH0.016.27 b6.23 b6.53 a
Electrical conductivity (dS m−1)0.011.95 a1.35 b1.32 b
Soil organic matter (%)<0.013.1 b2.1 c4.6 a
Total C (%)<0.010.88 c1.12 b3.69 a
Total N (%)<0.010.10 b0.07 c0.17 a
C:N ratio<0.019.1 c15.9 b22.3 a
Water-soluble elements (mg kg−1)
   P0.030.04 b0.04 b0.07 a
   K<0.0120.0 c35.0 b43.7 a
   Na<0.01573 a25.0 b20.6 c
   Pb<0.010.3 b0.5 b1.6 a
   Zn<0.015.1 c45.1 a36.0 b
   Cd<0.010.2 b1.3 a1.1 a
Mehlich-3 extractable elements (mg kg−1)
   P<0.011.0 c7.3 a5.7 b
   K<0.01138 a119 b88.7 c
   Na<0.01595 a31.6 b24.7 c
   Pb<0.01275 c587 b4197 a
   Zn<0.01554 c4470 b10,092 a
   Cd<0.013.8 c24.4 b38.8 a
Total recoverable elements (mg kg−1)
   Pb<0.01308 c978 b10,251 a
   Zn<0.01763 c5353 b21,179 a
   Cd<0.014.6 c34.4 b107 a
Means in a row with different letters are different at p < 0.05.
Table 2. Initial biochar concentrations (n = 5) of cadmium (Cd), lead (Pb), and zinc (Zn) and select manufacturer-reported properties.
Biochar PropertyMean (+/− Standard Error)
Cadmium (mg kg−1)0.15 (0.04)
Lead (mg kg−1)2.5 (0.4)
Zinc (mg kg−1)15.8 (3.4)
pH 8.93
Surface area (m2 g−1) 308
Total ash (%) ††2.1
pH obtained from [35]. Surface area obtained from [36]. †† Total ash obtained from [37].
Table 3. Analysis of variance summary of the effects of soil, cultivar, biochar rate, and their interactions on hemp properties [i.e., plant height, aboveground dry matter (AGDM), belowground dry matter (BGDM), total dry matter (TDM), and aboveground (AG) tissue cadmium (Cd), lead (Pb), and zinc (Zn) concentration and uptake] after 90 days of plant growth in heavy-metal-contaminated soil.
Source of VariationPlant
Height
AGDMBGDMTDMAG ConcentrationAG Uptake
CdPbZnCdPbZn
Soil (S)<0.01<0.010.41<0.01<0.01<0.01<0.01<0.01<0.01<0.01
Cultivar (C)<0.010.770.610.930.320.020.020.550.090.06
   S*C0.370.060.100.030.720.020.040.180.220.38
Biochar rate (B)0.670.770.630.710.62<0.010.280.920.050.36
   S*B0.600.710.620.800.04<0.010.080.180.030.48
   C*B0.130.130.930.200.720.310.360.460.740.77
     S*C*B0.490.140.750.210.010.190.230.090.780.95
Table 4. Summary of the effect of soil contamination level on plant height, aboveground dry matter, and aboveground uptakes of cadmium (Cd) and zinc (Zn) for industrial hemp grown in heavy-metal-contaminated soil for 90 days.
Plant PropertySoil
LowMediumHigh
Plant height (cm)87.6 a78.9 a65.5 b
Aboveground dry matter (g cm−2)0.06 a0.05 a0.03 b
Aboveground Cd (µg cm−2)0.084 b0.694 a0.791 a
Aboveground Zn (mg cm−2)0.006 c0.021 b0.044 a
Means in a row with different letters are different at p < 0.05.
Table 5. Soil–cultivar–biochar rate effects on aboveground tissue cadmium (Cd) concentration and Cd bioconcentration factor (BCF) for hemp grown in heavy-metal-contaminated soil for 90 days.
SoilCultivarBiochar Rate
(%, v/v)
Cd (mg kg−1)BCF Cd
LowCarmagnola01.7 i8.3 fghi
21.3 i6.6 ghi
51.1 i5.5 i
101.7 i8.3 fghi
Jinma01.1 i5.3 i
21.3 i6.3 hi
51.8 i8.8 fghi
101.3 i6.7 ghi
MediumCarmagnola022.8 bcde17.5 bcde
212.2 fgh9.4 fghi
513.6 efgh10.5 efgh
1013.8 efgh10.6 efgh
Jinma015.0 defgh11.6 defg
215.5 defgh11.9 defg
511.9 gh9.2 fghi
108.9 h6.8 ghi
HighCarmagnola015.5 defgh14.1 cdef
220.9 cdefg19.0 bcde
547.1 a42.9 a
1033.7 abc30.6 ab
Jinma027.8 abcd25.2 abc
221.8 cdef19.9 bcd
519.6 cdefg17.8 bcde
1040.6 ab36.9 a
Means in a column with different letters are different at p < 0.05.
Table 6. Analysis of variance summary for the effects of soil, cultivar, biochar rate, and their interactions on the bioconcentration factor (BCF) for cadmium (Cd), lead (Pb), and zinc (Zn) for industrial hemp grown in contaminated soils for 90 days.
Source of VariationBCF
CdPbZn
Soil (S)<0.01<0.01<0.01
Cultivar (C)0.320.020.02
   S*C0.720.020.04
Biochar rate (B)0.62<0.010.28
   S*B0.04<0.010.08
   C*B0.720.310.36
     S*C*B0.010.190.23
Table 7. Analysis of variance summary of the effects of soil, cultivar, biochar rate, and their interactions on biochar concentrations and uptakes of cadmium (Cd), lead (Pb), and zinc (Zn) after at least 90 days of biochar exposure to heavy-metal-contaminated soil.
Source of VariationBiochar ConcentrationBiochar Uptake
CdPbZnCdPbZn
Soil (S)<0.01<0.01<0.01<0.01<0.01<0.01
Cultivar (C)0.830.990.550.810.990.55
   S*C0.140.350.400.140.350.40
Biochar rate (B)<0.01<0.01<0.01<0.01<0.01<0.01
   S*B0.160.130.100.150.120.10
   C*B0.730.040.070.740.040.07
      S*C*B0.260.540.470.280.540.47
Disclaimer/Publisher’s Note: The statements, opinions and data contained in all publications are solely those of the individual author(s) and contributor(s) and not of MDPI and/or the editor(s). MDPI and/or the editor(s) disclaim responsibility for any injury to people or property resulting from any ideas, methods, instructions or products referred to in the content.

