Article

Effects of Past Sulfur Deposition on the Soil Microbial Biomass at Spruce Forest Sites

1
Institute of Soil Science and Site Ecology, Technische Universität Dresden, 01737 Tharandt, Germany
2
Saxon State Office for Environment Agriculture and Geology, 09599 Freiberg, Germany
3
Department of Landscape Management and Nature Conservation, Eberswalde University for Sustainable Development, 16225 Eberswalde, Germany
4
Institute of Environmental Sciences, RPTU University of Kaiserslautern-Landau, 76829 Landau, Germany
*
Author to whom correspondence should be addressed.
Soil Syst. 2024, 8(2), 37; https://doi.org/10.3390/soilsystems8020037
Submission received: 27 February 2024 / Revised: 19 March 2024 / Accepted: 21 March 2024 / Published: 23 March 2024

Abstract

:
During the last decades, forest soils in Central Europe recovered from former sulfur and acid deposition. As external S input into forests has strongly decreased and legacy S pools in the soils are diminishing, internal S cycling through mineralization will increasingly become important for ecosystem nutrition. However, it is not known how microbial biomass is affected by the S pool change in the formerly S surplus soils. Here, we present data on the status quo of C, N, and S in microbial biomass in relation to contents in mineral soil and organic layer. The results of forest soil in Eastern Germany (low and high liming), which is slowly recovering from former pollution, are compared to those of a site remote from air pollution in the Swiss Alps. The contents of C, N, and S in soil as well as in microbial biomass were clearly higher in the organic layer than in mineral topsoil at all sites. Despite the generally low content in the mineral A-horizon, the clean-air site showed indications of a more active S-turnover as compared to the high-pollution site. Liming at the high-pollution site improved the conditions for microbial growth (pH increase) in the organic layer resulting in more mobile S.

1. Introduction

Sulfate deposition and high sulfur dioxide ambient air concentrations caused serious problems for forest ecosystems in North and Central Europe during the 1970–1990s [1,2,3] with severe impacts on forest growth [4,5], soil [6,7,8,9], and water chemistry [10,11]. Due to the filtering of emission gases from combustion, deposition loads strongly declined in the last decades [3], and liming measures were carried out to buffer the acid pollution in forest soils [12]. Nevertheless, legacy effects of former high sulfur (S) depositions were observed in ecosystems over many years, because of long-term storage of S within the organic layer and mineral soil [13,14,15,16]. In the last decade, these legacy effects have been observed to diminish. As a result, agricultural systems started to suffer S deficits [17,18,19], and S availability in forest soils was observed to decrease [20,21,22,23,24]. It is still unclear how the change from S surplus to minimal S input from deposition will affect soil nutrient cycling in forest soils at formerly heavily polluted sites. When external S sources are no longer available and the legacy S pool in the soil is expected to decrease, S release by mineralization of organic material will increasingly become important for plant nutrition in forests [25]. Thus, microbial biomass and its contribution to S release by microbial-induced mineralization may develop into a key factor in S availability for ecosystem nutrition [26].
Soil microorganisms can metabolize a wide variety of organic S compounds and therefore represent both sink and source in soil-internal S cycling [27,28]. The mineralization-induced release of S from organic material is differentiated into biological mineralization (S and N release during oxidation of carbon (C) to provide energy for microorganisms) and biochemical mineralization (S release through enzymatic catalysis due to nutrient needs of organisms) [29]. Thus, the element cycles of C, N, and S in soil and microbial biomass are tightly connected [30]. For forest soils, a median microbial biomass content of S (MBS) of 5.7 µg g−1 was observed [27], and a strong relationship to microbial carbon (MBC), soil organic C, and microbial biomass nitrogen (MBN) was described [26,27,31]. However, data availability on MBS and stoichiometric relationships in forest soils is still very limited. Furthermore, the effects of a changed S supply due to the recovery from S deposition on microbial biomass S have not been investigated so far.
In this study, we investigated a formerly highly affected site in the Eastern Ore Mountains (East Germany), where S deposition decreased drastically in the 1990s [3] and soil recovery was promoted by liming measures. As a contrasting site, we assessed the status of soil and microbial nutrient patterns in a long-term “clean-air” region in the Swiss Alps. Here, external S sources are minimal and the S supply of the ecosystem therefore is assumed to rely on internal processes, such as microbial-driven mineralization. For the formerly polluted site, we expect that microbial biomass S is still influenced by the high availability of S in soil supplied by legacy S pools [32]. The stoichiometric ratios between major nutrients therefore are expected to differ considerably as compared to the “clean-air” site, where the soil-internal S cycle is assumed to be adapted to tight nutrient recycling processes.

2. Materials and Methods

2.1. Sites

The investigated sites differ regarding atmospheric S deposition in the past: The site Altenberg is located in the Eastern Ore Mountains (Saxony, Eastern Germany), in a region with formerly high atmospheric S deposition (see Section 2.2). At the Altenberg site, common forest liming practice with dolomite was applied, but with different intensities within the area. Therefore, two neighboring locations were selected and sampled: a low-liming plot and a high-liming plot (resp. Alt and Alt_L, Table 1).
The contrasting site Seehornwald near Davos (Central Alps, Graubünden, Switzerland) is characterized by minimal S inputs in both the past and the present. Therefore, this location can be considered as a “clean-air” reference site.
The characteristics and climate conditions of the sites are given in Table 1. The dominant tree species (Picea abies), tree age (>120 years), and tree density were comparable at the sites.
Pedologically the two sites in Germany and Switzerland are comparable in terms of the parent material, which is rich in quartz and thus base-poor favoring podzolization processes. However, the characteristic podzolic horizon was more developed at the alpine Swiss site. This may be the result of lower temperatures at the much higher elevation even though annual precipitation is similar. This difference in soil formation conditions, together with the liming practice, must be considered when pH and the amount and composition of organic material in the organic layer are compared (see Section 3.1). The initial total S contents were in a similar range at all sites: for the O-layer 1.8 mg g−1 at Dav, 2.0 mg g−1 at Alt, and 2.1 mg g−1 at Alt_L. In the A-horizon, S contents were lower with 0.6 mg g−1 at Dav and 0.3 mg g−1 at Alt as well as at Alt_L.

2.2. History of Atmospheric S deposition

The Ore Mountains in the border region between Germany and the Czech Republic were affected by high air pollution in the 1970s and 1980s [35]. In the late 1980s, the deposition was around 100 kg S ha−1 a−1 and the air concentration of SO2 was 0.09–0.10 mg m−3 [5]. In the throughfall of two spruce stands of the region (Tharandt and Oberbärenburg), an average of 128 kg ha−1 a−1 as SO42−-S was measured [36]. With the decrease in SO2 emissions in Germany, S deposition strongly decreased to almost 20 kg ha−1 a−1 in 2001 [37,38] and to less than 10 kg ha−1 a−1 in the last 20 years (mean of approximately 5 kg S ha−1 a−1) [39].
In Switzerland, an increase in SO2 emissions with a maximum in the 1980s and a fast reduction afterward to the same level as natural inputs since 2012 were described [40,41]. At the site Davos in the Central Alps, which was remote from industrial air pollution, the total S depositions were 3 kg ha−1 a−1 in 1989, 2.4 kg ha−1 a−1 in 2009, and decreased to around 1.0 kg ha−1 a−1 nowadays [42,43,44].

2.3. Sampling and Chemical Analyses

Five soil samples per site were taken in October 2021, each from the organic layer (O-layer) and the mineral topsoil horizon (A-horizon). The O-layer was sampled as a mixed sample of the humus horizons Oi, Oe, and Oa (World Reference Base for Soil Resources 2014). The average thickness of the O-layers was 19 cm at Alt, 17 cm at Alt_L, and 16 cm at Dav. The sampled mineral A-horizon was 7.7 cm at Alt, 6.3 cm at Alt_L, and approximately 10 cm at Dav. All samples were stored at −18 °C. After defrosting at 4 °C, the samples were sieved (O-layer: 5 mm, A-horizon: 2 mm), incubated for 40 h at 25 °C, and eventually wetted with deionized water from a spray bottle.
For the analysis of pH values, subsamples were mixed with deionized water in a ratio of 1:10 for the O-layer and 1:2.5 for the A-horizon samples. After 4 h of occasional stirring, the pH values were measured with an MP 220 pH meter (Mettler-Toledo, Columbus, OH, USA).
The total contents of carbon (TC), nitrogen (TN), and sulfur (TS) were determined on ground samples by dry combustion with an elemental analyzer (Vario EL, Elementar, Langenselbold, Germany).
The determination of C, N, and S in microbial biomass (MBC, MBN, and MBS) was accomplished using the fumigation-extraction method [45]. In short, sieved and wetted samples (40% field capacity) were put in lab bottles (O-layer: 10 g, A-horizon: 50 g); empty bottles were included as blanks. Half the samples were fumigated with chloroform for 24 h at room temperature. All lab bottles were filled with 200 mL 0.01 M CaCl2 solution (0.1 M, 1.1 g L−1), shaken horizontally for 30 min at 180 oscillations per minute, and filtered through rinsed filters (Sartorius FT-4-205-240). The extracts were analyzed for contents of C and N using an elemental analyzer (Vario TOC Elementar, Langenselbold, Germany). The S contents were determined with ICP-AES (Ciros, Spectro, Kleve, Germany). The whole procedure was performed in duplicate. The differences in the element contents in fumigated and non-fumigated samples were assumed to result from microbial biomass contents (MBC, MBN, and MBS), whereby final results were obtained after calculations using the following uniform conversion values (kE): kEC = 0.45 for MBC [26], kEN = 0.54 for MBN [46], and kES = 0.35 for MBS [27,47,48].
The contents in non-fumigated samples are equivalent to CaCl2-extractable contents and are referred to represent easily available or dissolved element concentrations (DC, DN, DS). Additionally, these extracts were analyzed for dissolved SO42−-S (DSO4S) using ion chromatography IC (Dionex DX300, Thermo Fischer, Waltham, MA, USA) and for NH4+-N (DNH4N) as well as NO3-N (DNO3N) using SEAL AQ400 Discrete Analyzer (Seal Analytical Ltd., Wrexham, UK).
Statistics and figures were processed with R software (version 3.6.3, R Core Team, 2020). The statistical significance of differences between total, dissolved, and microbial element contents was analyzed using the non-parametric Wilcoxon rank-sum test.

3. Results

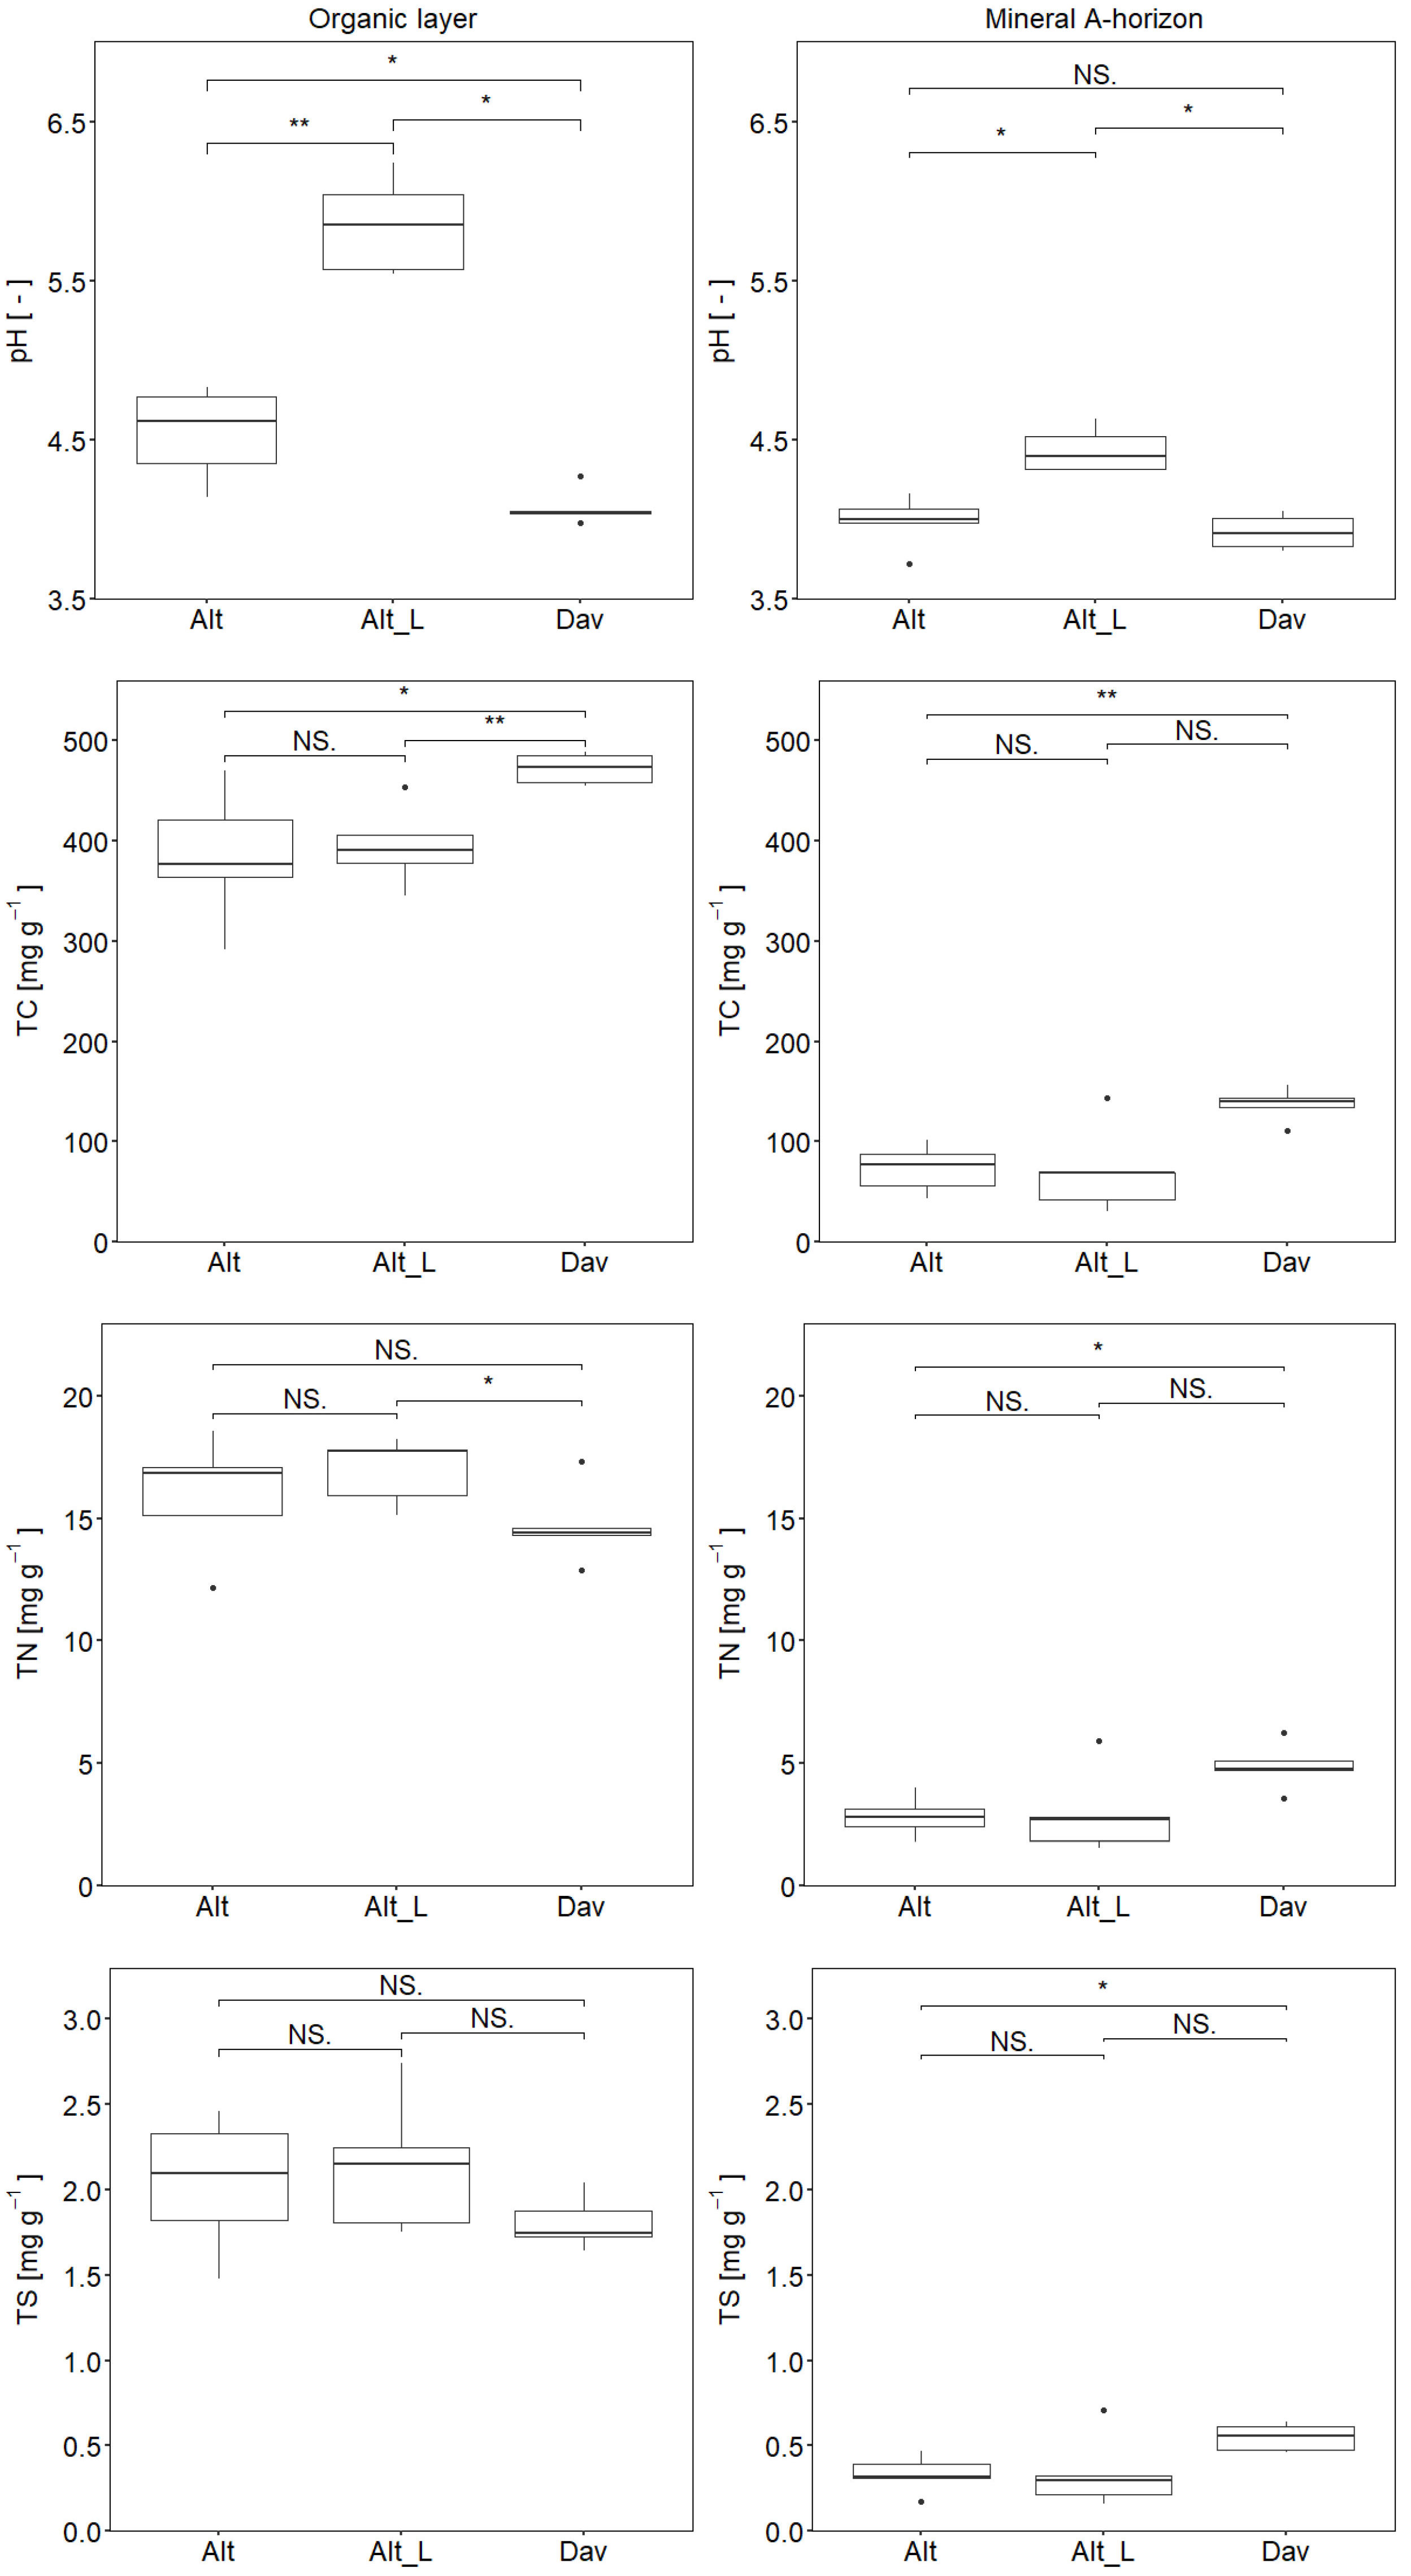
3.1. Soil Chemical Properties

The pH values of the organic layer were significantly different among the three plots. Here, the liming effect is clearly visible with a significantly higher pH at the plot Alt_L, whereas the remote site Dav had the lowest pH values (Figure 1). For the mineral A-horizon, the effect was less strong and only Alt_L was significantly higher than the other two plots. Nonetheless, the plot Alt_L showed slightly higher and Dav the lowest pH values.
The total soil C contents (TC) were significantly higher at the Dav plot as compared to both the Alt and Alt_L plots in the organic layer (Figure 1). The TC contents in the A-horizon showed a similar pattern as the O-layer (clearly higher at Dav than at Alt and Alt_L). The two plots, Alt and Alt_L, in the Ore Mountains did not differ in TC contents.
With regard to TN and TS contents, the statistical tests did not reveal any clear pattern because of the wide range of values per plot. There seems to be a tendency for higher TN and TS values in the A-horizon at Dav as compared to Alt and Alt_L, following the same trend as TC. However, in the O-layer, the contrary was found with lower values at the remote site Dav but not significantly different. Between the two Ore Mountain plots Alt and Alt_L with previously low- and high liming, we found no evidence for different TN or TS contents in the O-layer and A-horizon.
For the CaCl2-extractable elements, the distribution in the O-layer differed for elements and sites: DN was highest at Dav and significantly lowest at Alt_L. By contrast, DS was highest at Alt_L and far lower at Dav (Table 2). For carbon, we found no statistical differences because of the wide range of DC values. In the A-horizon, the dissolved elements were slightly elevated at Dav for DC, DN, and DS, however, only significantly higher for DC.
The analysis of sulfate-S (DSO4S) showed that all dissolved S (DS) available can be considered as sulfate-S. The contents of DSO4S were in some cases slightly higher than DS, which must be attributed to uncertainties in the analytical methods.
The dissolved fraction of nitrogen was mostly available as ammonium-N (DNH4N); this fraction accounted for around 50 to 75% of DN. Nitrate was below the detection limit in all cases.

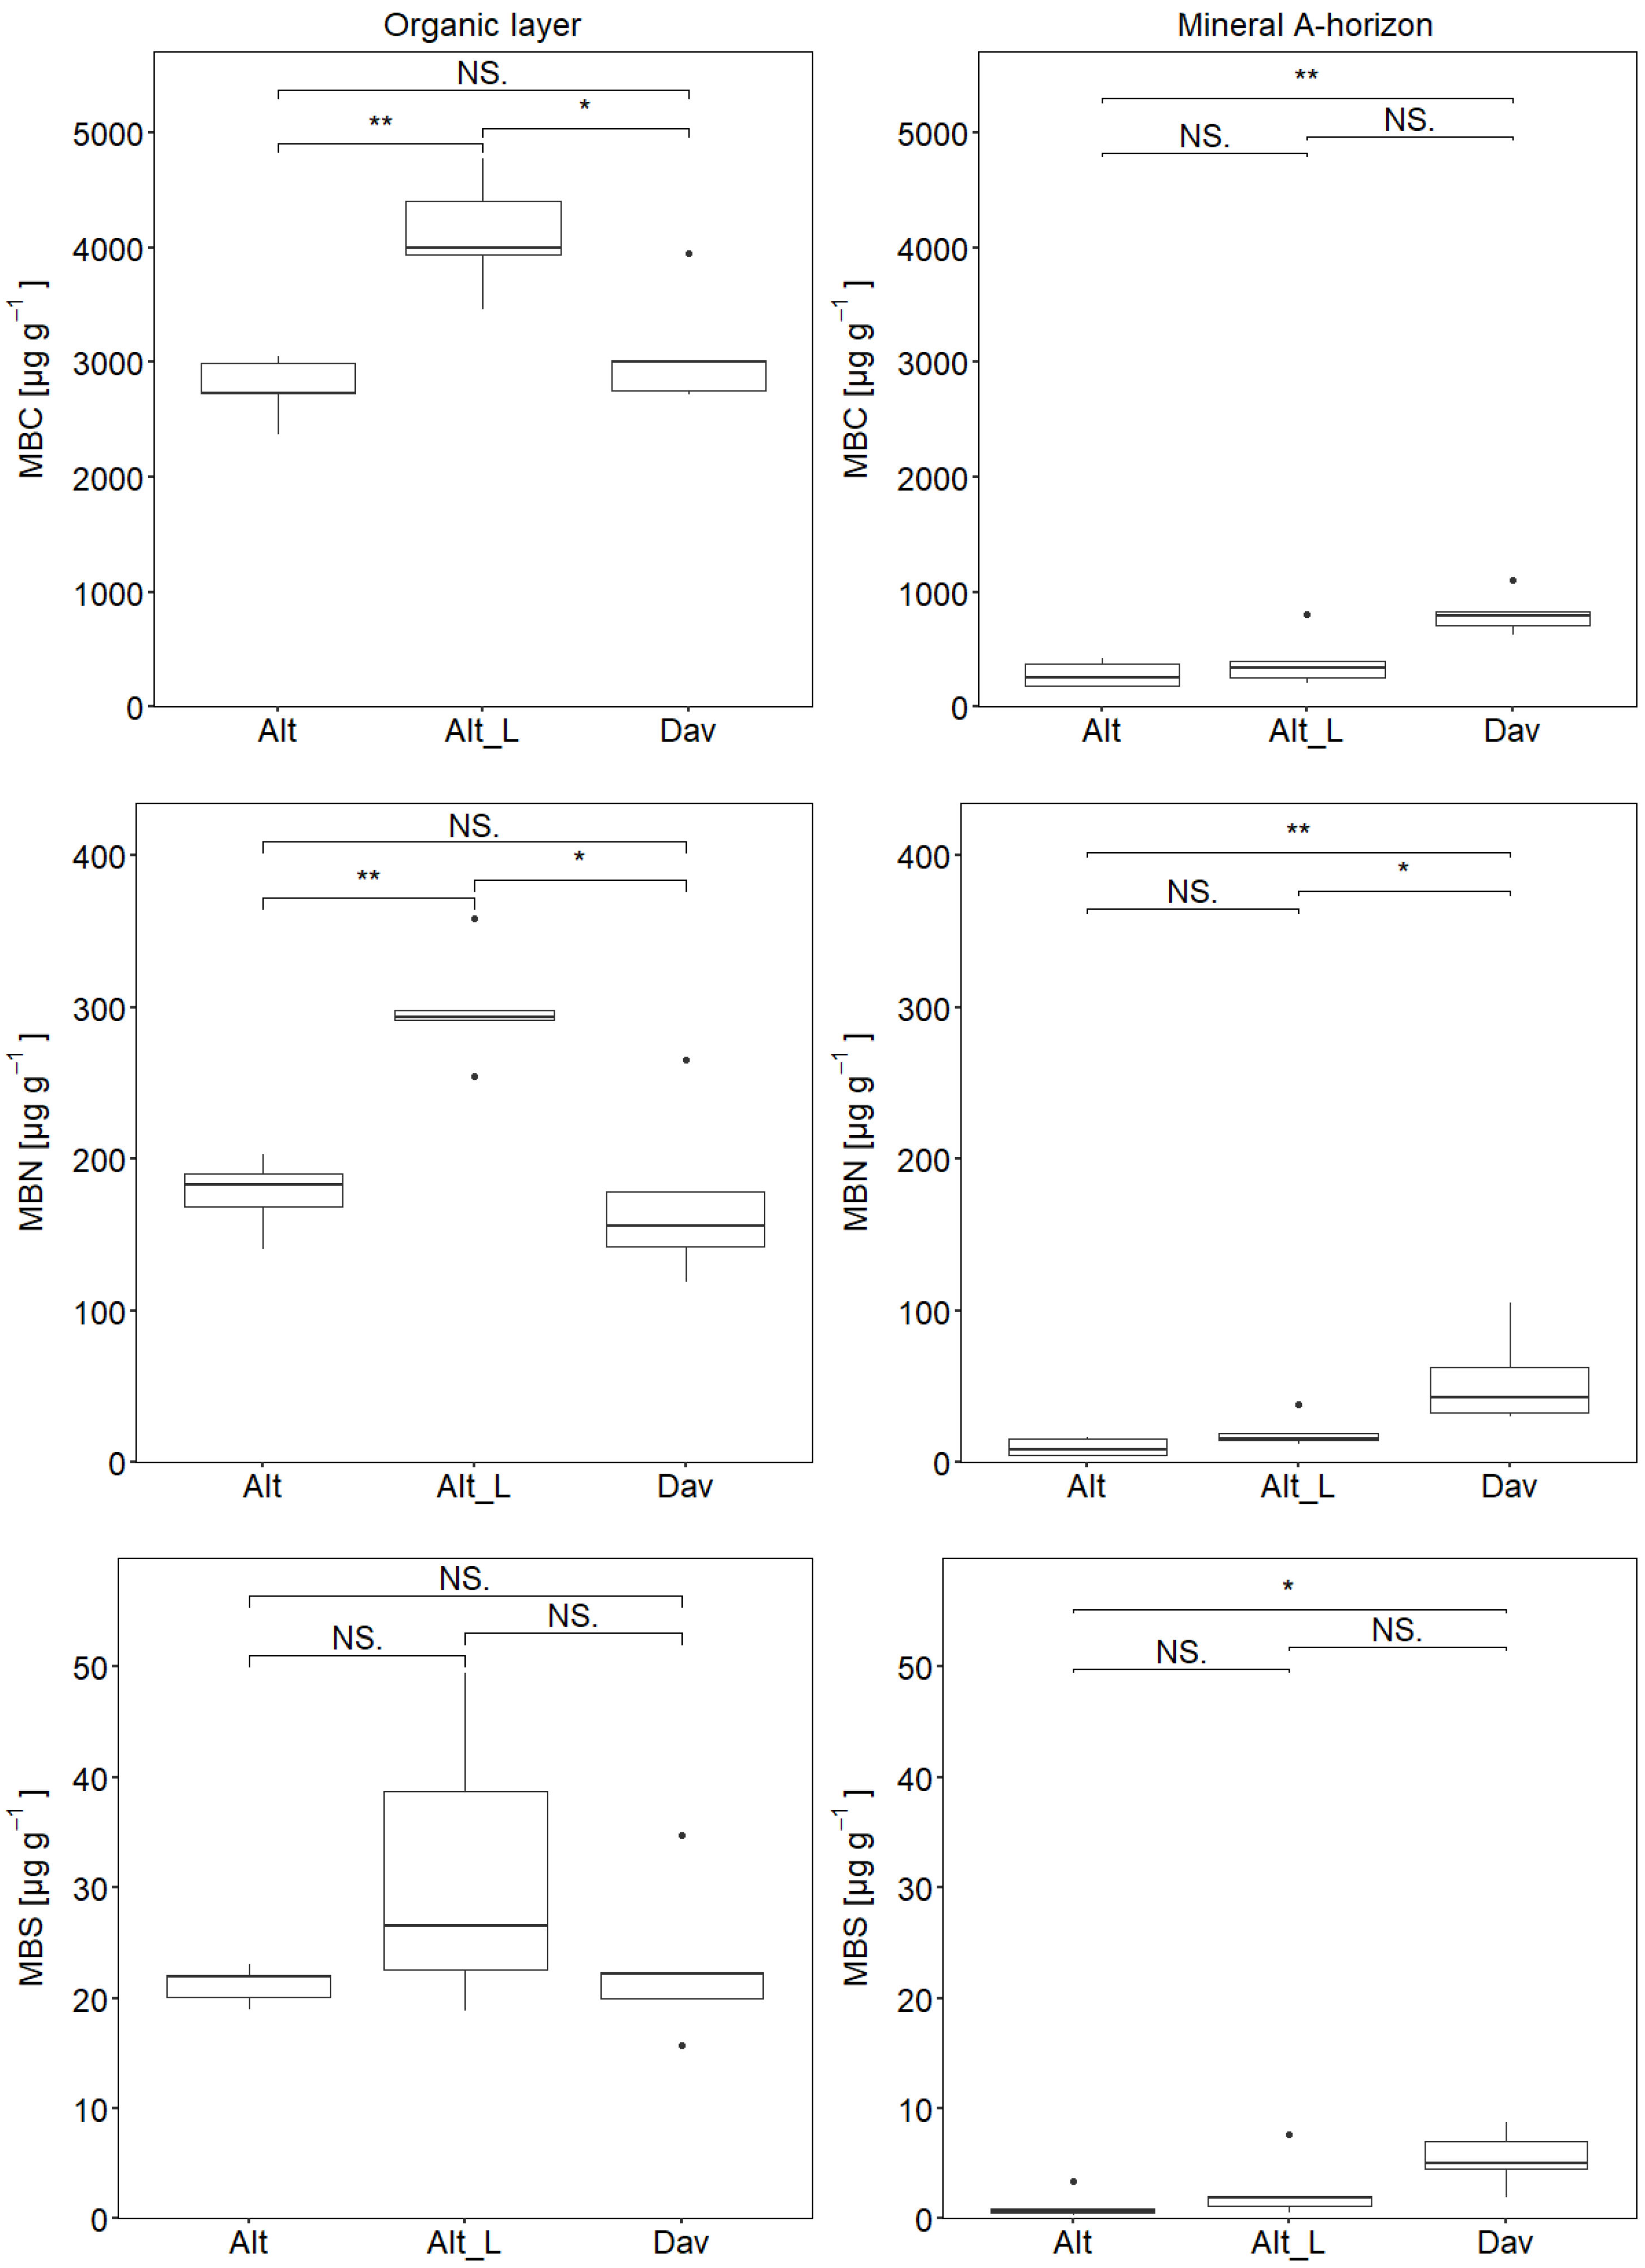
3.2. Elemental Composition in Microbial Biomass

The element contents in microbial biomass showed different distributions in the O-layer as compared to the A-horizon (Figure 2). In the O-layers, microbial C (MBC), N (MBN), and S (MBS) were clearly higher at the Alt_L (statistically significantly higher for MBC and MBN). However, we found no significant difference in MBC, MBN, or MBS between Alt and Dav.
By contrast, the investigations for the mineral A-horizon revealed significantly the highest contents for MBC, MBN, and MBS at the remote site Dav. The results for Alt and Alt_L showed slightly higher values at the stronger-limed site Alt_L for all elements. Nevertheless, all contents in microbial biomass were far lower in the A-horizon than in the O-layer.

3.3. Stoichiometry in Soil and Microbial Biomass

The statistical analysis revealed no significant differences in the ratio of elements in the soil between the low- and high-liming plots Alt and Alt_L (Table 3). By contrast, the soil TC/TN ratios in both O-layer and A-horizon were significantly higher at Dav than on both the Alt plots. The TC/TS was also clearly higher at Dav (significantly in the O-layer, not significantly in the A-horizon). The ratios of soil TN to TS were in the same range of values for all plots.
The element ratios in microbial biomass were highly variable in the repetition subsamples, especially in the A-horizon samples and for the analysis of MBN and MBS. Because of these uncertainties, the statistical analysis found no significant differences in the ratio of MBC/MBN and MBC/MBS. For the ratio of C to N in microbial biomass, which included less uncertainty, the ratio was significantly lowest at Alt_L and highest at Dav in the O-Layer, but in the A-horizon, it was lowest at Dav and highest at Alt (Table 3c).
The share of the microbial biomass contents to the total soil contents was < 2% for all elements. The highest values showed up for Alt_L in the organic layer (for all rations MB-elements to total element). In the mineral A-horizon, the highest ratios were found for Dav.

4. Discussion

The values we found for microbial-bound C, N, and S were roughly within the ranges as observed for forest soils by other studies (MBC: 500–10,000 µg g−1 [27,31,49], MBN: 85–110 µg g−1 [27,31], MBS: 1–29 µg g−1 [27,31]). Even higher ranges for MBS with 3 to 300 µg g−1 were summarized by Banerjee and Chapman [26], but based on a limited dataset on forest soils. In the organic layers, the element contents in the soil as well as in microbial biomass were clearly elevated as compared to the contents in the mineral A-horizon. This indicates that nutrients are more available (higher dissolved contents) in the O-layer than in the A-horizon, and microbes can use the available nutrients to produce more biomass. The tighter element ratios in microbial biomass (MBC/MBN, MBC/MBS) show that relatively more N and S were incorporated into biomass as compared to the mineral soil and also relatively more S than N (lower MBN/MBS in O-layers than A-horizon). It is known that biogeochemical cycles of N and S are tightly coupled [24,50,51]. Nevertheless, data on the relation of N to S in the microbial biomass of forest soils are very rare. Chowdhury et al. [31] found values around 13.5 in two forest soils in Japan, which is similar to our microbe ratios in the A-horizon. The tighter ratios (MBN/MBS: 8–10) in the organic layers in our study indicate a better availability of S, which is confirmed by higher dissolved S results as compared to mineral soil. In the A-horizon, the microbial biomass and dissolved N/S were clearly higher at the clean-air site than at the formerly polluted sites. Here, N seems to have a better availability in relation to S or S is more limited than N. Additionally, the limitation of other nutrients may result in changed element ratios because of the tight coupling of nutrient cycles. For example, P limitation was observed to decrease C/S in microbial biomass [27,52] but was not considered in this study.

4.1. pH Effects on Microbial Mineralization

The availability of S in the soil and the contents in microbial biomass are related to the pH value, e.g., [27]. Our results for the A-horizon demonstrate that microbial C, N, and S were increased at the clean-air site Dav, where pH values were lowest. We found the same pattern in total and dissolved soil contents, which were also highest at Dav. This indicates for the mineral topsoil that microbial C, N, and S are positively related to soil content but negatively to pH, as shown in recent studies [27,53]. As the MBS contents are considered to be the most active S pool in S-turnover in soil, higher MBS contents indicate a greater S availability for higher plants [26]. For the mineral A-horizon, the clean-air site Dav therefore can be assumed to be a more active S-turnover site as compared to the Alt plots.
In the organic layer, a liming-derived increase in the pH value was clearly visible in the Alt plots. Here, the high-liming plot Alt_L with the highest soil pH revealed the highest contents of C, N, and S in microbial biomass. This is contrasting to the findings in the mineral topsoil, but for sulfur, it is in line with studies on liming plots, where S mineralization was directly proportional to pH for soils with pH < 7.5 [54,55]. Consistently, dissolved S is also highest in the O-layer of the high-liming plot indicating higher S release by mineralization, and we suggest better pH conditions for microbial growth [55].
However, unexpected effects of pH changes on microbial biomass and activity in forest soils were also observed in northern hardwood forest plots, and underlying microbial processes are not completely understood [53]. Liming of acidified soils during recovery from pollution has a strong influence on the pH-dependence of microbial activity and therefore crucially impacts S mineralization processes. The thicker O-layers at Alt and Alt_L indicated that even if conditions for microbial growth have been improved in the last two decades (increasing pH), the accelerated nutrient cycling has not induced fast degradation of organic material so far.

4.2. Carbon-Dependent S Mineralization

Microbial mineralization depends on the amount and quality of soil organic matter [56]. At the clean-air site Dav, TC was very high due to soil-forming conditions at this alpine site (higher degree of podzolization). This resulted also in high TC to TN as well as TC to TS ratios in comparison to the other plots. These wide soil ratios of C/N (O-layer: 32, A-horizon: 29) and C/S (O-layer: 263 and A-horizon: 251) indicate slow decomposition of organic material and thus accumulation of C, probably as a result of a colder mean temperature at this site (Table 1). However, the C/S ratio was between 200 (as upper limit for net sulfate release due to mineralization) and 400 (as lower limit for net immobilization due to incorporation into microbial biomass) [25]. In this range, the two processes (S release and immobilization) may occur in parallel. At the formerly S-polluted sites in the Ore Mountains (Alt and Alt_L), the C/S ratios in soil were with values around 200 slightly shifted to net sulfate release by microbes.
In general, the C to S ratios in the microbial biomass of the O-layer were within the range given for soils (MBC/MBS: 31–149 [26,31]), but above this reference range in the A-horizon at all plots. Whereas the ratio MBC to MBS increased from O-layer to A-horizon, soil TC/TS was not considerably different. This result indicates a more limited S uptake by microbes in the mineral soil. The relation of elements in microbial biomass to soil contents as an indicator for the availability of nutrients for microbes revealed that less than 1.6% of soil S was bound as MBS in the O-layer and even less in the A-horizon. This is for all plots at the lower end of ranges given in the literature (1.5–5% for soil generally [26,31] and 1.5 for forest soils [27]). However, literature values for forest soil are mostly based on very few study plots and do not consider changes in environmental or S source conditions. The ratios of MBS/TS were especially low in the mineral soil of the formerly S-polluted plots. At the clean-air site, MBS/TS and following S availability for microbes in the A-horizon seem to be slightly better, which is confirmed by higher dissolved S values in the soil at this site. Probably, the long-term adaption to low nutrient supply at the clean-air site favors biochemical S mineralization, where microbes actively mobilize limited nutrients such as S through enzymatic catalysis [29]. By contrast, the microbial community at the formerly polluted site may not yet have such adaption strategies because of a long-lasting S surplus condition.

5. Conclusions

The biogeochemical cycles of C, N, and S are tightly coupled in ecosystems. Microbial-driven mineralization is an essential process for nutrient release and plant nutrition when other sources such as element input from atmospheric deposition become less important. However, despite the strong reduction in S deposition and very low S input rates during the last 20 years, our results revealed that microbial biomass in soils recovering from former S pollution still shows legacy effects. As a result, the nutritional conditions with regard to microbial S acquisition and release still differ between formerly polluted and clean-air sites. Furthermore, liming that was undertaken as a countermeasure against soil acidification improved conditions for microbial growth considerably and strongly affected the relationships between C, N, and S in soil and microbial biomass. As forest soils in Central Europe are more and more recovering from atmospheric pollution impacts and acidification, data on observations of changes in soil nutrient cycling are required to assess future developments in nutrient availability for forest growth. With our study, we deliver new data and insights into the current development of nutritional conditions in formerly polluted and clean-air forest ecosystems.

Supplementary Materials

The following supporting information can be downloaded at: https://www.mdpi.com/article/10.3390/soilsystems8020037/s1, Table S1: Analysis results of all repetitions per site and horizon.

Author Contributions

Conceptualization and methodology, J.H.T.Z. and D.J.; writing—original draft preparation and visualization, D.J. and T.K.; writing—review and editing, D.J., S.J., K.-H.F., and J.H.T.Z.; supervision and project administration, D.J. All authors have read and agreed to the published version of the manuscript.

Funding

This research was funded by the Deutsche Forschungsgemeinschaft (DFG, German Research Foundation—426668836).

Institutional Review Board Statement

Not applicable.

Informed Consent Statement

Not applicable.

Data Availability Statement

The data are supplied in the form of Supplementary Materials to this study or can be requested from the corresponding author.

Acknowledgments

We thank the laboratory staff of the Institute of Soil Science and Site Ecology at TU Dresden for technical support and analyses in the laboratory. Furthermore, many thanks to the colleagues of the Swiss Federal Institute for Forest, Snow and Landscape Research WSL who supported us with allowance for access and sampling at the Davos plot as well as supply with data from the site.

Conflicts of Interest

The authors declare no conflicts of interest.

References

  1. Lövland, G.; Tarrasón, L.; Torseth, K.; Dutchak, S. EMEP Assessment Report Part I—European Perspective; Norwegian Meteorological Institute: Oslo, Norway, 2004; ISBN 82-7144-032-2. [Google Scholar]
  2. Vanguelova, E.; Reynolds, B.; Nisbet, T.; Godbold, D. The cycling of pollutants in nonurban forested environments. In Forest Hydrology and Biogeochemistry; Ecological Studies; Springer: Dordrecht, The Netherlands, 2011; pp. 679–710. ISBN 978-94-007-1362-8. [Google Scholar]
  3. Engardt, M.; Simpson, D.; Schwikowski, M.; Granat, L. Deposition of sulphur and nitrogen in Europe 1900–2050. Model calculations and comparison to historical observations. Tellus B 2017, 69, 1328945. [Google Scholar] [CrossRef]
  4. McLaughlin, S.B.; Shortle, W.C.; Smith, K.T. Dendroecological applications in air pollution and environmental chemistry: Research Needs. Dendrochronologia 2002, 20, 133–157. [Google Scholar] [CrossRef]
  5. Liebold, E.; Drechsler, M. Schadenszustand und-entwicklung in den SO2-geschädigten Fichtengebieten Sachsens. AFZ DerWald 1991, 46, 492–494. [Google Scholar]
  6. Singh, B.R. Distribution of total and extractable S and adsorbed 35SO2−4 in some acid forest soil profiles of Southern Norway. Acta Agric. Scand. 1980, 30, 357–363. [Google Scholar] [CrossRef]
  7. Johnson, D.W.; Mitchell, M.J. Responses of forest ecosystems to changing sulfur inputs. In Sulfur in the Environment; Marcel Dekker: New York, NY, USA, 1998; pp. 219–262. [Google Scholar]
  8. Ulrich, B. The history and possible causes of forest decline in Central Europe, with particular attention to the German situation. Environ. Rev. 1995, 3, 262–276. [Google Scholar] [CrossRef]
  9. Zöttl, H.W.; Hüttl, R.F. Nutrient supply and forest decline in Southwest-Germany. Water Air Soil Pollut. 1986, 31, 449–462. [Google Scholar] [CrossRef]
  10. Wright, R.F.; Larssen, T.; Camarero, L.; Cosby, B.J.; Ferrier, R.C.; Helliwell, R.; Forsius, M.; Jenkins, A.; Kopáěek, J.; Majer, V.; et al. Recovery of acidified European surface waters. Environ. Sci. Technol. 2005, 39, 64A–72A. [Google Scholar] [CrossRef]
  11. Novák, M.; Kirchner, J.W.; Fottová, D.; Prechová, E.; Jăcková, I.; Krám, P.; Hruska, J. Isotopic Evidence for processes of sulfur retention/release in 13 forested catchments spanning a strong pollution gradient (Czech Republic, Central Europe). Glob. Biogeochem Cycles 2005, 19, GB4012. [Google Scholar] [CrossRef]
  12. Schmidt, U. Waldböden in Deutschland: Ausgewählte Ergebnisse der Zweiten Bodenzustandserhebung; Bundesministerium für Ernährung und Landwirtschaft (BMEL): Bonn, Germany, 2018. [Google Scholar]
  13. Alewell, C.; Manderscheid, B.; Gerstberger, P.; Matzner, E. Effects of reduced atmospheric deposition on soil solution chemistry and elemental contents of spruce needles in NE-Bavaria, Germany. J. Plant Nutr. Soil Sci. 2000, 163, 509–516. [Google Scholar] [CrossRef]
  14. Armbruster, M.; Abiy, M.; Feger, K.H. The biogeochemistry of two forested catchments in the Black Forest and the Eastern Ore Mountains (Germany). Biogeochemistry 2003, 65, 341–368. [Google Scholar] [CrossRef]
  15. Meesenburg, H.; Ahrends, B.; Fleck, S.; Wagner, M.; Fortmann, H.; Scheler, B.; Klinck, U.; Dammann, I.; Eichhorn, J.; Mindrup, M.; et al. Long-term changes of ecosystem services at Solling, Germany: Recovery from acidification, but increasing nitrogen saturation? Ecol. Indic. 2016, 65, 103–112. [Google Scholar] [CrossRef]
  16. Vuorenmaa, J.; Augustaitis, A.; Beudert, B.; Clarke, N.; de Wit, H.A.; Dirnböck, T.; Frey, J.; Forsius, M.; Indriksone, I.; Kleemola, S.; et al. Long-term sulphate and inorganic nitrogen mass balance budgets in European ICP Integrated Monitoring Catchments (1990–2012). Ecol. Indic. 2017, 76, 15–29. [Google Scholar] [CrossRef]
  17. Hartmann, K.; Lilienthal, H.; Schnug, E. Risk-mapping of potential sulphur deficiency in agriculture under actual and future climate scenarios in Germany. Asp. Appl. Biol. 2008, 88, 113–121. [Google Scholar]
  18. Zhao, F.; Tausz, M.; De Kok, L.J. Role of sulfur for plant production in agricultural and natural ecosystems. In Sulfur Metabolism in Phototrophic Organisms; Hell, R., Dahl, C., Knaff, D., Leustek, T., Eds.; Springer: Dordrecht, The Netherlands, 2008; pp. 417–435. ISBN 978-1-4020-6863-8. [Google Scholar]
  19. Chalk, P.M.; Inácio, C.T.; Chen, D. Tracing S dynamics in agro-ecosystems using 34S. Soil Biol. Biochem. 2017, 114, 295–308. [Google Scholar] [CrossRef]
  20. Talkner, U.; Riek, W.; Dammann, I.; Kohler, M.; Göttlein, A.; Mellert, K.H.; Meiwes, K.J. Nutritional status of major forest tree species in Germany. In Status and Dynamics of Forests in Germany; Springer: Cham, Switzerland, 2019; pp. 261–293. [Google Scholar]
  21. Wellbrock, N.; Bolte, A.; Flessa, H. Dynamik und Räumliche Muster forstlicher Standorte in Deutschland: Ergebnisse der Bodenzustandserhebung im Wald 2006 bis 2008; Thünen Reports 43; Johann Heinrich von Thünen Institute, Federal Research Institute for Rural Areas, Forestry and Fisheries: Braunschweig, Germany, 2016. [Google Scholar]
  22. Göttlein, A.; Fäth, J.; Rau, M.; Mellert, K.H. Schwefel—Vom Überschuss zum Mangel? AFZ-DerWald 2020, 9, 31–33. [Google Scholar]
  23. Prescher, A.-K.; Schmitz, A.; Sanders, T.G.M.; Nussbaumer, A.; Pihl Karlsson, G.; Neirynck, J.; Gottardini, E.; Hansen, K.; Johnson, J.; Nieminen, T.M.; et al. Change in sulphur pools in forest ecosystems following the reduction of atmospheric sulphur dioxide. In Proceedings of EGU General Assembly Conference Abstracts; EGU General Assembly: Vienna, Austria, 2018; Volume 20, p. 9027. [Google Scholar]
  24. Jonard, M.; Fürst, A.; Verstraeten, A.; Thimonier, A.; Timmermann, V.; Potočić, N.; Waldner, P.; Benham, S.; Hansen, K.; Merilä, P.; et al. Tree mineral nutrition is deteriorating in Europe. Glob. Chang. Biol. 2015, 21, 418–430. [Google Scholar] [CrossRef]
  25. Scherer, H.W. Sulfur in Soils. J. Plant Nutr. Soil Sci. 2009, 172, 326–335. [Google Scholar] [CrossRef]
  26. Banerjee, M.R.; Chapman, S.J. The significance of microbial biomass sulphur in soil. Biol. Fert. Soils 1996, 22, 116–125. [Google Scholar] [CrossRef]
  27. Heinze, S.; Hemkemeyer, M.; Schwalb, S.A.; Khan, K.S.; Joergensen, R.G.; Wichern, F. Microbial biomass sulphur—An important yet understudied pool in soil. Agronomy 2021, 11, 1606. [Google Scholar] [CrossRef]
  28. Kertesz, M.A.; Mirleau, P. The role of soil microbes in plant sulphur nutrition. J. Exp. Bot. 2004, 55, 1939–1945. [Google Scholar] [CrossRef] [PubMed]
  29. McGill, W.; Cole, C. Comparative aspects of cycling of organic C, N, S and P through soil organic matter. Geoderma 1981, 26, 267–286. [Google Scholar] [CrossRef]
  30. Kirkby, C.A.; Kirkegaard, J.A.; Richardson, A.E.; Wade, L.J.; Blanchard, C.; Batten, G. Stable soil organic matter: A comparison of C:N:P:S ratios in Australian and other world soils. Geoderma 2011, 163, 197–208. [Google Scholar] [CrossRef]
  31. Chowdhury, M.A.H.; Kouno, K.; Ando, T. Correlation among microbial biomass S, soil properties, and other biomass nutrients. Soil Sci. Plant Nutr. 1999, 45, 175–186. [Google Scholar] [CrossRef]
  32. Wunderlich, S.; Raben, G.; Andreae, H.; Feger, K. Schwefel-Vorräte und Sulfat-Remobilisierungspotential in Böden der Level-II-Standorte Sachsens. AFZ-DerWald 2006, 60, 762–765. [Google Scholar]
  33. Menzer, A.; Andreae, H. Stoffbilanzen Sächsischer Level II-Flächen—Anwendung zur Qualifizierung der Bodenschutzkalkung. In Ausgleichs-und Reaktorfunktion von Waldböden im Stoff-und Wasserkreislauf; von Wilpert, K., Vögtle, B., Eds.; Berichte Freiburger Forstliche Forschung; Forstliche Versuchs- und Forschungsanstalt Baden-Württemberg: Freiburg, Germany, 2013; Volume 96, pp. 199–211. [Google Scholar]
  34. WSL LWF Seehornwald Davos Long-Term Research Site. Available online: https://lwf.wsl.ch/de/flaechen/davos/?tx_wslwebapps_webapps_lwfdispatcher%5Baction%5D=which&tx_wslwebapps_webapps_lwfdispatcher%5Bcontroller%5D=Lwf&cHash=8d8efd03c00049497b490abb67c5f389 (accessed on 5 January 2024).
  35. Grunewald, K.; Scheithauer, J. Landschaftsveränderung und Umweltbelastung im Erzgebirge. In Naturschutz im Gesellschaftlichen Kontext; Erdmann, K.-H., Bork, H.-R., Kopf, T., Eds.; Bundesamt für Naturschutz: Bonn, Germany, 2006; pp. 165–190. [Google Scholar]
  36. Volz, H.-A. 10 Jahre Depositionsmessungen in Fichtenbeständen: Eine Synoptische Darstellung Ausgewählter Meßreihen für Schwefel und Stickstoff im Vergleich zu den Emissionen; Schriftenreihe des Bundesministeriums für Ernährung, Landwirtschaft und Forsten—Reihe A: Angewandte Wissenschaft; Landwirtschaftsverlag: Münster, Germany, 1994; Volume 434. [Google Scholar]
  37. Nebe, W.; Feger, K.-H. Atmosphärische Deposition, ökosystemare Stoffbilanzen und Ernährung der Fichte bei differenzierter Immissionsbelastung–Langjährige Zeitreihen für das Osterzgebirge und den Südschwarzwald. Forstwiss. Beiträge Tharandt 2005, 22, 129. [Google Scholar]
  38. Andreae, H.; Gemballa, R.; Jacob, F. Leitfaden zur Forstlichen Bodenschutzkalkung in Sachsen; Staatsbetrieb Sachsenforst: Pirna, Germany, 2020; p. 102. [Google Scholar]
  39. Staatsbetrieb Sachsenforst; (Section Site Survey, Soil Monitoring, Laboratory, Pirna, Germany). Unpublished data 2023, personal communication, 2023.
  40. BUWAL. Vom Menschen verursachte Luftschadstoffemissionen in der Schweiz von 1900 bis 2010; Bundesamt für Umwelt, Wald und Landschaft (BUWAL), Schriftenreihe Umwelt: Bern, Switzerland, 1995; Volume 256, 121p. [Google Scholar]
  41. Augustin, S.; Achermann, B. Deposition von Luftschadstoffen in der Schweiz: Entwicklung, Aktueller Stand und Bewertung. Schweiz. Z. Fur Forstwes. 2012, 163, 323–330. [Google Scholar] [CrossRef]
  42. WSL Daten. Available online: https://lwf.wsl.ch/de/daten/?tx_wslwebapps_webapps_lwfdispatcher%5Baction%5D=data&tx_wslwebapps_webapps_lwfdispatcher%5Bcontroller%5D=Lwf&cHash=bca513fe05c679a167c07e65fc1a52a7 (accessed on 5 January 2024).
  43. Gehrig, R. Immissionssituation im Schweizer Wald. In Eidgenössische Forschungsanstalt für Wald, Schnee und Landschaft (Ed.): Waldschadenforschung in der Schweiz: Stand der Kenntnisse; Forum für Wissen; Eidgenössische Forschungsanstalt für Wald, Schnee und Landschaft: Birmensdorf, Switzerland, 1992; pp. 81–86. [Google Scholar]
  44. Waldner, P.; Schmitt, M.; Schaub, M.; Pannatier, E.G.; Thimonier, A. Stickstoffeintrag und Ozonbelastung im Schweizer Wald aus der Sicht der Langfristigen Waldökosystem-Forschung; Langzeitforschung für eine nachhaltige Waldnutzung; Eidgenössische Forschungsanstalt für Wald, Schnee und Landschaft WSL: Birmensdorf, Switzerland, 2009; pp. 113–124. [Google Scholar]
  45. DIN Deutsches Institut für Normung e.V. DIN EN ISO 14240-2:2011-09, Bodenbeschaffenheit—Bestimmung der Mikrobiellen Biomasse von Böden—Teil 2: Fumigations-Extraktionsverfahren; Beuth Verlag: Berlin, Germany, 2011. [Google Scholar]
  46. Joergensen, R.G.; Mueller, T. The fumigation-extraction method to estimate soil microbial biomass: Calibration of the kEN value. Soil Biol. Biochem. 1996, 28, 33–37. [Google Scholar] [CrossRef]
  47. Saggar, S.; Bettany, J.R.; Stewart, J.W.B. Measurement of microbial sulfur in soil. Soil Biol. Biochem. 1981, 13, 493–498. [Google Scholar] [CrossRef]
  48. Wu, J.; O’donnell, A.G.; He, Z.L.; Syers, J.K. Fumigation-extraction method for the measurement of soil microbial biomass-S. Soil Biol. Biochem. 1994, 26, 117–125. [Google Scholar] [CrossRef]
  49. Kandeler, E.; Stemmer, M.; Gerzabek, M.H. Role of microorganisms in carbon cycling in soils. In Microorganisms in Soils: Roles in Genesis and Functions; Varma, A., Buscot, F., Eds.; Soil Biology; Springer: Berlin/Heidelberg, Germany, 2005; pp. 139–157. ISBN 978-3-540-26609-9. [Google Scholar]
  50. Meiwes, K.J.; Khanna, P.K. Distribution and cycling of sulphur in the vegetation of two forest ecosystems in an acid rain environment. Plant Soil 1981, 60, 369–375. [Google Scholar] [CrossRef]
  51. Giordano, M.; Raven, J.A. Nitrogen and sulfur assimilation in plants and algae. Aquat. Bot. 2014, 118, 45–61. [Google Scholar] [CrossRef]
  52. Khan, K.S.; Joergensen, R.G. Stoichiometry of the soil microbial biomass in response to amendments with varying C/N/P/S ratios. Biol. Fertil. Soils 2019, 55, 265–274. [Google Scholar] [CrossRef]
  53. Ontman, R.; Groffman, P.M.; Driscoll, C.T.; Cheng, Z. Surprising relationships between soil pH and microbial biomass and activity in a Northern Hardwood Forest. Biogeochemistry 2023, 163, 265–277. [Google Scholar] [CrossRef]
  54. Thakur, S.D. Der biogeochmische Schwefelkreislauf in seiner Bedeutung für Forstökosysteme unter besonderer Berücksichtigung des ökologischen Experimentalgebietes “Wernersbach” im Tharandter Wald. Ph.D. Dissertation, TU Dresden, Tharandt, Germany, 1985. [Google Scholar]
  55. Edwards, P.J. Sulfur cycling, retention, and mobility in soils: A Review. Gen. Tech. Rep. 1998, 250. [Google Scholar]
  56. Blum, S.C.; Lehmann, J.; Solomon, D.; Caires, E.F.; Alleoni, L.R.F. Sulfur forms in organic substrates affecting S mineralization in soil. Geoderma 2013, 200–201, 156–164. [Google Scholar] [CrossRef]
Figure 1. pH values and total contents of C, N, and S (from top to bottom) in organic layer (left column) and mineral A-horizon (right column) at the study plots Alt (Altenberg, low liming), Alt_L (Altenberg, high liming), and Dav (Davos). Statistically significant and non-significant differences between groups are indicated as follows: ** p < 0.01, * p < 0.05, NS. not significant). Single points show outliers.
Soilsystems 08 00037 g001
Figure 2. Contents of C, N, and S in microbial biomass (MBC, MBN, and MBS) in organic layer (left column) and mineral A-horizon (right column) at the study plots Alt (Altenberg, low liming), Alt_L (Altenberg, high- liming), and Dav (Davos). Statistically significant and non-significant differences between groups are indicated as follows: ** p < 0.01, * p < 0.05, NS. not significant). Single points show outliers.
Soilsystems 08 00037 g002
Table 1. Site description of Altenberg and Davos, liming measures [33,34].
SiteAltenbergDavos
AbbreviationAltAlt_LDav
Location50°47′31.99″ N, 13°43′28.99″ E46°48′55.2″ N, 9°51′21.3″ E
Elevation [m above sea level]7451635–1665
Annual precipitation [mm]10891050
Annual mean temperature [°C]5.43.5
Parent materialRhyoliteParagneiss
Soil type (WRB *)Haplic PodzolHaplic Podzol
Total liming amount [Mg ha−1] (year of treatment)4 (2011)14 (1988, 1994, 2001, 2011)-
* World Reference Base for Soil Resources 2014, World Soil Resources Reports 106, FAO, Rome, Italy.
Table 2. Total contents (a.), CaCl2-extractable contents (b.), and microbial biomass contents (c.) in organic layer (O) and mineral A-horizon (A) at the study plots Alt (Altenberg, low-liming), Alt_L (Altenberg, high liming), and Dav (Davos). DL—detection limit. All values presented are mean values of the five sample repetitions.
SiteAltenbergDavos
AbbreviationAltAlt_LDav
a
Total element contents [mg g−1]:
TC (O/A) 384.8/73.3394.7/71.0472.2/137.0
TN (O/A)16.0/2.817.0/3.014.7/4.9
TS (O/A)2.03/0.332.14/0.341.81/0.55
b
CaCl2-extractable element contents [µg g−1]:
DC (O/A)704.6/124.1462.2/70.9424.7/314.6
DN (O/A)78.9/12.643.2/11.3100.6/35.2
DNH4N (O/A)57.7/6.449.3/7.673.1/22.4
DNO3 (O/A)<DL<DL<DL
DS (O/A)17.2/2.723.4/2.68.6/5.4
DSO4S (O/A)15.8/4.123.7/4.110.4/6.7
c
Element contents in microbial biomass [µg g−1]:
MBC (O/A)2774.5/282.54113.0/400.23087.6/812.2
MBN (O/A)177.2/9.8299.3/20.0172.4/54.8
MBS (O/A)21.2/1.131.2/2.723.0/2.6
Table 3. Element ratios in a. soil, b. CaCl2 extracts, c. microbial biomass, and d. as a share of element contents in microbial biomass to total soil contents in organic layer (O) and mineral A-horizon (A) at the study plots Alt (Altenberg, low liming), Alt_L (Altenberg, high- liming), and Dav (Davos). All ratios presented are mean values of the ratios in the five sample repetitions.
SiteAltenbergDavos
AbbreviationAltAlt_LDav
a
Total element contents [mg mg−1]:
TC/TN (O/A)24/2623/2432/29
TC/TS (O/A)191/225188/207263/251
TN/TS (O/A)7.9/8.78.1/8.88.2/8.9
b
CaCl2-extractable element contents [µg µg−1]:
DC/DN (O/A)8.8/9.810.7/6.34.9/9.2
DC/DS (O/A)40/4420/2860/60
DN/DS (O/A)4.9/5.31.9/4.513.1/7.9
DNH4N/DN (O/A)0.7/0.51.2/0.70.7/0.6
DSO4S/DS (O/A)1.0/1.61.0/1.71.4/1.5
c
Element contents in microbial biomass [µg µg−1]:
MBC/MBN (O/A) 16/3314/2019/17
MBC/MBS (O/A)131/426144/214139/191
MBN/MBS (O/A)8/1310/118/16
d
Element contents in microbial biomass [%]:
MBC/TC (O/A)0.7/0.41.0/0.60.7/0.6
MBN/TN (O/A)1.1/0.31.8/0.71.2/1.1
MBS/TS (O/A)1.0/0.41.6/0.71.3/1.0
Disclaimer/Publisher’s Note: The statements, opinions and data contained in all publications are solely those of the individual author(s) and contributor(s) and not of MDPI and/or the editor(s). MDPI and/or the editor(s) disclaim responsibility for any injury to people or property resulting from any ideas, methods, instructions or products referred to in the content.

