Article

Possible Integration of Soil Information into Land Degradation Analysis for the United Nations (UN) Land Degradation Neutrality (LDN) Concept: A Case Study of the Contiguous United States of America (USA)

1
Department of Forestry and Environmental Conservation, Clemson University, Clemson, SC 29634, USA
2
Arkansas Forest Resources Center, University of Arkansas Division of Agriculture, University of Arkansas System, Monticello, AR 71656, USA
3
College of Forestry, Agriculture, and Natural Resources, University of Arkansas at Monticello, Monticello, AR 71656, USA
4
Department of Biological Science and Biotechnology, Minnan Normal University, Zhangzhou 363000, China
5
University Key Laboratory for Geomatics Technology and Optimized Resources Utilization in Fujian, Fuzhou 350002, China
6
Department of Environmental Engineering and Earth Sciences, Clemson University, Anderson, SC 29625, USA
7
School of Law, Emory University, Atlanta, GA 30322, USA
*
Author to whom correspondence should be addressed.
Soil Syst. 2024, 8(1), 27; https://doi.org/10.3390/soilsystems8010027
Submission received: 4 December 2023 / Revised: 22 January 2024 / Accepted: 25 January 2024 / Published: 27 February 2024
(This article belongs to the Special Issue Land Use and Management on Soil Properties and Processes)

Abstract

:
Soil makes important contributions to the United Nations (UN) Land Degradation Neutrality (LDN) concept and targets; however, currently, soil is not integrated into measurable information (e.g., indicators, metrics) to monitor land degradation (LD) patterns and trends. This study examines the role of soil in LDN in the UN Convention to Combat Desertification (UNCCD), and UN Sustainable Development Goal (SDG 15: Life on Land). This study is specifically focused on the LDN and biodiversity loss as they relate to an indicator 15.3.1 Proportion of land that is degraded over total land area. Tracking of LD status can be improved by using detailed soils databases combined with satellite-derived land cover maps. This study has applied these newly improved methods to quantify and map the anthropogenic LD status and trends in the contiguous United States of America (USA), as well as to identify potential land areas for nature-based solutions (NBS) to compensate for LD. Anthropogenic LD in 2016 in the contiguous USA affected over two million square kilometers, about one-third of the country’s total area, with high variability by state. Between 2001 and 2016, LD in the USA showed an overall increase of 1.5%, with some states exhibiting increases in degraded land while other states had overall improvements to their land. All ten soil orders present in the contiguous USA have been anthropogenically degraded, with Mollisols, Alfisols, and Vertisols having the highest LD levels. Compensating for LD requires a variety of strategies and measures (e.g., NBS), which often require additional land. In 2016, the potential land area for NBS was over two million square kilometers, an area approximately equal to that of degraded land. Some of the states that have high proportions of land available for potential NBS are dominated by soils (Aridisols) typical of deserts and therefore may have less promise for NBS. The variability of LD needs to be evaluated at finer spatial scales for realistic LDN analysis.

1. Introduction

Land degradation (LD) is identified as a worldwide problem, which is included in the UN Convention to Combat Desertification (UNCCD) [1] and the UN Sustainable Development Goal (SDG 15: Life on Land) (Table 1) [2]. Land degradation is defined as the “reduction or loss, in arid, semi-arid and dry sub-humid areas, of the biological or economic productivity and complexity of rainfed cropland, irrigated cropland, or range, pasture, forest and woodlands resulting from land uses or from a process or combination of processes, including processes arising from human activities and habitation patterns, such as: soil erosion caused by wind and/or water; deterioration of the physical, chemical and biological or economic properties of soil; and long-term loss of natural vegetation” [1]. Both UNCCD and UN SDGs refer to LD, land degradation neutrality (LDN), and soil in their goals, targets, and indicators (e.g., Table 1) and provide “good practice guidance” through SDG indicator 15.3.1 (Table 1) and three sub-indicators: (1) trends in land cover, (2) trends in land productivity, and 3) trends in the above and below ground soil organic carbon (SOC) stocks [3,4]. The indicator is determined by evaluating the sub-indicators using a one-out-all-out (1OAO) method, in which the indicator is reported as “degraded” if any of the sub-indicators exhibit a negative change [4]. Land degradation neutrality is defined as “a state whereby the amount and quality of land resources, necessary to support ecosystem functions and services and enhance food security, remains stable or increases within specified temporal and spatial scales and ecosystems” (https://www.unccd.int/official-documentscop-12-ankara-2015/3cop12 (accessed on 24 October 2023)) [5]. Remote sensing is commonly used to evaluate this indicator without considering detailed information about soil resources, which is a serious limitation in LD and LDN analyses [6,7,8]. The lack of detailed explanation about soil resources in the LD and LDN analyses may be explained by the assumption that soil is already part of the land. Indeed, soil is a component of land, but LD and LDN indicators can be disaggregated by soil types to provide a more detailed insight into the causes and patterns of LD. The current study demonstrates a geospatial method of integrating soil data and land use/land cover, and their change over time (Figure 1) to monitor LD at the country scale. By tracking LD over time, it could be possible to understand LD trends and hotspots globally. Using standardized land cover and soil databases would allow the comparison of LD and LDN status within and between countries. Specifically, this study examines the role of soils in the UN SDG 15, Target 15.3.1, and one of the three sub-indicators “trends in land cover” using the contiguous USA as a case study. It explores various ways this indicator and sub-indicator can be enhanced to improve the analysis of LD and LDN.
Although intricately linked together, soil degradation (SD) and LD have distinct definitions which can be best illustrated by using definitions of SD and LD by the Food and Agriculture Organization (FAO) of the UN. According to FAO, soil degradation is defined as “a change in the soil health status resulting in a diminished capacity of the ecosystem to provide goods and services for its beneficiaries” [10]. Further, the FAO states that “land degradation has a wider scope than both soil erosion and soil degradation in that it covers all negative changes in the capacity of the ecosystem to provide goods and services (including biological and water-related goods and services, and land-related social and economic goods and services)” [10].
Mikhailova et al. (2023) [11] proposed to link SD and LD by quantifying damages to soil health at the landscape level using geospatial analysis of land cover combined with corresponding soil types in the state of Illinois (USA). In that analysis, land cover classes (LULC), which are associated with low disturbance (e.g., woody wetlands, shrub/scrub, deciduous forest, etc.) have higher soil health status compared to disturbed LULC (e.g., cultivated crops, developments of various intensity, barren land, etc.) which are associated with lower health status. Traditionally, SD has been classified by the causes of soil degradation (e.g., physical, chemical, and biological); however, those causes are difficult to assess over large spatial extents. Because SD is closely related to soil health status, degradation status can be inferred by the level of disturbance based on LULC cover types. Using this assumption, the present study differentiates three types of degradation (barren land, agriculture, and developments) that can be applied to SD and LD. It should be noted that soil health status and propensity to “natural” and/or “anthropogenic” degradations are often linked to soil types, which have different inherent soil properties impacting the initial soil health status and propensity to degradation [11,12]. These soil properties make the soils more prone to “natural” and/or “anthropogenic” degradation. In the USA, there are large areas dominated by naturally low fertility soils, which may translate into inherently low soil health status (Table S1). These include slightly weathered soils (e.g., Entisols, Inceptisols) with a low degree of soil development which often but not always are low fertility soils (Figure 2) [12]. Also, highly weathered soils (e.g., Ultisols, Spodosols) are intensively leached (Figure 2). Aridisols, which are commonly found in desert environments also inherently tend to have low soil health status (Figure 2) [12]. In contrast, Mollisols and Alfisols (intermediately weathered soils) typically have high soil health and fertility status, but this makes them more vulnerable to anthropogenic degradation (e.g., agriculture) (Figure 2) [12].
Soil types and LULC classes are often connected because of the inherent soil properties and climate, which determine what types of vegetation and land use are suitable. Anthropogenic degradation has occurred within these soil/land opportunities and limitations throughout US land use history [15]. This degradation has often been accompanied by greenhouse gas (GHG) emissions [16] and even human displacement (e.g., the “Dust Bowl” in several US states) [17]. Over history, the trials and tribulations of soil/land use and misuse have created an anthropogenic landscape with little remaining “natural” landscape [18]. What appears to be the “natural” landscape is often agriculturally degraded soil, which has been abandoned or reforested because this soil could no longer sustain agricultural land uses. This land use history has created a landscape with limited opportunities and a need to balance use and conservation, which can limit dramatic changes in the landscape in the future [16,17]. The exception to this “status quo” is the continuous urbanization that is described by various developed LULC classes (e.g., developed, high intensity, etc.) [19].
Historical past and current reality in LD create a need for new soil governance to achieve LDN within UNCCD and UN SDGs worldwide [20]. According to Giuliani et al. (2020) [6], LD is mostly “context-specific” (set in a unique setting) and requires multiple assessment indicators. Despite being “context-specific”, local LD consequences can be of worldwide significance (e.g., GHG emissions) [21,22]. Remote sensing data and analysis play an important role in data gathering on the extent, types, and degree of severity of LD [23]. Some LD research uses satellite-based change analysis techniques; however, the present study refines this technique by adding detailed soil databases that serve to inform the LD and LDN status and potential for NBS. The present study hypothesizes that disaggregating LD, LDN, and NBS analysis by administrative areas, soil spatial databases, and widely available land cover data from satellite remote sensing will provide improved context and more actionable data to support sustainability targets.
This study’s objectives were to: (1) analyze the current UN SDG 15 Indicator 15.3.1 with an example application for the contiguous US, (2) explore potential future opportunities to enhance and expand the current LD Indicator 15.3.1 in SDG 15: Life on Land; and (3) provide practical examples of how to use geospatial analysis to track LD using the contiguous United States of America (USA) as a case study. The present study’s innovation is leveraging soil spatial data sources (Soil Survey Geographic Database (SSURGO) [13] and State Soil Geographic (STATSGO) [24]) to provide insight into the current status of anthropogenic LD that can be determined using satellite remote sensing land use/land cover (LULC) data sets (Multi-Resolution Land Characteristics Consortium (MRLC)) [25] and the potential for NBS to obtain LDN. The satellite-based LULC data also allows the quantification of land cover over time to understand spatial aspects of anthropogenic LD trends within the US. In this study, we used LULC data from 2001 and 2016 to examine this LD over time and space.

2. Materials and Methods

This study used an accounting framework (Table S2 [26]) to examine SDG 15. Life on Land, Target 15.3, and Indicator 15.3.1. Table 2 details the process of developing additional geospatially enabled indicators for the target. The development of geospatially enabled indicators has been described in “The SDGs Geospatial Roadmap” [27]. Most of the newly proposed possible additional indicators in Table 2 use self-evident metrics (e.g., %, area). Table 2 provides a sequence of analysis steps and outline for the results section: (1) the existing indicator was evaluated using the contiguous US as a case study, (2) each newly proposed indicator was defined and evaluated using an example application for the contiguous US.
Land use/land cover (LULC) classified layers from the Multi-Resolution Land Characteristics Consortium (MRLC) [25] were used to calculate LD status and change between 2001 and 2016 for the contiguous US. Soil data from the Soil Survey Geographic (SSURGO) Database (1:12,000 scale) [13] was combined with the land cover data by first converting the land cover data to vector format and then unioning it with the SSURGO data (also obtained in vector format) using ArcGIS Pro 2.6 [28]. The linked land cover and soil databases allow the determination of LD status, as well as changes in LD and LDN over time.
Table 2. New indicator conceptualization with examples of enhancing and adding land/soil indicators to the United Nations’ (UN) Sustainable Development Goal (SDG) 15 and Target 15.3 (adapted from Hák et al. (2016) [29].
Type of FrameworkItem
Policy Framework (Goal and Targets)Goal 15. Protect, restore and promote sustainable use of terrestrial ecosystems, sustainably manage forests, combat desertification, and halt and reverse land degradation and halt biodiversity loss.
Target 15.3 By 2030, combat desertification, restore degraded land and soil, including land affected by desertification, drought and floods, and strive to achieve a land degradation neutral world.
Conceptual Framework (Subtargets):
Indicators Framework (Indicators)
Current Indicator 15.3.1 Proportion of land that is degraded over total land area.
Newly proposed potential additional geospatially enabled indicators:
1. Proportion of land that is degraded over the total land area by administrative unit and trends over time (Metric: %; Scale: local, regional, national, global; Measurement frequency: annual). 2. Degraded land area by administrative unit and trends over time (Metric: area; Scale: local, regional, national, global; Measurement frequency: annual). 3. Degraded land by soil type and loss of pedodiversity (soil diversity) within the administrative unit and trends over time (Metric: number and types of soils lost, %, area; Scale: local, regional, national, global; Measurement frequency: annual). 4. Potential land for nature-based solutions (NBS) to achieve land degradation neutrality (LDN) and trends over time (Metric: number and type of soils, %, area; Scale: local, regional, national, global; Measurement frequency: annual). Important note: These indicators can be represented spatially to identify patterns and hotspots.

3. Results

3.1. SDG 15: Life on Land–Protect, Restore, and Promote Sustainable Use of Terrestrial Ecosystems, Sustainably Manage Forests, Combat Desertification, Halt and Reverse Land Degradation and Biodiversity Loss (15.3 By 2030, Combat Desertification, Restore Degraded Land and Soil, including Land Affected by Desertification, Drought and Floods, and Strive to Achieve a Land Degradation Neutral World)

Current indicator: 15.3.1 Proportion of land that is degraded over total land area. This indicator can be calculated by using satellite-based remote sensing to understand current land cover types, which can be linked to LD. This study determined the proportion of anthropogenically degraded land in the contiguous USA by assuming that degraded lands are represented by the land classes (LULC) for agriculture (hay/pasture, and cultivated crops), development (developed, open space; developed, low intensity; developed, medium intensity; developed, high intensity) and barren lands (Figure 3 and Figure S1). The overall aggregated proportion of anthropogenically degraded land in the contiguous USA was 33.5% in 2016 (Table 3). However, this overall value is aggregated over the large spatial extent of 48 states and provides little insight into more localized LD variability, which is evident in the land cover map (Figure 3, Table 3). This assumes that soils that are, for example, regularly cultivated, have degraded soil health over time (Table 3). Table 3 illustrates that there is a wide range of LD proportion among states, for example, Kansas has a LD proportion of 52.2%, while Alabama has 11.7% LD based on land cover. This variation shows that countries covering large spatial extents should be evaluated using smaller administrative units (e.g., states, etc.) to understand the spatial variability of LD. Also, this analysis does not provide information on the pedodiveristy (soil diversity) loss, which is a component of biodiversity loss. Achieving LDN as part of SDG 15 requires knowledge of the proportion of potential land area for NBS (34.6%, barren land, shrub/scrub, and herbaceous) that is separate from the land cover classes linked to LD and also from land cover classes assumed to be non-degraded (e.g., forest, woody wetlands, etc.). Similarly to the aggregated value for LD proportion, the aggregated value of potential land for NBS does not capture the variability by state and soil type. Potential land for NBS varies from 0.5% for Illinois to 87.6% for Nevada, with 14 states having more than the 34.6% country-scale potential land area for NBS and 34 states below this value. Even if there is potential land area for NBS, that does not necessarily mean that it is available because of land ownership or that these lands have soil resources sufficient to support NBS that could be used to compensate for LD. Both the proportions of degraded land and potential land area for NBS are not the only considerations for achieving LDN. For example, climatic factors in low-precipitation areas (e.g., Southwestern USA) could make some of these areas unusable for NBS.

3.2. Newly Proposed Potential Additional Geospatially Enabled Indicators and Example Applications Using the Contiguous United States of America (USA)

3.2.1. Proportion of Land That Is Degraded over Total Land Area for Each State within the United States of America (USA) and Trends over Time

Newly proposed potential additional geospatially enabled indicators: 1. Baseline proportion of land that is degraded over the total land area for each state within the United States of America (USA) (Metric: %; Scale: local, regional, national, global; Measurement frequency: annual). 2. Change in the proportion of land that is degraded over the total land area for each state within the United States of America (USA) over time (Metric: %; Scale: local, regional, national, global; Measurement frequency: annual). 3. Baseline proportion of land that is degraded over the total land area for each state separated by land cover class within the United States of America (USA) (Metric: %; Scale: local, regional, national, global; Measurement frequency: annual). 4. Change in the proportion of land that is degraded over the total land area for each state separated by land cover class within the United States of America (USA) over time (Metric: %; Scale: local, regional, national, global; Measurement frequency: annual). Important note: These indicators can be represented spatially to identify patterns and hotspots.
Justification and example application: The overall aggregated proportion of anthropogenically degraded land in the contiguous USA masks the high variability in LD among the 48 states (Figure 4 and Figure 5). The proportion of anthropogenically degraded land ranges from a low of 3.8% for the state of New Mexico to a high of 88.6% for the state of Iowa, with 25 states being below and 23 states being above the country-wide aggregated value of 33.5% of degraded land (Figure 4). This shows that countries that cover large spatial extents should be evaluated using smaller administrative units (e.g., states, etc.) to understand the spatial variability of LD. Land degradation is a dynamic process, and its changes also can be depicted spatially. For example, Figure 5 shows spatio-temporal changes in the proportion of LD from 2001 to 2016, with western states experiencing the largest increases in LD. Land degradation can be broken down by types (e.g., developments, barren land, etc.) within the soil health continuum (Table 3 and Table 4) [11]. Although simple to calculate and display, the proportion of degraded lands per state does not allow LDN determination for the whole country composed of multiple states, which is a limitation of using LD proportion as an indicator. The use of the proportion of LD per state can be used to track trends in LDN by analyzing changes between different time periods (Figure 5). Furthermore, data for states can be disaggregated into more detailed representations (e.g., counties or even individual property) that could be used to attribute LD to entities or people who are responsible for ongoing LD. Another limitation of using the proportion of LD is that it is not linked to soil types that have inherent vulnerabilities to LD.

3.2.2. Degraded Land Area for Each State within the United States of America (USA) and Trends over Time

Newly proposed potential additional geospatially enabled indicators: 1. Baseline of degraded land area for each state within the United States of America (USA) (Metric: km2; Scale: local, regional, national, global; Measurement frequency: annual). 2. Change in degraded land area for each state within the United States of America (USA) over time (Metric: km2; Scale: local, regional, national, global; Measurement frequency: annual). Important note: These indicators can be represented spatially to identify patterns and hotspots.
Justification and example application: The overall aggregated area of anthropogenically degraded land in the contiguous USA masks the high variability in LD among the 48 states (Figure 6). The area of anthropogenically degraded land in 2016 ranged from a low of about 900 km2 for the state of Rhode Island to a high of over 160,800 km2 for the state of Texas (Figure 6). This range reveals that countries covering large spatial extents should be evaluated using smaller administrative units (e.g., states, etc.) to understand the spatial variability of LD. Land degradation is a dynamic process and its changes can be also depicted spatially. For example, Figure 7 shows spatio-temporal changes in LD areas from 2001 to 2016, with many of the mid-central states such as Texas and Wyoming experiencing the largest increases in anthropogenic LD. Overall, the contiguous USA was not LDN, with a nearly 30,000 km2 increase in area of anthropogenically degraded land from 2001 to 2016. However, there was high variability in LDN among states, with an increase in degraded lands in many Plains States and Texas, indicating that these states are not LDN (Figure 7). Other states exhibited negative LD trends between 2001 and 2016 (e.g., −438.3 km2 for the state of Missouri); the negative change in degraded areas from 2001 to 2016 indicates overall land improvement. Land degradation areas can be broken down by types of LD (e.g., developments, barren land, etc.) within the soil health continuum [30], which provides more detail on the types of degradation (Table 5 and Table 6) [11]. Barren and urbanized lands are the lower end of the soil health status (Table 5 and Table 6). Displaying types of LD by administrative units (e.g., states, etc.) demonstrates the inequities in LD among administrative units and its dynamics (Table 5 and Table 6). These inequities can often be explained by the soil resources within each administrative unit, which are linked to specific land uses that are subject to continuous LD (e.g., the state of Kansas has Mollisols and Alfisols under large existing and increasing cropped areas over time). It should be noted that LD is a continuous dynamic process, with the remote sensing analysis capturing a snapshot of land cover at any one time. The land cover analysis does not capture the historical series of LD events that occurred before the advent of remote sensing.

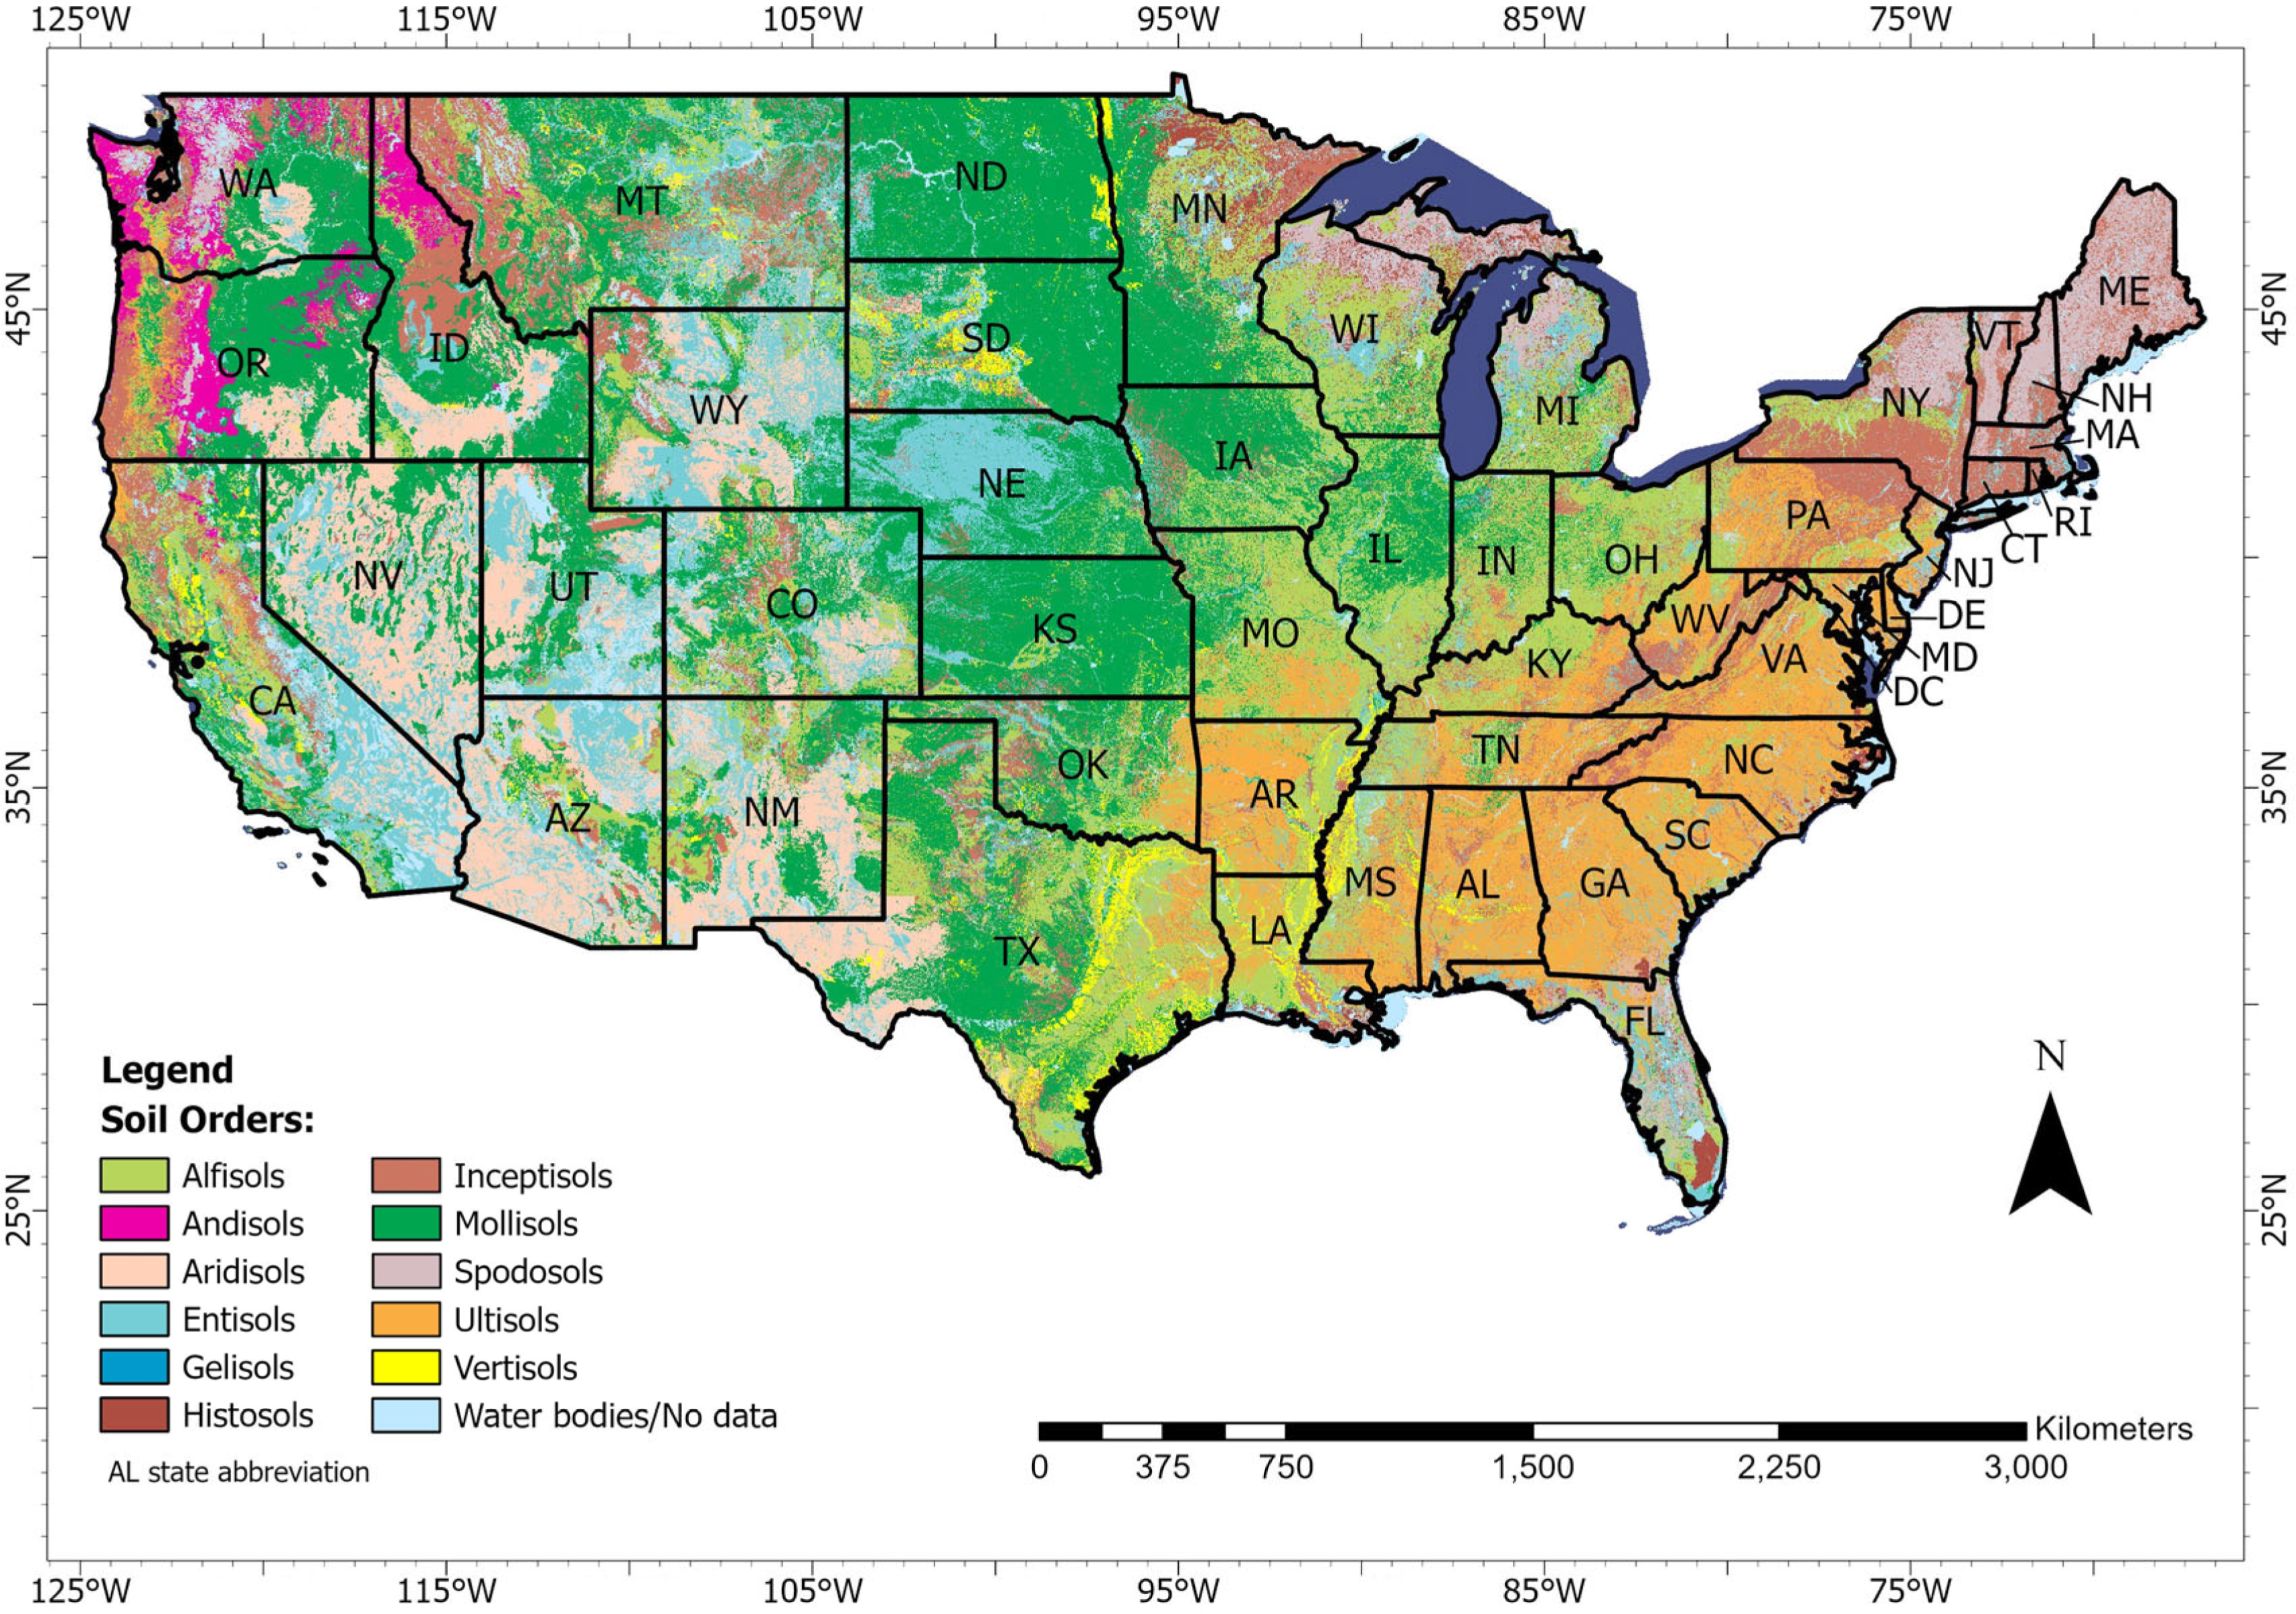
3.2.3. Degraded Land by Soil Type and Loss of Pedodiversity (Soil Diversity) within the United States of America (USA) and Trends over Time

Newly proposed potential additional geospatially enabled indicators: Degraded land by soil type and loss of pedodiversity (soil diversity) within the United States of America (USA) and trends over time (Metric: number and types of soils lost, %, area; Scale: local, regional, national, global; Measurement frequency: annual). Important note: These indicators can be represented spatially to identify patterns and hotspots.
Justification and example application: Analysis of LD by soil type provides additional details about soil consumption patterns. For example, Table 7 reveals that agriculture is responsible for large areas of degraded land for several soil orders, principally Mollisols and Alfisols; the proportion of LD due to agriculture is 90% (i.e., 736,000 out of 813,000 km2) for Mollisols and 84% (i.e., 418,000 out of 499,000 km2) for Alfisols. Approximately 53% of all cultivated crops are on Mollisols, with an additional 21.3% on Alfisols (Table S3). All ten soil orders in the contiguous US were subject to LD from development (Table 7). Looking at the change in LULC between 2001 and 2016, by soil order (Table S4), there was an overall increase in cultivated crops (4%), with similar increases for cultivated crops on both Alfisols and Mollisols. This is in contrast to the reduction of hay/pasture LULC, which is likely to cause less LD compared to the cultivated crops category. The reduction of the amount of land in both deciduous and evergreen forest LULC of approximately 3% shows increased LD in a range of different soil orders (Table S4).

3.2.4. Potential Land for Nature-Based Solutions (NBS) to Achieve Land Degradation Neutrality (LDN) and Trends over Time

Newly proposed potential additional geospatially enabled indicators: 1. Baseline of potential land for nature-based solutions (NBS) to achieve land degradation neutrality (LDN) for each state within the United States of America (USA) (Metric: km2, %; Scale: local, regional, national, global; Measurement frequency: annual). 2. Change in potential land for nature-based solutions (NBS) to achieve land degradation neutrality (LDN) for each state within the United States of America (USA) over time (Metric: km2, %; Scale: local, regional, national, global; Measurement frequency: annual). Important note: These indicators can be represented by soil type and spatially to identify patterns and hotspots.
Justification and example application: The concept of LDN is presented as a potential solution to LD, but it requires an assessment of potential land for NBS and its trends over time. Nature-based solutions can be defined as land rehabilitation and restoration methods that are sustainable and based on natural cycles and processes [31]. The geospatial techniques used in this study could be used to help locate states and regions with higher NBS potential where land rehabilitation could help reach LDN at the country level. In this study potential land for NBS is limited to barren land, shrub/scrub, and herbaceous land cover classes (Figure S2), to provide potential land areas without impacting current land uses. The overall aggregated potential land area for NBS in the contiguous USA (2,119,000 km2 or just under 35% of the total country area) masks the high variability in potential land area for NBS among the 48 states (Figure 8). The potential land area for NBS ranges from as low as 42 km2 (1% of the area for Delaware) to as high as 315,800 km2 (57% of the area for Texas) (Figure 8 and Figure S3). Such differences show that countries covering large spatial extents should be evaluated using smaller administrative units (e.g., states, etc.) to understand the spatial variability of potential areas for NBS. The potential area for NBS is dynamic and its changes can be also depicted spatially. For example, Figure 9 shows spatio-temporal changes from 2001 to 2016 in land area for potential NBS; western states experienced the largest increases in potential land for NBS whereas mid-central states (e.g., Texas, Wyoming) had the largest decreases in potential land for NBS (Figure S4). Potential areas for NBS can be broken down by types (barren land, shrub/scrub, and herbaceous land cover classes) and within the soil types (Table 5, Table 6 and Table 7). It should be noted that not all potential NBS land is actually available or suitable for NBS. The availability of potential NBS land can be complicated by high private land ownership in the contiguous United States of America (USA), because private landowners play an important role in land management (Figure 10). The suitability of potential NBS land is often determined by the soil types and climate within each state (Table 3). For example, the states of Nevada (87.6%), Arizona (82.2%), and New Mexico (85.3%) have high proportions of potential NBS lands, but these states are dominated by soil types with inherently low NBS potential (e.g., Aridisols, Entisols, Inceptisols). A combination of soil types with inherently low NBS potential and dry climate makes soil and land-based NBS solutions highly problematic. Combining soil order information with LULC data can identify areas where application of NBS could potentially decrease LD in areas containing productive soil types (e.g., Mollisols, Alfisols) and under barren land, shrub/scrub, or herbaceous land cover classes. Inherently fertile soils have more nutrients and other properties to support NBS compared to inherently infertile soils.
Also, it is important to note that most soils in the USA have likely been subjected to numerous LD cycles through historical land use events [32]. The remaining alternative scenarios for NBS would likely require the conversion of productive agricultural land into other land uses that would serve to improve soil health and offset a portion of the ongoing impact of LD caused by production agriculture. In this case, there would likely be significant economic sacrifices because of taking land out of agricultural production (e.g., conversion to forest, prairie, etc.). Geospatial methods can use historical remote sensing imagery to gauge LULC over the last approximately 50 years and could be used to identify agricultural lands that have remained in cultivation and likely have higher LD, and areas where land has been moved to non-cultivated land use (e.g., reforested, pasture) where LD status has been improved. This could compound agricultural challenges caused by ongoing climate change impacts, which will likely increase crop failure in many regions of the US [33].
Figure 10. Private land ownership in the contiguous United States of America (USA) (based on data from the US Bureau of the Census, 1991 [34]).
Soilsystems 08 00027 g010

3.2.5. The Question of Inherently Degraded Soils in the Land Degradation (LD) Analysis

The concept of LD focuses on land and land use, but the role of inherent soil degradation status is often overlooked. Land degradation can be monitored through analysis of land cover change over time; however, some soil types can be considered inherently degraded, which is overlooked in the traditional LD analysis that focuses on land use and land use change. This point is illustrated in Table 8, which shows the impact of adjusting for inherently degraded soils (e.g., Aridisols) in LD analysis. Combining the anthropogenically degraded lands with areas covered by “non-degraded” land covers of Aridisols results in an increase in US degraded land from 33.5% to 41.3%.
For sixteen states, considering all Aridisols as degraded land can dramatically impact the amount and proportion of LD. This is particularly true for states in the southwest US, where, for example, the overall amount of degraded land increased for Arizona from 8.4% to 53.3% (Table 8). The 100th meridian (“arid–humid divide”) in the US has long been recognized as a dividing line where the west of the meridian is more arid with less land productivity and lower human population compared to the eastern part with higher population density [35]. This shows that in some areas, it is important to consider the impact of inherently degraded soils because, in these areas dominated by them, there are fewer opportunities for anthropogenic LD due to limited potential to support agriculture. Also, the potential area available for NBS could be reduced in areas with these inherently degraded soils. Climate change may shift the “arid–humid divide” eastwards causing a decrease in potential land for NBS [36]. Other soil types could also be included in this category of inherently degraded soils, which can sometimes include Entisols, which could dramatically increase the LD proportion in various states. This offers unique opportunities to use soil expert knowledge to help identify soils with inherently high LD status and the ways to include them in the LD, NBS, and food security [37] analyses.
Areas of LD and NBS potential are important at the country scale because large states with large areas within the US have a higher impact than smaller states. For example, the LD status of Texas, with its large extent, can greatly impact the LD status of the US overall. Similarly, potential land available for NBS could be further refined by looking at the inherent soil characteristics of land potentially available for NBS to help prioritize areas and states where NBS are likely to be impactful because of the soil’s ability to support plant growth. Also, additional variables (e.g., climate, soil moisture status, erosion potential, etc.) could be included to help prioritize areas for NBS at a local scale.

4. Discussion

4.1. Significance of the Results for the United Nations (UN) Land Degradation Neutrality (LDN) Targets

4.1.1. Background and Legal Aspects of the Land Degradation Neutrality (LDN) Efforts

A single ambiguous sentence creates the entire worldwide movement for LDN. Adopted in 2015, SDG Target 15.3 provides: “By 2030, combat desertification, restore degraded land and soil, including land affected by desertification, drought and floods, and strive to achieve a land degradation-neutral world [3]”. A single additional sentence fragment, Target 15.3.1, offers an indicator to measure whether neutrality is being achieved: “Proportion of land that is degraded over total land area”.
This sentence and a half offers nothing more than an aspiration. It does not guide how countries should achieve the goal. It offers no enforcement mechanism. It provides no penalties for countries that fail to achieve the goal of LDN by 2030, and it creates no rewards for those that do. Similarly, it creates no framework for rewarding or penalizing corporations or other private actors for creating the loss and damage (L&D) from LD. And it creates no mechanism for compensating countries and individual actors who suffer the harms that result from LD. Moreover, the indicator is so vague as to create great difficulty in determining whether the goal of LDN has been achieved.
In sum, SDG 15.3 and Target 15.3.1 are neither law nor “soft law.” Both the SDGs and LDN targets listed in SDG 15.3 lack standards and methods to review soil changes over time that would be necessary for an implementable soil policy [20]. Instead, they represent an international consensus that it would be good to achieve LDN by 2030, although they indicate nothing about what precisely should be done [20].
Rather than imposing specific requirements, the UNNCD invited each individual country to establish its own system of voluntary targets for achieving LDN based on national priorities and circumstances [20]. Whether LDN is achieved is now up to individual countries to develop and apply strategies, policies and laws, to meet the target to achieve the SDGs with international bodies’ having no authority to compel progress [38]. To guide countries’ creation of their own targets, they were offered 19 “principles of implementation” [39]. However, the 19 principles are each vague and aspirational, providing countries with little specific guidance on what they should do [39].
Facing such a vague mandate, countries have done little since 2015 to achieve LDN. Although approximately 100 countries have created targets for LDN, only 19 have adopted specific legislation about LDN [40]. The US is not among them [40]. Without more urgent action across the globe, only 15% of the SDG targets are expected to be reached by the proposed deadline [41], so while the SDGs provide a consensus, they may not have the necessary detail and structure for implementation [42].
The reason for the lack of progress is clear. There is less political and financial cost for a country to join a vague international statement about the harms of LD compared to the substantial benefits of joining. Supporting such a statement makes the country appear to help the environment with minimum costs or commitments. However, achieving LDN would be costly. It would mean reducing development and other land disturbances. It would mean devoting substantial resources to restoring degraded land. Predictably, the countries dawdle and disappear when they are asked to step up and incur these costs.
Despite ambitious words from world leaders, the prospect for future progress on LDN is small. The 2030 deadline will probably pass unmet with little notice. The public cares less about soil health than they do about other environmental issues such as climate change. And little progress has been made on climate change. Achieving LDN would probably require substantial cost and disruption. If countries are unwilling to incur the costs of combatting climate change, then the probability of the countries’ being willing to spend substantial amounts to reduce LD is small. At this point, it is unclear if land and soil-related LDN goals will gain sufficient political traction to develop additional policies and laws to improve implementation given that there has been more action related to climate change, biodiversity, and marine or air pollution [43].

4.1.2. Characteristics of Effective Land Degradation Neutrality (LDN) Legislation

The next step for achieving LND would be for countries to accept the invitation to adopt specific laws. The following section discusses which laws would be most effective. The focus of protecting and restoring land should be on land with the greatest potential fertility. Degradation of barren lands creates little harm; the land is already in a natural state of degradation. In contrast, more resources should be invested in protecting and restoring Mollisols and Alfisols, especially in moist areas with udic soil moisture regimes. This study offers an approach for precisely identifying local soil types that will aid in targeting resources efficiently: the resources will be devoted to the areas that will produce the greatest improvements in soil fertility.
Likewise, in calculating progress toward LDN, the protection and restoration of high-fertility soils should be weighted more heavily than the protection and restoration of low-fertility soils. For example, if a square mile of low-fertility soil has been degraded, this could be balanced in the neutrality calculation by the restoration of a much smaller area of soil of high fertility. Again, this balancing will be helped by our approach to identifying local soil types.
Any programs to protect soil or restore it should be constructed to avoid moral hazard. For example, the government should not pay for the restoration of the land of owners whose land-use choices have caused the land to degrade. Such government payments would eliminate the incentives of the owners to use better land-use practices: such payments would operate to insure the owners from L&D, allowing them no longer to internalize the costs of their choice to degrade their soil. If the owners benefit from degrading soil (for example, through higher crop yields in the short term) but don’t pay the costs, then they will inefficiently degrade their soil.
Instead, the government could impose variable fees or taxes on those who degrade soil. For example, the size of the fees could reflect that part of the loss and damage (L&D) from LD that is not suffered directly by the landowner. In that way, the penalty might be relatively small for farmers who use degrading practices on their farmland; the farmers suffer much of the costs of the land’s reduced fertility. In contrast, a developer who destroys a forest to build a warehouse would pay a large fee; the developer does not suffer any of the costs of the soil’s degradation. While the complexity of implementation of such fees would need to be structured to fit within existing legal frameworks, the proposed potential indicators provide examples of quantitative ways of evaluating LD that could be used to assign fees in proportion to LD.

4.1.3. Benefits and Limitations of the United Nations (UN) Land Degradation Neutrality (LDN) Targets and Current Indicators

Benefits: Land degradation (LD) is covered by the UN Convention to Combat Desertification (UNCCD) [1], which focuses primarily on arid and semi-arid lands and the UN Sustainable Development Goal (SDG 15: Life on Land) (Table 1) [2] which has a broader range of geographic applicability. Our study also examines LD in this broader range of geographic areas, with the focus being on the contiguous US, which contains a wide range of climates, including arid and semi-arid. Besides the geographic range, the current study also considers LD caused by the expansion of urbanization and agriculture. The ultimate goal of these worldwide coordination efforts to combat LD is to achieve LDN by 2030 [2]. Both UNCCD and UN SDG 15 provide guidance on determining LDN using an indicator (15.3.1 proportion of land that is degraded over total land area) and three sub-indicators: (1) trends in land cover, (2) trends in land productivity, and (3) trends in the above and below ground soil organic carbon (SOC) stocks [3,4]. The indicator is determined by evaluating the sub-indicators using a one-out-all-out (1OAO) method, in which the indicator is reported as “degraded” if any of the sub-indicators exhibit a negative change [4]. Our study focused on LULC and LULC change analysis for LD and LDN because of freely available data for straightforward geospatial analysis over time. This analysis revealed that all states in the contiguous USA experienced LD with most states being not LDN (Figure 6). It also provided insights into spatial patterns of LD and LDN within the country, which can be also used for comparison with other countries in the world.
Limitations: One of the main limitations is the lack of prioritization of LD analysis in terms of worldwide functional importance (e.g., food security, etc.). Another limitation of SDG 15 and its indicators/sub-indicators is that they are aggregated over large geographic areas (e.g., USA, EU, Canada, etc.) with many administrative units as large as whole countries. This aggregation hides inequities in LD and LDN distributions in a landscape, therefore preventing a detailed analysis of the causes of LD at finer administrative units and spatial scales. The term “degraded land” is too general and does not give an insight into the types of LD, which can be determined from geospatial analysis if LULC classes are standardized between countries for unified analysis and comparison. Geospatial analysis of LD, LDN, and NBS should be disaggregated, where relevant, by soil types, climate, and other characteristics, that are deemed appropriate by the scientists. Current efforts to monitor LD using satellite remote sensing often rely on generalized and likely inaccurate information from soil databases (e.g., SOC) [6], where detailed soil information could be utilized or developed that can provide much more accurate information about land productive capacity and where restoration efforts should be targeted. Limiting monitoring of LD to monitoring land cover change, land productivity, and SOC, can lead to erroneous conclusions about the changes in LD status [44], which could be improved by using geospatial information on soil types and properties. There have been few suggested refinements to indicators and suggested soil-related modifications have focused on soil degradation (e.g., erosion) and not on leveraging soil information [45]. Including inherent soil, climate, landscape, and other characteristics in LD analysis using LULC allows differentiation between “natural” and “anthropogenic” degradations. Anthropogenic LD (especially, agriculture) may be of a transnational nature and particularly dangerous in geographic areas with high-fertility soils, such as Mollisols and Alfisols, which are often located in the “bread-basket” regions of the world. These “vitally important” soils for food security may require special monitoring by world organizations (e.g., Food and Agriculture Organization (FAO), etc.). Land degradation neutrality targets may be impossible to achieve, and such circumstances should be more specifically analyzed to advance the LDN techniques and recommendations. This analysis should also include the feasibility of NBS considering potential land, its availability, and its characteristics (e.g., soil types, climate, etc.). Damages from LD extend beyond administrative units of individual countries because they can generate GHG emissions and loss of land for future C sequestration, which have worldwide implications [19]. Many damages from LD (especially of a transnational nature) can be quantified, for example, using the ecosystem services/disservices framework (e.g., social costs of CO2 emissions, SC-CO2, etc.) for use in the benefit/cost analysis of LDN and soil governance [20].

4.1.4. Refining the United Nations (UN) Land Degradation Neutrality (LDN) Targets and Indicators

To refine the UN LDN targets and indicators, LD should be evaluated in a quantifiable and unified way so that soils can be monitored for LD spatially over time using the proposed techniques relying on geospatial analysis and remote sensing. By unifying monitoring methods, a global view of LDN progress will be possible, and the identification of critical areas for global action may become evident. This geospatial data should be examined from as many different perspectives, considering both the historical past and future developments by experts from other disciplines (e.g., soil science, geology, ecology, law, human geography, climatology, etc.). This analysis should be conducted to prioritize areas that represent the most pressing challenges facing the world (e.g., climate change, food security, population growth, etc.). The currently proposed world initiative to protect 30% of the earth by 2030 to help limit climate change and preserve critical ecosystem services [46] where soil and land play an important role. Our study identifies some of the potential challenges related to the feasibility of this initiative such as inequitable distribution of LD in various geographic regions (e.g., more than 50% of US states have higher than 30% LD, Figure 4). Furthermore, research on soil and food security [47] could benefit from LD analysis which can be refined from the soil order level to the soil series level to provide a more detailed analysis at finer spatial scales. For example, the LD of highly fertile soils in humid climates with well-distributed rainfall (e.g., Mollisols and Alfisols, etc.) in the world has an impact on food security worldwide [37]. Climate change creates climate-change-related LD types (e.g., loss of land due to sea-level rise, salinization of soil from sea intrusions, loss of permafrost, potential loss of soil order of Gelisols, etc.), which can be measured with long-term projections into the future. These and other types of LD can be considered as a form of loss and damage (L&D) and could potentially be included in UNCCD and LD-related SDGs as compensation mechanisms and ways to incentivize sustainable development worldwide. Currently, in the US, most efforts to address anthropogenic LD are financed by the US taxpayers (e.g., Soil and Water Conservation Programs, etc.) and not by the entities or individuals who cause anthropogenic LD. Our study provides a geospatial methodology that could be applied at a finer spatial resolution to the parcel or tax lot scale to map and attribute L&D from LD to these entities or individuals. At these finer scales, more detailed soil series information could be used to better understand land capacity and LD at the field scale. These attributions could be linked to monetary damages which could be calculated in various ways as described by Mikhailova et al. (2023) [19]. It should be noted that L&D from LD and SD can be transnational and extend beyond the country’s boundaries [19]. For example, developments cause GHG emissions and loss of land for C sequestration. Mikhailova et al. (2023) [19] reported “historical” and “recent” losses in TSC, losses in land area for C sequestration, and a midpoint value of $969.2B in social costs of C (SC-CO2) from “historical” developments for the contiguous US from developments alone without taking into consideration other forms of LD and SD. Linking behavior that causes LD and SD with fees could help fund land restoration efforts and would also provide a negative incentive to activities that cause LD and SD.

5. Conclusions

This study examined the role that soil can play in SDG 15: Life on Land as it relates to LD, LDN, and NBS. The current LD indicator is focused on the proportion of degraded land over total land area, which does not provide sufficient detail to understand the patterns of LD. This study has demonstrated methods using geospatial techniques to track LD status using satellite-based remote sensing land cover data and spatial soil databases using a case study of the contiguous United States of America (USA). While land cover trends can be used to evaluate LD across large spatial extents, the commonly used land productivity and above and below-ground soil organic carbon (SOC) stocks are difficult to track over time and space. This study proposes potential additional geospatially enabled indicators to enhance the existing LD indicator that would allow for consistent analysis and tracking across country boundaries. Aggregating estimates for LD across large countries do not provide the spatial detail required to understand LD trends that are better understood using small administrative units. Applying these methods on finer spatial scales could be used to identify hotspots of LD, where specific government action could be focused to attain LDN. Even though many aspects of LD are dependent on soil properties and soil type, soil databases are not commonly used to identify critical areas to monitor anthropogenic LD. Separating areas with LD because of inherent soil properties, from LD associated with agriculturally productive soils is important to help understand LDN in terms of key ecosystem service productivity. In addition to UN monitoring of LD in desert and semi-arid areas, it should also monitor highly productive soils (e.g., Alfisols and Mollisols), which could be designated as world vitally important soils for world food security. Methods for assessing LD and LDN should be standardized so that datasets between countries and regions can be compared and assessed to determine a global picture of LD status. These methods should include determining anthropogenic LD as well as areas with inherently degraded soils to help understand the potential for NBS. These techniques could be applied globally and at finer spatial scales that would enable LD attribution. Future remote sensing techniques may allow for fine-scale monitoring of land cover change daily, accurate estimates of above-ground biomass (over time) and may even include methods to monitor CO2 release. When these technologies become widely available it will be possible to combine these with soil databases to accurately link human action with LD and LDN. Future research should include tracking climate-change-induced LD and SD. Future efforts should include mechanisms to assign responsibility for L&D, which could provide tools to monitor and incentivize the attainment of LDN. The prospects for substantial change may be small because SDG 15 is merely an aspirational goal. It does not impose requirements that would achieve LDN. Instead, it asks individual countries to create their own programs. So far, although many countries have been willing to applaud the goal of LDN, they have been unwilling to impose costs to achieve actual progress.

Supplementary Materials

The following supporting information can be downloaded at: https://www.mdpi.com/article/10.3390/soilsystems8010027/s1, Table S1. Soil diversity (pedodiversity) is represented by taxonomic diversity at the soil order level in the contiguous United States of America (USA); Table S2. An overview of the accounting framework used by this study for monitoring the United Nations (UN) land degradation neutrality (LDN) targets in the contiguous United States of America (USA) (adapted from Groshans et al., 2019 [26]); Table S3. Land use/land cover (LULC) classes by soil order for the contiguous United States of America (USA) in 2016; Table S4. Change in land use/land cover (LULC) classes by soil order for the contiguous United States of America (USA) between 2001 and 2016; Figure S1. High-resolution aerial photos showing examples of land classes (LULC) which were used to determine anthropogenically degraded land (LD) in the contiguous USA by assuming that degraded lands are represented by the land classes (LULC) for agriculture (hay/pasture, and cultivated crops), development (developed, open space; developed, low intensity; developed, medium intensity; developed, high intensity) and barren lands. Representative examples were located using a land cover map of the contiguous United States of America (USA) for 2016 (based on data from the Multi-Resolution Land Characteristics Consortium (MRLC) with detailed descriptions of the land classes [25]); Figure S2. High-resolution aerial photos showing examples of land classes (LULC) which were used to determine potential land for nature-based solutions (NBS) in the contiguous USA by assuming that these lands are represented by the land classes (LULC) for barren land, shrub/scrub, and herbaceous land cover classes. Representative examples were located using a land cover map of the contiguous United States of America (USA) for 2016 (based on data from the Multi-Resolution Land Characteristics Consortium (MRLC) with detailed descriptions of the land classes [25]); Figure S3. The status of potential land for nature-based solutions (NBS) is presented as the total potential NBS land area (km2) in each state in 2016 for the contiguous United States of America (USA) (data for the 48 contiguous states). Potential land for NBS is limited to barren land, shrub/scrub, and herbaceous land cover classes, to provide potential land areas without impacting current land uses; Figure S4. Change in the status of potential land for nature-based solutions (NBS) is presented as the change in the total potential NBS land area (km2) over time (2001–2016) in each state for the contiguous United States of America (USA) (data for the 48 contiguous states). Potential land for NBS is limited to barren land, shrub/scrub, and herbaceous land cover classes, to provide potential land areas without impacting current land uses.

Author Contributions

Conceptualization, E.A.M.; methodology, E.A.M., M.A.S. and H.A.Z.; formal analysis, E.A.M.; writing—original draft preparation, E.A.M.; writing—review and editing, E.A.M., C.J.P., G.B.S. and M.A.S.; visualization, H.A.Z., L.L. and Z.H. All authors have read and agreed to the published version of the manuscript.

Funding

This research received no external funding.

Institutional Review Board Statement

Not applicable.

Informed Consent Statement

Not applicable.

Data Availability Statement

Data contained in the article and Supplemental Materials.

Acknowledgments

We thank the reviewers for their constructive comments and suggestions.

Conflicts of Interest

The authors declare no conflict of interest.

Glossary

CCarbon
CO2Carbon dioxide
FAOFood and Agriculture Organization
GHGGreenhouse gases
L&D Loss and damage
LDLand degradation
LDNLand degradation neutrality
LULCLand use/land cover
MRLCMulti-Resolution Land Characteristics Consortium
NBSNature-based solutions
NLCD National Land Cover Database
NOAANational Oceanic and Atmospheric Administration
NRCSNatural Resources Conservation Service
SC-CO2Social cost of carbon emissions
SDSoil degradation
SDGsSustainable Development Goals
SOCSoil organic carbon
SSURGOSoil Survey Geographic Database
STATSGOState Soil Geographic Database
SLMSustainable land management
UNUnited Nations
UNCCDUnited Nations Convention to Combat Desertification
USAUnited States of America

References

  1. United Nations Convention to Combat Desertification. Available online: https://www.unccd.int/convention/overview (accessed on 24 October 2023).
  2. United Nations (UN). Transforming Our World: The 2030 Agenda for Sustainable Development; The Resolution Adopted by the General Assembly on 25 September 2015; United Nations: New York, NY, USA, 2015; 35p. [Google Scholar]
  3. United Nations (UN) General Assembly. Global Indicator Framework for the Sustainable Development Goals and Targets of the 2030 Agenda for Sustainable Development; United Nations Statistics Division: New York, NY, USA, 2017; Available online: https://unstats.un.org/sdgs/indicators/indicators-list/ (accessed on 20 June 2023).
  4. Sims, N.C.; Newnham, G.J.; England, J.R.; Guerschman, J.; Cox, S.J.D.; Roxburgh, S.H.; Viscarra Rossel, R.A.; Fritz, S.; Wheeler, I. Good Practice Guidance. SDG Indicator 15.3.1, Proportion of Land That Is Degraded over Total Land Area; Version 2.0; United Nations Convention to Combat Desertification: Bonn, Germany, 2021; ISBN 978-92-95118-35-5. [Google Scholar]
  5. United Nations (UN) Convention to Combat Desertification. Decision 3/COP.12 (COP 12, Ankara, 2015). Integration of the Sustainable Development Goals and Target into the Implementation of the United Nations Convention to Combat Desertification and the Intergovernmental Working Group Report on Land Degradation Neutrality. Available online: https://www.unccd.int/official-documentscop-12-ankara-2015/3cop12 (accessed on 24 October 2023).
  6. Giuliani, G.; Mazzetti, P.; Santoro, M.; Nativi, S.; Van Bemmelen, J.; Colangeli, G.; Lehmann, A. Knowledge generation using satellite earth observations to support sustainable development goals (SDG): A use case on land degradation. Int. J. Appl. Earth Obs. Geoinf. 2020, 88, 102068. [Google Scholar] [CrossRef]
  7. Kust, G.; Andreeva, O.; Shklyaeva, D. Application of the concept of Land Degradation Neutrality for remote monitoring of agricultural sustainability of irrigated areas in Uzbekistan. Sensors 2023, 23, 6419. [Google Scholar] [CrossRef] [PubMed]
  8. Yuan, S.; Cheng, L.L.; Xu, J.; Lu, Q. Evaluation of land degradation neutrality in Inner Mongolia combined with ecosystem services. Land 2022, 11, 971. [Google Scholar] [CrossRef]
  9. United Nations (UN) General Assembly. Resolution 68/261. Fundamental Principles of Official Statistics. Resolution Adopted by the General Assembly on 29 January 2014. Available online: https://documents-dds-ny.un.org/doc/UNDOC/GEN/N13/455/11/PDF/N1345511.pdf?OpenElement (accessed on 26 July 2023).
  10. Food and Agriculture Organization (FAO) of the United Nations (UN). FAO Soils Portal. Available online: https://www.fao.org/soils-portal/soil-degradation-restoration/en/ (accessed on 24 October 2023).
  11. Mikhailova, E.A.; Zurqani, H.A.; Lin, L.; Hao, Z.; Post, C.J.; Schlautman, M.A.; Post, G.C.; Shepherd, G.B.; Dixon, R.M. Quantifying damages to soil health and emissions from land development in the state of Illinois (USA). Land 2023, 12, 1567. [Google Scholar] [CrossRef]
  12. Brady, N.C.; Weil, R.R. The Nature and Properties of Soils, 13th ed.; Pearson Education Inc.: Upper Saddle River, NJ, USA, 2002; pp. 86–87. [Google Scholar]
  13. Soil Survey Staff, Natural Resources Conservation Service, United States Department of Agriculture. n.d.a. Soil Survey Geographic (SSURGO) Database. Available online: https://nrcs.app.box.com/v/soils (accessed on 10 September 2023).
  14. The United States Census Bureau. TIGER/Line Boundary Shapefiles. 2018. Available online: https://www.census.gov/geographies/mapping-files/time-series/geo/tiger-line-file.2018.html (accessed on 10 September 2023).
  15. Baumhardt, R.L.; Stewart, B.A.; Sainju, U.M. 2015. North American soil degradation: Processes, practices, and mitigating strategies. Sustainability 2015, 7, 2936–2960. [Google Scholar] [CrossRef]
  16. Lal, R. Restoring soil quality to mitigate soil degradation. Sustainability 2015, 7, 5875–5895. [Google Scholar] [CrossRef]
  17. Lee, J.A.; Gill, T.E. Multiple causes of wind erosion in the Dust Bowl. Aeolian Res. 2015, 19, 15–36. [Google Scholar] [CrossRef]
  18. Nearing, M.A.; Xie, Y.; Liu, B.; Ye, Y. Natural and anthropogenic rates of soil erosion. Int. Soil Water Conserv. Res. 2017, 5, 77–84. [Google Scholar] [CrossRef]
  19. Mikhailova, E.A.; Zurqani, H.A.; Lin, L.; Hao, Z.; Post, C.J.; Schlautman, M.A.; Shepherd, G.B. Opportunities for monitoring soil and land development to support United Nations (UN) Sustainable Development Goals (SDGs): A Case study of the United States of America (USA). Land 2023, 12, 1853. [Google Scholar] [CrossRef]
  20. Hannam, I. Soil governance and land degradation neutrality. Soil Security 2022, 6, 100030. [Google Scholar] [CrossRef]
  21. Prăvălie, R. Exploring the multiple land degradation pathways across the planet. Earth-Sci. Rev. 2021, 220, 103689. [Google Scholar] [CrossRef]
  22. Roy, P.; Pal, S.C.; Chakrabortty, R.; Saha, A.; Chowdhuri, I. A systematic review on climate change and geo-environmental factors induced land degradation: Processes, policy-practice gap and its management strategies. Geol. J. 2023, 58, 3487–3514. [Google Scholar] [CrossRef]
  23. Petrosillo, I.; Valente, D.; Scavuzzo, C.M.; Selvan, T. Land degradation pattern and ecosystem services. Front. Environ. Sci. 2023, 11, 1137768. [Google Scholar] [CrossRef]
  24. Soil Survey Staff, Natural Resources Conservation Service, United States Department of Agriculture. U.S. General Soil Map (STATSGO2). Available online: https://sdmdataaccess.sc.egov.usda.gov (accessed on 23 June 2023).
  25. Multi-Resolution Land Characteristics Consortium—MRLC. Available online: https://www.mrlc.gov/ (accessed on 1 September 2023).
  26. Groshans, G.R.; Mikhailova, E.A.; Post, C.J.; Schlautman, M.A.; Zhang, L. Determining the value of soil inorganic carbon stocks in the contiguous United States based on the avoided social cost of carbon emissions. Resources 2019, 8, 119. [Google Scholar] [CrossRef]
  27. United Nations Committee of Experts on Global Geospatial Information Management (UN-GGIM). The SDGs Geospatial Roadmap. Prepared by the Inter-Agency and Expert Group on the Sustainable Development Goals Indicators. Statistical Commission. Fifty-Third Session, 1–4 March 2022. Item 3(a) of the Provisional Agenda Items for Discussion and Decision: Data and Indicators for the 2030 Agenda for Sustainable Development. Available online: https://unstats.un.org/unsd/statcom/53rd-session/documents/BG-3a-SDGs-Geospatial-Roadmap-E.pdf (accessed on 26 July 2023).
  28. ESRI (Environmental Systems Research Institute). ArcGIS Pro 2.6. Available online: https://pro.arcgis.com/en/pro-app/2.6/get-started/whats-new-in-arcgis-pro.htm (accessed on 1 March 2023).
  29. Hák, T.; Janoušková, S.; Moldan, B. Sustainable Development Goals: A need for relevant indicators. Ecol. Indic. 2016, 60, 565–573. [Google Scholar] [CrossRef]
  30. Karlen, D.L.; Veum, K.S.; Sudduth, K.A.; Obrycki, J.F.; Nunes, M.R. Soil health assessment: Past accomplishments, current activities, and future opportunities. Soil Tillage Res. 2019, 195, 104365. [Google Scholar] [CrossRef]
  31. Keesstra, S.; Nunes, J.; Novara, A.; Finger, D.; Avelar, D.; Kalantari, Z.; Cerdà, A. The superior effect of nature based solutions in land management for enhancing ecosystem services. Sci. Total Environ. 2018, 610, 997–1009. [Google Scholar] [CrossRef]
  32. Vanwalleghem, T.; Gómez, J.A.; Amate, J.I.; De Molina, M.G.; Vanderlinden, K.; Guzmán, G.; Laguna, A.; Giráldez, J.V. Impact of historical land use and soil management change on soil erosion and agricultural sustainability during the Anthropocene. Anthropocene 2017, 17, 13–29. [Google Scholar] [CrossRef]
  33. Kim, S.M.; Mendelsohn, R. Climate change to increase crop failure in US. Environ. Res. Lett. 2023, 18, 014014. [Google Scholar] [CrossRef]
  34. U.S. Bureau of the Census. Statistical Abstract of the United States: 1991; U.S. Bureau of the Census: Washington, DC, USA, 1991; p. 201. Available online: https://www.census.gov/library/publications/1991/compendia/statab/111ed.html (accessed on 10 October 2023).
  35. Seager, R.; Lis, N.; Feldman, J.; Ting, M.; Williams, A.P.; Nakamura, J.; Liu, H.; Henderson, N. Whither the 100th meridian? The once and future physical and human geography of America’s arid–humid divide. Part I: The story so far. Earth Interact. 2018, 22, 1–22. [Google Scholar] [CrossRef]
  36. Seager, R.; Lis, N.; Feldman, J.; Ting, M.; Williams, A.P.; Nakamura, J.; Liu, H.; Henderson, N. Whither the 100th meridian? The once and future physical and human geography of America’s arid–humid divide. Part II: The meridian moves east. Earth Interact. 2018, 22, 1–24. [Google Scholar] [CrossRef]
  37. Gomiero, T. Soil degradation, land scarcity and food security: Reviewing a complex challenge. Sustainability 2016, 8, 281. [Google Scholar] [CrossRef]
  38. Dooley, E.; Roberts, E.; Wunder, S.; Sgorbati, G.; Dotti, N.; Verschuuren, J.; Fleurke, F.; Berthier, A. Land degradation neutrality under the SDGs: National and international implementation of the land degradation neutral world target. Elni Rev. 2015, 1, 2–9. [Google Scholar] [CrossRef]
  39. UNCCD. Land Degradation Neutrality Principles. Available online: https://www.unccd.int/land-and-life/land-degradation-neutrality/ldn-principles (accessed on 1 December 2023).
  40. Food and Agriculture Organization of the United Nations. FAO Soils Portal. Available online: https://www.fao.org/soils-portal/soilex/country-profiles/details/en/?iso3=USA (accessed on 1 December 2023).
  41. FACT SHEET: U.S. Action on Global Development, 20 September 2023. Available online: https://www.whitehouse.gov/briefing-room/statements-releases/2023/09/20/fact-sheet-u-s-action-on-global-development (accessed on 1 December 2023).
  42. Bodle, R.; Stockhaus, H.; Wolff, F.; Oberthür, S. The Future of International Soil Governance. In International Yearbook of Soil Law and Policy 2019; Springer International Publishing: Cham, Switzerland, 2021; pp. 155–176. [Google Scholar]
  43. Boer, B.; Hannam, I. Developing a global soil regime. Int. J. Reg. Rural Remote Law Policy 2015, 1, 11–23. [Google Scholar] [CrossRef]
  44. Sims, N.C.; Barger, N.N.; Metternicht, G.I.; England, J.R. A land degradation interpretation matrix for reporting on UN SDG indicator 15.3.1 and land degradation neutrality. Environ. Sci. Policy 2020, 114, 1–6. [Google Scholar] [CrossRef]
  45. Feng, S.; Zhao, W.; Zhan, T.; Yan, Y.; Pereira, P. Land degradation neutrality: A review of progress and perspectives. Ecol. Indic. 2022, 144, 109530. [Google Scholar] [CrossRef]
  46. Dinerstein, E.; Vynne, C.; Sala, E.; Joshi, A.R.; Fernando, S.; Lovejoy, T.E.; Mayorga, J.; Olson, D.; Asner, G.P.; Baillie, J.E.; et al. A global deal for nature: Guiding principles, milestones, and targets. Sci. Adv. 2019, 5, eaaw2869. [Google Scholar] [CrossRef]
  47. Pozza, L.E.; Field, D.J. The science of soil security and food security. Soil Security 2020, 1, 100002. [Google Scholar] [CrossRef]
Figure 1. Monitoring land and soil degradation towards achieving the United Nations (UN) land degradation neutrality (LDN) targets using geospatial analysis of the intersection of land cover change and soil type which can be monitored and analyzed at various spatial and temporal scales.
Soilsystems 08 00027 g001
Figure 2. General soil map of the contiguous United States of America (USA) from the SSURGO database [13] with state boundaries overlaid [14].
Soilsystems 08 00027 g002
Figure 3. Land cover map of the contiguous United States of America (USA) for 2016 (based on data from Multi-Resolution Land Characteristics Consortium (MRLC) [25]).
Soilsystems 08 00027 g003
Figure 4. Anthropogenic land degradation status is presented as the proportion of land that is degraded over the total land area (%) in 2016 in each state for the contiguous United States of America (USA) (data for the 48 contiguous states). Anthropogenically degraded land was calculated as a sum of degraded land from agriculture (hay/pasture, and cultivated crops), from development (developed, open space; developed, low intensity; developed, medium intensity; developed, high intensity), and barren land.
Soilsystems 08 00027 g004
Figure 5. Change in anthropogenic land degradation status is presented as the change in the proportion of land that is degraded over the total land area (%) over time (2001–2016) in each state for the contiguous United States of America (USA) (data for the 48 contiguous states). Anthropogenically degraded land was calculated as a sum of degraded land from agriculture (hay/pasture, and cultivated crops), from development (developed, open space; developed, low intensity; developed, medium intensity; developed, high intensity), and barren land.
Soilsystems 08 00027 g005
Figure 6. Anthropogenic land degradation status is presented as the total degraded land area (km2) in each state in 2016 for the contiguous United States of America (USA) (data for the 48 contiguous states). Anthropogenically degraded land was calculated as a sum of degraded land from agriculture (hay/pasture, and cultivated crops), from development (developed, open space; developed, low intensity; developed, medium intensity; developed, high intensity), and barren land.
Soilsystems 08 00027 g006
Figure 7. Change in anthropogenic land degradation status is presented as the total degraded land area (km2) over time (2001–2016) in each state in the contiguous United States of America (USA) (data for the 48 contiguous states). Anthropogenically degraded land was calculated as a sum of degraded land from agriculture (hay/pasture, and cultivated crops), from development (developed, open space; developed, low intensity; developed, medium intensity; developed, high intensity), and barren land.
Soilsystems 08 00027 g007
Figure 8. The status of potential land for nature-based solutions (NBS) is presented as the proportion of potential NBS land over the total land area (%) in each state in 2016 for the contiguous United States of America (USA) (data for the 48 contiguous states). Potential land for NBS is limited to barren land, shrub/scrub, and herbaceous land cover classes, to provide potential land areas without impacting current land uses.
Soilsystems 08 00027 g008
Figure 9. Change in the status of potential land for nature-based solutions (NBS) is presented as the proportion of potential NBS land over the total land area (%) over time (2001–2016) in each state for the contiguous United States of America (USA) (data for the 48 contiguous states). Potential land for NBS is limited to barren land, shrub/scrub, and herbaceous land cover classes, to provide potential land areas without impacting current land uses.
Soilsystems 08 00027 g009
Table 1. Land degradation relevant to the United Nations (UN) Sustainable Development Goal (SDG) and indicator from the “Global Indicator Framework for the Sustainable Development Goals and Targets of the 2030 Agenda for Sustainable Development” (adapted from Assembly, U.G. (2017) [3]) 1.
Sustainable Development Goal, Target, and Indicator
Goal 15. Protect, restore and promote sustainable use of terrestrial ecosystems, sustainably manage forests, combat desertification, and halt and reverse land degradation and halt biodiversity loss.
Target 15.3 By 2030, combat desertification, restore degraded land and soil, including land affected by desertification, drought and floods, and strive to achieve a land degradation neutral world.Indicator 15.3.1 Proportion of land that is degraded over total land area.
1 Sustainable Development Goal indicators should be disaggregated, where relevant, by income, sex, age, race, ethnicity, migratory status, disability and geographic location, or other characteristics, in accordance with the Fundamental Principles of Official Statistics, United Nations (UN) Resolution 68/261 [9].
Table 3. The proportion of land use/land cover (LULC) in 2016 for selected states in the contiguous United States of America (USA).
NLCD Land Cover Classes
(LULC),
Soil Health Continuum
Soil Health StatusContiguous USAAlabamaNew YorkNevadaOregonWisconsinKansas
Area, 2016 (% from Total Area)
Woody wetlandsHigher 5.1  10.9 7.8 0.5 0.7  16.2 0.4
Shrub/ScrubSoilsystems 08 00027 i001  19.1 5.8 0.9  72.5  33.3 0.8 1.0
Mixed forest 4.3  12.0  11.3 0.1 3.8 7.6 0.2
Deciduous forest  11.1  18.1  38.0 0.2 0.4  24.8 4.1
Herbaceous  15.0 4.2 0.7  12.9  13.9 0.9  33.4
Evergreen forest  10.4  23.2 8.5 8.9  30.1 1.9 0.0
Emergent herbaceous wetlands 1.5 0.6 0.8 0.5 1.3 3.4 0.2
Hay/Pasture 7.6  13.7  13.6 0.4 5.0 8.7 8.6
Cultivated crops 19.6 4.6 8.3 0.6 7.4  28.8  47.4
Developed, open space 3.3 4.6 5.5 0.5 2.2 3.9 3.2
Developed, low intensity 1.6 1.6 2.5 0.4 1.0 2.0 1.1
Developed, medium intensity 0.7 0.5 1.4 0.3 0.5 0.7 0.3
Developed, high intensity 0.2 0.2 0.6 0.1 0.2 0.2 0.1
Barren landLower 0.5 0.2 0.2 2.1 0.3 0.1 0.1
Note: NLCD = National Land Cover Database.
Table 4. Change in land use/land cover (LULC) between 2001 and 2016 in the contiguous United States of America (USA) and selected states.
NLCD Land Cover Classes
(LULC),
Soil Health Continuum
Soil Health StatusContiguous USAAlabamaNew YorkNevadaOregonWisconsinKansas
Change in Area, 2001–2016 (%)
Woody wetlandsHigher 0.2  −0.6 0.7  −0.7 3.5  0.6  −1.6
Shrub/ScrubSoilsystems 08 00027 i001 0.1   13.7   33.2  −3.6 −1.0 5.6  4.1 
Mixed forest 0.2  −0.6 0.7   13.5  −2.5 2.9  3.6 
Deciduous forest −3.1 −8.7 −1.4 1.5   16.0  −0.9 −0.7
Herbaceous 0.9   13.6   89.7   27.6   18.3 −10.3  −3.5
Evergreen forest −3.0 8.1  −0.5 −2.8 −5.7 1.8  −0.8
Emergent herbaceous wetlands −0.6 8.9  −2.8 1.8  1.4  −3.5  12.6 
Hay/Pasture −7.9−12.2  −6.0 −3.3 −9.3 −7.3 −6.0
Cultivated crops 4.0  5.7  5.5  7.1  6.7  0.9  3.4 
Developed, open space 3.2  3.7  1.6  6.0  0.9  4.3  1.0 
Developed, low intensity 7.2   10.9  4.2   11.1  1.4  6.4  3.5 
Developed, medium intensity  24.6   41.8   12.7   29.1  8.9   23.6   23.4 
Developed, high intensity  28.1   42.4   11.4   31.9   13.2   27.9   26.6 
Barren landLower 0.1  −2.1 −3.9 −1.8 −5.5 3.9   24.8 
Note: NLCD = National Land Cover Database.
Table 5. The area of land use/land cover (LULC) in 2016 for selected states in the contiguous United States of America (USA).
NLCD Land Cover Classes
(LULC),
Soil Health Continuum
Soil Health StatusContiguous USAAlabamaNew YorkNevadaOregonWisconsinKansas
Area, 2016 (km2)
Woody wetlandsHigher309,846.514,072.09355.61154.61091.419,533.8766.3
Shrub/ScrubSoilsystems 08 00027 i0011,166,120.77468.41063.4167,131.751,917.3912.62018.9
Mixed forest263,633.015,427.413,623.1120.85925.29199.3471.0
Deciduous forest681,393.523,284.945,869.1536.1618.729,912.58381.6
Herbaceous920,694.45407.4877.629,825.321,752.91056.968,434.1
Evergreen forest635,864.729,871.910,258.820,498.646,989.02305.139.8
Emergent herbaceous wetlands90,187.3801.6987.21116.62040.24118.8439.7
Hay/Pasture466,705.817,662.716,349.51035.87751.510,477.617,726.1
Cultivated crops1,198,629.75868.410,006.41463.011,596.534,738.497,146.1
Developed, open space202,064.15874.56622.81056.93361.14674.06494.2
Developed, low intensity97,869.72083.63043.4822.21524.42450.62298.2
Developed, medium intensity41,815.2676.71665.3614.0703.3817.9603.5
Developed, high intensity13,994.2210.3706.1215.9235.3280.9219.1
Barren landLower32,089.8245.8221.64820.0467.480.6112.0
Note: NLCD = National Land Cover Database.
Table 6. The change in the area of land use/land cover (LULC) from 2001 to 2016 for selected states in the contiguous United States of America (USA).
NLCD Land Cover Classes
(LULC),
Soil Health Continuum
Soil Health StatusContiguous USAAlabamaNew YorkNevadaOregonWisconsinKansas
Change in Area, 2001–2016 (km2)
Woody wetlandsHigher735.7−79.168.6−7.736.7119.2−12.2
Shrub/ScrubSoilsystems 08 00027 i001863.9901.8264.8−6185.6−526.548.479.0
Mixed forest614.7−99.890.914.3−152.7255.016.5
Deciduous forest−21,562.2−2208.8−634.47.985.3−258.1−55.2
Herbaceous8236.8647.4414.96452.03370.0−121.0−2482.8
Evergreen forest−20,001.62231.6−56.0−593.5−2853.441.6−0.3
Emergent herbaceous wetlands−518.765.8−28.519.528.7−149.949.2
Hay/Pasture−40,204.3−2445.5−1046.8−35.8−799.5−821.2−1128.6
Cultivated crops45,922.5315.4518.796.9732.7299.33225.8
Developed, open space6293.0207.2101.659.730.2192.967.2
Developed, low intensity6614.4205.3123.381.920.8146.976.6
Developed, medium intensity8262.1199.5187.9138.357.2156.3114.3
Developed, high intensity3067.762.672.352.227.461.246.0
Barren landLower22.8−5.4−9.0−87.5−27.43.022.2
Note: NLCD = National Land Cover Database.
Table 7. Anthropogenic land degradation status and potential land for nature-based solutions by soil order for the contiguous United States of America (USA) in 2016. Percent changes in area from 2001 to 2016 are shown in parentheses. Reported values have been rounded; therefore, calculated sums and percentages may exhibit minor discrepancies.
Soil OrderTotal AreaAnthropogenically Degraded LandTypes of Anthropogenic DegradationPotential Land for Nature-Based
Solutions
BarrenDevelopedAgriculture
(km2)(%)(km2)(km2)(km2)(km2)(km2)
Slightly Weathered Soils
1,742,00028.5364,000 (+1.6)20,000 (+0.2)96,000 (+6.2)249,000 (+0.1)645,000 (+2.0)
Entisols820,00013.4180,000 (+2.4)17,000 (+0.2)48,000 (+6.6)115,000 (+1.1)460,000 (0.0)
Inceptisols767,00012.5170,000 (+0.9)3000 (−0.8)43,000 (+5.8)124,000 (−0.7)170,000 (+5.8)
Histosols97,0001.612,000 (−0.1)170 (+9.2)3000 (+6.4)9000 (−2.3)2000 (+15.5)
Andisols58,0000.93000 (0.0)230 (+0.3)2000 (+1.5)1000 (−2.6)13,000 (+33.3)
Moderately Weathered Soils
3,436,00056.11,425,000 (+1.9)10,000 (+1.0)175,000 (+7.7)1,240,000 (+1.1)1,401,000 (−1.1)
Aridisols538,0008.847,000 (+6.4)6000 (−1.3)11,000 (+15.6)29,000 (+5.0)487,000 (−0.8)
Vertisols145,0002.467,000 (+3.2)1000 (+3.3)9000 (+12.9)57,000 (+1.9)58,000 (−3.7)
Alfisols1,054,00017.2499,000 (+0.5)1000 (−1.4)80,000 (+7.2)418,000 (−0.7)183,000 (+2.5)
Mollisols1,699,00027.8813,000 (+2.4)2000 (+10.4)76,000 (+6.6)736,000 (+2.0)672,000 (−2.0)
Strongly Weathered Soils
942,00015.4264,000 (−0.7)2000 (−4.9)85,000 (+7.8)177,000 (−4.3)74,000 (+19.1)
Spodosols208,0003.432,000 (+1.4)560 (−2.3)15,000 (+5.7)17,000 (−1.9)16,000 (+22.3)
Ultisols734,00012.0232,000 (−1.0)1400 (−5.9)70,000 (+8.3)161,000 (−4.5)58,000 (+18.2)
All Soils
Totals6,121,000100.02,053,000 (+1.5)32,000 (+0.1)356,000 (+7.3)1,665,000 (+0.3)2,119,000 (+0.4)
Note: Entisols, Inceptisols, Andisols, Aridisols, Vertisols, Alfisols, Mollisols, Spodosols, and Ultisols are mineral soils. Histosols are mostly organic soils. Anthropogenically degraded land was calculated as a sum of degraded land from agriculture (hay/pasture, and cultivated crops), from development (developed, open space; developed, low intensity; developed, medium intensity; developed, high intensity), and barren land. Developed land includes categories: developed, open space; developed, low intensity; developed, medium intensity; developed, high intensity. Agriculture includes categories: hay/pasture; and cultivated crops. Potential land for nature-based solutions (NBS) is limited to barren land, shrub/scrub, and herbaceous land cover classes, to provide potential land areas without impacting current land uses.
Table 8. Impact of inherently degraded soil (Aridisols) on anthropogenic land degradation (LD) and potential for nature-based solutions (NBS) analyses.
StateProportion of Degraded Land (%)
in the State in 2016
Degraded Land Area
in the State (km2) in 2016
Proportion of Potential Land Area (%) for Nature-Based Solutions in 2016
AnthropogenicAdjustedAnthropogenicAdjustedPotential LandWithout Aridisols
Arizona 8.4 53.3 11,062.0 70,448.5 82.2 36.4
California  20.1 24.7 32,764.6 40,273.4 50.9 46.0
Colorado  19.3 34.2 33,166.7 58,971.0 55.4 41.3
Idaho  17.6 35.1 25,877.3 51,730.7 55.2 37.7
Kansas  60.7 60.7124,599.2 124,652.9  34.4 34.4
Montana  18.6 22.2 60,190.9 71,835.7 62.1 58.7
Nebraska  42.9 42.9 84,143.7 84,405.4 52.7 52.6
Nevada 4.4 47.5 10,027.9109,480.4  87.6 44.9
New Mexico 3.8 45.6 9693.3115,799.4  85.3 44.3
Oklahoma  35.9 36.2 60,907.1 61,419.4 40.9 40.6
Oregon  16.4 27.1 25,639.5 42,235.2 47.5 36.9
South Dakota  44.9 47.6 84,537.1 89,533.4 50.5 47.7
Texas  29.0 40.7160,820.8 225,588.7  57.0 45.3
Utah  14.0 41.5 14,398.8 42,634.9 72.9 46.3
Washington  28.5 31.5 32,097.5 35,456.2 33.7 30.7
Wyoming 4.5 29.3 6772.0 43,988.6 81.8 57.1
Note: Anthropogenic land degradation calculation includes a sum of degraded land from agriculture (hay/pasture, and cultivated crops), from development (developed, open space; developed, low intensity; developed, medium intensity; developed, high intensity), and barren land. The adjusted land degradation calculation includes land area in the standard anthropogenic land degradation calculation plus the area of Aridisols not including the land originally identified as degraded.
Disclaimer/Publisher’s Note: The statements, opinions and data contained in all publications are solely those of the individual author(s) and contributor(s) and not of MDPI and/or the editor(s). MDPI and/or the editor(s) disclaim responsibility for any injury to people or property resulting from any ideas, methods, instructions or products referred to in the content.

