Article

Different Quality Classes of Decomposing Plant Residues Influence Dissolved Organic Matter Stoichiometry Which Results in Different Soil Microbial Processing

by
Ratanaporn Poosathit
1,2,
Benjapon Kunlanit
2,3,
Frank Rasche
4,† and
Patma Vityakon
1,2,*
1
Department of Soil Science and Environment, Faculty of Agriculture, Khon Kaen University, Khon Kaen 40002, Thailand
2
Soil Organic Matter Management Research Group, Khon Kaen University, Khon Kaen 40002, Thailand
3
Department of Agricultural Technology, Faculty of Technology, Mahasarakham University, Maha Sarakham 44150, Thailand
4
Institute of Agricultural Sciences in the Tropics (Hans-Ruthenberg-Institute), University of Hohenheim, 70593 Stuttgart, Germany
*
Author to whom correspondence should be addressed.
Current address: International Institute of Tropical Agriculture, Nairobi P.O. Box 30772-00100, Kenya.
Soil Syst. 2024, 8(1), 28; https://doi.org/10.3390/soilsystems8010028
Submission received: 29 November 2023 / Revised: 24 February 2024 / Accepted: 25 February 2024 / Published: 28 February 2024

Abstract

:
The influence of the quantities and ratios of dissolved organic carbon (DOC) and dissolved nitrogen (DN) generated by different chemical quality classes of organic residues on soil microbial processes in the decomposition process is not well understood. If the DOC-to-DN ratio (hereafter, ratio) of the substrate is close to that of the microbial C-to-N ratio, then the DOC-and-DN stoichiometry of the substrate is balanced, resulting in enhanced microbial processing, i.e., carbon use efficiency (CUE). Uncertainty exists about the influence of DN and the DOC-to-DN ratio on CUE, particularly in high-quality class (high nitrogen) residue-treated soils. A long-term field experiment was used to explore the effect of the annual application of residues of different quality classes on decomposition processes, focusing on the effects of DOC, DN, and the ratio on the microbial metabolic quotient (qCO2), which is the inverse of CUE. DOC and DN were extracted from soils during the 13th year of the experiment. Soils treated with high-quality class groundnut residue (high-nitrogen) had higher DN (5.4 ± 2.6 mg N kg−1) and a lower ratio (6.8 ± 2.6) than those treated with medium-quality (medium-nitrogen) tamarind (3.0 ± 0.6 and 10.7 ± 2.2, respectively). The positive influence of DN on qCO2 (R2 = 0.49 *) in groundnut-treated soil suggested that the high bioavailability of DN reduced CUE due to imbalanced DOC-and-DN stoichiometry. This contradicted earlier published findings on high-nitrogen residues which had balanced DOC-and-DN stoichiometry. The positive influence of the ratio on qCO2 under the tamarind-treated soil (R2 = 0.60 *) indicated that its balanced DOC-and-DN stoichiometry enhanced CUE. High-quality class organic residues can result in either higher or lower CUE than their lower-quality class counterparts depending on whether the resulting DOC-and-DN stoichiometry is balanced or imbalanced.

1. Introduction

The influence of the chemical quality classes of organic residues, the quantities of dissolved organic carbon (DOC) and dissolved nitrogen (DN), on soil microbial processes in the decomposition process is complex and not yet well understood. In this paper, we employ data from a long-term experiment to clarify these relationships.
Dissolved organic matter (DOM) is categorized as labile soil organic matter (SOM) [1]. DOM production in soils is a result of decomposition of plant litter and turnover of native SOM [2,3,4]. Dissolved organic C (DOC) and N (DON) are components of DOM which have been widely studied for their functions in soils [5,6,7]. In many studies, dissolved organic N is replaced by dissolved N (DN), which is the combination of dissolved organic and inorganic N [7,8,9].
DOC and DON (or DN) have been shown to be utilized by microbes [5,10], indicating their biological function. DOC and DN are shown to be incorporated into microbial biomass during earlier stages of decomposition. For instance, Zhang et al. [4] observed this phenomenon 7 days after the incorporation of litter of Chinese fir (Cunninghamia lanceolate (Lamb.) Hook.), while Cotrufo et al. [3] observed similar trends 28 weeks after incorporation of bluestem grass (Andropogon gerardii) litter in a 3-year decomposition period. A study focused on DON (amino acids, peptides, and urea) found it to be incorporated into microbial biomass at 7 days after application [6].
Because microbes need to maintain their own internal stoichiometric balance or homeostasis of the C and N nutrients, the contents of DOC and DN in soils and their interaction influence their microbial uptake. The DOC-and-DN stoichiometry exerts control over the microbial uptake. Microbial stoichiometric homeostasis means that microbes maintain their chemical composition close to constant in the face of variations in the chemical composition of their resources (substrates) [11]. Thus, the C and N nutrients in microbes are maintained at constant as indicated by their C-to-N ratio despite the changes in the C-to-N ratio of the substrates. Considering DOC and DN as the microbial substrates in soils, their C-to-N ratio relative to that of microbes indicates whether they have balanced or imbalanced stoichiometry. The balanced DOC-and-DN stoichiometry of substrates implies that the DOC-to-DN ratios of substrates are close to the C-to-N ratios of microbes [9,12]. In contrast, the imbalanced DOC-and-DN stoichiometry implies that the DOC-to-DN ratios of substrates are either substantially lower or higher than the C-to-N ratios of microbial biomass [9,12]. Balanced DOC-and-DN stoichiometry enhances microbial C use efficiency (CUE) in contrast to the imbalanced DOC-and-DN stoichiometry [7]. The microbial CUE, which reflects microbial growth relative to microbial respiration, influences the processing of SOM [11]. The CUE exerts a positive influence on the generation of microbial products in the form of microbial metabolites and necromass [13]. Such microbial products can support the formation of the stable SOM pool, notably in fine particles (silt and clay) [3,14]. The application of organic residues to improve soil fertility affects the stoichiometry of the microbial substrate in soils. Therefore, the chemical composition or quality of organic residues is an important factor regulating decomposition [15] and plays a role in controlling the stoichiometry of DOC and DN substrates in soils.
Chemical composition parameters used for characterization of organic residues into different quality classes for the purpose of soil fertility management, particularly N release, were originally identified as N, lignin and polyphenols [16]. Later studies emphasizing SOM build-up have identified cellulose as another quality parameter to classify organic residues [17,18]. Based on these studies, organic residues are classified into a spectrum of low- to high-quality classes. These quality classes are mainly based on their low to high N contents but their composition of carbonaceous compounds, i.e., lignin and cellulose, which are resistant and labile C, respectively, are also taken into account. For example, a low-N but high-lignin residue and its low-N but high-cellulose counterpart are variants of low-quality residues. The chemical quality of organic residues has been shown to influence DOC and DN quantities and DOC structural characteristics [8]. High-quality residues (high N, low lignocellulose index (LCI)) decompose more rapidly [8,19] and provide higher quantities of labile DOC and DN than their low-quality counterparts (low N, high LCI) in the early stage of decomposition [8,20]. The N-rich plant-derived residues, such as alfalfa [8] and sugarcane mill mud [7], had higher DN and lower DOC-to-DN ratios than their N-poor counterparts. The balanced DOC-and-DN stoichiometry in soils under N-rich sugarcane mill mud [7] and under tall grass prairie and mesic grassland from multiple locations [12] has been shown to have higher microbial CUE or a lower microbial metabolic quotient (qCO2) than soils under lower-N residues/unfertilized grassland vegetation. The qCO2, defined as microbial respiration per unit of microbial biomass, is used as a proxy for CUE [21] as they have been found to be negatively correlated to each other [7,22]. It should be highlighted that only a restricted number of studies have utilized incubation experiments to explore the influence of DON or DN, and their interaction with DOC, on microbial processes as regulated by contrasting organic residue quality [7,23].
A long-term field experiment is required to understand the legacy effects of contrasting quality organic residues on soil organic carbon (SOC) accumulation via temporal changes in DOC and DN quantities and their interaction and functions in situ. This need was met by a unique long-term field experiment (13 years) on a tropical sandy soil. An earlier study based on this experiment demonstrated that applying N-rich groundnut stover (GN) stimulated microbial respiration (CO2-C evolution), leading to high qCO2 or low microbial CUE as compared to medium-N tamarind leaf/petiole litter (TM), as well as N-poor rice straw (RS) and dipterocarp leaf litter (DP) across a decomposition period of one year [19]. The low CUE in soils under N-rich GN residue that were found in this study [19] contradict the results reported in earlier studies of high CUE under an N-rich amendment, sugarcane mill mud [7] or an N-rich soil of grassland vegetation [12]. These contradictory results raise questions as to whether and how high DN availability under N-rich residues plays a role in soil microbial processes.
The results of the long-term experiment showed higher SOC accumulation in soils treated with higher-N TM followed by GN than in soils treated with the lower-N DP and RS [19]. The same experiment also found higher amounts of microbially synthesized products of carbohydrates and polysaccharides in the SOC composition of bulk soils treated with higher-N GN and TM than in soil treated with RS [18]. These findings highlighted the role of residue-derived N in boosting microbial activities and growth. However, the role of DN and its interaction with DOC remain uncertain and require further investigation.
This study aimed to investigate how different quality classes of organic residues along with their chemical quality parameters impact the quantities as well as the C-to-N ratios of DOC and DN generated in successive stages of decomposition. We also aimed to investigate the influence of the resulting DOC and DN along with their DOC-to-DN ratio on microbial processes including microbial respiration, microbial biomass, and microbial CUE. In order to achieve the stated objectives, the following hypotheses were tested (1) during the early stages of decomposition, DN generated by medium- to high-quality classes of residues (medium to high N), such as TM and GN, respectively, would be higher and the DOC-to-DN ratio would be lower than in the lower-quality classes counterparts (such as N-poor RS and DP); (2) the elevated quantity of DN and a low DOC-to-DN ratio in N-rich GN would enhance microbial processes, but decrease microbial CUE, in contrast to medium-N TM and low-N RS and DP.

2. Materials and Methods

2.1. Framework of Data Used

In this research, the DOM samples studied were immediately extracted from fresh soil samples which had been collected during May 2007–April 2008 from a long-term field experiment initiated in 1995 during the 13th year of the experiment. This experiment was undertaken to study the potential of chemically contrasting organic residues to restore SOC in a degraded tropical coarse-textured soil. Details of study site and soil characteristics (Section 2.2), and treatments and experimental design (Section 2.3) were provided in Vityakon et al. [24] and Puttaso et al. [19]. There were two categories of data: (1) newly generated data on the quantitative analysis of DOC and DN concentrations with respective calculations of DOC-to-DN ratios (Section 2.4), and (2) published data consisting of initial chemical composition of organic residues (residue chemical quality) applied [19] (Table 1), microbial parameters including microbial respiration (CO2-C), microbial biomass C and N (MBC and MBN) and the microbial metabolic quotient (qCO2) [19] (Table 2). Both newly generated and published data originated from soil samples collected during the 13th year of the long-term field experiment. We employed the two sets of data to find the relationships of DN and DOC with microbial processes as intended to advance the knowledge on the role of the former in controlling microbial processing. Measurements of CO2-C evolution were performed by employing the alkaline trap method [25]. Microbial biomass C and N were determined by the chloroform fumigation–extraction technique [26]. The metabolic quotient qCO2 was calculated by dividing CO2-C (mg C kg−1 day−1) by MBC (mg C kg−1 soil) [27] following Puttaso et al. [19]. The CO2-C and qCO2 (the inverse of CUE) were higher under the high-quality class GN than the lower-quality class residues (TM, DP, and RS) during the earlier stages of decomposition (week 2–8). As decomposition continued to the mid stage (week 8), CO2-C and qCO2 under the medium-quality class residue TM decreased below all other residues. During the late stage (week 52), most microbial parameters decreased to low values relative to the earlier stages, except MBC during the late stage compared to the mid stage under all residue classes (Table 2).

2.2. Study Site and Soil

The study site was located in the research station of the Office of Agriculture and Co-operatives at Tha Phra subdistrict, Khon Kaen province, Northeast Thailand (16°20′ N; 102°49′ E). The region has distinct wet (April–September) and dry (October–March) periods [17], with a total precipitation of 874 mm and 262 mm and a mean temperature of 28 °C and 24.5 °C in wet and dry periods, respectively. The study site had a predominantly sandy soil (Khorat series (Typic Kandiustult)) with proportions of 93.4% sand, 4.5% silt, and 2.1% clay [24,28]. Initial soil properties were pH of 5.5, SOM 0.36%, total N 0.02%, Bray II P 47.2 mg kg−1, exchangeable K 0.077 cmol kg−1, and CEC 3.53 cmol kg−1 [24].

2.3. Treatments and Experimental Design

There were five treatments: (1) control (CT; no input of organic residue), (2) rice (Oryza sativa L.) straw (RS), (3) groundnut (Arachis hypogaea L.) stover (GN), (4) dipterocarp (Dipterocarpus tuberculatus Roxb.) leaf litter (DP), and (5) tamarind (Tamarindus indica L.) leaf + petiole litter (TM). The details on initial chemical quality of these organic residues are provided in Table 1, and more details on residue preparation and determination of chemical quality of organic residues are described in Puttaso et al. [19]. The experimental design was a randomized complete block (RCB) with three replications or blocks in the 4 × 4 m size of each plot. The residues were incorporated annually into the soil at approximately 15 cm depth at the rate 10 Mg dry matter ha−1 year−1 in early May. Weeds were controlled manually by lightly hoeing once a month during the rainy season and once every two months during the dry season.

2.4. Soil Collection, and Extraction and Analysis for DOC and DN

The DOC and DN (including both dissolved inorganic and organic N) concentrations were measured from freshly harvested soil. Soil samples were collected at 0–15 cm depth in two replications per plot using a bucket auger [28]. The soil sampling was conducted at weeks 0, 2, 8 and 52 following subsequent decomposition stages of contrasting organic residues before and after organic residue incorporation. In order to have DOM samples from the complete 1-year decomposition cycle, samples from weeks 0 and 52 were selected. The selection of samples from weeks 2 and 8 was based on the previous observation of the surges in DOC quantities and were related to early and mid stages of decomposition [28]. These fresh soil samples were brought to the laboratory for DOM extraction. The extraction of DOM was performed at the ratio of soil:water extractant of 1:5 (w/v) [28] using 20 g of field moist soil samples shaken with 100 mL of deionized water for 30 min. All extracts were frozen in freezers at −20 °C until analysis. Before analysis, the extracts were thawed. The process of freeze/thaw of DOM samples similar to that used in this study was not expected to have substantial effect on both bulk quantities and quality of DOC as revealed by Cook et al. [29]. Furthermore, this approach has no effect on DOC loss via flocculation as observed by Bowering et al. [30]. For dissolved organic N, it was found that the concentrations did not significantly decrease after freezing/thawing [31]. The thawed samples were filtered through 0.45 µm membrane filters (cellulose acetate; Sartorius, Göttingen, Germany). After filtration, the extractants were acidified to a pH < 2 by adding 2 M HCl and purging with pure oxygen gas for 3 min per sample to remove present inorganic C. The purging with oxygen gas converted inorganic C to dissolved CO2, which was driven off. After removal of inorganic carbon by sparging (gas flushing), DOC as non-purgeable organic C (NPOC) and DN as NPDN were simultaneously analyzed immediately with oxidative high-temperature combustion (800 °C) using a TOC/TNb analyzer (Multi N/C 2100s, Analytik Jena, Jena, Germany) equipped with a non-dispersive infrared (NDIR) detector for C and a chemical luminescence detector (CLD) for N. The purging of inorganic C from DOM samples by oxygen gas during the NPOC technique did not produce substantial change in DOM as proved by the published results of a previous study [32] (Table S1).

2.5. Statistical Analysis

Testing of the effects of organic residue chemical quality classes (Q), decomposition time (T), and their interactions (Q × T) on DOC and DN concentrations as well as respective DOC-to-DN ratios were performed under the RCB design using the generalized linear mixed model (GLIMMIX). Type III tests of significance with Kenward–Roger estimation of degrees of freedom were used to assess the main and interactive effects of Q and T. Least square estimates of means comparisons were performed using the Tukey–Kramer method. All data were tested for normality using the Shapiro–Wilk test. Those that did not meet the normal distribution were log transformed (natural log) before statistical analyses. Mean values (n = 3) of DN quantities and DOC-to-DN ratios were presented in a bar chart with standard errors of the means (SEM), unless the SEM was not available (NA) as in the cases of DN and the corresponding DOC-to-DN ratio of the control, where n = 1 due to inadequate amount of extracts for analysis in two out of three replications. Pearson correlation analysis was conducted to study linear relationships between initial chemical characteristics of plant residues and DOC, DN, as well as the respective DOC-to-DN ratios at different decomposition stages. These statistical analyses were conducted using SAS software version 9.0401M7 (SAS OnDemand for Academics, SAS Institute Inc, Cary, NC, USA). Regression analysis (linear and non-linear) was conducted to study the relationships of DOC, DN, as well as the respective DOC-to-DN ratios with microbial processes parameters. These included microbial respiration (CO2-C), microbial biomass C, microbial biomass N, and the microbial metabolic quotient (qCO2) of each decomposition stage as well as the entire decomposition period. The regression analysis was performed in the Sigmaplot 11.0 graphic software (Systat Software Inc., San Jose, CA, USA). Statistical significance was taken at p ≤ 0.05.

3. Results

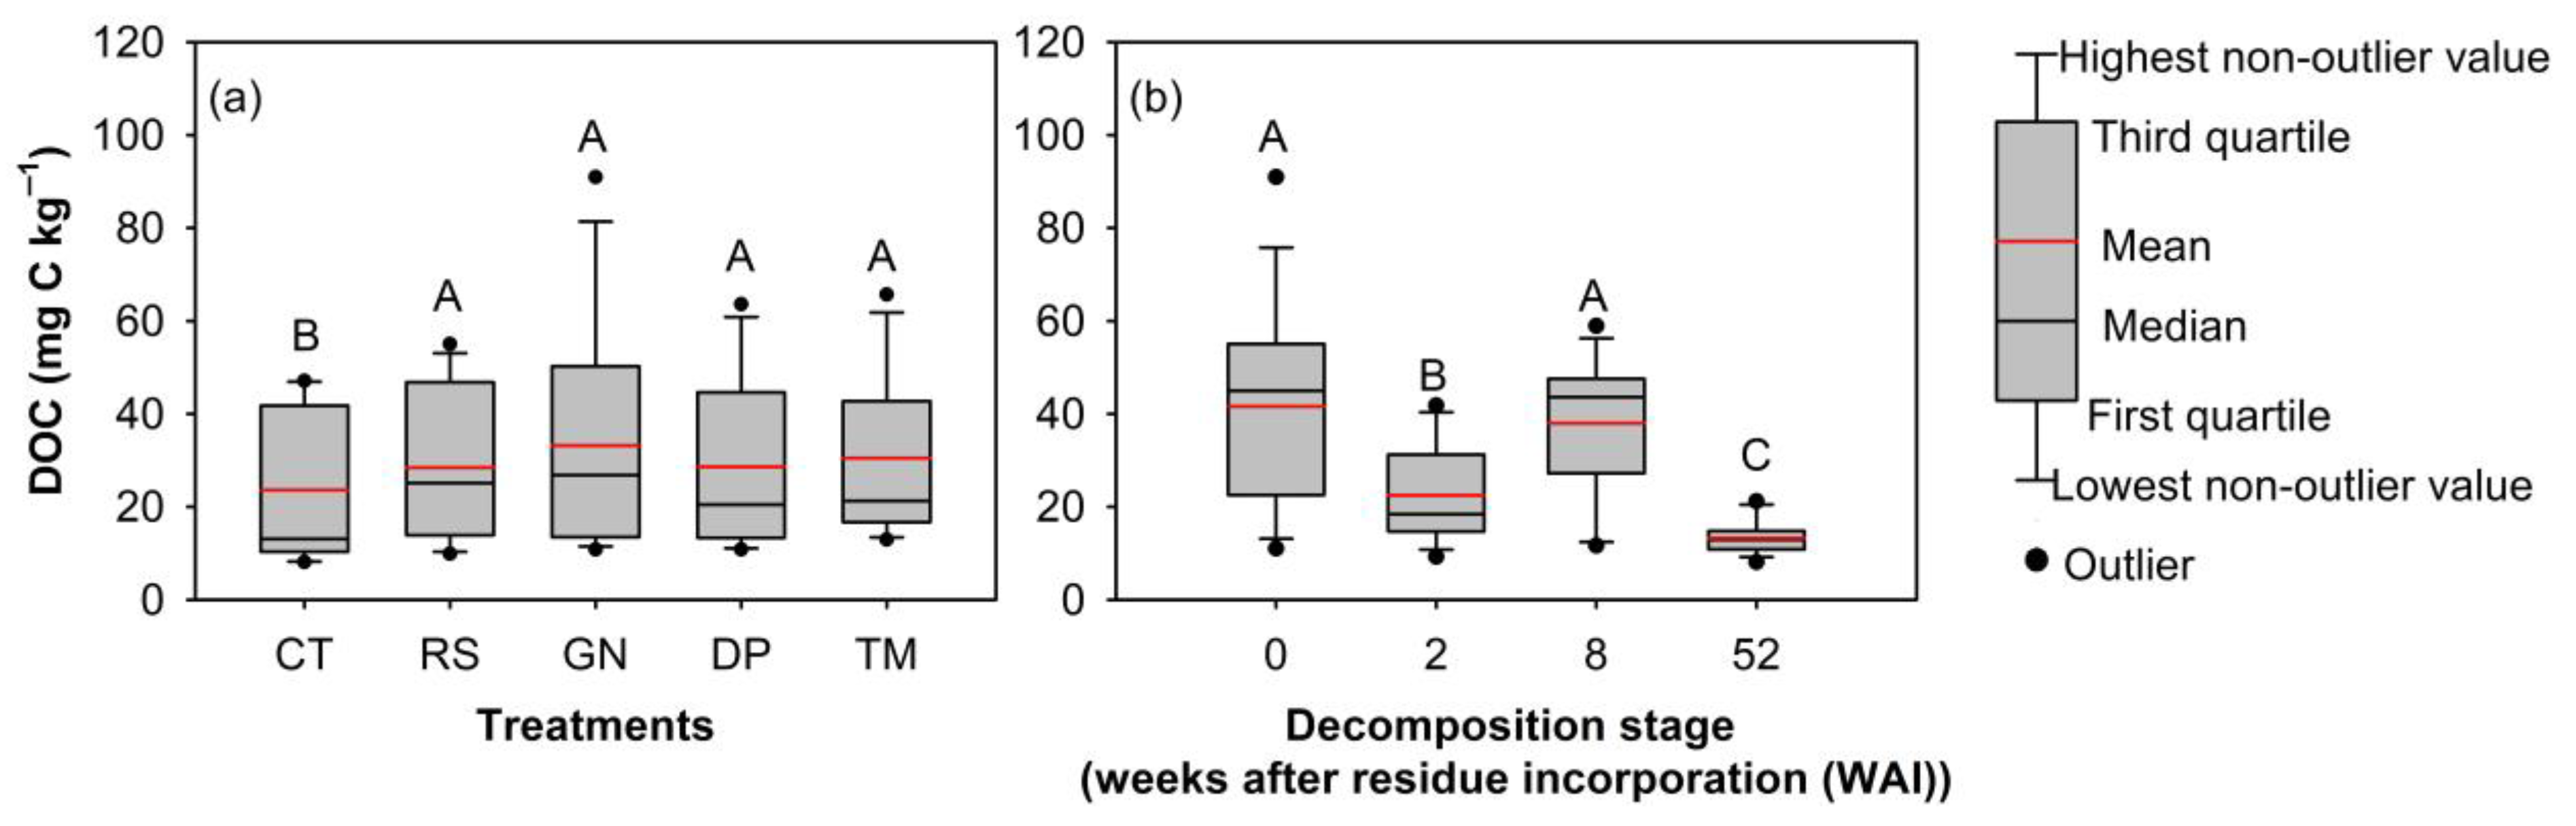
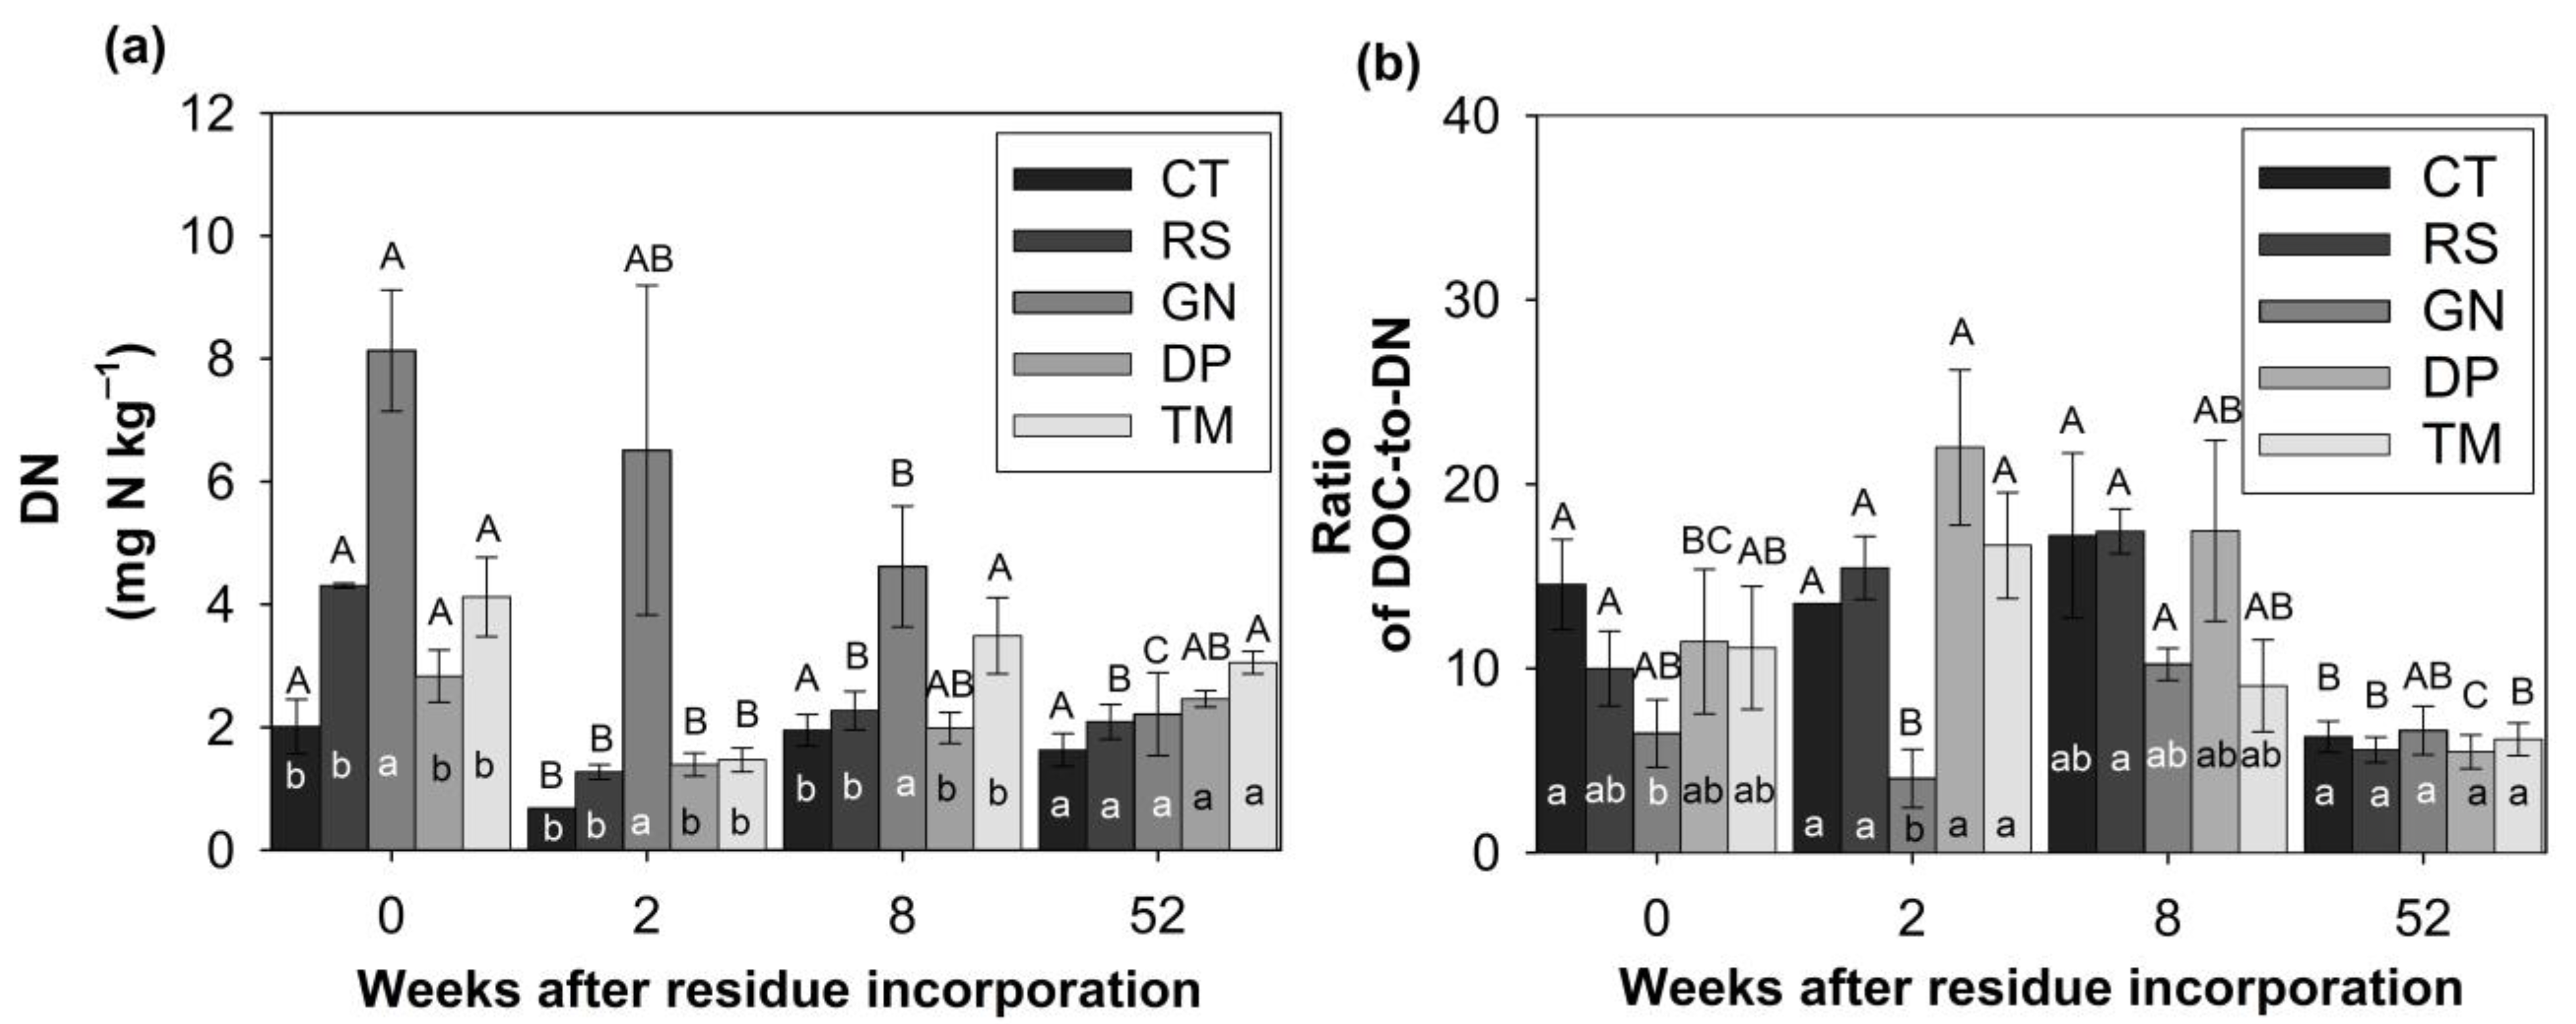
3.1. Organic Residue Quality Influences Production of DOM and the DOC-to-DN Ratio during Different Stages of Decomposition

The chemical quality classes of organic residues (Q) and the length of time after their incorporation (T) shaped the contents of DOC, DN, and the respective DOC-to-DN ratio (p < 0.05). However, the interactive effects of chemical quality of organic residues and decomposition time (Q × T) did not influence the DOC production (p > 0.05) but had a strong influence on DN and DOC-to-DN ratio (p < 0.001) (Table 3). Because the DOC content was not affected by Q × T interaction, only the main effects of Q and T are considered as follows. Generally, the treatments receiving organic residues produced higher contents of DOC than CT (Figure 1a) with the average contents ranging between 21.2 ± 6.7 and 33.1 ± 10.0 mg C kg−1. Regarding effects of decomposition time on DOC, week 0 (before residue incorporation) showed a higher DOC concentration than the other decomposition stages; however, it was significantly higher than the early (week 2 after residue incorporation) and late (week 52) stages (Figure 1b).
Considering temporal patterns of DN production, DN concentrations were significantly higher in GN treatment than RS, DP, and TM since before residue incorporation (weeks 0) through to the early (week 2) and mid stages (week 8 after residue incorporation) (Figure 2a). Over the entire decomposition period, average DN concentrations were higher under GN (5.4 ± 1.3 mg N kg−1) than the other residue treatments, i.e., RS (2.5 ± 0.6 mg N kg−1), DP (2.2 ± 0.3 mg N kg−1), and TM (3.0 ± 0.6 mg N kg−1). It is notable that GN was the only treatment revealing the temporal pattern of continuous decreases in DN. The decreases were significant from weeks 0 to 8 (mid stage of decomposition) and towards week 52 (late stage), in which DN concentration was significantly lower than all other preceding weeks (Figure 2a). Dissolved N concentrations of RS, DP, and TM significantly decreased to the lowest level during the early stage (weeks 0 to 2). However, in contrast to GN, they sharply increased after the early (week 2) until mid (week 8) stages. The increase in DN was significant under TM and the untreated controls. After the mid stage, the DN concentrations of all residues, except GN, did not significantly change until the end of the late stage (Figure 2a). The higher relative decreases in DN concentrations in week 2 (% week 0) among the residues from week 0 to week 2 were in the decreasing order of RS (70) > TM (64) > DP (51) > GN (20). During week 2 to week 8, the higher relative increases in DN (% week 2) were found in lower-N residues in the decreasing order of TM (138) > RS (79) > DP (43) soils. In contrast, during this period of weeks 2 to 8, the high-N GN showed a decreasing trend, which was 29% lower DN in week 8 than week 2.
The interaction of organic residue quality and their decomposition time had strong effects on the DOC-to-DN ratios (Table 3). During the early stage (weeks 0 and 2), GN had lower DOC-to-DN ratios (6.5 ± 1.8 and 4.0 ± 1.6, respectively) than CT (14.6 ± 2.5, 13.5 ± NA), RS (10.0 ± 2.0 and 15.4 ± 1.7), DP (11.4 ± 3.9 and 22.0 ± 4.2), and TM (11.1 ± 3.3 and 16.7 ± 2.9). However, the lower ratio under GN than the other treatments was significant only in the early stage (week 2), while in week 0 it was significant relative to CT only (Figure 2b).
During the mid stage (week 8), the two lower DOC-to-DN ratios were found under TM (9.1 ± 2.5) and GN (10.2 ± 0.9), while the higher values were found under DP (17.5 ± 4.9) and RS (17.4 ± 1.2) (Figure 2b). The higher relative increases in DOC-to-DN ratios under various residue treatments during week 2 (% week 0) were in the decreasing order of DP (92) > RS (55) > TM (50) > GN (−38). During weeks 2 to 8, the relative increases in the DOC-to-DN ratios (% week 2) were in the increasing order of GN (154) > RS (13) > DP (−21) > TM (−46). Over the entire decomposition time, average DOC-to-DN ratios were lower in high- and medium-N GN (6.8 ± 1.3) and TM (10.7 ± 2.2) than the low-N RS (12.1 ± 2.7) and DP (14.1± 3.6).

3.2. Relationships of DOM with Chemical Composition of Organic Residues and Soil Microbial Parameters at Various Decomposition Stages

Dissolved organic C concentrations only exhibited a significant negative relationship with residue cellulose in week 52 (r = −0.641 *) (Table 4). Dissolved N concentrations were positively correlated with residue N contents in weeks 2 (r = 0.728 **) and 8 (r = 0.762 **) after residue application, but negatively correlated with the C-to-N ratio (r = −0.751 ** and −0.778 **, in weeks 2 and 8, respectively) (Table 4). The negative correlations of DN with residue cellulose (r = −0.610 *) and the lignin-to-N ratio (r = −0.647 *) were found during week 8. The DOC-to-DN ratios were negatively correlated to residue N concentrations during weeks 2 (r = −0.655 *) and 8 (r = −0.586 *). The DOC-to-DN ratio during week 2 was positively correlated to the C-to-N (r = 0.728 **) and lignin-to-N (r = 0.662 *) ratios of the organic residues. The positive correlation of the DOC-to-DN ratio with residue cellulose (r = 0.652 *) was found during week 8 after organic residue application (Table 4).
Dissolved organic C did not influence any soil microbial parameter throughout the decomposition stages (data not shown). However, DN did have a moderate to strong positive influence on soil microbial parameters during the early decomposition stage (week 2 after organic residue application). DN concentrations pooled from different treatments showed positive relationships with microbial respiration (CO2-C evolution) (R2 = 0.569, p = 0.015) (Figure 3a), microbial biomass N (MBN) (R2 = 0.683, p = 0.003) (Figure 3b), and the microbial metabolic quotient (qCO2) (R2 = 0.547, p = 0.019) (Figure 3c). As decomposition continued to the mid (week 8) and late (week 52) stages, concentrations of DN showed a weak influence on microbial parameters (data not shown). Regarding the DOC-to-DN ratio, the significant influence was also found in the early stage in the form of negative influence on qCO2 (R2 = 0.375, p = 0.026) (Figure 4).

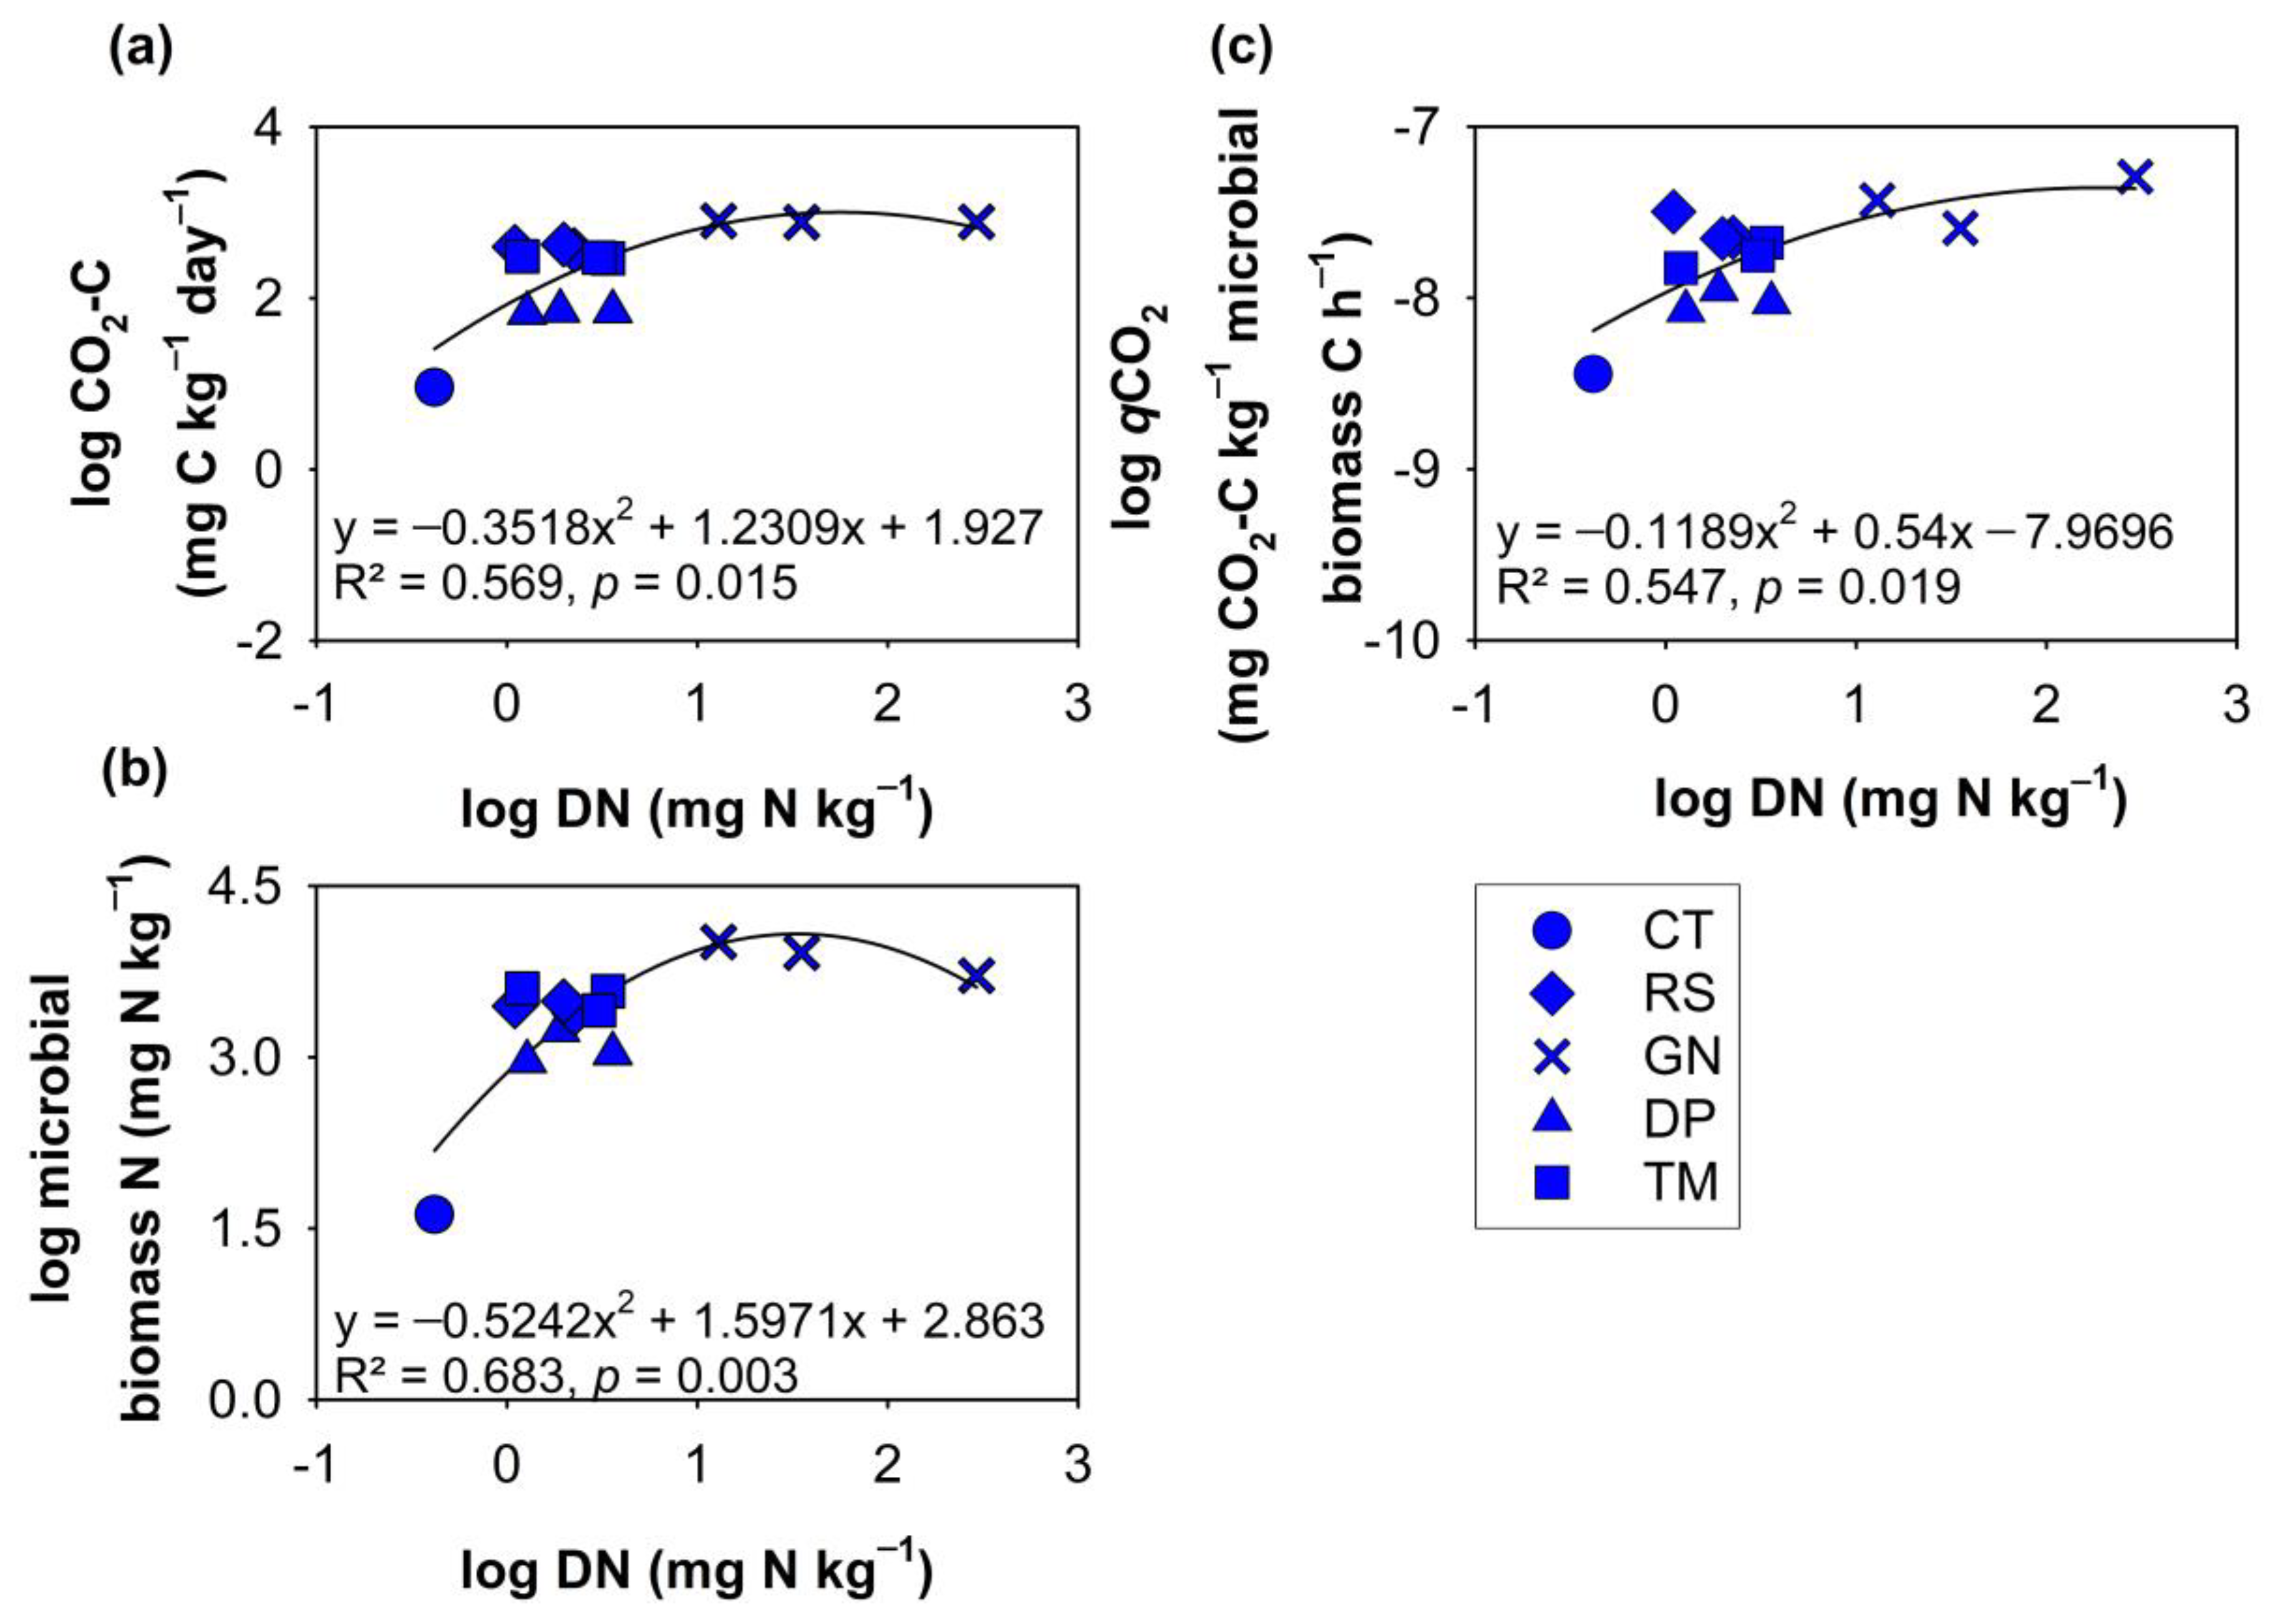
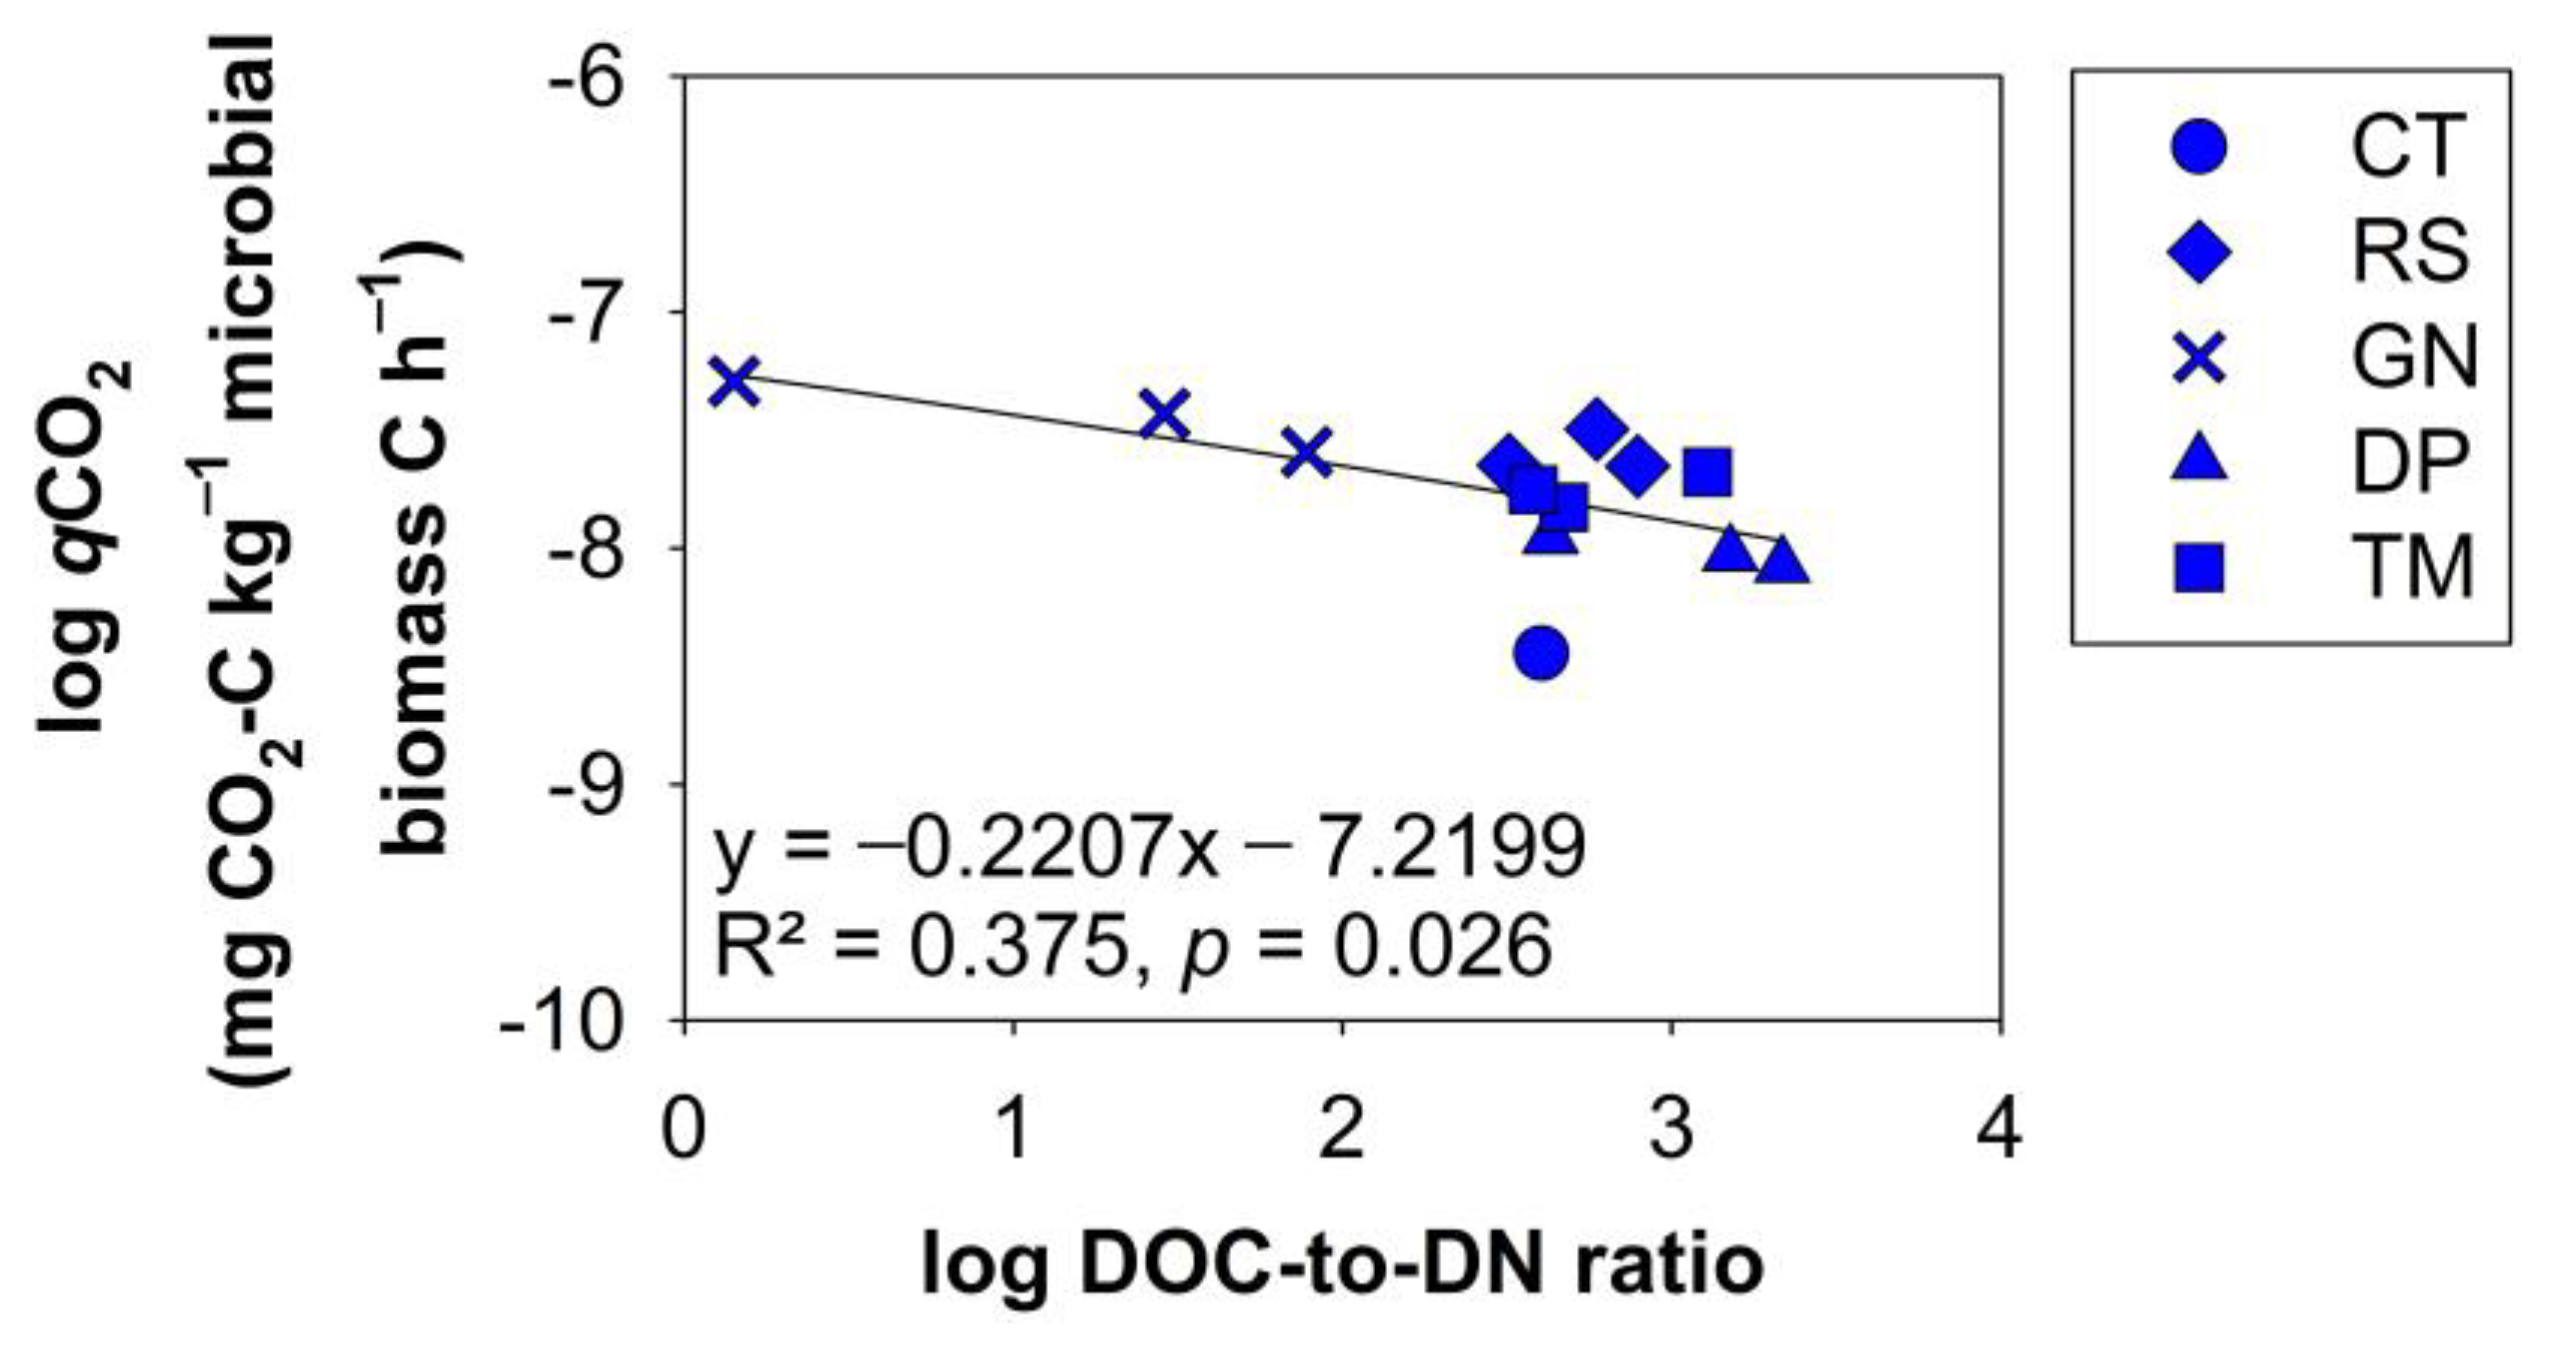
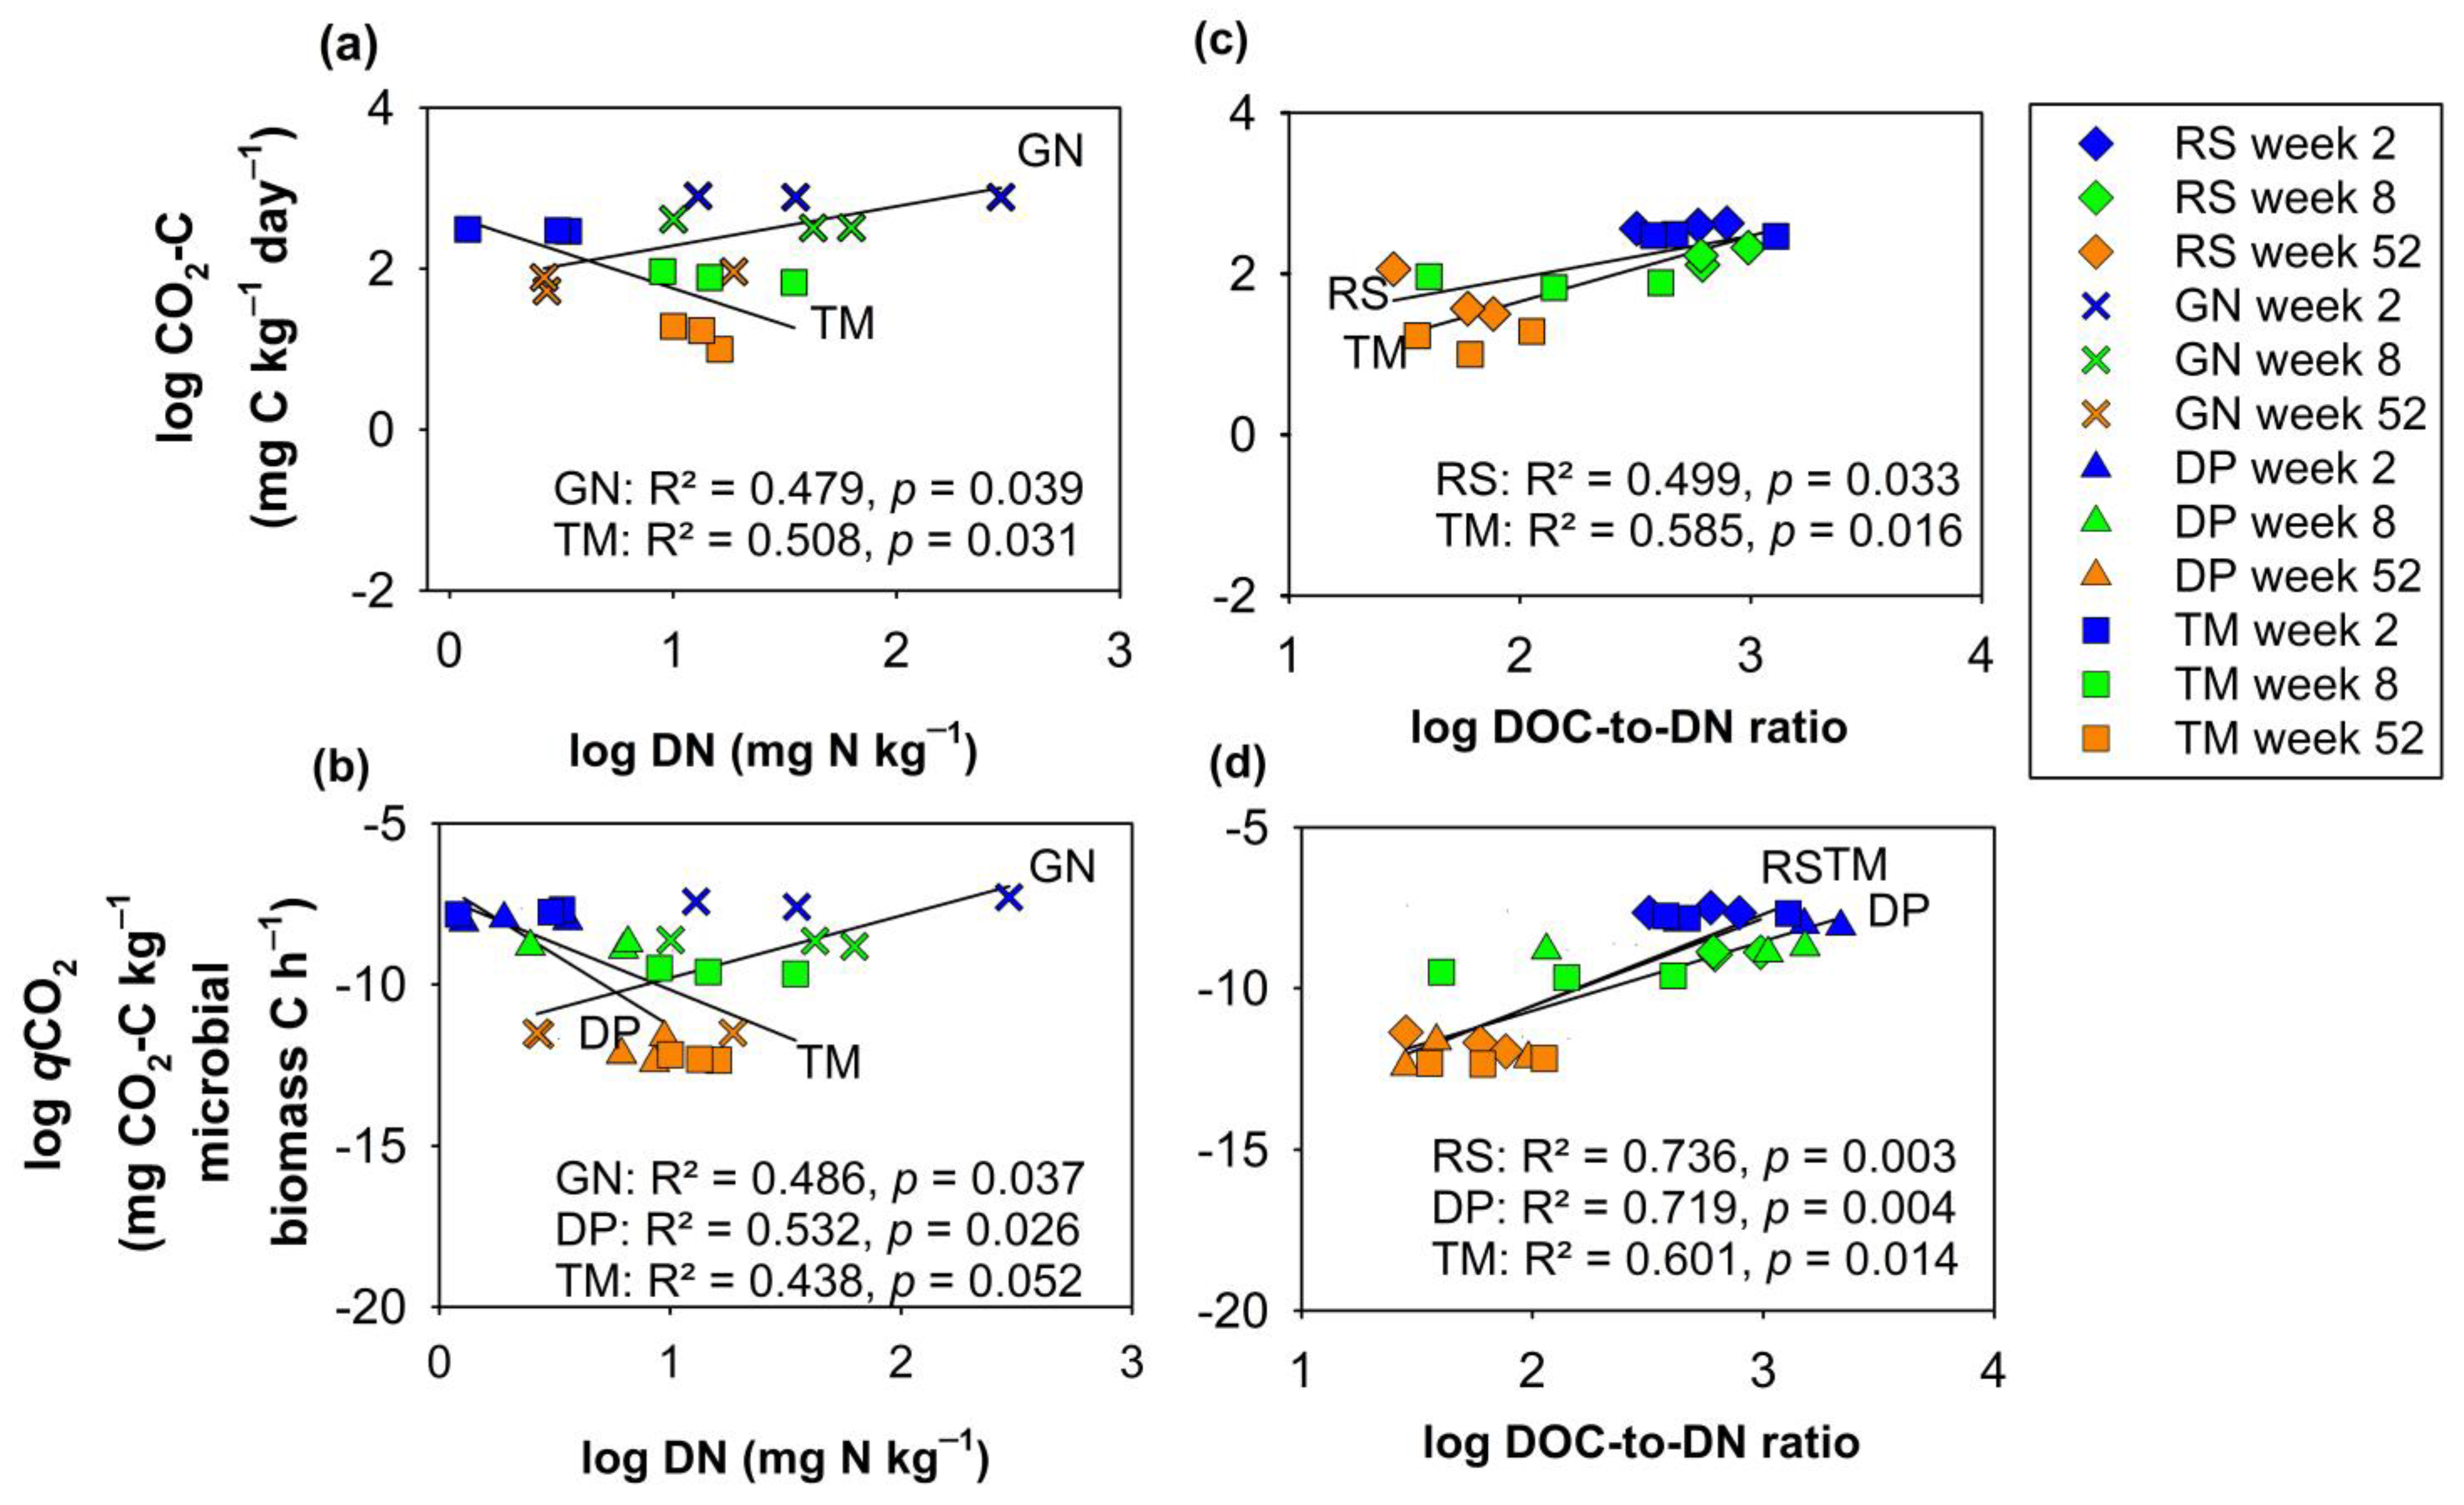
3.3. The Influence of DOM Produced by Each Chemical Quality Class (Residue) on Soil Microbial Processing

No influence of DOC was found under each chemical quality class or residue treatment (data not shown). However, DN and DOC-to-DN ratios of various residues showed significant medium to strong influences on soil microbial parameters, indicating C loss (CO2-C) and retention (qCO2 the inverse of CUE) in soil systems (Figure 5). These include a positive influence of DN on CO2-C under GN (R2 = 0.479, p = 0.039) and a negative influence under TM (R2 = 0.508, p = 0.031) (Figure 5a). A positive influence of DN on qCO2 was exhibited by GN (R2 = 0.486, p = 0.037), whereas negative influences were found under DP (R2 = 0.532, p = 0.026) and TM (R2 = 0.438, p = 0.052) (Figure 5b). The DOC-to-DN ratio significantly influenced various soil microbial parameters as follows. It had positive influences on CO2-C evolution under RS (R2 = 0.499, p = 0.033) and TM (R2 = 0.585, p = 0.016) (Figure 5c). Furthermore, the DOC-to-DN ratios had strong positive influences on qCO2 under RS (R2 = 0.736, p = 0.003), DP (R2 = 0.719, p = 0.004) and TM (R2 = 0.601, p = 0.014) (Figure 5d).

4. Discussion

4.1. Organic Residues Are the Main Source of DOC

That organic residues are the main source of DOC was revealed by our results obtained from the organic residue-treated soils (Figure 1a). These results corroborate those of De Troyer et al. [2] and Mariano et al. [6]. Although in organic soils, such as mor layer of podzol, native SOM can be an important source of DOM [33], the sandy soil used in our study is intrinsically low in initial SOM (3.6 g kg−1) [24] so this initial SOM did not contribute significantly to the production of DOM.

4.2. Changes in DOC and DN Concentrations in Soils during Decomposition of Applied Contrasting Quality Class of Organic Residues Indicate the Biological Function and the Interaction of DOC and DN

The temporal changes of DOC and DN manifested themselves in dramatic decreases in DOC (Figure 1b) and DN (Figure 2a) during the early stage of decomposition (first 2 weeks after residue incorporation), indicating microbial consumption. These DOC and DN originated from the labile constituents of the residues, i.e., non-structural compounds [8], such as carbohydrates, polysaccharides, amino sugars, and proteins [34] as well as labile structural compounds, such as cellulose [8,28]. The labile DOC as an easily available energy source has prompted microbial respiration and microbial growth [2,3,4]. Our findings also indicate that the easily accessible N components in DN serve as microbial substrates, suggesting the utilization of DN by microbes. This was verified by the positive influence of DN on soil microbial activities (CO2-C evolution), and growth (MBN), and C use efficiency (CUE) (as indicated by the qCO2 index) during the early stage (week 2) (Figure 3). These results align with earlier studies [5,6,7,23]. The consumption of readily available DN by microbes caused decreases in DN during the early decomposition stage in our study, as was shown earlier by Mariano et al. [6], who found rapid microbial use of DON during the early stage (7 days) in soil from sugarcane fields, resulting in high microbial CUE. The higher relative decreases in DN during the early stage of week 2 (as % initial stage of week 0) that was observed under low-quality class residues (lower N), RS followed by TM, and DP, than occurred under high-quality class, N-rich GN, were caused by higher microbial N demands under long-term input of these low-N residues. The finding that DN production was higher in N-rich GN (Figure 2a) is supported by strong positive correlations of the initial residue N with DN and negative correlations of initial residue C-to-N ratio with DN during week 2 (Table 4) which showed that N was less limited than those in RS, DP and TM treated soils [9].
During the early stage of decomposition, DOC and DN interacted with each other exerting their biological function to the soil microbes. The effect on the soil microbes was substantiated by our critical finding of the negative influence of the DOC-to-DN ratio on microbial qCO2—in other words, the positive influence of the ratio on microbial C use efficiency (CUE)—occurring only during the early stage (Figure 4). This suggests that the interaction between DOC and DN plays a role in shaping their availability to microbes, subsequently influencing microbial CUE. Hence, the DOC-to-DN ratio could be an indicator of C [12] and N [35] abundance or limitation for microbes which influence soil microbial CUE [7,35].
A notable rise in DOC concentrations across all residue treatments (Figure 1b), as well as increases in DN in the low-quality class (lower-N) residues, TM, RS and DP (Figure 2a) were found during the mid stage of decomposition (week 8). The increases were primarily due to the generation of stable compound constituents for DOC [8] and DON [23]. Conversely, the production of DOC with labile constituents became less pronounced at this stage, consistent with previous findings [2,23,28]. The increases in the production of ‘stable’ DOC during the later stage of residue decomposition was attributed to lignin degradation [20] associated with the occurrence of microbial secondary compounds [8]. The DOC at the later stage displayed the characteristics of being more stable and microbial derived, than it did in the initial stage [36]. The presence of microbial-derived compounds, such as protein, lipids, polysaccharides, and aromatics in SOM originated from the application of plant-derived DOC is further evidence that DOC underwent microbial processing [13]. Our study on DOC molecular structure from the same DOC samples as those used in the current study has shown that the origin of the polysaccharides in DOC changed from plant- to microbial-derived as decomposition progressed from week 2 to week 8 [37]. Among the lower-quality class (lower-N) residues, TM had the highest and significant DN increase from week 2 to week 8 (Figure 2a), indicating that TM led to the higher production of DN with stable constituents, such as aromatic N compounds, as was shown earlier by [23]. That there is a positive correlation between N contents in the residues and DN concentrations supports these findings (Table 4). Another factor causing the increases in DN during week 8 was the slower decomposition rates, especially under lignin-rich DP and TM [19], which led to the delayed DN release as compared to the high- quality class residue (high-N, lower-lignin) GN. Negative correlations between the ratios of C-to-N and L-to-N of residues at the time of application with DN during this stage (Table 4) support this finding. That TM was second to GN in DN production supports our first hypothesis, implying that these higher-N residues supplied a larger amount of DN to microbes than the lower-N RS and DP.
The lowest level of DOC production across all residues (Figure 1b), which occurred during the late stage (week 52), was due to the degradation of the remaining lignin and lignin-protected cellulose. Lignin and lignin-protected cellulose in the decomposing litters were found to be continuously used during the late stage, although they provided only low amounts of energy [8]. The negative relationship of cellulose with DOC concentrations during the late stage (Table 4) further confirmed that residue cellulose did not enhance DOC production during this stage. Regarding DN, microbes continued to utilize it consistently during the later stage of decomposition (after week 8 until week 52), particularly under the N-rich GN treatment, resulting in a significant decline in DN concentrations (Figure 2a).
The biological function of DN and the DOC-to-DN ratio as indicated by their influences on microbial processing appears to be strongest during the early stage of decomposition after which the influence became weaker. The availability of labile substrates during this early stage led to high microbial growth and activities which corroborate the results of Cotrufo et al. [3] which showed that during the early stage the DOM-microbial pathway was in operation. This pathway describes the high bioavailability leading to rapid loss of non-structural compounds of decomposing residue. The loss of non-structural compounds was linearly related to the rate of DOC production. In contrast, during the later stage the labile compounds were mostly exhausted while the recalcitrant compounds were more available which did not lead to a high rate of microbial processing [3].

4.3. Contrasting Chemical Quality Classes of Organic Residues Have Different Influences on Soil Micro-Bial Processing

Among the different residue quality classes, the high-quality N-rich GN produced abundant DN (Figure 2a), leading to its strong positive influence on CO2-C evolution and microbial qCO2 (Figure 5a,b), whereas the lower DN production by TM had a negative influence on microbial CO2-C and qCO2 (Figure 5a,b). Although the N-rich GN produced higher available DN than medium-N TM, this did not translate into higher CUE (as indicated by higher qCO2) under GN than TM. This low CUE under GN indicates that its high DN availability brought about higher microbial CO2-C loss with less C retained in microbial biomass, resulting in high qCO2 (or low CUE) compared with TM. These results support our second hypothesis. Under TM, DN was used by microbes more efficiently than GN. In contrast to GN, the N-poor residue DP had a negative influence of DN on qCO2, following that of medium-N TM (Figure 5b). This implies that CUE increased with increasing DN as was the case under the low-N DP and medium-N TM residues. The DOC-to-DN ratios of medium-N TM and low-N RS and DP residues which had positive influences on CO2-C and qCO2 (Figure 5c,d) indicate the influence on microbial processes of the balanced/imbalanced stoichiometry of DOC and DN under these residues.
Among the different quality class residues during the early stage (week 2), the higher DOC-to-DN ratio under lower-N residues, RS, DP, and TM, (15.4 ± 1.7, 22.0 ± 4.2, and 16.7 ± 2.9, respectively) than that of MBC-to-MBN, i.e., approximately 5–6 [19] showed that there were large disparities between the C-to-N ratios of substrates and microbes, leading to their stoichiometric imbalances of nutrients C and N [7,9,12]. The imbalance/balance of C and N stoichiometry of organic substrates determined their availability for microbes [38]. The stoichiometric imbalances under the lower-N residues led to their having lower qCO2 (higher CUE) than under N-rich GN. GN had no disparity between its DOC-to-DN ratio (4.0 ± 1.6) and the microbial C-to-N ratio, i.e., approximately 4 [19]. Having a large disparity between the elemental stoichiometry of the substrates and microbial biomass was proposed by Manzoni et al. [39,40] and Sinsabaugh et al. [41] to decrease microbial CUE [12]. During the mid stage (week 8), TM replaced GN in having the lowest DOC-to-DN ratio (9.1 ± 2.5) as compared to GN, RS, and DP (10.2 ± 0.9, 17.4 ± 1.2, and 17.5 ± 4.9, respectively). The larger disparity between the aforementioned DOC-to-DN ratios and microbial biomass of the latter three residues, i.e., approximately 3.3, 4.0, and 4.5, respectively, led to their having a higher qCO2 (lower CUE) than TM [19] (Table 2).
Regarding the factor of residue quality, the positive relationships of cellulose and ratios of C-to-N and lignin-to-N with the DOC-to-DN ratio and the negative relationship of N with the DOC-to-DN ratio were found only in the early and mid stages (weeks 2 and 8) (Table 4). This shows that residue cellulose and N are the principal factors which influence the DOC-to-DN ratio in opposite directions. Furthermore, residue N interacted with residue C, especially resistant C compounds (lignin), to influence the DOC-to-DN ratio. This shows that these pertinent chemical quality parameters have a significant influence on DOC-and-DN stoichiometry and their biological function in the earlier stages of decomposition.
The DOC-to-DN ratio indicates whether C or N are deficient or abundant with respect to microbial demands and is an indicator of microbial C or N limitation [12,35]. GN did not significantly influence the DOC-to-DN ratio on any microbial processes, i.e., CO2-C loss and qCO2. GN brought about high availability of DN which lowered the production of DOC due to increased respiration. This can be seen not only in the high CO2-C production under GN [19] (Table 2), but also in other N-rich residues like alfalfa and oats [8,42]. High N availability in the soil environment receiving continuous application of N-rich GN results in C limitation, which stimulates synthesis of hydrolytic enzymes to catalyze C compounds [43]. An earlier study under the same long-term experiment on soil hydrolytic enzymes which catalyze C compounds, i.e., β-glucosidases, showed that GN treated soil had higher activities of this enzyme than the low-N residues, RS and DP [44]. The lower DOC-to-DN ratio of GN (6.8 ± 2.6 average value) than TM (10.7 ± 2.2) corresponded with higher qCO2 (lower microbial CUE) of the former than the latter residues [19] (Table 2). GN, hence, had imbalanced DOC-and-DN stoichiometry in the direction of low DOC but high DN availability, leading to a low DOC-to-DN ratio. The imbalanced DOC-and-DN stoichiometry of microbial substrates implies that microbes must invest their N and energy via the production of degradative extracellular enzymes, and therefore decrease their CUE [12,45]. The imbalanced DOC-and-DN stoichiometry under GN ultimately led to its low CUE which is contradictory to earlier findings under N-rich organic residues, i.e., sugarcane mill mud [7] and N-rich soil under grassland vegetation [12], which had balanced DOC-and-DN stoichiometry. TM had more balanced DOC-and-DN stoichiometry than GN, leading to higher CUE under TM.
Under the imbalanced DOC-and-DN stoichiometry, microbes need to mine SOM for C or N, resulting in an increased priming effect [9]. The application of GN residue has been demonstrated to increase the priming effect as well as total MBC (largely from residue-derived MBC) relative to lower-N RS or the mixture of GN + RS [46]. The phenomenon of increases in the priming effect and total MBC is termed ‘microbial co-metabolism’ [47] which occurs when addition of organic litter to C- or N-limited soils stimulates the increases in SOM mineralization, microbial biomass, DOM and degradative enzymes [48].
The medium-N TM had a lower average DOC-to-DN ratio (10.7 ± 2.2) than the low-N RS and DP (12.1 ± 2.7 and 14.1 ± 3.6, respectively), which corresponded to lower qCO2 or higher CUE of the former than the latter residue during the later decomposition stages (weeks 8 and week 52) (Table 2). These results further confirm our second hypothesis. Our results corroborate those pertaining to grassland soils receiving fertilizers from South Africa, the USA and the UK which all showed a negative relationship of the DOC-to-DN ratios and CUE [12]. These findings indicated that the organic C-to-N ratios of substrate relative to that of the microbes or the stoichiometry of the substrates are a key factor influencing C retention in microbial biomass relative to C loss as CO2 or CUE. The DOC-to-DN ratio of sugarcane mill mud (8.3) was found to have more balanced DOC-and-DN stoichiometry and higher CUE than the higher DOC-to-DN ratio sugarcane bagasse (12.1) and sorghum stubble (28.4) as revealed by Fang et al. [7]. Based on these findings, it can be concluded that TM had stoichiometric balance of DOC-and-DN, leading to less N limitation as compared with RS and DP. The use of inorganic fertilizers to supplement the low-N residues is one way to rectify the imbalanced C-and-N stoichiometry of the substrates and hence rectifying N limitation [35].
The balanced DOC-and-DN stoichiometry under TM in our current study corresponded with higher microbial CUE and higher C accumulation in the sandy soil matrix especially in soil microaggregates, than was found under GN, RS, and DP in the same long-term experiment of the same year [18,20]. The SOM accumulation fits the framework of the DOM-microbial pathway of MEMS (microbial efficiency mineral stabilization) proposed by Cotrufo et al. [20]. In contrast to TM, we have demonstrated that repeated application over the long term of the high-N GN resulted in C loss as CO2 which was stimulated by the resulting high DN production bringing about high N bioavailability. This counter mechanism worked against the mechanisms underlying SOC formation associated with microbial synthesis, namely regulatory N effect and SOC stabilization possessed by N-rich GN as proposed by Kunlanit et al. [18] working on the same long-term experiment of the same year.

5. Conclusions

Our results support the hypotheses as they showed that high- and low-quality class residues (high and low N, respectively) brought about imbalanced DOC-and-DN stoichiometry, which led to C and N limitation, respectively, resulting in low microbial CUE. In contrast, medium-quality class residues (medium N and lignin) brought about balanced DOC-and-DN stoichiometry, leading to high microbial CUE.
Our study has produced a novel finding that balanced/imbalanced DOC-and-DN stoichiometry, in addition to the initial chemical quality of the organic residues applied to soil, controls microbial processing. Similar-quality organic residues can result in different microbial processing, e.g., microbial CUE, depending on the resulting balanced/imbalanced DOC-and-DN stoichiometry. Our findings have important implications for soil nutrient management via the application of organic material and inorganic fertilizer. Selection of the appropriate inputs to improve soil quality requires careful consideration of the resulting changes in DOC-and-DN stoichiometry. These modifications can influence microbial processing, such as CUE. In turn, the altered microbial CUE affects SOM accumulation and the availability of C and N in the soil.

Supplementary Materials

The following supporting information can be downloaded at: https://www.mdpi.com/article/10.3390/soilsystems8010028/s1, Table S1 Comparison of DOC determination between the techniques non-purgeable organic carbon (NPOC) and total organic carbon (TOC) by difference.

Author Contributions

Conceptualization, P.V. and R.P.; methodology, P.V. and R.P.; software, R.P.; validation, P.V. and R.P; formal analysis, R.P.; investigation, P.V. and R.P.; resources, P.V.; data curation, R.P.; writing—original draft preparation, P.V. and R.P.; writing—review and editing, P.V., F.R. and B.K.; visualization, R.P.; supervision, P.V.; project administration, P.V.; funding acquisition, P.V. All authors have read and agreed to the published version of the manuscript.

Funding

This research was funded by The Royal Golden Jubilee (RGJ) Ph.D. Program under the Thailand Research Fund (TRF) (grant no. PHD/0202/2557) for the first author’s doctoral research, the TRF Basic Research Programs-project code BRG5880018 and the National Research Council of Thailand (NRCT)’s grants to Khon Kaen University (KKU) FY 2017 Grant number 601201 and FY 2018 Grant number 61004001.

Institutional Review Board Statement

Not applicable.

Informed Consent Statement

Not applicable.

Data Availability Statement

Data are availability upon request to the corresponding author.

Acknowledgments

Essential information on soil microbiological properties pertaining to the long-term soil organic matter experiment in Khon Kaen, Thailand was provided by Aunnop Puttaso. Editorial assistance by A. Terry Rambo is greatly appreciated.

Conflicts of Interest

The funders had no role in the design of the study; in the collection, analyses, or interpretation of data; in the writing of the manuscript; or in the decision to publish the results.

References

  1. Krull, E.S.; Skjemstad, J.O.; Baldock, J.A. Functions of Soil Organic Matter and the Effect on Soil Properties; Cooperative Research Centre for Greenhouse Accounting, Glen Osmond SA: Canberra, Australia, 2004; p. 129. [Google Scholar]
  2. De Troyer, I.; Amery, F.; Van Moorleghem, C.; Smolders, E.; Merckx, R. Tracing the Source and Fate of Dissolved Organic Matter in Soil after Incorporation of a 13C Labelled Residue: A Batch Incubation Study. Soil Biol. Biochem. 2011, 43, 513–519. [Google Scholar] [CrossRef]
  3. Cotrufo, M.F.; Soong, J.L.; Horton, A.J.; Campbell, E.E.; Haddix, M.L.; Wall, D.H.; Parton, W.J. Formation of Soil Organic Matter via Biochemical and Physical Pathways of Litter Mass Loss. Nat. Geosci. 2015, 8, 776–779. [Google Scholar] [CrossRef]
  4. Zhang, Y.; Liu, Q.; Zhang, W.; Wang, X.; Mao, R.; Tigabu, M.; Ma, X. Linkage of Aggregate Formation, Aggregate-Associated C Distribution, and Microorganisms in Two Different-Textured Ultisols: A Short-Term Incubation Experiment. Geoderma 2021, 394, 114979. [Google Scholar] [CrossRef]
  5. Ghani, A.; Sarathchandra, U.; Ledgard, S.; Dexter, M.; Lindsey, S. Microbial Decomposition of Leached or Extracted Dissolved Organic Carbon and Nitrogen from Pasture Soils. Biol. Fertil. Soils. 2013, 49, 747–755. [Google Scholar] [CrossRef]
  6. Mariano, E.; Jones, D.L.; Hill, P.W.; Trivelin, P.C.O. Mineralisation and Sorption of Dissolved Organic Nitrogen Compounds in Litter and Soil from Sugarcane Fields. Soil Biol. Biochem. 2016, 103, 522–532. [Google Scholar] [CrossRef]
  7. Fang, Y.; Singh, B.P.; Collins, D.; Armstrong, R.; Van Zwieten, L.; Tavakkoli, E. Nutrient Stoichiometry and Labile Carbon Content of Organic Amendments Control Microbial Biomass and Carbon-Use Efficiency in a Poorly Structured Sodic-Subsoil. Biol. Fertil. Soils 2020, 56, 219–233. [Google Scholar] [CrossRef]
  8. Soong, J.L.; Parton, W.J.; Calderon, F.; Campbell, E.E.; Cotrufo, M.F. A New Conceptual Model on the Fate and Controls of Fresh and Pyrolized Plant Litter Decomposition. Biogeochemistry 2015, 124, 27–44. [Google Scholar] [CrossRef]
  9. Abdalla, K.; Sun, Y.; Zarebanadkouki, M.; Gaiser, T.; Seidel, S.; Pausch, J. Long-Term Continuous Farmyard Manure Application Increases Soil Carbon When Combined with Mineral Fertilizers Due to Lower Priming Effects. Geoderma 2022, 428, 116216. [Google Scholar] [CrossRef]
  10. Bucka, F.B.; Kölbl, A.; Uteau, D.; Peth, S.; Kögel-Knabner, I. Organic Matter Input Determines Structure Development and Aggregate Formation in Artificial Soils. Geoderma 2019, 354, 113881. [Google Scholar] [CrossRef]
  11. Mooshammer, M.; Wanek, W.; Zechmeister-Boltenstern, S.; Richter, A. Stoichiometric Imbalances between Terrestrial Decomposer Communities and Their Resources: Mechanisms and Implications of Microbial Adaptations to Their Resources. Front. Microbiol. 2014, 5, 22. [Google Scholar] [CrossRef]
  12. Widdig, M.; Schleuss, P.M.; Biederman, L.A.; Borer, E.T.; Crawley, M.J.; Kirkman, K.P.; Seabloom, E.W.; Wragg, P.D.; Spohn, M. Microbial Carbon Use Efficiency in Grassland Soils Subjected to Nitrogen and Phosphorus Additions. Soil Biol. Biochem. 2020, 146, 107815. [Google Scholar] [CrossRef]
  13. Kallenbach, C.M.; Frey, S.D.; Grandy, A.S. Direct Evidence for Microbial-Derived Soil Organic Matter Formation and Its Ecophysiological Controls. Nat. Commun. 2016, 7, 13630. [Google Scholar] [CrossRef] [PubMed]
  14. Cotrufo, M.F.; Lavallee, J.M. Soil Organic Matter Formation, Persistence, and Functioning: A Synthesis of Current Understanding to Inform Its Conservation and Regeneration. In Advances in Agronomy, 1st ed.; Elsevier Inc.: Amsterdam, The Netherlands, 2022; Volume 172. [Google Scholar] [CrossRef]
  15. Swift, M.J.; Heal, O.W.; Anderson, J.M.; Anderson, J.M. Decomposition in Terrestrial Ecosystems; Blackwell Scientific Publications: Oxford, UK, 1979; p. 372. [Google Scholar]
  16. Palm, C.A.; Gachengo, C.N.; Delve, R.J.; Cadisch, G.; Giller, K.E. Organic Inputs for Soil Fertility Management in Tropical Agroecosystems: Application of an Organic Resource Database. Agric. Ecosyst. Environ. 2001, 83, 27–42. [Google Scholar] [CrossRef]
  17. Puttaso, A.; Vityakon, P.; Rasche, F.; Saenjan, P.; Treloges, V.; Cadisch, G. Does Organic Residue Quality Influence Carbon Retention in a Tropical Sandy Soil? Soil Sci. Soc. Am. J. 2013, 77, 1001–1011. [Google Scholar] [CrossRef]
  18. Kunlanit, B.; Vityakon, P.; Puttaso, A.; Cadisch, G.; Rasche, F. Mechanisms Controlling Soil Organic Carbon Composition Pertaining to Microbial Decomposition of Biochemically Contrasting Organic Residues: Evidence from MidDRIFTS Peak Area Analysis. Soil Biol. Biochem. 2014, 76, 100–108. [Google Scholar] [CrossRef]
  19. Puttaso, A.; Vityakon, P.; Saenjan, P.; Cadisch, G. Relationship between Residue Quality, Decomposition Patterns, and Soil Organic Matter Accumulation in a Tropical Sandy Soil after 13 Years. Nutr. Cycl. Agroecosyst. 2011, 89, 159–174. [Google Scholar] [CrossRef]
  20. Cotrufo, M.F.; Wallenstein, M.D.; Boot, C.M.; Denef, K.; Paul, E. The Microbial Efficiency-Matrix Stabilization (MEMS) Framework Integrates Plant Litter Decomposition with Soil Organic Matter Stabilization: Do Labile Plant Inputs Form Stable Soil Organic Matter? Glob. Chang. Biol. 2013, 19, 988–995. [Google Scholar] [CrossRef]
  21. Xu, X.; Schimel, J.P.; Janssens, I.A.; Song, X.; Song, C.; Yu, G.; Sinsabaugh, R.L.; Tang, D.; Zhang, X.; Thornton, P.E. Global Pattern and Controls of Soil Microbial Metabolic Quotient. Ecol. Monogr. 2017, 87, 429–441. [Google Scholar] [CrossRef]
  22. Li, J.; Sang, C.; Yang, J.; Qu, L.; Xia, Z.; Sun, H.; Jiang, P.; Wang, X.; He, H.; Wang, C. Stoichiometric Imbalance and Microbial Community Regulate Microbial Elements Use Efficiencies under Nitrogen Addition. Soil Biol. Biochem. 2021, 156, 108207. [Google Scholar] [CrossRef]
  23. Kiikkilä, O.; Smolander, A.; Kitunen, V. Degradability, Molecular Weight and Adsorption Properties of Dissolved Organic Carbon and Nitrogen Leached from Different Types of Decomposing Litter. Plant Soil 2013, 373, 787–798. [Google Scholar] [CrossRef]
  24. Vityakon, P.; Meepech, S.; Cadisch, G.; Toomsan, B. Soil Organic Matter and Nitrogen Transformation Mediated by Plant Residues of Different Qualities in Sandy Acid Upland and Paddy Soils. NJAS-Wagening. J. Life Sci. 2000, 48, 75–90. [Google Scholar] [CrossRef]
  25. Anderson, J.P.E. Agronomy monograph number 9, part II. In Chemical and Biological Properties; American Society of Agronomy and Soil Science Society of America: Madison, WI, USA, 1982; pp. 831–871. [Google Scholar]
  26. Amato, M.; Ladd, J.N. Assay for microbial biomass based on ninhydrin-reactive nitrogen in extracts of fumigated soils. Soil Biol. Biochem. 1988, 20, 107–114. [Google Scholar] [CrossRef]
  27. Anderson, T.H.; Domsch, K.H. Carbon link between microbial biomass and soil organic matter. In Perspectives in Microbial Ecology, Proceedings of the 4th International Symposium on Microbial Ecology, Ljubljana, Slovenia, 24–29 August 1986; Slovene Society for Microbiology: Ljubljana, Slovenia, 1986; pp. 467–471. [Google Scholar]
  28. Kunlanit, B.; Rasche, F.; Puttaso, A.; Cadisch, G.; Vityakon, P. Vertical Dynamics of Dissolved Organic Carbon in Relation to Organic Input Quality and Microaggregate Formation in a Coarse–Textured Ultisol. Eur. J. Soil Sci. 2020, 71, 459–471. [Google Scholar] [CrossRef]
  29. Cook, S.; Peacock, M.; Evans, C.D.; Page, S.E.; Whelan, M.; Gauci, V.; Khoon, K.L. Cold Storage as a Method for the Long-Term Preservation of Tropical Dissolved Organic Carbon (DOC). Mires Peat 2016, 18, 1–8. [Google Scholar] [CrossRef]
  30. Bowering, K.L.; Edwards, K.A.; Wiersma, Y.F.; Billings, S.A.; Warren, J.; Skinner, A.; Ziegler, S.E. Dissolved Organic Carbon Mobilization Across a Climate Transect of Mesic Boreal Forests Is Explained by Air Temperature and Snowpack Duration. Ecosystems 2023, 26, 55–71. [Google Scholar] [CrossRef]
  31. Fellman, J.B.; D’Amore, D.V.; Hood, E.; Boone, R.D. Fluorescence Characteristics and Biodegradability of Dissolved Organic Matter in Forest and Wetland Soils from Coastal Temperate Watersheds in Southeast Alaska. Biogeochemistry 2008, 88, 169–184. [Google Scholar] [CrossRef]
  32. Wallace, B.; Purcell, M.; Furlong, J. Total organic carbon analysis as a precursor to disinfection byproducts in potable water: Oxidation technique considerations. J. Environ. Monit. 2002, 4, 35–42. [Google Scholar] [CrossRef]
  33. Laurén, A.; Lappalainen, M.; Saari, P.; Kukkonen, J.V.K.; Koivusalo, H.; Piirainen, S.; Setälä, H.; Sarjala, T.; Bylund, D.; Heinonen, J.; et al. Nitrogen and Carbon Dynamics and the Role of Enchytraeid Worms in Decomposition of L, F and H Layers of Boreal Mor. Water. Air. Soil Pollut. 2012, 223, 3701–3719. [Google Scholar] [CrossRef]
  34. Marschner, B.; Kalbitz, K. Controls of Bioavailability and Biodegradability of Dissolved Organic Matter in Soils. Geoderma 2003, 113, 211–235. [Google Scholar] [CrossRef]
  35. Schleuss, P.M.; Widdig, M.; Biederman, L.A.; Borer, E.T.; Crawley, M.J.; Kirkman, K.P.; Seabloom, E.W.; Wragg, P.D.; Spohn, M. Microbial Substrate Stoichiometry Governs Nutrient Effects on Nitrogen Cycling in Grassland Soils. Soil Biol. Biochem. 2021, 155, 108168. [Google Scholar] [CrossRef]
  36. Kalbitz, K.; Schwesig, D.; Schmerwitz, J.; Kaiser, K.; Haumaier, L.; Glaser, B.; Ellerbrock, R.; Leinweber, P. Changes in Properties of Soil-Derived Dissolved Organic Matter Induced by Biodegradation. Soil Biol. Biochem. 2003, 35, 1129–1142. [Google Scholar] [CrossRef]
  37. Poosathit, R.; Vityakon, P.; Kunlanit, B.; Rasche, F. Molecular Structure of Dissolved Organic Carbon in a Sandy Soil Receiving Contrasting Quality Organic Residues. Geoderma 2023, 440, 116720. [Google Scholar] [CrossRef]
  38. Mooshammer, M.; Wanek, W.; Hämmerle, I.; Fuchslueger, L.; Hofhansl, F.; Knoltsch, A.; Schnecker, J.; Takriti, M.; Watzka, M.; Wild, B.; et al. Adjustment of Microbial Nitrogen Use Efficiency to Carbon:Nitrogen Imbalances Regulates Soil Nitrogen Cycling. Nat. Commun. 2014, 5, 3694. [Google Scholar] [CrossRef]
  39. Manzoni, S.; Taylor, P.; Richter, A.; Porporato, A.; Ågren, G.I. Environmental and Stoichiometric Controls on Microbial Carbon-Use Efficiency in Soils. New Phytol. 2012, 196, 79–91. [Google Scholar] [CrossRef]
  40. Manzoni, S.; Čapek, P.; Mooshammer, M.; Lindahl, B.D.; Richter, A.; Šantrůčková, H. Optimal Metabolic Regulation along Resource Stoichiometry Gradients. Ecol. Lett. 2017, 20, 1182–1191. [Google Scholar] [CrossRef]
  41. Sinsabaugh, R.L.; Manzoni, S.; Moorhead, D.L.; Richter, A. Carbon Use Efficiency of Microbial Communities: Stoichiometry, Methodology and Modelling. Ecol. Lett. 2013, 16, 930–939. [Google Scholar] [CrossRef] [PubMed]
  42. Córdova, S.C.; Olk, D.C.; Dietzel, R.N.; Mueller, K.E.; Archontouilis, S.V.; Castellano, M.J. Plant Litter Quality Affects the Accumulation Rate, Composition, and Stability of Mineral-Associated Soil Organic Matter. Soil Biol. Biochem. 2018, 125, 115–124. [Google Scholar] [CrossRef]
  43. Rappe-George, M.O.; Choma, M.; Čapek, P.; Börjesson, G.; Kaštovská, E.; Šantrůčková, H.; Gärdenäs, A.I. Indications That Long-Term Nitrogen Loading Limits Carbon Resources for Soil Microbes. Soil Biol. Biochem. 2017, 115, 310–321. [Google Scholar] [CrossRef]
  44. Kamolmanit, B.; Vityakon, P.; Kaewpradit, W.; Cadisch, G.; Rasche, F. Soil Fungal Communities and Enzyme Activities in a Sandy, Highly Weathered Tropical Soil Treated with Biochemically Contrasting Organic Inputs. Biol. Fertil. Soils. 2013, 49, 905–917. [Google Scholar] [CrossRef]
  45. Widdig, M.; Heintz-Buschart, A.; Schleuss, P.M.; Guhr, A.; Borer, E.T.; Seabloom, E.W.; Spohn, M. Effects of Nitrogen and Phosphorus Addition on Microbial Community Composition and Element Cycling in a Grassland Soil. Soil Biol. Biochem. 2020, 151, 108041. [Google Scholar] [CrossRef]
  46. Pingthaisong, W.; Blagodatsky, S.; Vityakon, P.; Cadisch, G. Mixing Plant Residues of Different Quality Reduces Priming Effect and Contributes to Soil Carbon Retention. Soil Biol. Biochem. 2024, 188, 109242. [Google Scholar] [CrossRef]
  47. Blagodatskaya, E.; Kuzyakov, Y. Mechanisms of Real and Apparent Priming Effects and Their Dependence on Soil Microbial Biomass and Community Structure: Critical Review. Biol. Fertil. Soils 2008, 45, 115–131. [Google Scholar] [CrossRef]
  48. Zhang, Q.; Cheng, L.; Feng, J.; Mei, K.; Zeng, Q.; Zhu, B.; Chen, Y. Nitrogen Addition Stimulates Priming Effect in a Subtropical Forest Soil. Soil Biol. Biochem. 2021, 160, 108339. [Google Scholar] [CrossRef]
Figure 1. Dissolved organic C (DOC) concentration as influenced by residue quality (treatments) (a), and decomposition time (weeks) (b). Different letters indicate statistically significant differences among mean DOC concentration of treatments (a) and among decomposition stages (weeks after residue application) (b).
Soilsystems 08 00028 g001
Figure 2. Temporal changes of (a) dissolved nitrogen (DN), and (b) ratio of dissolved organic C-to-DN (DOC-to-DN) in soils during the 13th year of the experiment at 0–15 cm depth as influenced by different residue treatments and decomposition time. Error bars indicate the standard errors of the means (SEM, n = 3) unless the SEM was not available (NA) as in the cases of DN and the corresponding DOC-to-DN ratio of the control of week 2, where n = 1. The lowercase letters indicate statistically significant differences among treatments within each time interval and the uppercase letters indicate statistically significance of each treatment among the sampling times.
Soilsystems 08 00028 g002
Figure 3. Relationships of dissolved N (DN) with (a) CO2-C evolution, (b) microbial biomass N, and (c) the microbial metabolic quotient (qCO2) in soils during the early decomposition stage (week 2 after organic residue incorporation) (n = 13).
Soilsystems 08 00028 g003
Figure 4. Relationship between dissolved organic C-to-dissolved N (DOC-to-DN) ratio and the microbial metabolic quotient (qCO2) in soils during the early decomposition stage (week 2 after organic residue incorporation) (n = 13).
Soilsystems 08 00028 g004
Figure 5. Relationships of dissolved N (DN) and ratio of dissolved organic C-to-DN (DOC-to-DN) ratio with CO2-C ((a) and (c), respectively), and with qCO2 ((b) and (d), respectively) of each chemical quality class of residue during the entire decomposition period (n = 9).
Soilsystems 08 00028 g005
Table 1. Residue chemical composition and quality classes.
Treat-
Ments 1
Initial Organic Residue Quality 2Quality Class
Carbon (C)Nitrogen (N)Lignin (L)Cellulose
(CL)
C-to-N RatioL-to-N RatioLCI 3
(g kg−1)
RS3675295077860.05Low quality (low N but high CL)
GN38823681781730.28High quality (high N but low L)
DP453617530680310.37Low quality (low N but high L)
TM42714881433260.38Medium quality (medium N and L)
1 Treatments: RS = rice straw, GN = groundnut, DP = dipterocarp, and TM = tamarind. 2 Quantitative data were previously published in Puttaso et al. [19]. 3 LCI means the lignocellulose index calculated from [lignin/(lignin + cellulose)] [8].
Table 2. Previously published data employed in the present study pertaining to soil microbial characteristics under the annual application of organic residues during the 13th year of the long-term experiment.
Treat-
Ments 1
Variables Pertaining to Soil Microbial Characteristics during Different Decomposition Stages
(Weeks after Residue Application) 2
Week 2 Week 8 Week 52
CO2-CMBCMBNqCO2 CO2-C MBCMBNqCO2 CO2-CMBCMBNqCO2
CT3 ± 052 ± 76 ± 12.82 × 10⁻⁴ 4 ± 0 48 ± 96 ± 11.22 × 10⁻⁴ 3 ± 088 ± 68 ± 10.10 × 10⁻⁴
RS13 ± 0168 ± 2031 ± 15.02 × 10⁻⁴ 9 ± 1 100 ± 1126 ± 21.37 × 10⁻⁴ 6 ± 1142 ± 723 ± 10.09 × 10⁻⁴
GN18 ± 0182 ± 2949 ± 45.92 × 10⁻⁴ 13 ± 1 106 ± 932 ± 21.68 × 10⁻⁴ 6 ± 0140 ± 1227 ± 20.10 × 10⁻⁴
DP6 ± 0123 ± 622 ± 23.29 × 10⁻⁴ 9 ± 1 93 ± 322 ± 11.48 × 10⁻⁴ 4 ± 1156 ± 420 ± 20.06 × 10⁻⁴
TM12 ± 0178 ± 2134 ± 24.30 × 10⁻⁴ 8 ± 0 130 ± 320 ± 10.68 × 10⁻⁴ 3 ± 0142 ± 1025 ± 00.05 × 10⁻⁴
1 Treatments: CT = control, RS = rice straw, GN = groundnut, DP = dipterocarp, and TM = tamarind. 2 Mean values (n = 3) for all variables. Data were taken from Puttaso et al. [19]. Abbreviations: CO2-C = microbial respiration (mg C kg−1 day−1), MBC = microbial biomass C (mg C kg−1), MBN = microbial biomass N (mg N kg−1), and qCO2 = the microbial metabolic quotient (mg CO2-C kg−1 MBC h−1).
Table 3. Type III test of significance of fixed effects of the GLIMMIX model of residue quality, decomposition time and their interactions on dissolved organic C (DOC), dissolved N (DN) and their DOC-to-DN ratio. All data were log transformed before statistical analysis.
ParametersDF p-Values and Significance Levels 1
DOCDNDOC-to-DN Ratio
Pr > FPr > FPr > F
Residue quality classes (Q) 240.0273 *<0.0001 ***<0.0001 ***
Decomposition time (T) 33<0.0001 ***<0.0001 ***<0.0001 ***
Q × T120.0948 ns0.0004 ***0.0007 ***
1 *** p ≤ 0.001; * p ≤ 0.05; ns = non-significant (p > 0.05). 2 Residue quality classes includes five treatments (control (CT), rice straw (RS), groundnut (GN), dipterocarp (DP) and tamarind (TM)). 3 Decomposition time refers to four weeks including weeks 0, 2, 8 and 52.
Table 4. Pearson correlation coefficients (r) of the relationships of concentrations of dissolved organic C (DOC), dissolved N (DN) and their ratios of DOC-to-DN with initial chemical composition of the four organic residues during 2, 8, and 52 weeks after residue application (n = 12 for each time interval). All variables were log transformed.
Soil
Parameters
Time (Week)Carbon (C)Nitrogen (N)Lignin
(L)
Cellulose C-to-N
Ratio
L-to-N
Ratio
Lignocellulose Index (LCI)
DOC20.452−0.2140.397−0.0020.2670.4620.252
8−0.2710.097−0.1980.050−0.140−0.168−0.081
520.4280.3590.335−0.641 *−0.301−0.0180.530
DN2−0.2520.728 **−0.021−0.416−0.751 **−0.5630.236
8−0.2020.762 **−0.096−0.610 *−0.778 **−0.647 *0.266
520.3670.1510.279−0.393−0.1040.0960.369
DOC-to-DN ratio20.523−0.655 *0.3470.3360.728 **0.662 *−0.079
8−0.129−0.586 *−0.1410.652 *0.5630.356−0.427
52−0.0750.312−0.025−0.244−0.317−0.2540.116
*, ** mean significantly different at p ≤ 0.05 and p ≤ 0.01, respectively.
Disclaimer/Publisher’s Note: The statements, opinions and data contained in all publications are solely those of the individual author(s) and contributor(s) and not of MDPI and/or the editor(s). MDPI and/or the editor(s) disclaim responsibility for any injury to people or property resulting from any ideas, methods, instructions or products referred to in the content.

