Article

Effects of Agricultural Expansion on Soil Carbon and Nitrogen Stocks in the Amazon Deforestation Arc

by
Jorge Cardoso de Azevedo
1,2,
Abmael da Silva Cardoso
3,4,
Nauara Moura Lage Filho
1,2,5,
Cristian Faturi
1,2,
Thiago Carvalho da Silva
2,
Felipe Nogueira Domingues
6,
Vladimir Eliodoro Costa
7,
Ana Cláudia Ruggieri
4,
Ricardo Andrade Reis
4 and
Aníbal Coutinho do Rêgo
1,2,5,*
1
Institute of Veterinary Medicine, Federal University of Pará, Castanhal 68740-970, PA, Brazil
2
Institute of Health and Animal Production, Federal Rural University of Amazon, Belém 66077-830, PA, Brazil
3
Institute of Food and Agriculture Science, University of Florida, Ona, FL 33865, USA
4
Department of Animal Science, São Paulo State University, Jaboticabal 14884-900, SP, Brazil
5
Department of Animal Science, Federal University of Ceará, Fortaleza 60440-554, CE, Brazil
6
Institute of Agrarian Science, Federal University of Jequitinhonha and Mucuri Valleys, Unaí 38610-000, MG, Brazil
7
Institute of Bioscience, São Paulo State University, Botucatu 18618-689, SP, Brazil
*
Author to whom correspondence should be addressed.
Soil Syst. 2024, 8(1), 25; https://doi.org/10.3390/soilsystems8010025
Submission received: 13 November 2023 / Revised: 20 January 2024 / Accepted: 23 January 2024 / Published: 19 February 2024
(This article belongs to the Special Issue Land Use and Management on Soil Properties and Processes)

Abstract

:
Typical successions in land use affect the dynamics of carbon (C) and nitrogen (N) in the soil. This study aimed to determine the effects of land use change on soil organic carbon and N content and stocks in pastures, crops, and forests in the Amazon. Soil C and N stocks were assessed at depths of 30 and 100 cm to determine 13C isotopic abundance. The concentrations of C and N in crops were lower (p < 0.05) than those in other land use types. Soil organic C and soil N stocks for pasture (67.6, 144.8, 5.7, and 13.3) and forest (77.1, 137.5, 6.3, and 13.8) systems were similar, but greater than those of the crop area (36.4, 63.9, 3.0, and 6.0), regardless of depth (30 and 100 cm for C and N). Land use change for pastures in the Arc of Deforestation region of the Amazon maintains SOC and N stocks in the soil and is more sustainable than the agricultural system with black pepper, as long as the conditions of soil, climate, and cultivation are similar. Part of the C3-derived carbon from the forest was replaced by C4-derived C from grasses at soil depths up to 100 cm.

Graphical Abstract

1. Introduction

Vast areas of the Amazon Deforestation Arc are disturbed by selective extraction and habitat fragmentation annually [1]. In selections of trees or forests, trees with higher added value are suppressed without further disturbances in the area. The economic exploration of the Brazilian Amazon has led to several land use changes [2], with most changes occurring due to mining activities [3], illegal deforestation, productive use assurance, and land expropriation risk reduction [4]. The latter is often directly enhanced by oscillations in agricultural commodities such as wood [5] and livestock [6].
For farmers, maintaining primary forest requires costs without any economic return as these properties are usually located in isolated and difficult-to-access locations and are the target of invasions to steal trees with higher economic value. To reduce risks, producers often choose to explore such forests, even if it is against the law. In addition, until the 1990s, according to Law 7803, producers were encouraged to open at least 50% of their forests, thus guaranteeing the productive use of the land. In 2001, the regulation changed to a minimum of 80%. Therefore, changes in land use are relatively recent and have contributed to Brazil’s CO2 emissions [7]. Therefore, it is necessary to solve the environmental problem of CO2 emissions and avoid opening new areas, social land security, and economics.
The Amazon biome is a vital ecosystem that facilitates the global sequestration of CO2 [8]. Studies have estimated the soil organic (C) carbon (SOC) levels in this biome by considering different soil types, management, and land uses. A considerable amount of data has been published on soil C concentrations. However, much of this information is not associated with soil bulk density [8] and few studies have investigated the 13C abundance. In addition, some studies have investigated the SOC stock in the initial 30 cm of the soil profile [9]; however, there is a gap in the understanding of C dynamics at depths greater than 30 cm, where root systems can still develop.
The conversion of the Amazon rainforest into other cover crops is influenced by land use, crop management, soil, climate, and temperature, and these factors modulate C sequestration patterns [10,11,12]. However, the effects of these different interactions on C stocks have not yet been fully elucidated. Studies considering up to 1 m soil depth showed that when pastures replace forests, they lose approximately 17% of their C stocks with a change in land use, and approximately 41% when the land use changes range from forests to rubber plantations [8]. A meta-analysis of soils up to 30 cm deep in the Amazon biome demonstrated that, on average, stocks decreased by 8.5% for annual crops and increased by 6.8% for pastures after deforestation [3]. Evaluation of up to 30 cm of soil depth in Pará, Amazon biome, indicated that the SOC stock varies with land use and sampling site. In that study, the crop system (Elaeis guineensis), a perennial crop, presented 35–46% lower SOC stock levels than pasture and 0–18% higher levels than the native forest [13].
A study in the state of Rondônia-RO [14] demonstrated that pasture-to-agriculture transition results in the loss of soil SOC; however, the results must be interpreted with caution as there are several influencing factors until a new balance in the agricultural system is achieved. The conversion of forest to pasture systems did not change over 24 years, already <5 years changed the C stock. Soil SOC was highly variable and dependent on the management employed, with pastures older than 24 years still showing increases in soil SOC; thus, the stability of SOC with pasture age is still unknown.
Several studies have compared SOC stocks in the Amazon [2,13,14,15] but studies that evaluate changes from forest to other systems are limited to intact forests only or call the forest system native vegetation. The studies that compared soil SOC stocks used forest areas close to agricultural exploration areas. Currently, the authors are unaware of agricultural areas adjacent to forest areas in the Amazon region that have not yet been economically exploited. Only vegetation designation, native or forest, can lead to a misunderstanding of the system mentioned. The only study that estimated SOC stocks in different forest systems did not compare crop or pasture systems [1].
Most studies conducted in the Amazon biome evaluated the dynamics of SOC and soil nitrogen (N) stocks only after the first change in land use. However, with the advancement of crops in this region, it is necessary to evaluate areas previously used as pastures that are currently occupied by crops [2]. We hypothesize that the introduction of nominal pasture systems would maintain soil C and N stocks, whereas crops would decrease soil C and N stocks in the Amazon biome over time. Therefore, this study aimed to determine (1) the impact of agricultural expansion in the Amazon deforestation arc on SOC and soil N content under nominal pastures, black pepper, and disturbed primary tropical forests; (2) the origin of C on the soil; (3) how land use affects SOC and soil N stocks at 30 and 100 cm soil depths; and (4) the potential contributions of C3 and C4 that occur over time with land use changes.

2. Materials and Methods

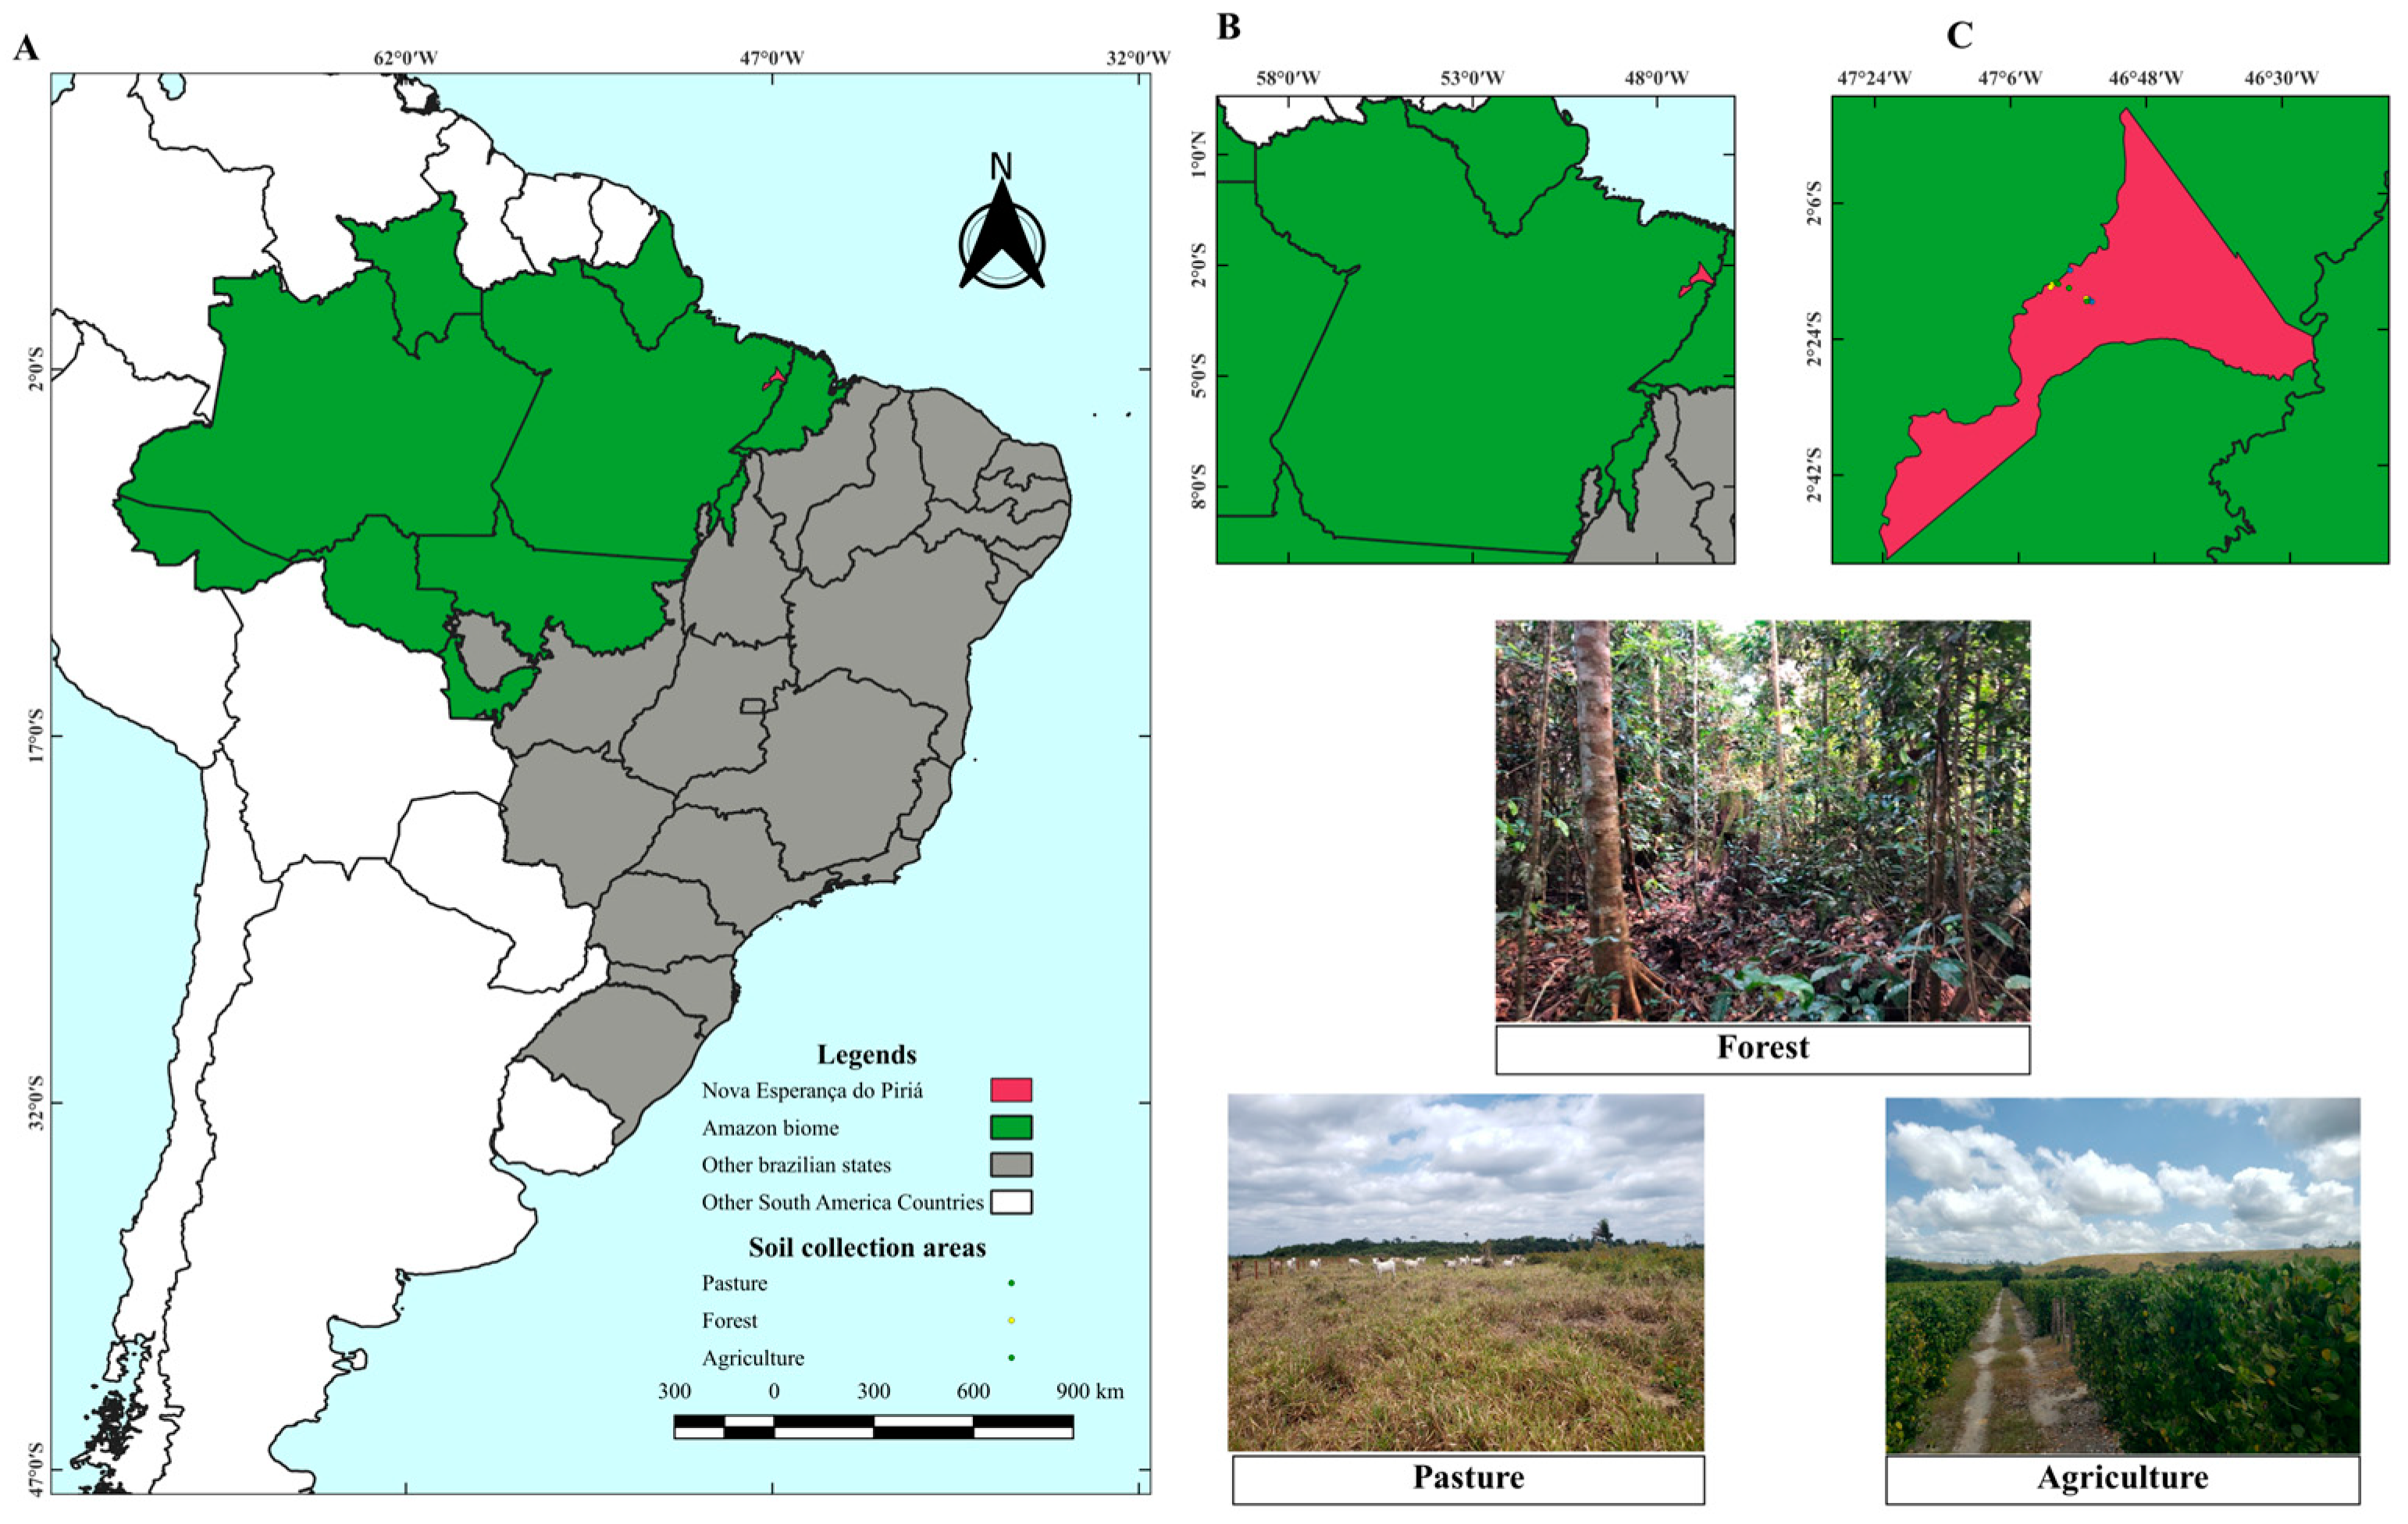
2.1. Characterization of the Study Site

This study was conducted in 2019 in areas with different land use systems: wet rainforests, pastures, and crops. The sites were within the region of the Arc of Deforestation of the Amazon in the municipality of Nova Esperança do Piriá, Pará, Brazil (2°19′ S, 46°56′ W, altitude 70 m), and were selected based on preliminary investigations to detect areas with similar soil and history of land use. The locations of all assessed points were distributed within 2 km. The climate of the region is wet tropical and the Köppen classification is Am [16,17]. The average annual rainfall and temperature in the study region are 2104 mm and 26 °C, respectively. The soils at the study sites are classified as yellow latosols [18] or oxisols [19].

2.2. Experimental Characterization of the System

The experiment was conducted with three treatments corresponding to different land use systems: forest, pasture, and crop, with four replications per system (Table 1; Figure 1). This study was based on a comparative-mensurative experimental design, and the treatment replicates were not spatially dispersed [20]. The underlying assumption of this experimental design was that the soil properties of the three ecosystems (tropical forests, crop areas, and pastures) were similar before conversion [9,20]. The forested area is composed of humid tropical forests. The crop area was cultivated with black pepper (Piper nigrum) and the pasture area with palisade marandu grass (Urochloa brizantha Hochst. ex A. Rich.) R.D. Webster.
Forest areas, which correspond to the original ecosystem of the region, were selected close to the pasture and crop areas. During the occupation of these areas, part of the noble and white wood, which is of commercial interest, was exploited. Therefore, these forests were classified as disturbed primary, that is, forests affected by logging that did not show signs of suppression for at least 25 years [1]. In the surface layers of the soil (0–20 cm), the clay contents in forest Areas 1, 2, 3, and 4 are 23%, 20%, 45%, and 30%, respectively.
For the pastures, Area 1 was formed with Marandu palisade grass in 2007 from the suppression of forests and burning. After that year, no new fires occurred and weed control was performed through mowing. In 2018, the area was fertilized at 90 kg P2O5 ha−1 with the reactive natural phosphate Arad. This area has a clay content of 60% in the surface layer (0–20 cm depth). Area 2 became a pasture in 1988 with the suppression and burning of forests. Over 24 years, this area has been used to cultivate cassava. In 2012, it was burned and replaced by Marandu palisade grass. Single fertilization was performed in 2017 in an area with reactive natural phosphate in Arad, corresponding to 90 kg P2O5 ha−1. This area has a clay content of 15% in the surface layer (0–20 cm depth). Area 3 was formed in 1988 using the same methods and forage species as Area 1. Since the formation of this area, no fertilization has been performed, and when necessary, weeds were removed by mowing. This area has a clay content of 37% in the surface layer (0–20 cm depth). Area 4 began operation in 2004 using the same methods and forage species as those used in areas 1 and 3. In 2008, a new burn was conducted in Area 4 to control weeds. In 2017, limestone was surface-applied to the soil, and fertilization with Arad-reactive natural phosphate was performed at the same dose as that used for Pastures 1 and 2. This area has a clay content of 34% in the surface layer (0–20 cm depth). Despite the low level of technology used in the aforementioned pasture areas, favorable edaphoclimatic conditions and grazing management practices resulted in sufficient forage mass and nutrient cycling. Such practices avoid degradation processes and allow excellent forage production, characterizing the areas as nominal pastures or well-managed areas.
For crop systems, Area 1 started operation in the 2000s following forest suppression, burning, and pasture formation using Marandu palisade grass. In 2010, the pasture was replaced with black pepper crops. The clay content of the soil surface layer (0–20 cm) is 48%. Areas 2, 3, and 4 are also black pepper crop systems and have the same formation history as they are located on the same farm. These areas were formed by forest suppression and forest burning in the 1990s, followed by pasture formation using Marandu palisade grass. A burn was conducted in 2012 and the pasture was replaced with black pepper in 2014. The clay contents in the surface layer (0–20 cm) of the soil in Areas 2, 3, and 4 are 18%, 17%, and 23%, respectively. In all crop areas, organic fertilization with poultry litter and crop residues is performed annually, in addition to standard chemical fertilization with 52.5, 32.8, and 82.8 g plant−1 year−1 of N, P, and K, respectively.
The average clay contents in the forest, crop, and pasture areas are 29.5%, 26.5%, and 36.5%, respectively. Their physical and chemical characteristics are listed in Table 2.

2.3. Chronosequences Validation

The indicators chosen to evaluate the validity of the chronosequences were the texture and bulk density of the soil [6,9,21].

2.4. Soil Sampling

A trench (1 × 1 × 1 m) was dug at each site. Soil samples were collected from four sides of the trenches at depths of 0–5, 5–10, 10–20, 20–30, 30–40, 40–60, 60–80, and 80–100 cm using a Kopeck ring, as described in [7], and the four samples at each depth were homogenized to obtain composite samples. From these samples, the organic matter light fraction, SOC (total C), total N (total N), C and N stocks at depths of 30 and 100 cm, and 13C isotopic abundance were determined.
The samples for apparent density analysis were collected using Kopeck rings of 100.6 cm3 in volume (5 cm in diameter and 5.2 cm in length) at the same depth intervals as above. The soil was removed from each ring and dried in an oven at 110 °C for 72 h to determine dry weight, as described previously [22]. For soil texture analyses (clay + silt and clay), a composite treatment sample was collected at intervals of 0–20 cm using a Dutch auger.

2.5. Concentration and Stock of C and N

The soil composite samples collected at each trench depth were processed using a roller mill. The total N content was determined using the Kjeldahl semi-micro technique, as described previously [23]. The abundance of 13C isotopes was determined using isotopic analyses performed at the Stable Isotope Center of Paulista State University, UNESP, Brazil. The soil samples were dried in an oven at 50 °C for 48 h. An aliquot of 1.0 to 1.5 mg of each sample was weighed in a tin capsule using a scale with a resolution of 1 μg (XP6, Mettler Toledo, Greifensee, Switzerland). The capsules were analyzed in an isotopic mass spectrometry system using a continuous flow ratio with an IRMS (CF-IRMS; Delta V, Thermo Scientific, Karlsruhe, Germany) coupled to an elemental EA analyzer (Flash HT, Thermo Scientific, Karlsruhe, Germany) using a gas interface (ConFlo IV, Thermo Scientific, Karlsruhe, Germany). The CF-IRMS determined the isotopic ratio of C R(13C/12C), and the values were expressed as the relative difference of isotopic ratio (δ13C), in parts per thousand (‰), from the Vienna PeeDee Belemnite (V-PDB) standard according to Equation 1 [24]. The standard uncertainty of the CF-IRMS was estimated to be ±0.15 % (n = 10) and the results were normalized using the NBS-22 certified reference standard.
Δ 13 C = R ( C 13 / C 12 ) sample R ( C 13 / C 12 ) V - PDB 1
CF-IRMS was also used to determine the total organic C (TOC) present in each sample using a thermal conductivity detector of the EA calibrated with the certified reference standard nicotinamide (P/N33840009, Thermo Scientific, Karlsruhe, Germany). The standard uncertainty of TOC values was estimated to be ±1.0% (n = 10) for samples with TOC between 0.5% and 5%.

2.6. Soil Stocks Calculations

The stocks of soil C and N at each depth interval were determined by multiplying the C and N contents by the soil bulk density at the respective depths and correcting for the mass of the reference soil, that is, the forest, at 30 and 100 cm depths. It was assumed that soil compaction due to grazing or machinery use was representative of only the surface layers. Thus, in the calculation of C and N stocks (Equation (2)), the contents of C and N present in the extra weight of the soil were subtracted from the deepest layers, 20–30 cm and 80–100 cm, according to [22].
Ys = i = 1 n 1 CTi + [ MTn ( i = 1 n MTi i = 1 n MSi ) ]   ×   CTn
where Ys is the total stock of C or N (Mg ha−1) in the soil at a depth equivalent to the soil mass in the reference profile (forest at 30 and 100 cm depth); i = 1 n 1 CTi is the sum of the total of C or N (Mg ha−1) from the surface layer to the penultimate layer in the treatment profiles (pasture or crop); MTn is the soil mass in the deepest layer of the treatment profiles; i = 1 n 1 CTi is the sum of the soil mass (Mg ha−1) from layers 1 (0 to 5 cm, surface) to greater depths in the treatment profile (pasture or crop); i = 1 n MSi   is the sum of the soil mass (Mg ha−1) from layers 1 (0 to 5 cm, surface) to greater depths in the reference soil profile (forest); and CTn is the concentration of C or N (Mg ha−1) in the deepest layers of the treatment profile (pasture or crop).
The proportion of organic C in the soil derived from the forest (%CF) and pasture (%CBr) was estimated using the natural abundance of 13C based on the equation proposed by [25]. Equation (3) was used to determine the origin of organic C (considering the difference between species C3 and C4), estimated from the abundance of 13C in the soil samples:
% C F = 100 ( δ C x 13 δ C Br 13 ) δ C F 13 δ C x 13 δ C Br 13
where δ13Cx is the abundance of 13C in the soil under the pasture or crop (all areas of the crop were previously pasture areas); δ13CBr is 13C abundance derived from the litter (abundance of 13C − 14.3 ± 0.56 ‰) of marandu palisade grass, which was obtained from eight repetitions as proposed by [26]; and δ13CF is the abundance of 13C in the soil under the forest. Therefore, the proportions of C derived from C3 and C4 plants in the different land use systems were estimated using the abundance data of 13C in the soil and the C (kg C m−3) content at each soil depth interval.

2.7. Light Organic Matter (LOM) in Water

Soil samples for light organic matter (LOM) analysis were obtained from the mean interval (5 cm central) at depths of 0–5, 5–10, 10–20, and 20–30 cm. After collection, the samples were air-dried and the LOM was determined using the procedure described in [27]. In a 250 mL beaker, an aliquot of 50 g of the sample was added to 100 mL of NaOH 0.1 mol L−1 NaOH solution, which was kept for 12 h at rest. Subsequently, all materials were stirred and passed through a 25 mm sieve to remove the clay. The material (LOM and sand) retained in the sieve was placed in a beaker and the volume was increased to 100 mL with water. The suspended material (LOM) was separated and kiln-dried at 65 °C for 72 h before weighing.

2.8. Statistical Analysis

The data for each variable were subjected to normality analysis of the residuals using the Cramer-von-Mises test. When the analysis of variance was significant for land use levels, the Student–Newman–Keuls test was used to compare the means (p < 0.05). Treatment effect levels were defined by land use (forest, pasture, and crop). All statistical analyses were performed using the R Core Team statistical program version 4.3.0.

3. Results

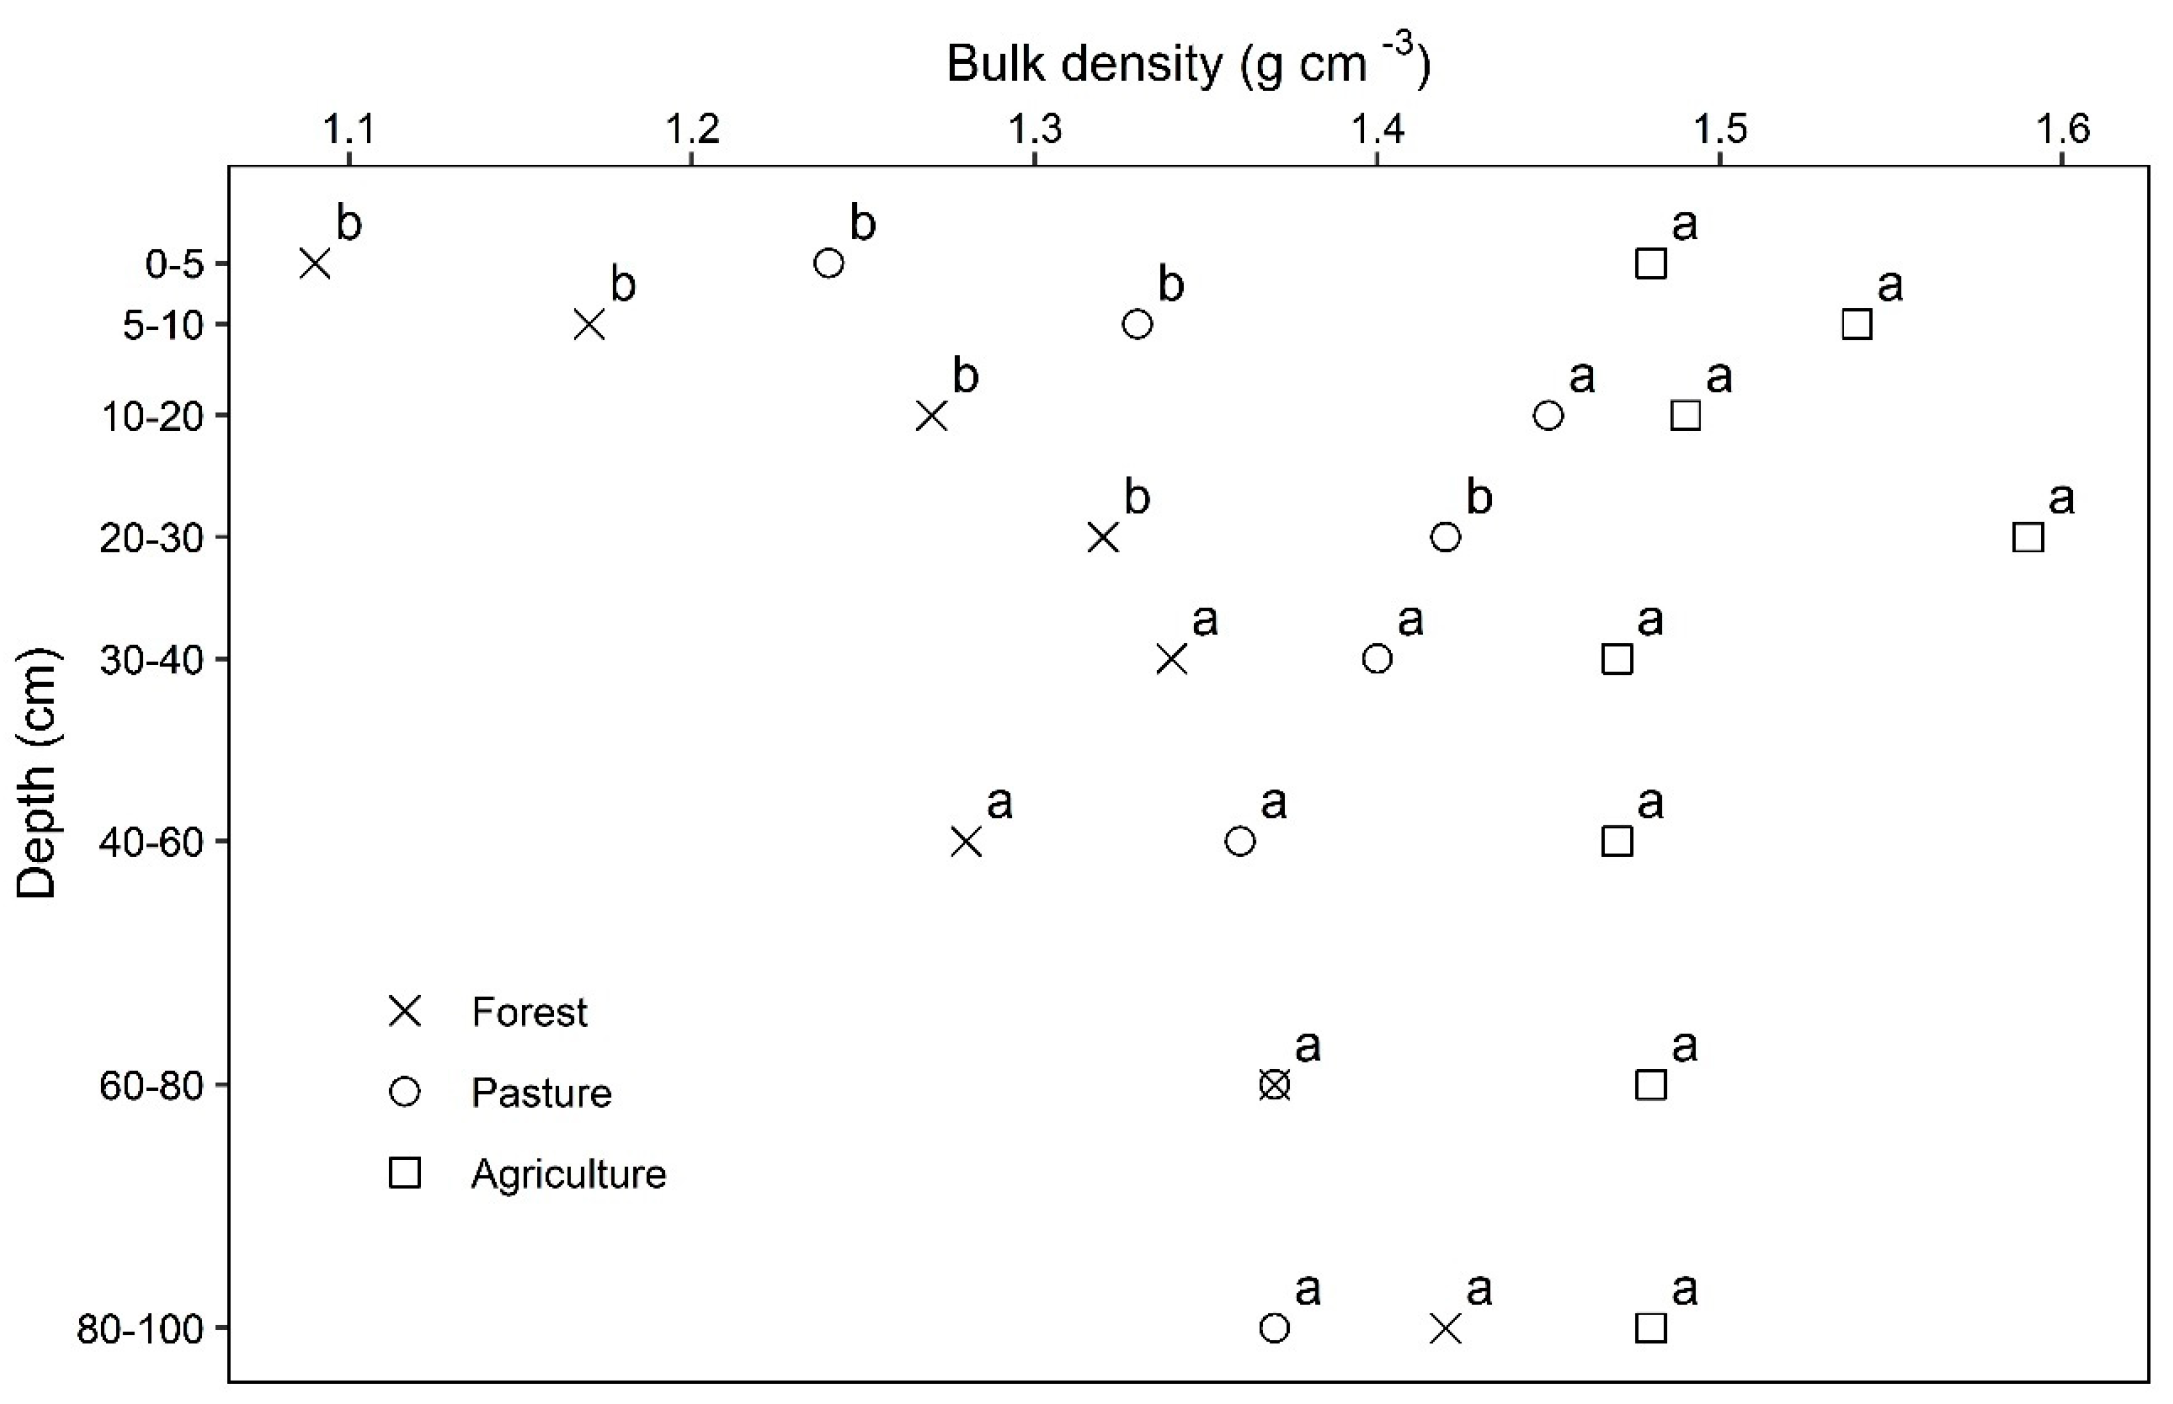
3.1. Chronosequence Validation

All land use systems presented similar soil clay contents (p > 0.76), with averages of 295.0, 365.0, and 265.0 g kg−1 in the forest, pasture, and crop areas, respectively. There were no differences between the clay and silt contents (p > 0.58) at 382.5, 460.0, and 327.5 g kg−1, respectively.
There was a significant difference (p < 0.05) in soil bulk density between the land use systems in the surface layers (0–30 cm, Figure 2). However, no difference was observed between the land use systems at depths greater than 40 cm (p > 0.05). At depths of 0–5, 5–10, and 20–30 cm, the density in the crop area was significantly higher than in the forest and pasture areas (p < 0.05). The pasture area bulk density was higher than that of the forest area only at a depth of 10–20 cm (p < 0.05).

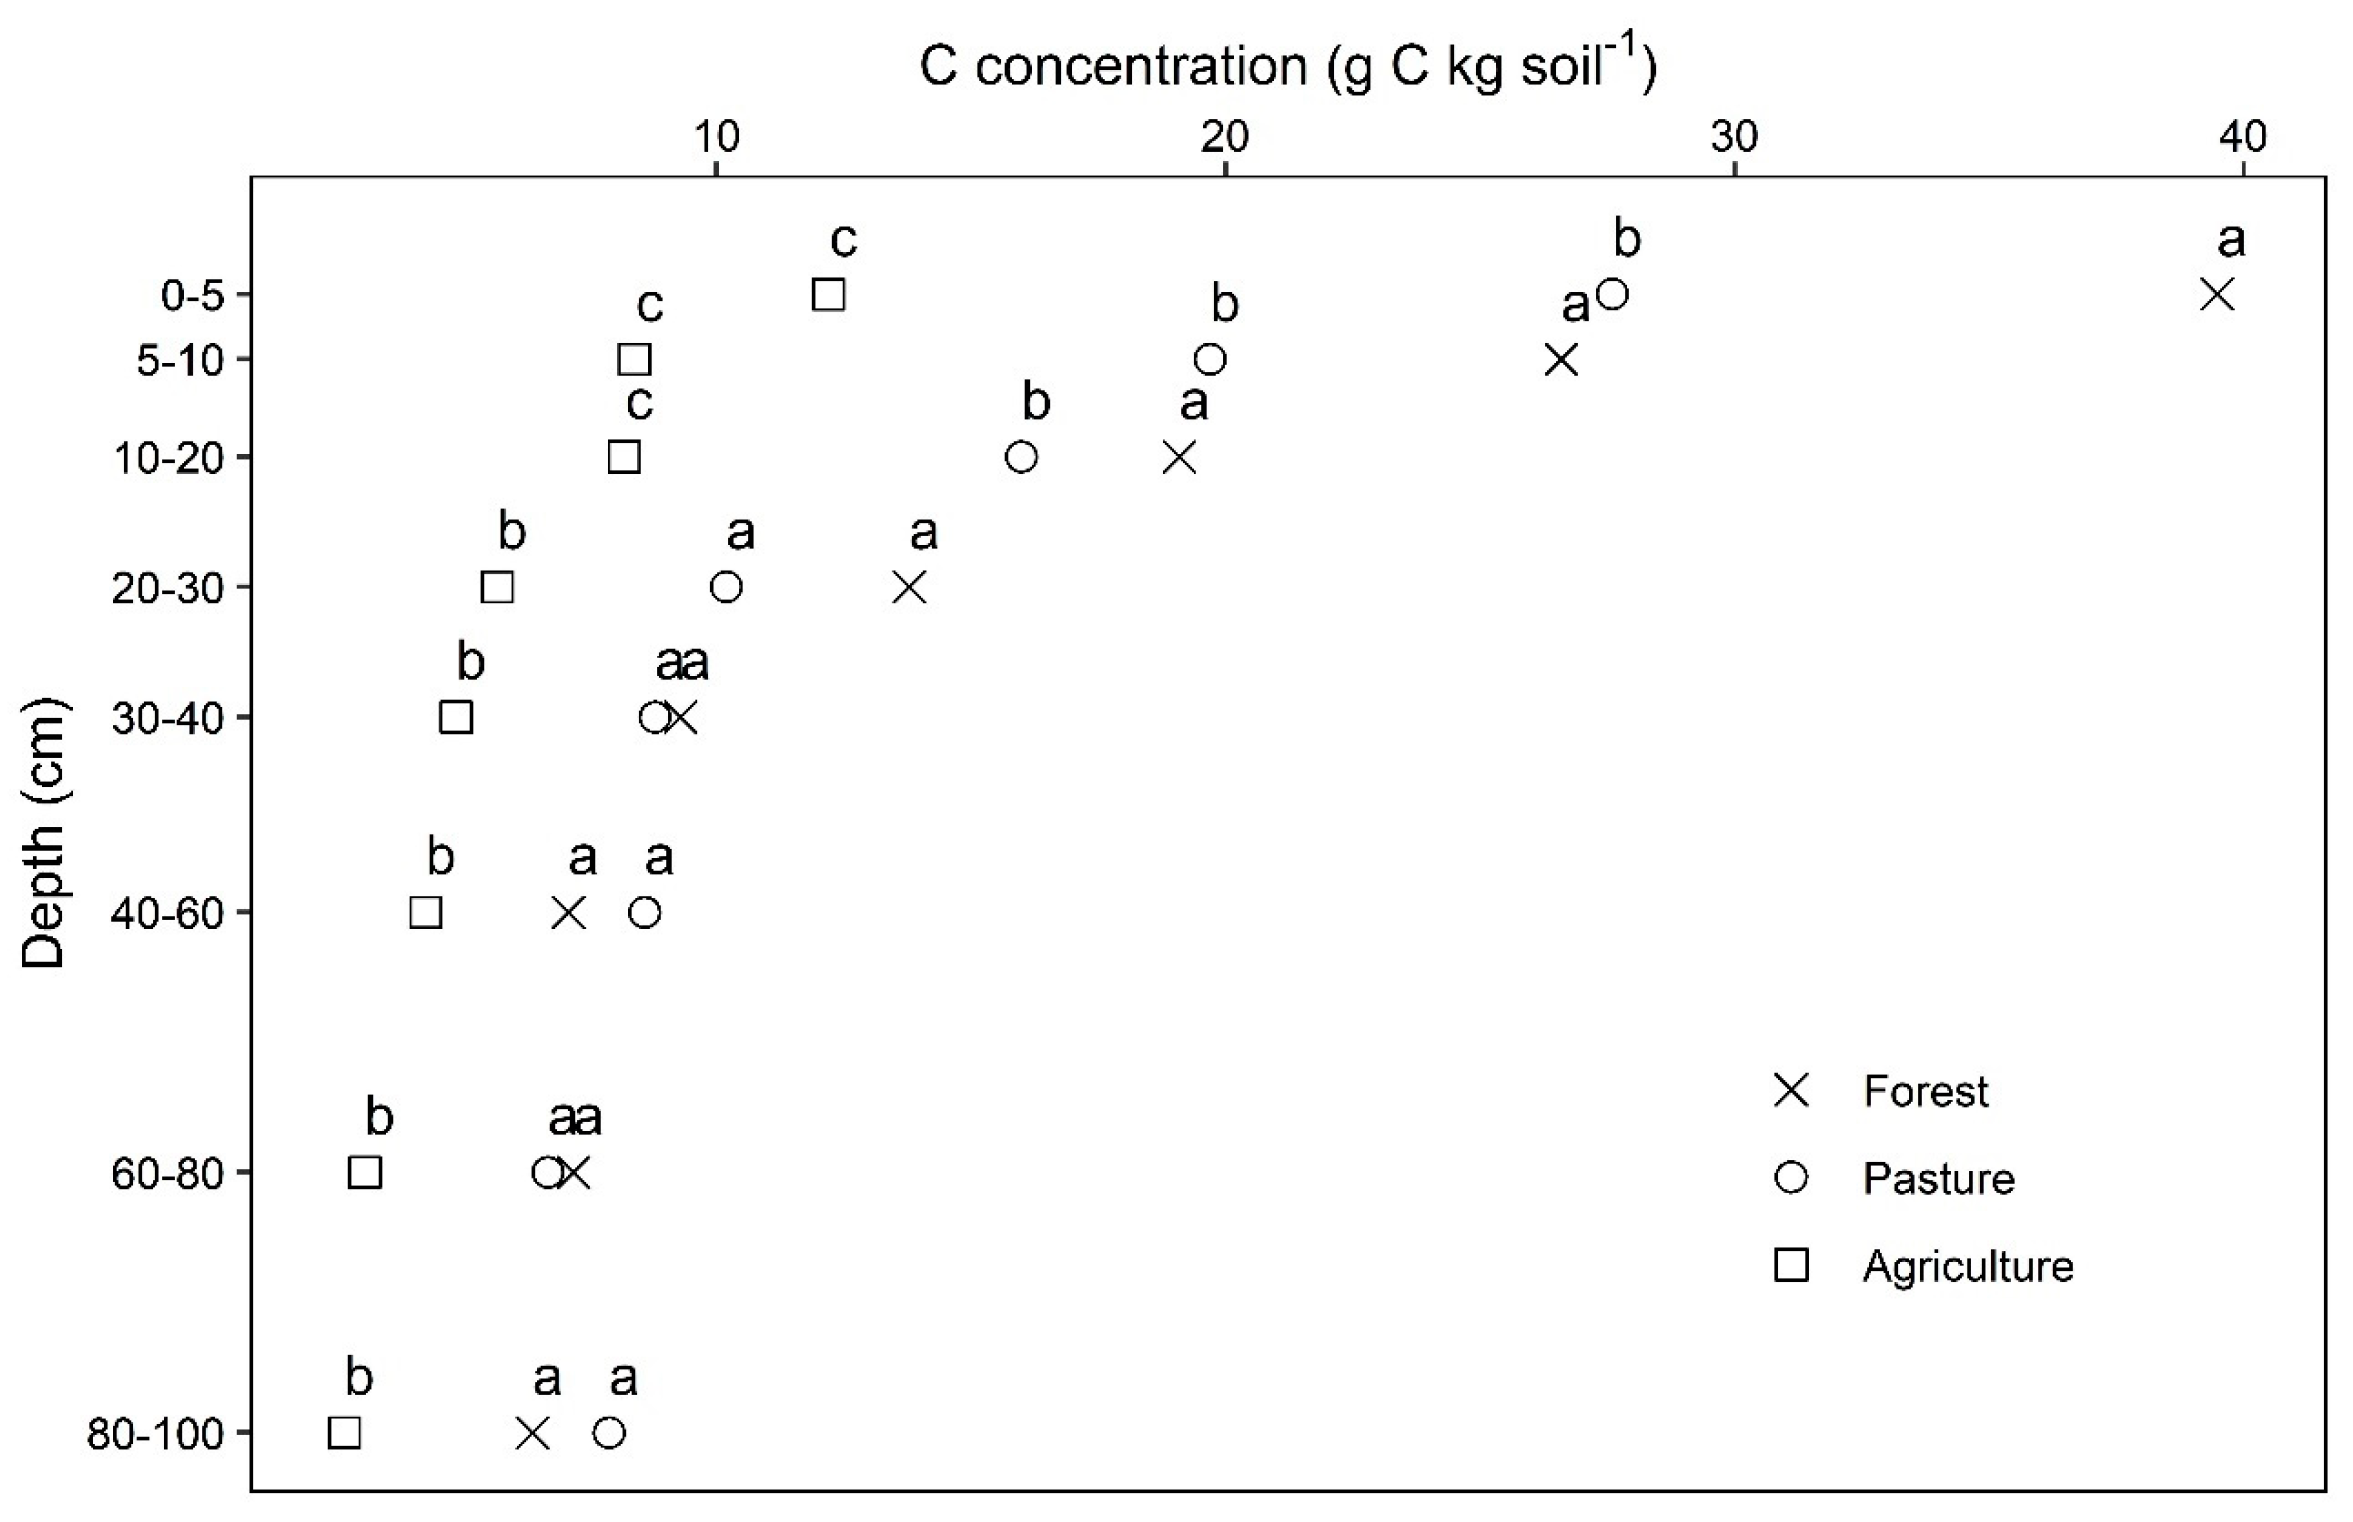
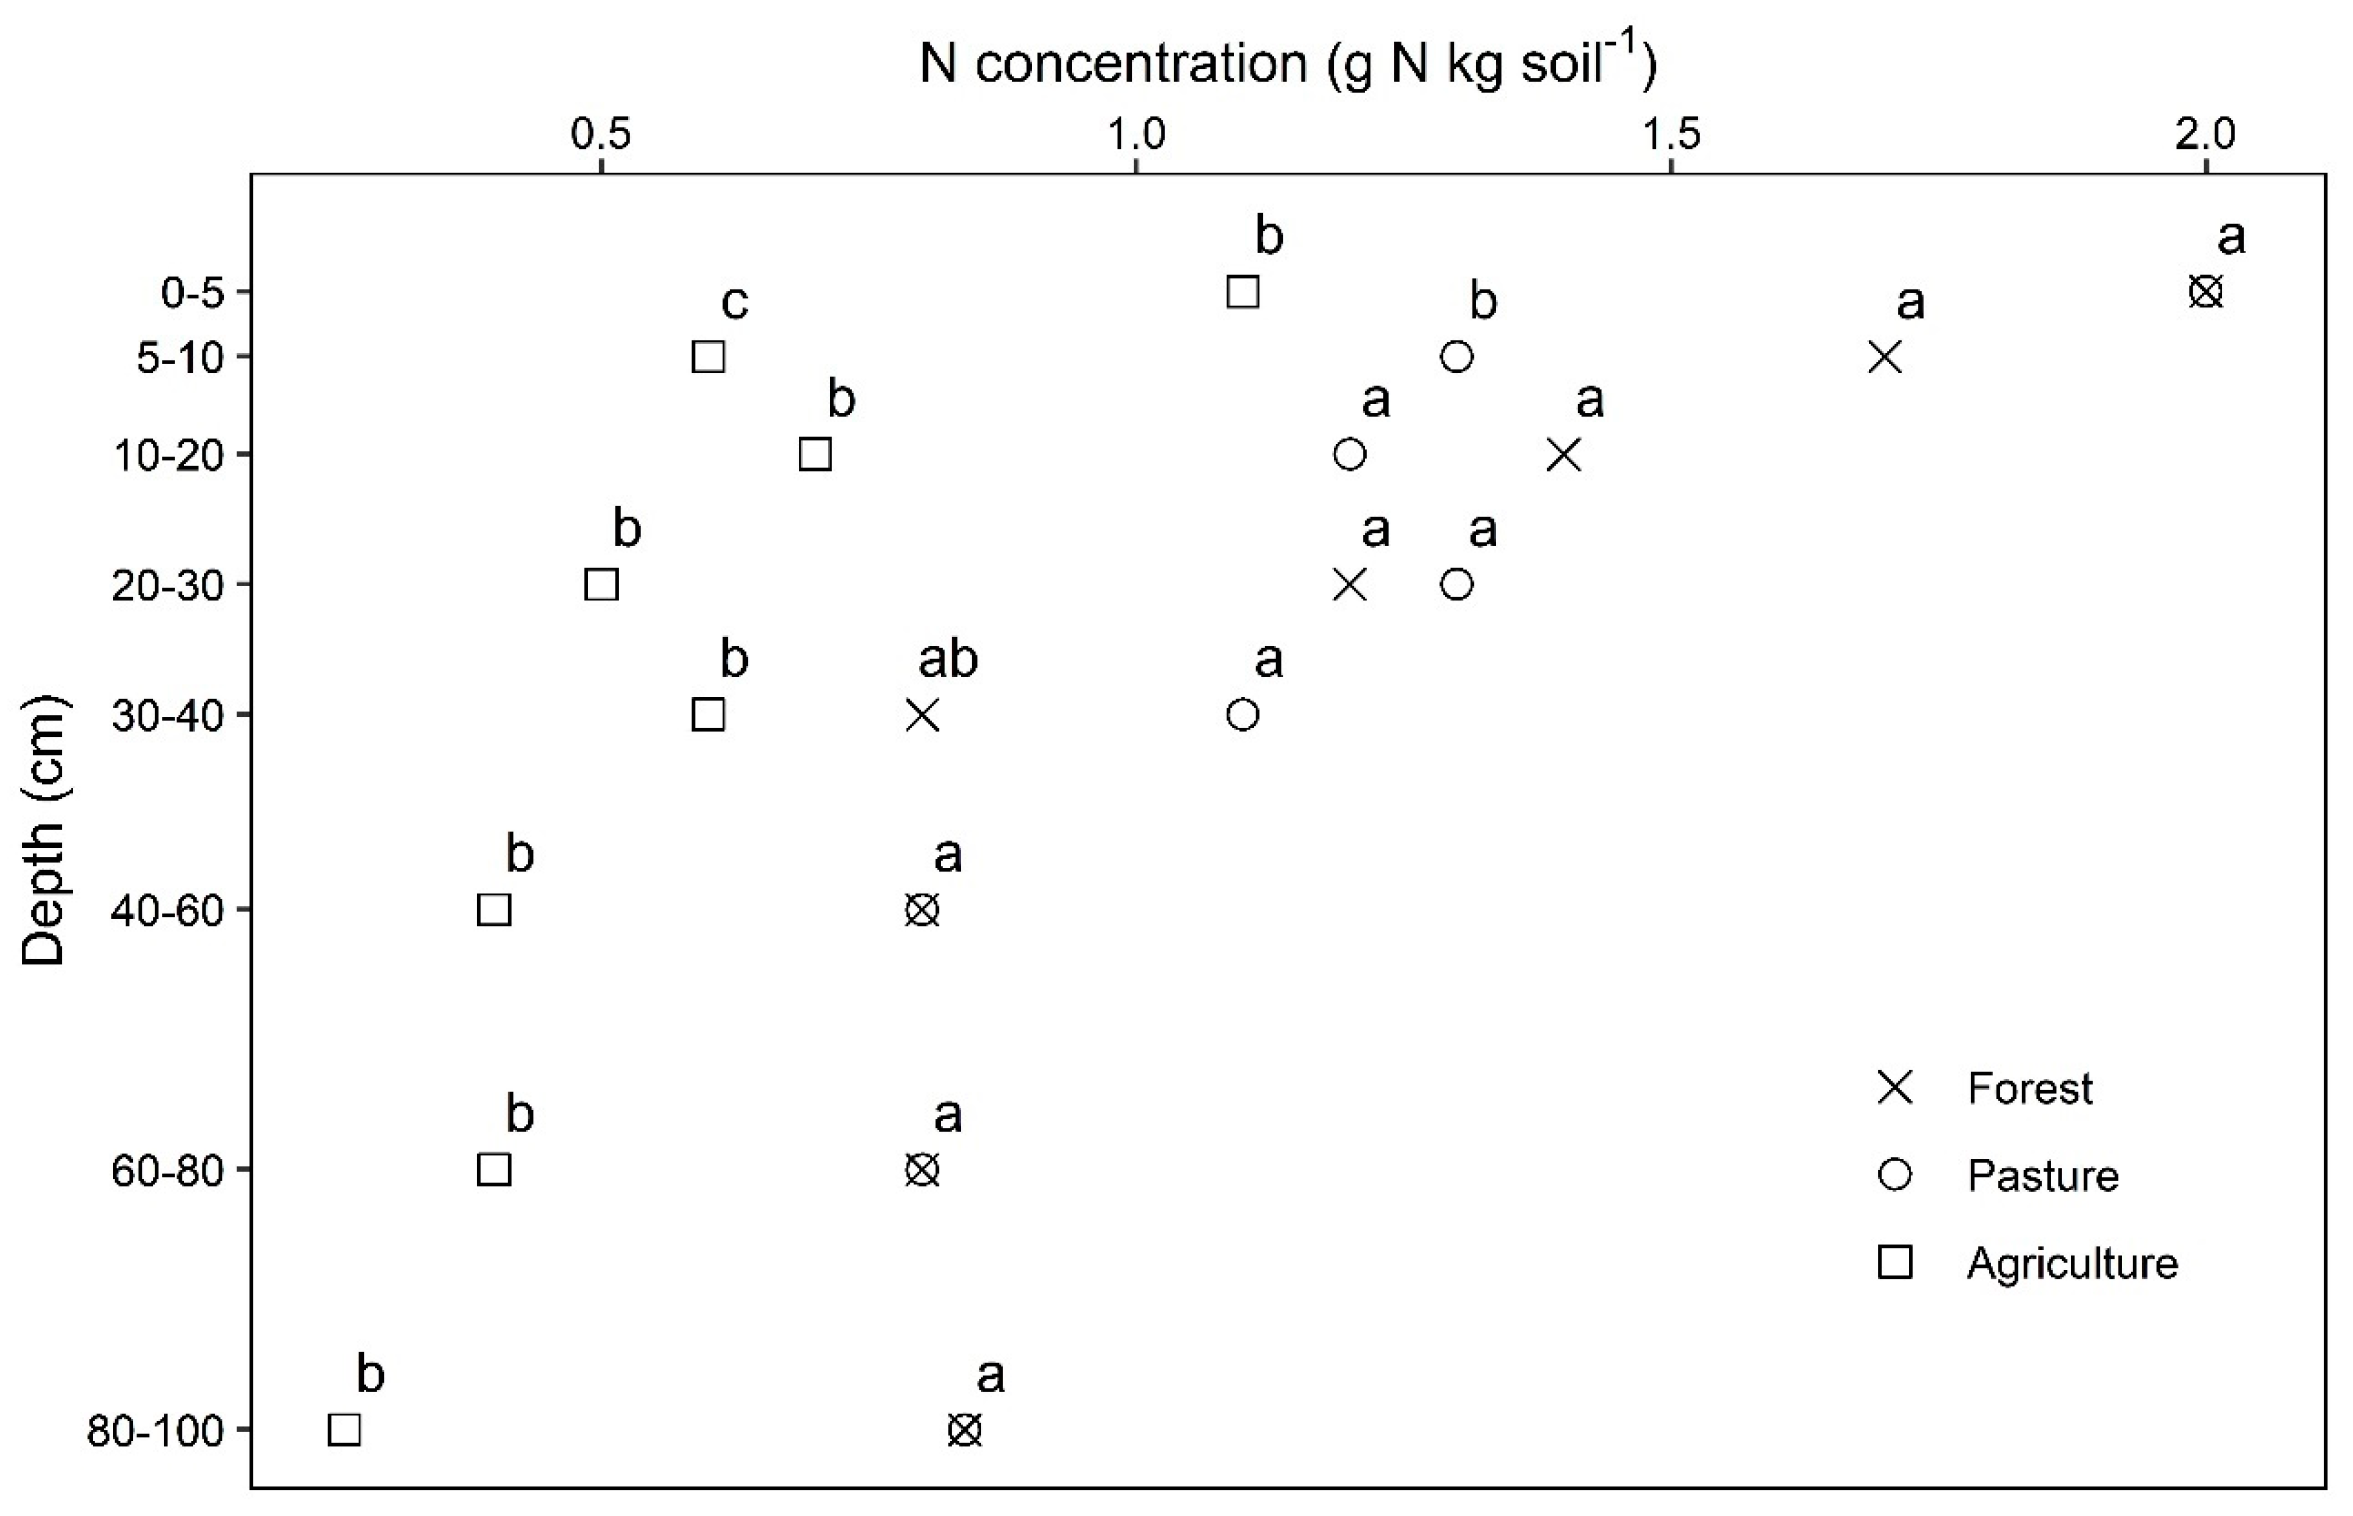
3.2. Organic C and Soil N
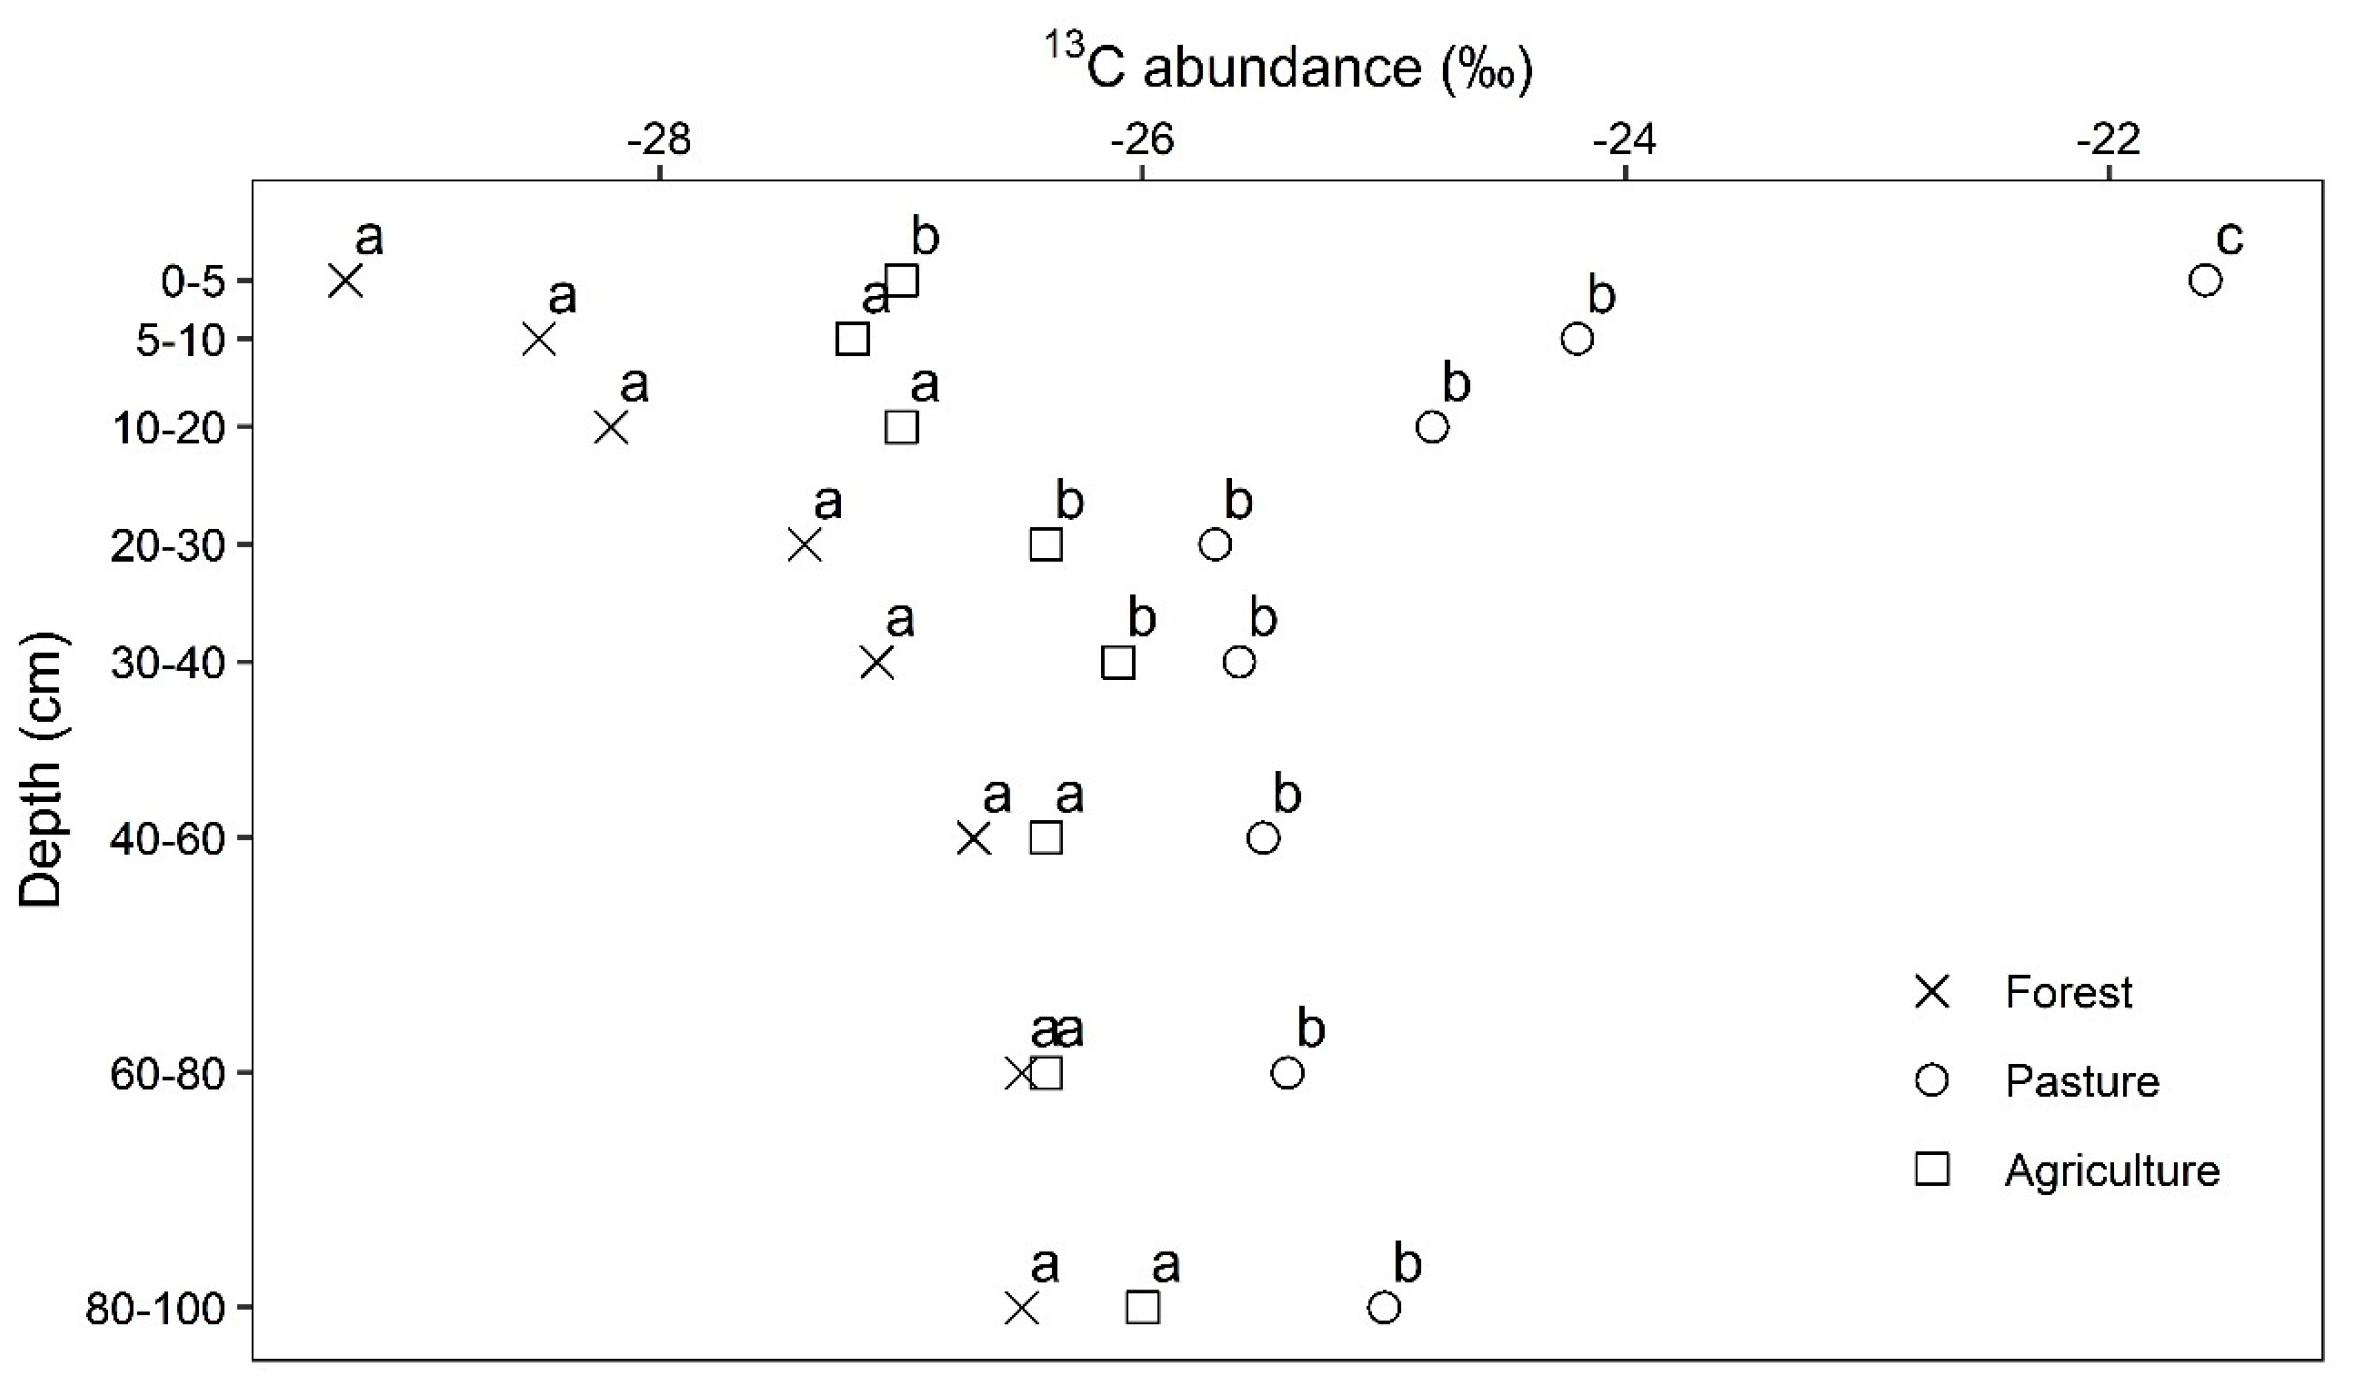
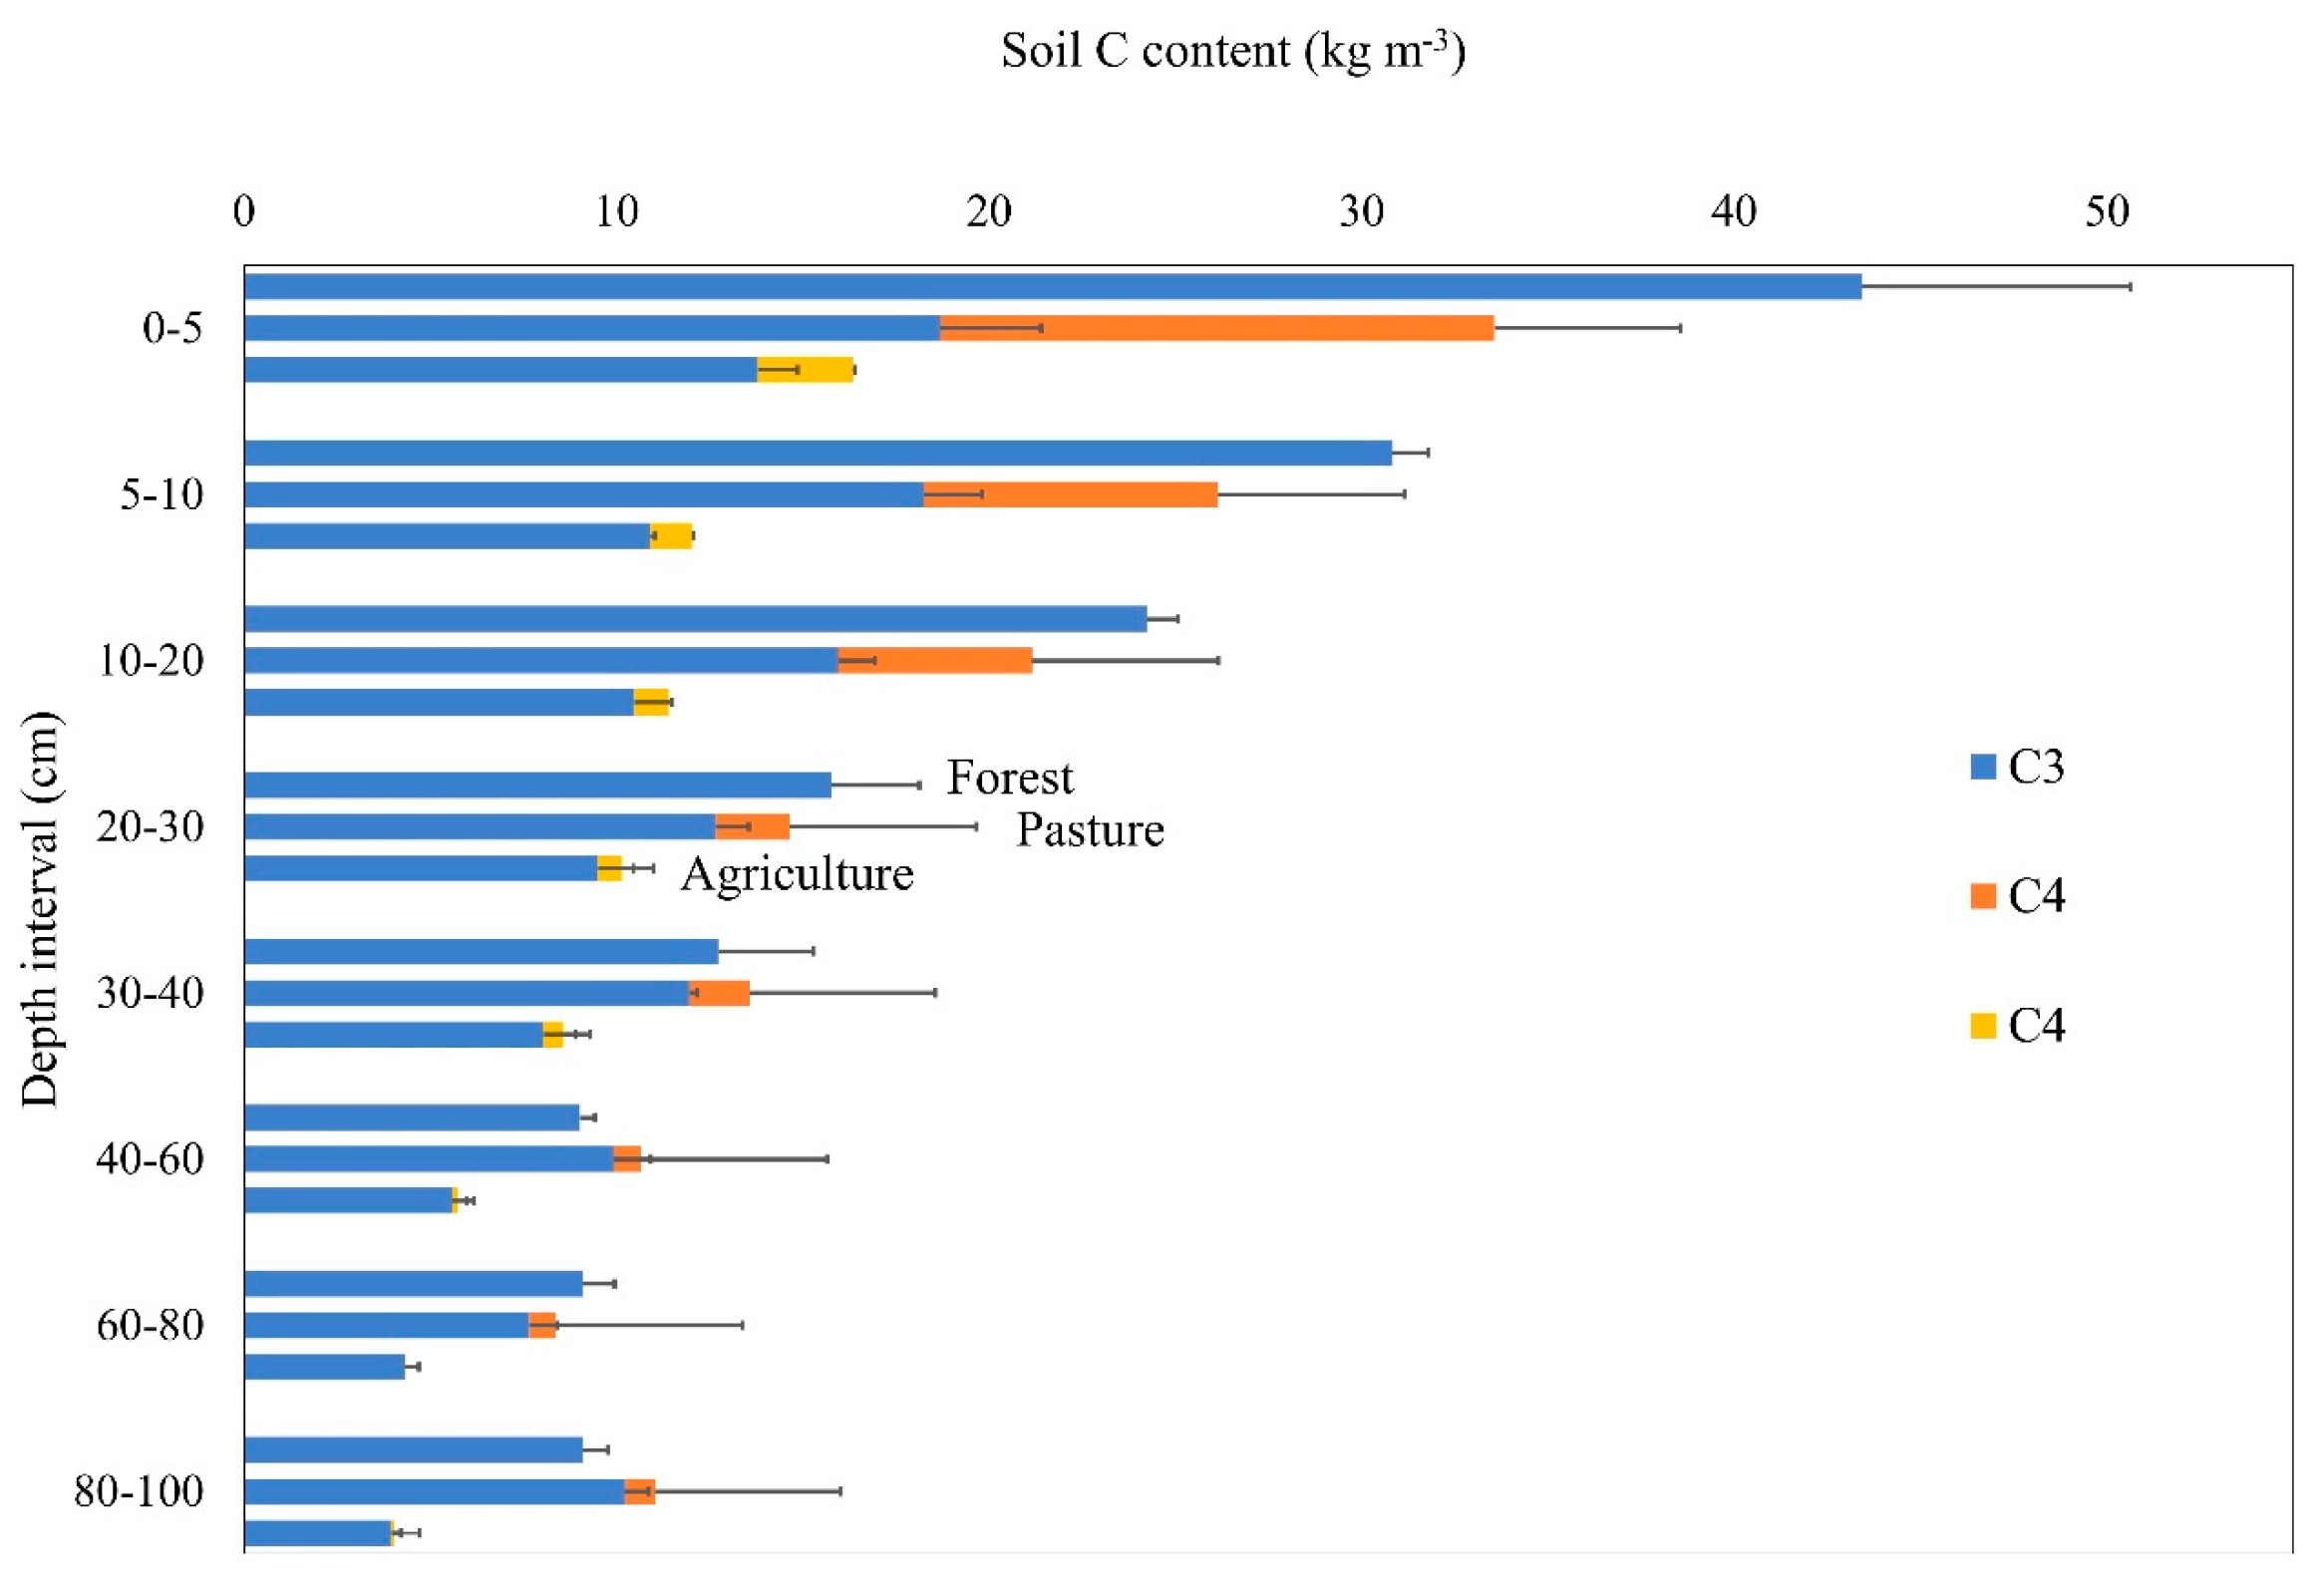
The C concentrations at 0–5 cm depth were 39.5, 27.6, and 12.2 g C kg soil−1 in the forest, pasture, and crop, respectively (Figure 3). A decreasing trend in C concentration with depth was observed at 9.8, 9.3, and 4.9 g C kg soil−1 at 30–40 cm depth and 6.4, 7.9, and 2.7 g C kg soil−1 at 80–100 cm, respectively. The C concentration in the crop area was lower than that in the other soil types, regardless of depth (p < 0.05), whereas the concentration in the pasture area was lower than that in the forest area only in the surface layers (0–20 cm).
The N concentrations at 0–5 cm depth were 2.0, 2.0, and 1.1 g N kg soil−1 in the forest, pasture, and crop areas, respectively (Figure 4). A decreasing trend of N concentration with depth was detected at 0.8, 1.1, and 0.6 g N kg soil−1 at 30–40 cm depth and 0.8, 0.8, and 0.3 g N kg soil−1 at 80–100 cm, respectively. The N (g N kg soil−1) in the crop areas was lower than that in the other land use systems at different soil depths (p < 0.05), except at 30–40 cm depth, where the crop and forest had similar N concentrations. The N concentrations in the pasture area were identical to those in the forest at different depths, except at 5–10 cm depth, where the forest area had higher N concentrations than the pasture area.
The SOC stock in the forest and pasture systems did not differ but was greater than that in the crop areas (Table 3). However, the SOC stock at 30 cm depth did not follow the same trend as the C concentration in the forest and pasture systems because when the C stock of the pasture area was corrected for mass relative to the forest area, the systems did not differ.
The soil N stocks at depths of 30 and 100 cm followed patterns similar to those of N concentration. Even after soil N stock correction for the soil mass equivalent to the reference profile (forest at 30 and 100 cm depths), the forest and pasture areas did not differ (p < 0.05) and presented higher N contents than the crop area.
Regardless of the land use system, 47–57% of the SOC was concentrated in the top 30 cm of the soil profile. Soil from 0–30 cm depth contained 46–50% of the SOC stock, regardless of the soil profile. The black pepper crop was the only system that received N fertilization; however, approximately half of the soil N stock was related to the forest and pasture areas at depths of 30 and 100 cm.

3.3. C Origin

The abundance of 13C in the soil under forest areas increased from −29.3% at 0–5 cm depth to −27.1 ‰ at a depth of 30–40 cm and to −26.5 ‰ at the greatest depth (80–100 cm, Figure 5). In the pasture area, the abundance of 13C in the soil was less negative (p < 0.05) than in the forest area at all depths. The abundance of 13C differed in the agricultural area from that of the forest area at 0–5 and 20–40 cm depths.
The pasture area had a higher proportion of C4 in the surface layer (0–5 cm; 33.6%) than in the crop area (15.6%; Figure 6). In the pasture and crop areas, C4 reduced with soil depth, with C4 contribution in the 10–20 cm layer in the pasture area accounting for at least 24.6% of the total organic C in this system. In the pasture area, C4 was found in the deeper layers, such as 80–100 cm, which contained 7.3% of C4. The contribution of C4 to crop areas at depths greater than 40–60 cm was nominal (less than 2.5%).

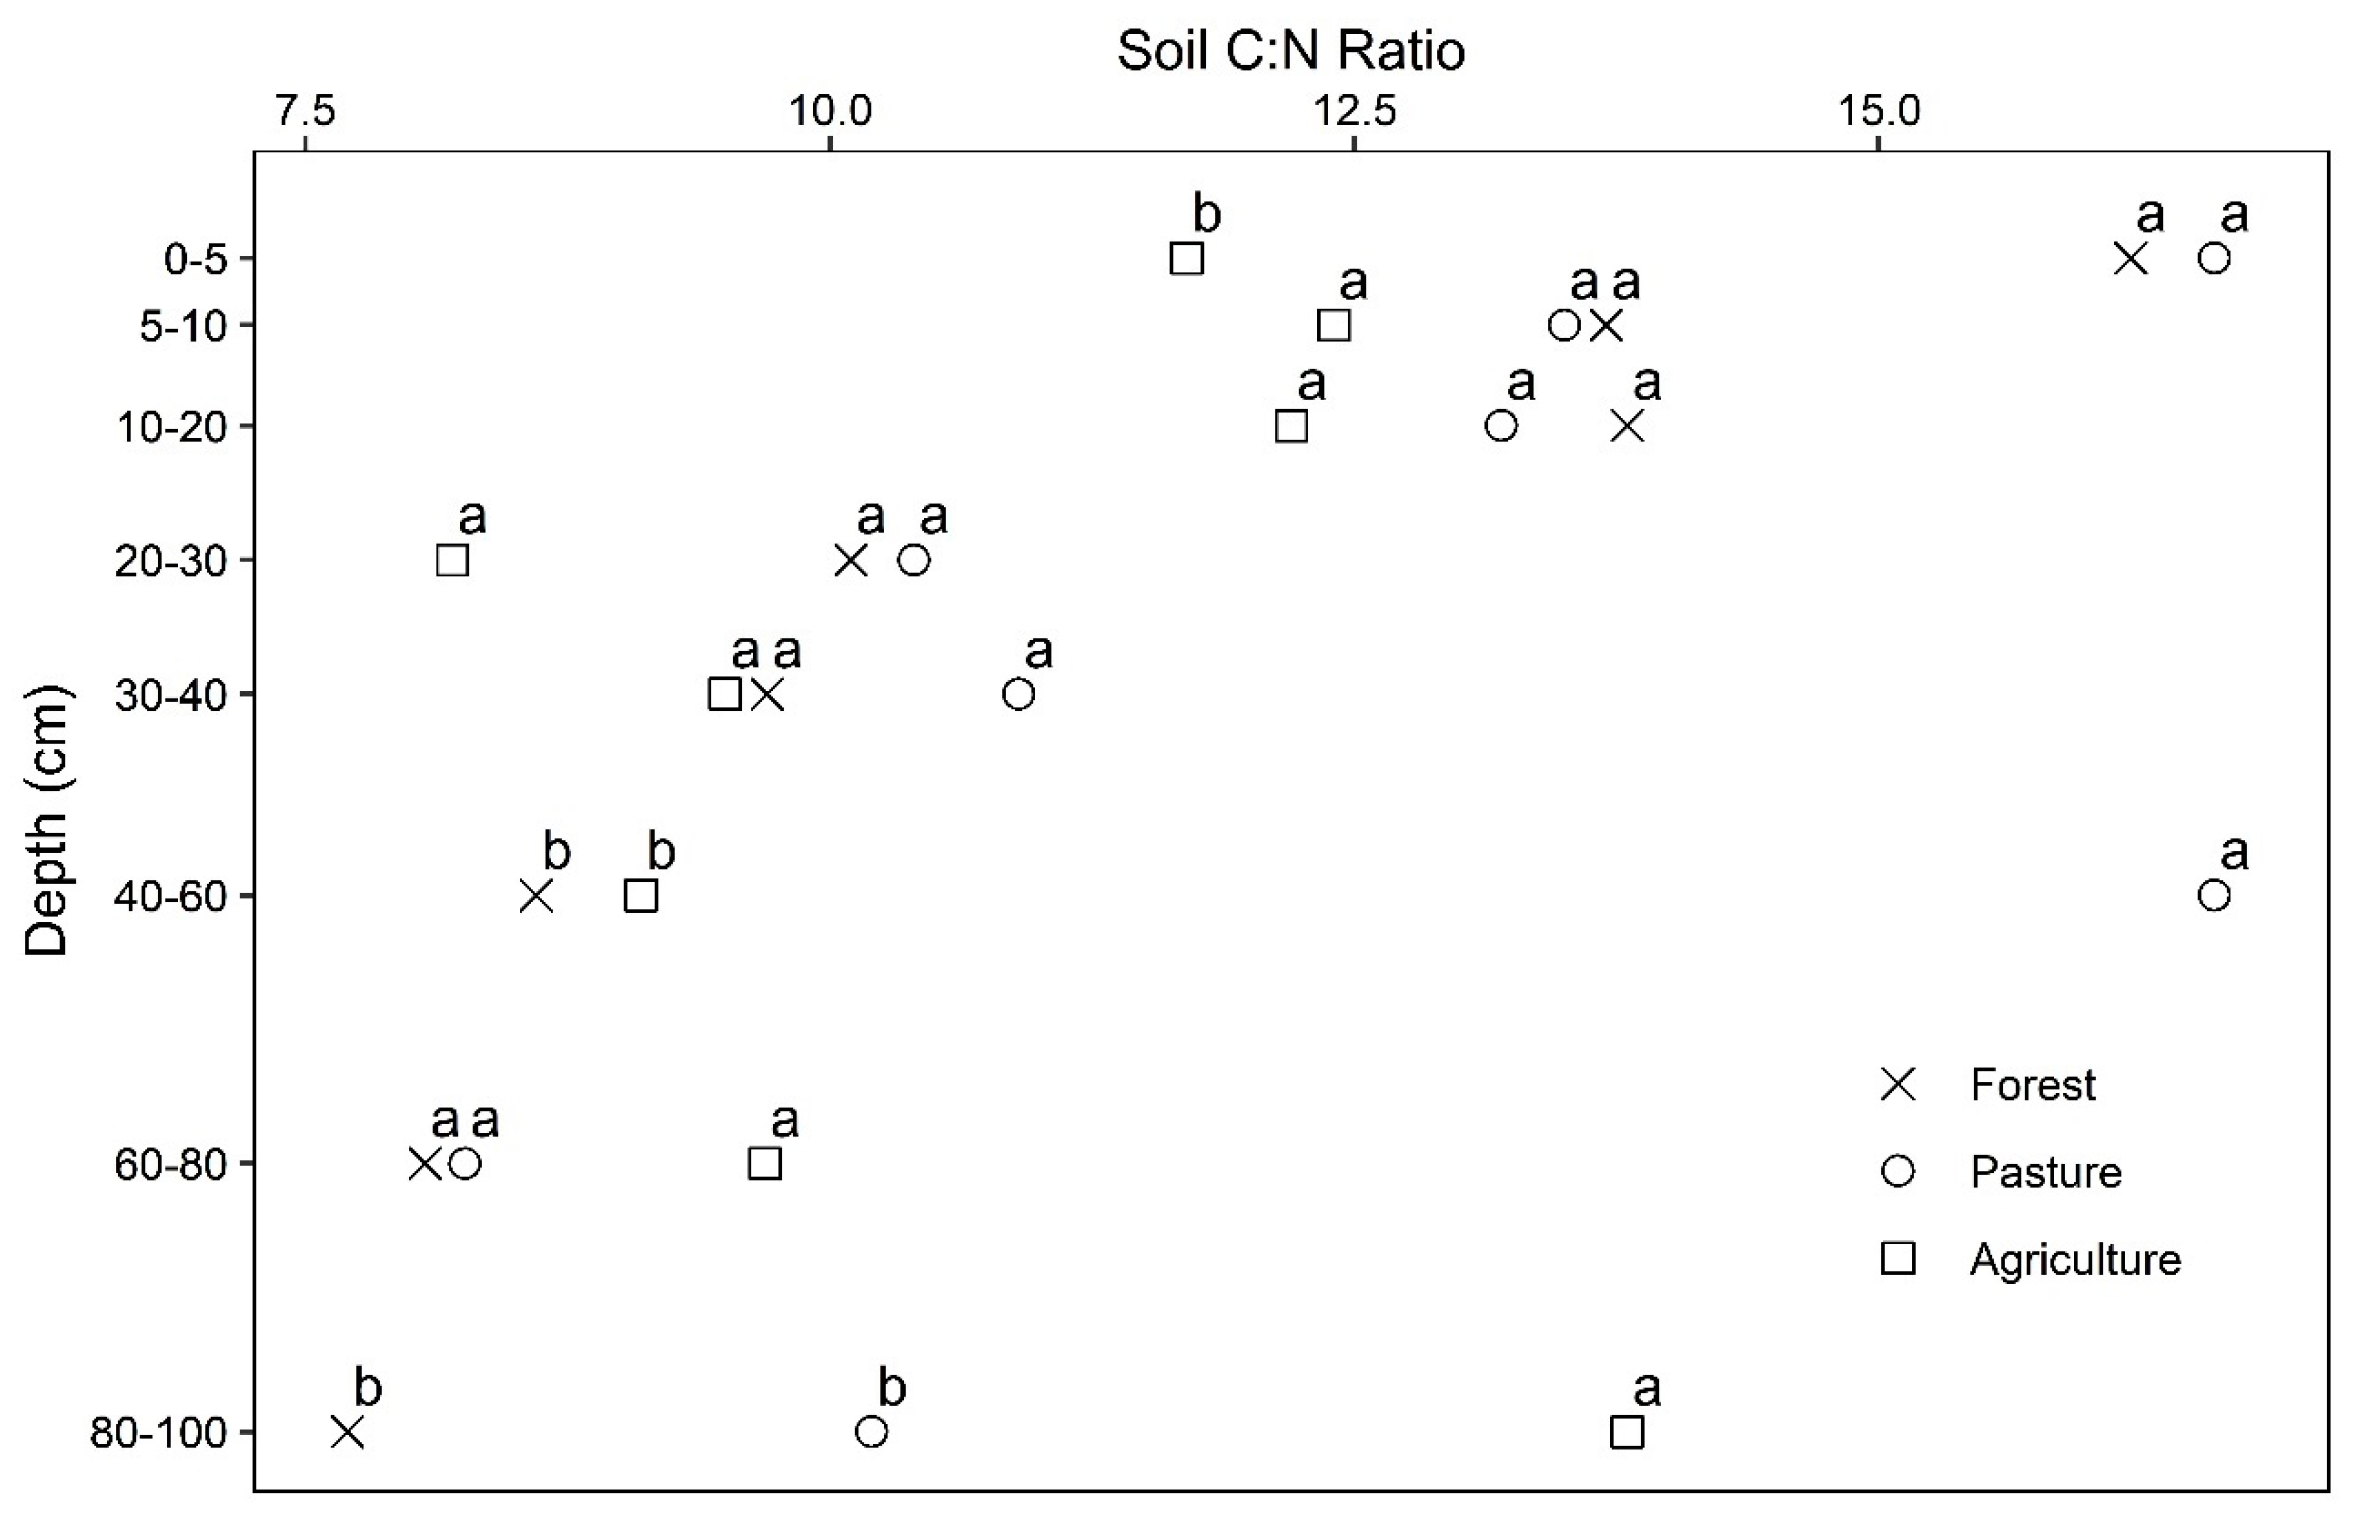
3.4. Light Organic Matter and C:N Ratio

In the soil surface layer (0–5 cm), the LOM content did not differ between the pasture and forest areas (p < 0.05). At 5–20 cm, the pasture presented a higher (p < 0.05) LOM content than the other systems. In the initial 0–20 cm depth, except for 5–10 cm, the forest area presented a higher (p < 0.05) LOM content than the crop area. In the 20–30 cm layer, there was no significant difference (p > 0.05) between the systems (Table 4).
In the soil surface layer (0–5 cm), the C:N ratios of forest and pasture areas were significantly higher (p < 0.05) than that of the crop area, at 16.2, 16.6, and 11.7, respectively (Figure 7). In contrast, at 5–40 cm depth, no difference was observed in the C:N ratio by land use system (p > 0.05). Regardless of land use, the C:N ratios were greater in the surface layers (0–30 cm) than in the deeper layers (30–100 cm).

4. Discussion

Our results confirmed the hypothesis that replacing the forest with a nominal pasture will maintain soil SOC and N stocks. The higher proportion of C4-C in the surface layers (0–40 cm) of the pasture compared to the control ecosystem (forest) characterizes the substitution of C3-C by C4-C in this layer. This phenomenon occurred during the succession of land use changes, which contributed to the roots of tropical grasses. Nevertheless, in layers deeper than 30 cm, the process was less intense because grass roots were commonly observed.
Past studies observed reductions in SOC and soil N stocks in the crop area and a depletion of C4-C from grasses [10,11,13]. This was also observed in the crop systems in the present study. This pattern resulted from frequent changes in land use until crop implementation. The reduction in soil quality depends on the stability of organic matter derived from previous vegetation, the replacement rate of organic matter, and the inherent management of crops [8,27].

4.1. Chronosequence Validation

The similarity in the soil textures of the different systems confirms that these soils have an origin similar to that of the forest soil. Soil texture is commonly used in chronosequence studies as an indicator to characterize similar soils in different systems [9]. These authors suggested that in the deeper layers of the Oxisol, the texture was uniform; therefore, only the data at 0–20 cm depth were analyzed.
In the present study, in addition to texture, apparent densities were used at depths between 40 and 100 cm as a parameter to confirm and validate that the soils were similar before the land use changes. For the different land use systems, soil densities did not differ at depths below 30 cm (Figure 2). The effects of compaction, probably induced by initial land cleaning, animal trapping, and tractor operations, are limited to the initial 40–50 cm of soil [9,22]. Thus, the evidence indicated that the soils of the forest, pasture, and crop systems were uniform before deforestation and had vegetation, similar soils, and similar management within the same system.
The bulk densities observed according to land use resulted from intrinsic factors related to the management of the respective ecosystems. Changes in land use affected the surface layers of the crop system up to a depth of 30 cm. The increase in bulk density in deeper layers may indicate an increase in clay content at these depths [6]. Therefore, based on the assumptions mentioned above, animal trampling in the pasture did not affect soil density. However, at 10–20 cm depth, this system had a higher density than the forest, possibly because of the increased clay content. Frequent land use changes and burning led to greater influences in the crop area. In addition to the higher frequencies of agricultural operations in this system, the inherent management applied to traditional black pepper cultivation, such as line spacing, increased the exposure of the soil to climate and significantly contributed to the increase in bulk density in the layers up to 30 cm [11] (Figure 2).

4.2. Organic C and Soil N

Decreasing C and N concentrations with increasing soil depth is characteristic of forest, pasture, and crop soils and is attributed to the decline in root mass with increasing depth [21]. The C and N concentrations (Figure 2 and Figure 3) in the forest and pasture area were consistent with the literature, with approximately 80% of the root biomass concentrated in the first 30 cm of soil and 45% in the upper 10 cm [10]. However, the concentration of C in the Amazon region for different land uses did not follow the same pattern as that of other biomes in tropical climates. In the Cerrado Biome and Atlantic Forest, pasture systems have higher C concentrations in the surface layers than native vegetation [6,11]. In the Amazon, native vegetation has a higher concentration of organic C than nominal pastures. The Amazon Forest has a higher proportion of root-soil because of its greater plant density.
In crop systems, there are significant variations inherent to the specificities of each crop, and generalizations for this system are inadequate. Unlike the forest and pasture system patterns, a more functional decline in the concentrations of C and N was observed in the evaluated soil profile (100 cm), which resulted from the lower distribution of pepper roots by soil volume. During black pepper cultivation, the rows were cleaner, reducing the transfer of C and N from the plants. In research conducted in areas of Dende Palm oil cultivation in the Amazon [13], higher levels of C and N were observed in soil close to the plant than between rows.
Data on apparent soil density are essential for estimating changes in SOC and soil N sinks. Without correction for soil mass, the effects of land use change were underestimated by an average of 28% [11]. Although the apparent soil density in the pasture system for the 0–30 cm profile was greater than that of the forest system at depths of 10–20 cm, it tended to be higher at other depths. This led to the SOC and soil N stocks of the pasture and forest areas being similar in the 0–30 cm layers (Table 3).
The conversion of native vegetation into crop systems causes significant losses in SOC and soil N stocks. This effect is more pronounced in soils in humid regions with low vegetation cover and intensifies with the conversion of forests into perennial crops [10,12,28]. Soil N stock plays an essential role as a primary regulator of SOC stock loss [29]. In humid areas, N losses by decomposition and leaching limit the accumulation of C. Therefore, the lowest soil N stock in our crop system may be one of the factors influencing the lower soil SOC stock.
Variations in crop management and climatic factors were the main influencers on the loss of soil SOC stocks. Higher soil temperatures and humidity regimes increase decomposition rates; therefore, SOC stock losses from soil and crops that are more susceptible to climatic weather are accelerated [11]. Ref. [10] found that the SOC stock decreased by up to −42% with forest conversion to cultivation systems and up to −59% with the conversion of pasture to cultivation systems. This reduction was more significant in areas with precipitation above 1500 mm year−1. Corroborating the meta-analysis mentioned above, in our study, the data from the crop system presented −46.2% less SOC stock than the pasture system up to 30 cm in depth and −55.8% SOC stock of the soil up to 100 cm. [12] evaluated the global average SOC stocks under several land uses and confirmed that the absolute values of SOC stock increased after conversion from agricultural land to pasture by 0.30 Mg ha−1 year−1 and from forest to pasture by 0.68 Mg ha−1 year−1 but decreased after conversion from pasture to agricultural land by 0.89 Mg ha−1 year−1, forest to agricultural land by 1.74 Mg ha−1 year−1, and forest to forest by 0.63 Mg ha−1 year−1.
Changes in SOC and soil N stocks were negatively associated with average precipitation in plantations but positively associated with pastures [30]. In regions with rainfall close to 1400 mm year−1, tree cultivation and fields reach SOC stock equilibrium within 20 years. In contrast, in areas with precipitation close to 2200 mm year−1, tree crops only reach SOC stock equilibrium after approximately 100 years. However, SOC stocks in pasture areas have been reported to be higher than that of forest areas in regions with precipitation above 1800 mm year−1 [31]. In our study, the climatic factors of the region and management of the different land uses impacted SOC and soil N stocks in the forest, pasture, and crop areas. Therefore, the average annual precipitation of 2104 mm and average annual temperature of 26 °C in the study region were favorable for expressing the maximum storage C and N in pastures but unfavorable for these factors in semi-perennial crop areas. The limited soil cover between crop lines and lower distribution of roots were likely determinants. This system showed losses in SOC and soil N stocks throughout the soil profile. Thus, under our study conditions, the frequent changes in land use that occurred in the crop area, in association with climatic factors in the Amazon region, limited these areas in maintaining SOC and soil N stocks.
The results of a trial conducted over 22 years in the Brazilian Cerrado region with an annual rainfall of 1342 mm showed that pastures and annual crop areas maintained SOC and soil N stock levels similar to those of native vegetation at depths of 30–100 cm [21]. The ability of pasture areas to maintain similar or increased SOC and soil N stock levels compared to native vegetation at depths of 30 and 100 cm was also demonstrated by Santos et al. [6]; the authors evaluated cultivars of Urochloa brizantha under fertilization, cultivated for 16 years following the removal of the native forest in the Brazilian Atlantic Forest in a region with 1300 mm year−1 of precipitation. They observed that SOC and soil N stock patterns were strongly affected by forage cultivars.
In the Eastern Amazon, which has a tropical humid climate [16], the IPCC guidelines state that 52 ± 6% SOC stock should be stored at 0–30 cm depth. Therefore, the proportion of SOC stock storage in the 0–30 cm soil depth measured in the forest (56.07%) and crop (56.9%) areas was in accordance with IPCC guidelines. However, 46.7% of the SOC stock in the pasture area was distributed at the initial depth of 30 cm. Despite the higher proportion of roots being concentrated in the surface layers, a relevant proportion of these can reach deeper layers (30–100 cm) and contribute to the optimal C distribution in the soil profile (Table 3).
The results of the present study in the Amazon region, Braz et al. [9] in the Brazilian savanna, and Santos et al. [6] in the Atlantic Forest indicated that “productive” grazing areas have equal or greater C levels than native areas. The SOC stock is the most significant in most terrestrial ecosystems [32]. Therefore, understanding the factors that govern the amount of current land C stock and the balance between plant C inputs and soil C losses is crucial for predicting the effects of future land use changes on the net greenhouse gas balance.
In the future, we should focus on the effects of land use changes on aboveground and belowground biomass to understand why soil C sequestration has been reported to be similar in grasslands and forests in tropical areas. Belowground biomass (roots) may sustain C stocks in grasslands.

4.3. C Origin

According to Gatti et al. [7], the increase in soil 13C abundance, as observed in the deepest layers (Figure 5), was not considered because of the presence of C4-C in the forest area because the total value of 13C of plants can be naturally enriched or exhausted. Therefore, greater decomposition of organic material at lower depths in the soil profile is related to more or less enrichment of 13C than at the surface.
Few studies have evaluated the abundance of 13C in pastures at depths greater than 30 cm in Brazil. However, the observed results corroborate our findings that forage can deposit C beyond a depth of 30 cm, regardless of the Brazilian region [6,21].
In crop systems, frequent changes in land use and soil exposure lead to higher rates of soil organic matter decomposition [32]. However, this trend is characteristic of agricultural cultivation, such as that of black pepper. In the present study, total C decreased during black pepper cultivation. Similarly, C4-C was lost during the five years from pasture to crop. The abundance of 13C after the change in land use from forest to pasture indicated an increase in the deposition of C4-C owing to the decomposition of grass roots throughout the soil profile (Figure 5). Studies conducted in the Brazilian Cerrado and Atlantic Forest reinforced that forage roots, such as Marandu palisade grass, can penetrate at least 1 m deep and consequently deposit significant amounts of C4-C [6,11,21].
Ref. [6] observed that the C loss (C3-C) derived from a forest area replaced by Marandu palisade grass at 16 years of age was compensated by the accumulation of C (C4-C) derived from the pasture. In this area, at the initial 30 cm of depth, there was a loss of C that originated from trees (12.6 Mg C ha−1) and a gain of C from grasses (43.2 Mg C ha−1). The authors attributed the increase in C to the slow decomposition of C derived from the forest. In soils in humid tropics, soluble organic matter deposited at depths greater than 30 cm degrades slowly [9]. In a tropical wet climate, pastures have more favorable conditions for the growth and deposition of C4-C in the deeper layers, but less intensely than in the surface layers. However, frequent changes in land use in regions with higher temperatures, humidity, and successive crops leave soils more exposed and affect the C dynamics in deeper layers more rapidly (Figure 7).

4.4. Light Organic Matter and C:N Ratio

LOM should not be analyzed separately because its dynamics in the system depend on factors such as decomposition by microorganisms and changes in land management and use, which make it more labile [33]. The SOC stock data derived from C4-C and LOM (Table 4) suggested that the pasture had a higher organic matter turnover derived from forage roots.
The C:N ratio at 0–5 cm depth was highest in the forest and pasture systems (Figure 6), indicating a higher soil organic matter content correlated with a low N input from the roots of different land uses [9]. The high C:N ratio also suggests the presence of charcoal and fire fragments in these regions [21]. This indicated that both systems (forest and pasture) produced more roots when the C:N ratio in the surface layers of the soil was high.
Soil microbial biomass C represents the active and biodegradable fraction of soil organic matter and is partially composed of several species of microorganisms that act as agents in the mineralization of organic matter. The dynamics of microbial activity are regulated, among other factors, by the C:N ratio of the soil, as the relationship between these two elements in the soil interferes with the degree of humification and stability of soil organic matter [34]. The fact that this relationship is a smaller agricultural system in the surface layer indicates that the decomposition process of organic matter is accelerated in this region, resulting in emissions and reduced mineralization of soil organic matter in the aforementioned system.

4.5. Challenges and Gaps in Adopting the Chronosequence

Historically, the substitution of areas of the Amazon Forest in the Arc of Deforestation with pastures was related to a transition starting with the selective extraction of wood for economic use, subsequent felling, burning of plant biomass, and sowing of forage seeds without incorporation by soil tillage. Generally, at least three fires are conducted in these areas to encourage the regrowth of forest species sources. Burning the pasture after planting is recommended only in windrows, but some producers burn the entire area to contain the invaders. Our findings showed that pasture areas formed by the conventional method recovered SOC from the soil, replacing part of the C3-C derived from the forest with C4-C from grass. However, the black pepper crop was a source of C. Soil N stocks were better preserved in the forest and pasture systems than in the black pepper crop system. However, it should be emphasized that the results for the agricultural system are specific to the evaluated crop, planting conditions, soil, and climate because of the diversity of species cultivated in the biome, climate, and soil of the Amazon region. Therefore, further studies are required.
Most forests surrounding planting areas in the Amazon region have been commercially exploited (selective exploitation) for decades. In forested areas that border pastures or crops, it is common to report fires of different intensities, with a predominant occurrence at the margins of the planting areas. However, the only visible trace of the economic exploitation of forests is a reduction in the diameter of trees and the diversity of hardwood plants. SOC stocks are resistant to logging and fires; however, soils that suffer from fires leave traces of charcoal in their surface layers. This was demonstrated by Berenguer et al. [1], who evaluated two distinct regions of the Eastern Amazon under different forest exploitation systems in Pará, Brazil. They inferred those forests with selective logging had 18–35% less C above ground than undisturbed forests but partial logging did not affect soil SOC stock. This allowed areas with selective logging to be used in research to determine soil C dynamics after land use change in the Brazilian Amazon region.
About the fire use, the effects may have been mainly in the superficial layers, and have been diluted over time, as the fire was used only as a strategy to facilitate the transformation of land use change, and not as frequent management from soil [35]. Furthermore, the area used was flat and there was no frequency of machinery in the areas, as pepper collection is carried out manually. In contrast, pasture areas had no frequent operations with machinery. However, we emphasize that the effects of fire on agricultural and pasture areas in the Amazon system still need to be better clarified.
One of the challenges in working with chronosequences is the difficulty of accurately attaining the history of use of an area [9], as it is common for areas to have owners other than those who deforested them. Future paired studies over time in the Brazilian Amazon may provide information to better monitor the exact point of transition from forest to new land use. Chronosequences are fundamental for guiding the changes that have occurred to date.

5. Conclusions

In the Eastern Amazon, the C and N stocks of the pasture area soil were similar to those of native vegetation, whereas those of the crop areas were smaller. C stocks are influenced by area usage history, current activity, and climatic factors. Changes in land use to nominal pastures in tropical climates maintain organic C and N stocks in the soil and are more sustainable than agricultural systems with black pepper, provided that the soil, climate, and soil conditions are similar.
Losses of C and N in the soil resulting from the process of replacing forests with pastures have been compensated for over the years. The assessment of the C origin showed that the C4-C derived from pasture replaced part of the C3-C derived from the forest up to a depth of 100 cm, and that part of the C3-C from the forest was preserved even in the superficial layers (0–30 cm). Agricultural systems with black pepper in areas previously cultivated with pastures lose C4-C more intensely than those in pasture areas.

Author Contributions

Conceptualization: J.C.d.A., A.d.S.C., N.M.L.F., C.F., T.C.d.S., R.A.R. and A.C.d.R.; Data curation: J.C.d.A., A.d.S.C., N.M.L.F., V.E.C. and A.C.d.R.; Formal analysis: J.C.d.A., A.d.S.C., N.M.L.F., V.E.C. and A.C.d.R.; Funding acquisition: A.d.S.C., C.F., A.C.R., R.A.R. and A.C.d.R.; Investigation: J.C.d.A., A.d.S.C., N.M.L.F., V.E.C., A.C.R., R.A.R. and A.C.d.R.; Methodology, J.C.d.A., A.d.S.C., N.M.L.F., C.F., T.C.d.S., F.N.D., V.E.C., A.C.R., R.A.R. and A.C.d.R.; Project administration: J.C.d.A., A.d.S.C. and A.C.d.R.; Supervision: A.d.S.C., C.F., T.C.d.S., F.N.D., A.C.R., R.A.R. and A.C.d.R.; Visualization: J.C.d.A., A.d.S.C., N.M.L.F. and A.C.d.R.; writing—original draft preparation: J.C.d.A., A.d.S.C., N.M.L.F. and A.C.d.R. writing—review and editing: J.C.d.A., A.d.S.C., N.M.L.F. and A.C.d.R. All authors have read and agreed to the published version of the manuscript.

Funding

This study was financed in part by the Coordination for the Improvement of Higher Education Personnel (CAPES)—project 88887.510270/2020-00 PDPG, Amazon Support Foundation Studies and Research (FAPESPA)—grant 071/2020 and grants 2017/11272-5 and 2018/16273-0 from the São Paulo Research Foundation (FAPESP).

Institutional Review Board Statement

Not applicable.

Informed Consent Statement

Not applicable.

Data Availability Statement

The data presented in this study are available upon request from the corresponding author. The data are not publicly available due to the need to account for the results.

Acknowledgments

We would like to thank the study groups on ruminants and forage production in the Amazon (GERFAM) and forage (UnespFor) for their support in conducting the experiments.

Conflicts of Interest

The authors declare no conflicts of interest.

References

  1. Berenguer, E.; Ferreira, J.; Gardner, T.A.; Aragão, L.E.O.C.; Camargo, P.B.; Cerri, C.E.; Durigan, M.; Oliveira Junior, R.C.; Vieira, I.C.G.; Barlow, J. A large-scale field assessment of carbon stocks in human-modified tropical forests. Glob. Chang. Biol. 2014, 20, 3713–3726. [Google Scholar] [CrossRef]
  2. Fujisaki, K.; Perrin, A.S.; Desjardins, T.; Bernoux, M.; Balbino, L.C.; Brossard, M. From forest to cropland and pasture systems: A critical review of soil organic carbon stocks changes in Amazonia. Glob. Chang. Biol. 2015, 21, 2773–2786. [Google Scholar] [CrossRef] [PubMed]
  3. Sonter, L.J.; Herrera, D.; Barrett, D.J.; Galford, G.L.; Moran, C.J.; Soares Filho, B.S. Mining drives extensive deforestation in the Brazilian Amazon. Nat. Com. 2017, 8, 1013. [Google Scholar] [CrossRef] [PubMed]
  4. Silva, F.F.; Fulginiti, L.E.; Perrin, R.K. The Cost of Forest Preservation in the Brazilian Amazon: The “Arc of Deforestation”. J. Agri. Resour. Econ. 2019, 44, 497–512. [Google Scholar] [CrossRef]
  5. Hargrave, J.; Kis-Kato, K. Economic Causes of Deforestation in the Brazilian Amazon: A Panel Data Analysis for the 2000s. Environ. Resour. Econ. 2013, 54, 471–494. [Google Scholar] [CrossRef]
  6. Santos, C.A.; Rezende, C.P.; Pinheiro, E.F.; Pereira, J.M.; Alves, B.J.R.; Urquiaga, S.; Boddey, R.M. Changes in soil carbon stocks after land-use change from native vegetation to pastures in the Atlantic forest region of Brazil. Geoderma 2019, 337, 394–401. [Google Scholar] [CrossRef]
  7. Gatti, L.V.; Basso, L.S.; Miller, J.B.; Gloor, M.; Domingues, L.G.; Cassol, H.L.G.; Tejeda, G.; Aragão, L.E.O.C.; Nobre, C.; Peters, W.; et al. Amazonia is a carbon source linked to deforestation and climate change. Nature 2021, 595, 388–393. [Google Scholar] [CrossRef] [PubMed]
  8. Salimon, C.I.; Wadt, P.G.S.; Alves, S.S. Decrease in carbon stocks in an oxisol due to land use and cover change in southwestern Amazon. Ambi-Agua 2009, 4, 57–65. [Google Scholar] [CrossRef]
  9. Braz, S.P.; Urquiaga, S.; Alves, B.J.R.; Jantalia, C.P.; Guimarães, A.P.; dos Santos, C.A.; dos Santos, S.C.; Pinheiro, E.M.; Boddey, R.M. Soil carbon stocks under productive and degraded Brachiaria pastures in the Brazilian Cerrados. Soil Sci. Soc. Am. J. 2013, 77, 914–928. [Google Scholar] [CrossRef]
  10. Guo, L.B.; Gifford, R. Soil carbon stocks and land use change: A meta analysis. Glob. Chang. Biol. 2002, 8, 345–360. [Google Scholar] [CrossRef]
  11. Don, A.; Schumacher, J.; Freibauer, A. Impact of tropical land-use change on soil organic carbon stocks–a meta-analysis. Glob. Chang. Biol. 2011, 17, 1658–1670. [Google Scholar] [CrossRef]
  12. Deng, L.; Zhu, G.; Tang, Z.; Shangguan, Z. Global patterns of the effects of land-use changes on soil carbon stocks. Glob. Ecol. Conser. 2016, 5, 127–138. [Google Scholar] [CrossRef]
  13. Frazão, L.A.; Paustian, K.; Cerri, C.E.P.; Cerri, C.C. Soil carbon stocks and changes after oil palm introduction in the Brazilian Amazon. Glob. Chang. Biol. Bioenergy 2013, 5, 384–390. [Google Scholar] [CrossRef]
  14. Rittl, T.F.; Oliveira, D.; Cerri, C.E.P. Soil carbon stock changes under different land uses in the Amazon. Geoderma Reg. 2017, 10, 138–143. [Google Scholar] [CrossRef]
  15. Navarrete, D.; Sitch, S.; Aragão, L.E.O.C.; Pedroni, L. Conversion from forests to pastures in the Colombian Amazon leads to contrasting soil carbon dynamics depending on land management practices. Glob. Chang. Biol. 2016, 22, 3503–3517. [Google Scholar] [CrossRef] [PubMed]
  16. IPCC. IPCC Guidelines for National Greenhouse Gas Inventories; Eggleston, H.S., Buendia, L., Miwa, K., Ngara, T., Tanabe, K., Eds.; IPCC: Geneva, Switzerland, 2019. [Google Scholar]
  17. Alvares, C.A.; Stape, J.L.; Sentelhas, P.C.; Gonçalves, J.L.M.; Sparovek, G. Köppen’s climate classification map for Brazil. Meteorol. Zeits 2013, 22, 711–728. [Google Scholar] [CrossRef] [PubMed]
  18. Santos, H.G.; Jacomine, P.K.T.; Anjos, L.H.C.; Oliveira, V.A.; Lumbreras, J.F.; Coelho, M.R.; Almeida, J.A.; Araújo Filho, J.C.; Oliveira, J.B.; Cunha, T.J.F. Sistema Brasileiro de Classificação de Solos, 5th ed.; Embrapa: Brasília, Brazil, 2018; ISBN 978-85-7035-800-4. [Google Scholar]
  19. IUSS Working Group WRB. World Reference Base for Soil Resources 2014, Update 2015; International Union of Soil Sciences: Rome, Italy, 2015. [Google Scholar]
  20. Adewopo, J.B.; Silveira, M.L.; Xu, S.; Gerber, S.; Sollenberger, L.E.; Martin, T.A. Management Intensification Impacts on Soil and Ecosystem Carbon Stocks in Subtropical Grasslands. Soil Sci. Am. J. 2014, 78, 977–986. [Google Scholar] [CrossRef]
  21. Sant-Anna, S.A.C.; Jantalia, C.P.; Sá, J.M.; Vilela, L.; Marchão, R.L.; Alves, B.J.R.; Urquiaga, S.; Boddey, R.M. Changes in soil organic carbon during 22 years of pastures, cropping or integrated crop/livestock systems in the Brazilian Cerrado. Nutr. Cycl. Agroecosyst. 2017, 108, 101–120. [Google Scholar] [CrossRef]
  22. Sisti, C.P.J.; Santos, H.P.D.; Kochhann, R.A.; Alves, B.J.R.; Urquiaga, S.; Boddey, R.M. Change in carbon and nitrogen stocks in soil under 13 years of conventional or zero tillage in southern Brazil. Soil Tillage Res. 2004, 76, 39–58. [Google Scholar] [CrossRef]
  23. Urquiaga, S.; Cruz, K.H.S.; Boddey, R.M. Contribution of Nitrogen Fixation to Sugar Cane: Nitrogen-15 and Nitrogen-Balance Estimates. Soil Sci. Am. J. 1992, 56, 105–114. [Google Scholar] [CrossRef]
  24. Coplen, T.B. Guidelines and recommended terms for expression of stablele isotope-ratio and gas-ratio measurement results. Rapid Commun. Mass Spectrom. 2011, 25, 2538–2560. [Google Scholar] [CrossRef]
  25. Cerri, C.C.; Feller, C.; Balesdent, J.; Victoria, R.; Plenecassegne, A. Application du traçage isotopique naturel en 13C, à l’étude de la dynamique de la matière organique dans les sols. Comptes Rendus L’Academie Sci. 1985, 300, 423–428. [Google Scholar]
  26. Moraes, J.F.L.; Volkoff, B.; Cerri, C.C.; Bernoux, M. Soil properties under Amazon forest and changes due to pasture installation in Rondonia, Brazil. Geoderma 1996, 70, 63–81. [Google Scholar] [CrossRef]
  27. Anderson, J.M.; Ingram, J.S.I. Tropical Soil Biology and Fertility: A Handbook of Methods, 1st ed.; CAB International: Wallington, UK, 1985. [Google Scholar] [CrossRef]
  28. Cerri, C.E.P.; Easter, M.; Paustian, K.; Killian, K.; Coleman, K.; Bernoux, M.; Fallon, P.; Powlson, D.S.; Batjses, N.; Milne, E.; et al. Simulating SOC changes in 11 land use change chronosequences from the Brazilian Amazon with RothC and Century models. Agric. Ecosyst. Environ. 2007, 122, 46–57. [Google Scholar] [CrossRef]
  29. Lal, R. Digging deeper: A holistic perspective of factors affecting soil organic carbon sequestration in agroecosystems. Glob. Chang. Biol. 2018, 24, 3285–3301. [Google Scholar] [CrossRef] [PubMed]
  30. Eclesia, R.P.; Jobbagy, E.G.; Jackson, R.B.; Biganzoli, F.; Pineiro, G. Shifts in soil organic carbon for plantation and pasture establelishment in native forests and grasslands of South America. Glob. Chang. Biol. 2012, 18, 3237–3251. [Google Scholar] [CrossRef]
  31. Tuo, D.; Gao, G.; Chang, R.; Li, Z.; Ma, Y.; Wang, S.; Fu, B. Effects of revegetation and precipitation gradient on soil carbon and nitrogen variations in deep profiles on the Loess Plateau of China. Sci. Total Environ. 2018, 626, 399–441. [Google Scholar] [CrossRef] [PubMed]
  32. Lal, R. Carbon sequestration. Philos. Trans. R. Soc. B 2008, 363, 815–830. [Google Scholar] [CrossRef]
  33. Freitas, I.C.; Ribeiro, J.M.; Araújo, N.C.A.; Santos, M.V.; Sampaio, R.A.; Fernandes, L.A.; Azevedo, A.M.; Feigl, B.J.; Cerri, C.E.P.; Frazão, L.A. Agrosilvopastoral Systems and Well-Managed Pastures Increase Soil Carbon Stocks in the Brazilian Cerrado. Rangel. Ecol. Manag. 2020, 73, 776–785. [Google Scholar] [CrossRef]
  34. Moitinho, M.R.; Teixeira, D.D.B.; Bicalho, E.d.S.; Panosso, A.R.; Ferraudo, A.S.; Pereira, G.T.; Tsai, S.M.; Borges, B.M.F.; La Scala, N. Soil CO2 emission and soil attributes associated with the microbiota of a sugarcane area in southern Brazil. Sci. Rep. 2021, 11, 8325. [Google Scholar] [CrossRef]
  35. Bai, Y.; Cotrufo, M.F. Grassland soil carbon sequestration: Current understanding, challenges, and solutions. Science 2022, 377, 603–608. [Google Scholar] [CrossRef] [PubMed]
Figure 1. Country of collection soil (A); State of collection soil (B); Town and points of collection soil (C).
Soilsystems 08 00025 g001
Figure 2. Soil density (g cm−3) in the 0–100 cm depth profile under different land uses in the Amazon region. Averages in the same line followed by the same letter are not significantly different (p < 0.05).
Soilsystems 08 00025 g002
Figure 3. Organic carbon concentration in the soil profile (g C kg soil−1) at 0–100 cm depth under different land uses in the Amazon region. Averages in the same line followed by the same letter are not significantly different (p < 0.05).
Soilsystems 08 00025 g003
Figure 4. N concentration in the soil profile (g N kg soil−1) of 0–100 cm depth under different land uses in the Amazon region. Averages in the same line followed by the same letter are not significantly different (p < 0.05).
Soilsystems 08 00025 g004
Figure 5. Abundance of 13C in the soil profile at 0–100 cm depth under different land uses in the Amazon region. Averages in the same line followed by the same letter are not significantly different (p < 0.05).
Soilsystems 08 00025 g005
Figure 6. Estimation of carbon in the soil profile of 0–100 cm derived from forest areas (C3-C), black pepper (C3-C), and pasture (C4-C). The error bar represents the average carbon error derived from plants C3-C and C4-C.
Soilsystems 08 00025 g006
Figure 7. Carbon:nitrogen ratio in the soil profile of 0–100 cm depth under different land uses in the Amazon region. Averages in the same line followed by the same letter are not significantly different (p < 0.05).
Soilsystems 08 00025 g007
Table 1. Background characteristics of different land use systems at the sampling locations.
SystemLand Use History
Site 1Site 2Site 3Site 4
Forest
  • Forests affected by logging that did not show indication of suppression for 25 years.
  • Forests affected by logging that did not show indication of suppression for 25 years.
  • Forests affected by logging that did not show indication of suppression for 25 years.
  • Forests affected by logging that did not show indication of suppression for 25 years.
Pasture
1.
Formed with marandu grass in 2007.
2.
Fertilization a
3.
Current cultivation duration for 12 years.
1.
Over 24 years, area was used to cultivate cassava.
2.
In 2012 it was burned and replaced by marandu grass.
3.
Fertilization b
4.
Current cultivation duration for 7 years.
1.
Formed in 1988 using the same methods and forage species as the site.
2.
No Fertilization
3.
Current cultivation duration for 31 years.
1.
Formed in 2004 using the same methods and forage species as site 1 and 3.
2.
Fertilization a
3.
Current cultivation duration for 15 years.
Crop
1.
Opened in the 2000s with forest suppression, and pasture formation using marandu grass.
2.
In 2010, the pasture was replaced by a black pepper crop.
3.
Fertilization c
4.
Current cultivation duration 9 years.
1.
Formed by forest suppression, forest burning in the 1990s, and subsequent pasture formation with marandu grass.
2.
In 2012, a burn was conducted, and the pasture was replaced with black pepper in 2014.
3.
Fertilization b
4.
Current cultivation duration 5 years.
1.
Formed by forest suppression, forest burning in the 1990s, and subsequent pasture formation with marandu grass.
2.
In 2012, a burn was conducted, and the pasture was replaced with black pepper in 2014.
3.
Fertilization b
4.
Current cultivation duration 5 years.
1.
Formed by forest suppression, forest burning in the 1990s, and subsequent pasture formation with marandu grass.
2.
In 2012, a burn was conducted, and the pasture was replaced with black pepper in 2014.
3.
Fertilization b
4.
Current cultivation duration 5 years.
a Suppression refers to the legal or illegal exploitation of value-added wood. b Fertilization with the reactive natural phosphate Arad corresponded to 90 kg P2O5 ha−1. c In all crop areas (sites), organic fertilization with poultry litter and cultural remains was performed annually in addition to standard chemical fertilization with 52.5, 32.8, and 82.8 g plant−1 year−1 of nitrogen, phosphorus, and potassium, respectively.
Table 2. Soil chemical characteristics according to the treatment.
Land UsepHOMCaMgKAlHV%SandSiltClay
Cacl2%mmolc dm−3%
Forest 14.32.34.02.00.314.038.010.0671123.0
Forest 24.02.76.02.00.413.060.011.074620.0
Forest 35.01.132.08.00.93.044.046.0391645.0
Forest 44.01.37.05.01.013.098.010.0121230.0
Pasture 14.73.4338.01.31.047.047.032.019.060.0
Pasture 24.81.012.04.00.40.023.042.081.04.015.0
Pasture 34.91.022.06.00.30.028.052.056.07.037.0
Pasture 44.82.028.07.00.51.036.049.034.08.034.0
Crop 15.12.348.010.00.50.034.063.044.08.048.0
Crop 24.71.317.05.00.51.026.046.078.05.018.0
Crop 34.81.014.05.00.40.028.041.077.06.017.0
Crop 44.21.05.03.00.34.034.018.071.06.023.0
OM, organic matter; Ca, calcium; Mg, magnesium; K, potassium; Al, aluminum; H, hydrogen; V%, base saturation.
Table 3. Stocks 1 of C and N in the soil profile at 30 and 100 cm depths under different uses of the Amazon region land.
ForestPastureCropCV 2 (%)
Carbon stock (Mg C ha−1)
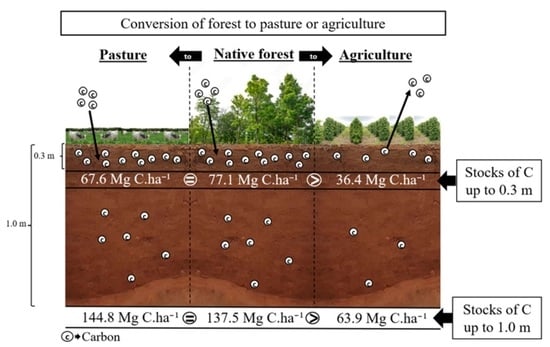
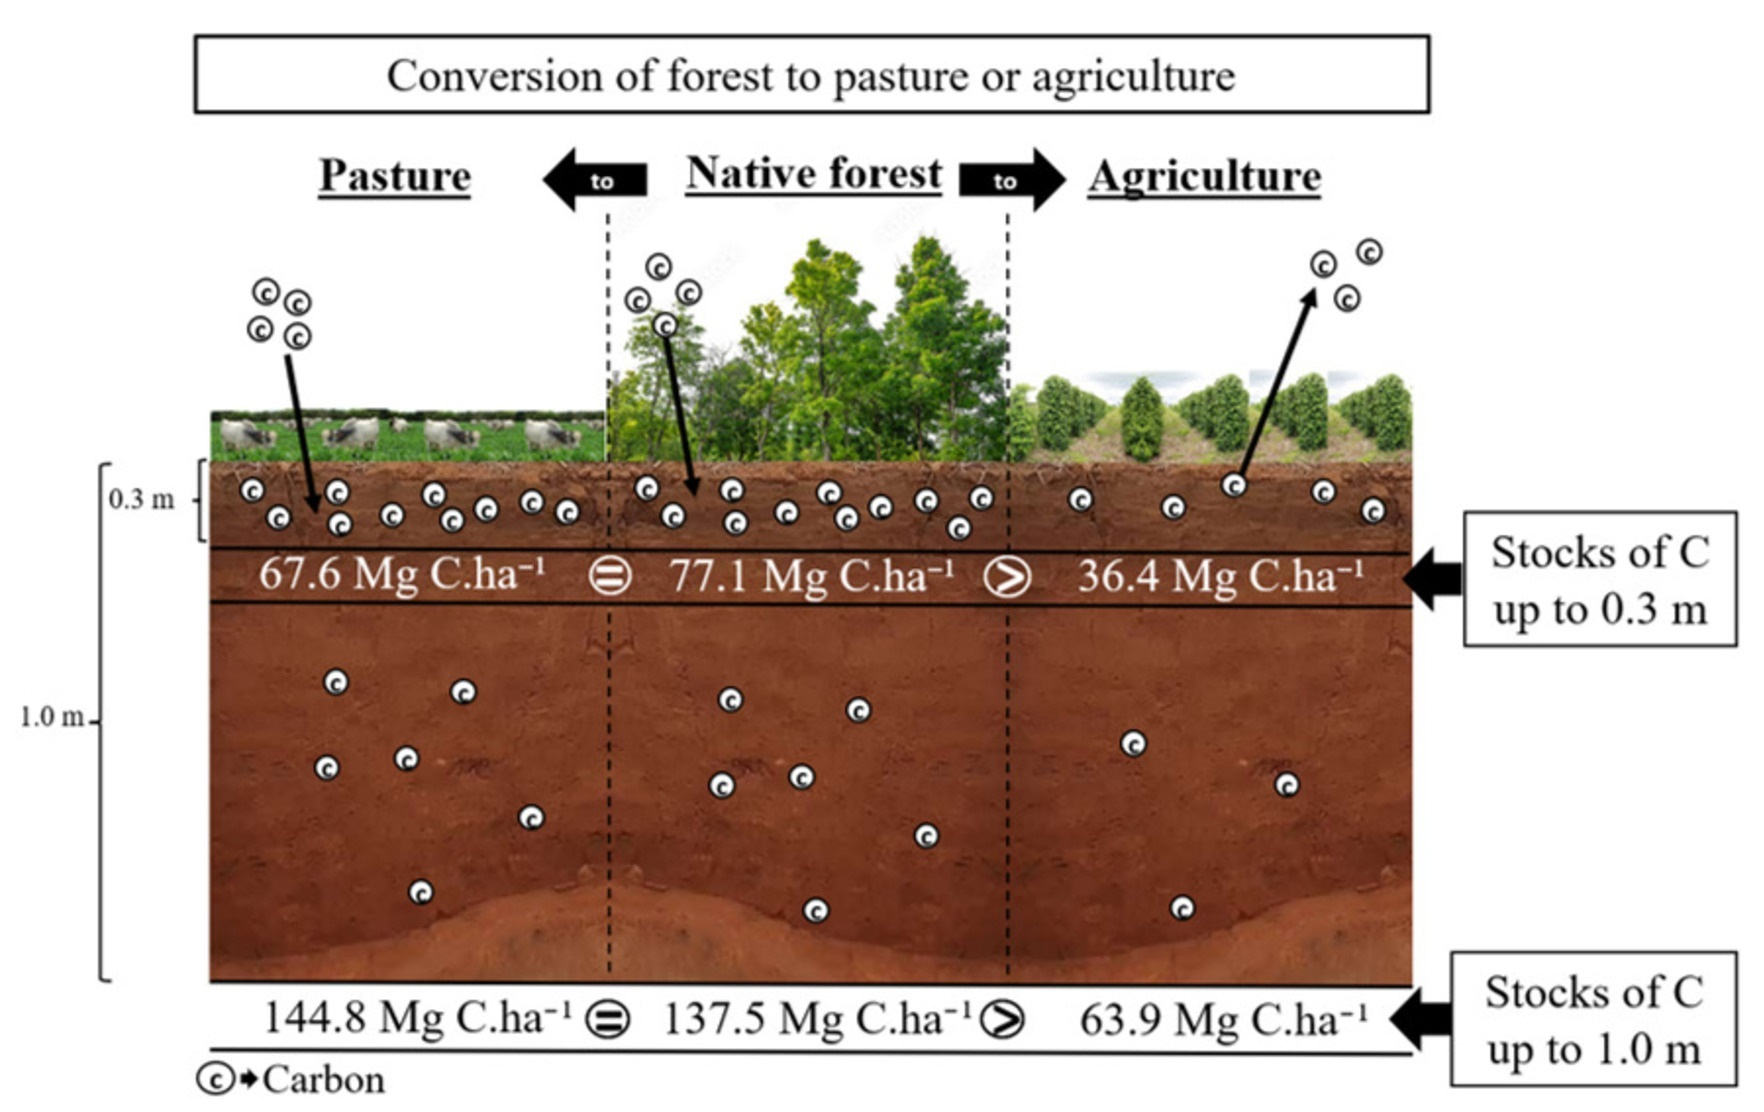
30 cm77.1 a 267.6 a36.4 b7.7 ***
100 cm137.5 a144.8 a63.9 b4.2 ***
Nitrogen stock (Mg N ha−1)
30 cm6.3 a5.7 a3.0 b24.0 *
100 cm13.8 a13.3 a6.0 b17.9 *
1 Stocks of C and N stocks were corrected for the same reference soil mass (forests at 30 and 100 cm depths). 2 Coefficient of variation. Note: * and *** indicate p < 0.05 and p < 0.001, respectively. Averages in the same row followed by the same letter are not significantly different (p < 0.05).
Table 4. Organic matter of the soil profile at depths of 0 to 30 cm with different land uses in the Amazon region.
ForestCropPastureCoeff. Variation 2 (%)
Light fraction of soil organic matter (Mg SOM ha−1)
0–5 cm10.0 a 12.2 b4.0 ab25.2 *
5–10 cm1.6 b0.9 b4.2 a35.2 **
10–20 cm1.8 b0.6 c3.2 a12.8 ***
20–30 cm1.10.90.932.0
1 Averages in the same line followed by the same letter are not significantly different (p < 0.05). 2 Coefficient of variation. Note: *, ** and *** mean p < 0.05, p < 0.01 and p < 0.001 respectively.
Disclaimer/Publisher’s Note: The statements, opinions and data contained in all publications are solely those of the individual author(s) and contributor(s) and not of MDPI and/or the editor(s). MDPI and/or the editor(s) disclaim responsibility for any injury to people or property resulting from any ideas, methods, instructions or products referred to in the content.

