Abstract
Conservation units are strategic territories that have a high demand for public use, as they protect attractions of great scenic beauty, geodiversity sites, and numerous leisure areas. However, when carried out in an intensive and disorderly manner, tourist activity in these areas tends to catalyze environmental degradation, triggering, for example, water erosion processes caused by intensive soil trampling on the trails. In this sense, the aim of this study was to determine the soil’s physicochemical characteristics, and to spatiotemporally monitor the microtopography of those areas degraded by erosion along two trails on Serra da Bocaina National Park coast of the Paraty Municipality. The findings verified that intensive trampling, the values of some soil physicochemical characteristics, and the specific meteorological conditions of the coastal region of this protected area were factors that contributed significantly to the evolution of erosion features monitored on these trails. Finally, strategies for appropriate management and recovery actions for these degraded areas are proposed in order to not only stop the erosive processes and re-establish the local ecosystem balance, but also avoid accidents involving the numerous tourists who visit the coastal region.
1. Introduction
Water erosive processes cause soil degradation through the breakdown, transport, and deposition of particles by the action of water from raindrops and runoff, which corresponds with ~72% of the land affected by soil erosion in the world [1]. Its occurrence is intensifying due to climate change and human actions; therefore, it is one of the main environmental and socioeconomic challenges that society faces today. When induced by anthropic actions, these processes, in addition to impacting biogeochemical cycles, promote biodiversity loss, declines in agricultural productivity, carbon storage, increases in hunger, food insecurity, poverty, and social inequality [2,3,4,5,6].
Soil trampling on trails for public use, for example, is a human activity that causes soil degradation and occurrence of these processes, especially when these actions are carried out in an intensive and disorderly way. These activities corroborate with the alteration of the characteristic physicochemical and biological changes in the soil, which, in turn, modify the hydraulic and edaphic dynamics, since, in addition to reducing organic matter levels, porosity values, and water infiltration rates, they cause an increase in bulk density, runoff volume, and soil loss due to erosion [7,8,9,10].
There are many networks of local, regional, national, and international trails maintained and built to offer leisure and recreation opportunities, especially in protected areas, such as conservation units (UCs). These territories have experienced considerable growth in the number of visitors, as their trails are spaces that allow access to areas of leisure and scenic beauty. Consequently, these places have become highly susceptible to soil degradation through water erosive processes [11,12,13,14,15].
Fonseca Filho [16], for example, monitored soil compaction and erosion on trails in the UCs of Minas Gerais State and identified intensive trampling as one of the causes of trail degradation. Rangel et al. [17] also demonstrated the influence of human trampling on soil erosion in two UCs in southeastern Brazil. Figueiredo and Martins [18] discussed the mechanisms that lead to trail degradation in protected areas, pointing out that a lack of planning, management, and maintenance is associated with the occurrence of erosion processes in these areas. Lima and Guerra [10] studied the Morro Dois Irmãos Trail, which is part of a protected area in Rio de Janeiro Municipality, and identified several erosion features along its path, pointing to the physical–chemical characteristics of the soil together with the intensive trampling by people as the main causes of the development of rills. Lima et al. [9] also identified the evolution of erosion features on trails on the Serra da Bocaina National Park (PNSB) coast, indicating intense and disorderly visitation as one of the factors that corroborates the dynamics of this behavior.
Monitoring and analyzing the microtopography and soil physical–chemical characteristics in time and space on trails with water erosion processes, especially those located inside UCs, are extremely useful for the management and planning of these protected areas, because surveys can not only support decision making by their managers in actions that aim to identify and minimize these processes, but also help in optimizing management practices in degraded areas, in addition to guiding the re-establishment of their ecosystem balance through erosion processes in these territories [14,19].
In this context, this study aims to conduct a spatial survey of the soil’s physical and chemical characteristics on trails on the coast of the Serra da Bocaina National Park (PNSB) in Paraty Municipality of Brazil, in addition to evaluating the space–time evolution of water erosion processes through monitoring associations between soil microtopography and rainfall data. This protected area, located in one of the largest stretches of continuous and conserved forests in the Atlantic Forest, has numerous geotouristic attractions in its territory, which, in turn, makes it a scene of high demand for tourists, with an intense flow of people on its trails during the summer and holidays (vacations). Its trails and beaches receive an average of around eight thousand people per day [20], making the high demand for visits an agent that triggers the environmental degradation of the trails [9,17,20,21,22].
2. Materials and Methods
2.1. Study Area
The PNSB, covering ~106,000 ha, is a UC that was created in 1972 in São Paulo State (Areias, Cunha, São José do Barreiro and Ubatuba Municipalities) and Rio de Janeiro State (Paraty and Angra dos Reis Municipalities). It has the objectives of preserving and conserving forest formations and associated refuges; ensuring the maintenance of natural landscapes; protecting biodiversity and water resources; and providing opportunities for scientific research, leisure, and recreation [23,24]. This UC is one of the largest protected areas of the Atlantic Forest, the largest continuous extension, and one of the most significant Brazilian remnants of this biome, with several geotouristic attractions (Figure 1).
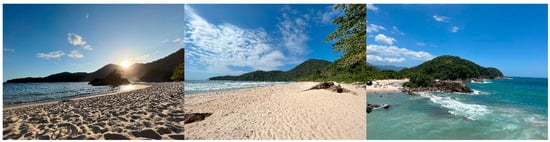
Figure 1.
Geotouristic attractions on PNSB coast. Middle Beach (left), Caixa D’Aço Beach (center), and Middle Beach Tombolo (right). Photos: Lima.
On the PNSB coast, the trails which we will focus on in this study are Waterfall of Stone that Swallows (WSS) (red) and the Caixa D’Aço Natural Pool (CDN) (orange) (Figure 2).
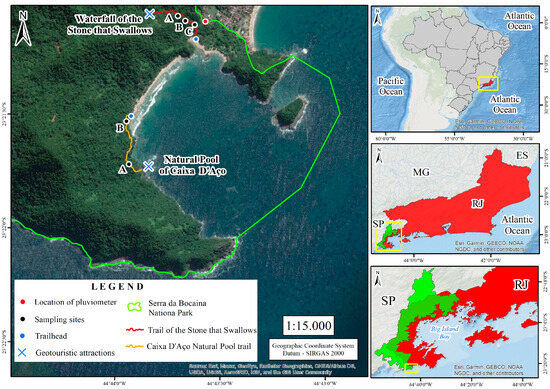
Figure 2.
Location map of the study area on the Serra da Bocaina National Park (PNSB) coast. Author: Lima.
These trails are located in the relief of the mountains and hills, under soils and surface residuals, with rocky outcrops of granite Paraty-Mirim and colluvial–alluvial sediments. In general, they have a base saturation of less than 50%, which, in turn, gives them a dystrophic character, in addition to high acidity and high aluminum content. Also, according to mapping carried out at a scale of 1:250,000 [25], the soils that predominate the trails are dystrophic Haplic Cambisols. These classes, as well as Litholic Neosols, also occur in the mountainous region of the PNSB, on the escarpments and on the coastal strip between Serra do Mar escarpment and the plains. Oxisols, on the other hand, occur at the top and on smoother slopes [9,23,26].
The Swallows trail has a length of ~600 m, with an average slope of approximately 12.4% and an altitude range between 0 and 46 m (Figure 3), It gives access to the WSS (Figure 4). The CDN Trail is also ~600 m long, with an average slope of around 14.3% and an altitude range of 0 to 63 m (Figure 3), and it provides access to the CDN (Figure 4).
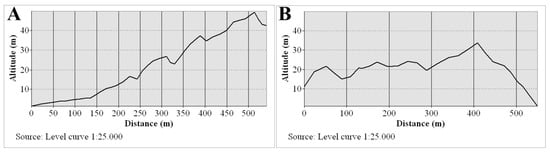
Figure 3.
Topographic profiles of the trail to the Waterfall of Stone that Swallows (A) and the Caixa D’Aço Natural Pool Trail (B) on the coast of the PNSB. Author: Lima.
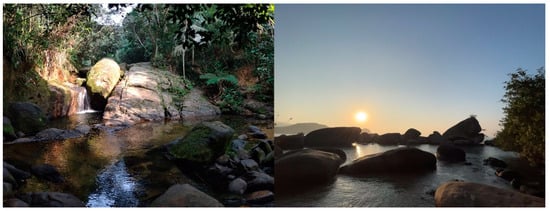
Figure 4.
Geotouristic attractions on the trails studied on the PNSB coast: (left) Waterfall of Stone that Swallows and (right) Caixa D’Aço Natural Pool. Photos: Lima.
Geologically, the rocks are from the Rio Negro Magmatic Arch (orthogneisses) and the Parati-Mirim Granite Suite (granites), as well as later fluvio-marine sediments (Cenozoic). Regarding climate, this is influenced by the orographic effect of the Serra do Mar, as the compartmentalization of the relief and the altimetric unevenness of the mountain range. The mountain range extends from sea level to altitudes exceeding 2000 m and acts as a barrier to the air masses responsible for the behavior of meteorological phenomena. The escarpments of Serra do Mar and its mountainous plateau make passage difficult for frontal systems (cold fronts) coming from the South Atlantic/Antarctica, and, as such, are responsible for regional rainfall, generating temporal space–time discontinuities in these phenomena [24,27]. Therefore, the Serra do Mar slopes facing the ocean (south) generate a strong seasonality in the precipitation on PNSB coast, making the frontal systems (cold fronts) and the rains frequent in the summer, while winter precipitations are minimal [23,24,27].
2.2. Methodology
The determination of the soil physicochemical properties (e.g., granulometry, porosity, bulk density, pH, and organic matter content) were chosen because they are related to erodibility and soil use and management, given that their values are influenced and/or modified by intensive trampling of the ground, mainly by the flow of tourists where the surveyed trails are located [9,10,17,22].
Soil samples were collected at depths between 0 and 20 cm at strategic points along the trails: in places on the beds of the trails where there are erosive features, that is, areas that suffer trampling, and those areas immediately adjacent (edge) to the trails, where there is no passage of visitors (Figure 5 and Figure 6). Therefore, it was possible to infer the impact of trampling by people and to spatially compare soil quality.
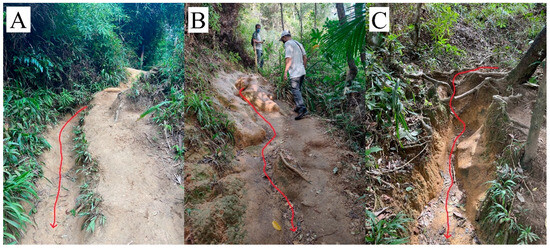
Figure 5.
Soil collection sites (A–C) on the trail to the Waterfall of Stone that Swallows on the PNSB coast. The red arrow shows the direction of main flow during periods of intense rainfall. Photos: Lima.
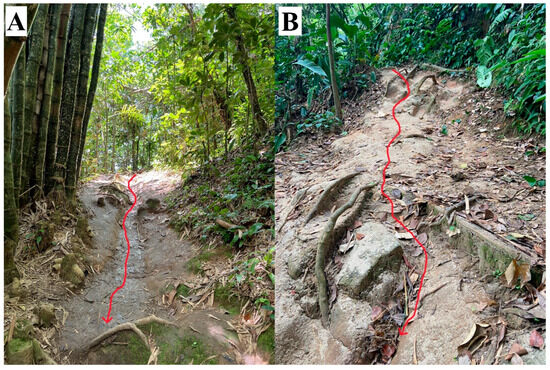
Figure 6.
Soil collection sites (A,B) on Caixa D’Aço Natural Pool Trail on the PNSB coast. The red arrow shows the direction of main flow during periods of intense rainfall. Photos: Lima.
Undisturbed samples were collected to determine bulk density and porosity, and disturbed samples to determine pH, granulometry (texture), and organic matter content. Concerning the depth of these collections, these are justified because they are the main factors that suffer from the impact of trampling during public use activities.
All soil physical–chemical parameters were assessed at the Maria Regina Mousinho de Meis Geomorphology Laboratory of the Geography Department of the Federal University of Rio de Janeiro (UFRJ). Our techniques were in accordance with the methods of Teixeira et al. [28], that is, the texture was assessed by total dispersion of individual soil particles (pipette method); the organic matter content using the indirect method (oxidation); the bulk density by collecting samples in a cylinder of known volume (100 cm3); the mineral density via volumetric flask and ethyl alcohol; the porosity according to its relationship with density values; and the pH using a digital meter.
Determination of the texture (granulometry) took place via crushing, sieving, and mixing the soil samples with sodium hydroxide and distilled water [28], while the classification was based on the textural triangle of the United States Department of Agriculture (USDA) [29]. Wet organic matter was obtained by mixing soil samples with potassium dichromate, silver sulfate, orthophosphoric acid, diphenylamine, and ferrous ammonium sulfate [28]. Bulk density was obtained by collecting samples in a cylinder with a known volume (100 cm3), while particle density was obtained by mixing samples with ethyl alcohol [28]. Finally, the porosity was determined by the ratio between the particle density (g cm−3) and bulk density (g cm−3), while the pH was obtained by dissolving the soil in distilled water and its respective reading after equipment calibration [28].
Each physical–chemical parameter was assessed in triplicate. At each site studied on the trails, three collection repetitions were performed, and the presented results refer to the averages of these triplicates. In addition to these averages, the values of the standard deviation and the coefficient of variation were also calculated in order to obtain the statistical variations using Microsoft Excel software.
The soil microtopography was determined through the installation of erosion bridges (PDE) with stakes from one edge to the other in the cross sections of sites and on the beds of the trails that presented water erosion processes, following the method developed by Shakesby [30] and adopted by Ferreira [31] in studies on water erosion in soils and subsequently applied to trails [9,22,32]. Thus, the evolution of erosion features was monitored between August 2021 and March 2022 and between August 2022 and March 2023. Therefore, we were able to obtain significant and contrasting variations in the temporal data on rainfall in the region. It is important to note that the monitored sites were the same sites from which the soil samples were collected to obtain the physical–chemical characteristics (Figure 5 and Figure 6).
The model developed by Shakesby [30] and adapted for trails by Silva and Botelho [32] was used, whereby 50 cm wooden stakes/rods (useful for leveling), 2 m slats (erosion bridge), and a 1 m iron rod (measuring rod) were used with a measuring ruler offering 100 holes (analysis points) at 2 cm intervals. Two stakes were installed at the edges of the cross section (sites) so that they could be leveled between the edges of the trails and the values could be measured (Figure 7).
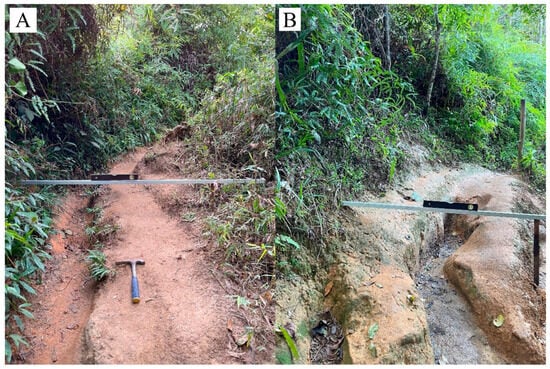
Figure 7.
Example of the PDE leveling on sites (A,B) the trail to the Waterfall of Stone that Swallows on the PNSB coast. Photos: Lima.
From this monitoring program, graphs were created using Excel software to demonstrate the space–time evolution of erosion features during the four monitoring periods. We aimed to identify sites of removal and accumulation of sediments and organic matter and places where there was intense trampling and removal of organic and inorganic particles, in addition to estimating areas of lost soil along the beds of the trails. After preparing and analyzing these graphs, it was possible to estimate the area of the monitored cross-sections and quantify the evolution of the lost soil areas at the monitoring sites.
Rainfall data were obtained using a manual rain gauge installed at a campsite near the PNSB coast (latitude 23°21′5.28″ S and longitude 44°43′34.47″ W) at a height of ~1.5 m on a wooden platform, away from obstacles, so that it was possible to store and record daily rainfall throughout the monitoring period. Finally, it should be noted that the records of these data correspond to the dates of the beginning and end of the monitoring program of the five erosion bridges (August 2021, March 2022, August 2022 and March 2023), and the readings were recorded daily at 11:00 am.
3. Results
3.1. Rainfall Data
Daily rainfall data allowed total monthly volumes to be calculated (Figure 8). Moreover, rainfall occurred throughout less than half of the total monitoring period (219 days), with daily values higher than the total average, which was 11 mm, being recorded on more than half of these days (Figure 8). It was also possible to identify that this precipitation was concentrated in December (2021), January (2022), April (2022), November (2022), and January (2023), which in turn were the months with the highest averages of rainfall (21 mm, 19 mm, 21 mm, 17 mm, and 17.1 mm, respectively) (Figure 8). In addition, the highest monthly total volumes were also recorded in these months, that is, 647.5 mm in December 2021, 593 mm in January 2022, 630 mm in April 2022, 510 mm in November 2022, and 530 mm in January 2023 (Figure 8).
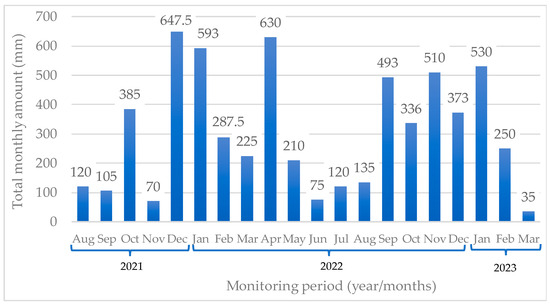
Figure 8.
Total monthly values of precipitation on PNSB coast during the four monitoring periods.
When considering the intervals of days between each monitoring period, it was also possible to identify that, from the first monitoring (2021) to the second monitoring period (2022/1), the daily rainfall average was 11 mm, and these precipitations were concentrated within just 85 days. From the second monitoring period (2022/1) to the third (2022/2), despite the daily average rainfall being lower than the total average (11 mm), that is, equal to 8.3 mm, rainfall was concentrated within only 33 days. From the third monitoring period (2022/2) to the fourth (2023), the daily average rainfall was greater than 13 mm, that is, greater than the total average, with rainfall concentrated within 95 days (Figure 8). In this way, in addition to the rainfall concentration, in specific months, we noted that, between the intervals of the monitoring periods, with the exception of the second to the third, the daily average rainfall was equal to or greater than the total average precipitation during the entire monitoring period. This indicates an ideal scenario for the evolution of erosion features due to splash erosion and the increase in runoff amount on the beds of the trails.
3.2. Spatial Variation of Soil Physical–Chemical Characteristics
The survey of the spatial variation in the physical–chemical soil characteristics in the degraded sites due to water erosion processes along the WSS Trail and the CDN Trail on the PNSB coast allowed us to identify disparities between the values of the attributes that were obtained, as well as the relationship between these parameters and the evolution of erosion features. In general, porosity and bulk density values, as well as granulometry, pH, and organic matter content, showed significant relationships with the presence or absence of rills along the two trails.
Analyzing specifically the data from the WSS Trail (Table 1), it was possible to identify that the values of total porosity (%) and organic matter (%) were, without exception, lower on the bed of the trail compared to those obtained on the edges of the trail, given that the average values of these attributes were, respectively, 39% and 0.6% on the bed and 59% and 2.4% on the edges (Table 1). On the other hand, the values of bulk density (g cm−3) and pH were, also without exception, higher on the bed of the trail and lower at the edges, so the average values of these attributes were, respectively, 1.1 g cm−3 and 5.3 on the edges and 1.6 g cm−3 and 5.5 on the beds of areas degraded by erosion processes along the trail (Table 1).

Table 1.
Values of the physical–chemical characteristics of soils obtained from the Waterfall of Stone that Swallows Trail on the coast of the PNSB.
Regarding the values of soil granulometry, it was possible to identify the domain of the sand fractions, especially fine sand and silt, on the bed of the trail, since the average values were 57, 10, and 24%, respectively. Those on the edges of 57, 6, and 19%, respectively (Table 1). The only exceptions occurred at site A, where the fine sand content was the same in both the soil sample from the edge and the soil from the trail bed (8%), as well as in the silt content, which was lower in the trail bed in comparison with that obtained at the edge (16 and 19%, respectively) (Table 1). It was also possible to identify that the clay contents in the border soil samples were higher than those obtained on the beds, with average values of 24 and 19%, respectively (Table 1). The only exception was at site A, where the clay content was higher in the trail bed samples compared to those obtained at the edges (24 and 14%, respectively) (Table 1). This granulometric composition, rich in sand, indicates a textural classification of soils that vary between sandy loam and sandy clay loam (Table 1).
Regarding the data obtained on the CDN Trail (Table 2) regarding the soil’s physical and chemical characteristics, it was possible to identify that the values of total porosity (%) and organic matter (%)were lower on the trail bed compared to those that were obtained at the edges, as was the case on the WSS Trail. This is because on the bed, the average values of these attributes were 33% and 1.0%, respectively, and on the edges they were 59% and 1.4%, respectively (Table 2). The values of bulk density (g cm−3) and pH were higher on the trail bed and lower at the edges, so the average values of these attributes, respectively, were 1.7 g cm−3 and 5.6 on the beds of the trails and 1.1 g cm−3 and 5.4 in the soil along the edges of the trails (Table 2).
Table 2.
Physical–chemical parameters of the soils obtained from the Caixa D’Aço Natural Pool Trail on the coast of the PNSB.
Regarding the granulometric analysis of the soils, it was noted that, on the bed of the trail, there was a predominance of fractions of silt and sand, especially fine sand. The average values of these fractions were 22%, 58%, and 33%, respectively (Table 2), whereas, at the edges, the values of these granulometric fractions were 21%, 46%, and 24%, respectively (Table 2). It is still possible to observe that clay contents were, without exception, higher on the border than on the bed of the trail; the average values of these attributes were 33% and 20%, respectively (Table 2). These compositions of the granulometric fractions of the soils in this trail indicate the predominance of sand fractions; thus, with the exception of the soil on the edge of site A, the other soils were classified between sandy loam and sandy clay (Table 2).
3.3. Spatiotemporal Dynamics of Soil Microtopography
Soil microtopography monitoring of degraded sites with erosive features along the WSS Trail and the CDN Trail (Figure 9, Figure 10, Figure 11, Figure 12 and Figure 13) indicated a space–time evolution of erosion processes, as well as deposition of organic and inorganic materials on the beds of these trails. This may be associated with intensive trampling and soil compaction, removal and deposition of vegetation cover and soil organic matter, and the rainfall indices recorded in the region. The evolution of the cross-sectional area at the monitored site was evident when observing that the soil surface from the last monitoring (black line) was in a lower position than the soil surface during all other periods (orange, blue, and yellow lines) at all monitored sites (Figure 9, Figure 10, Figure 11, Figure 12 and Figure 13).
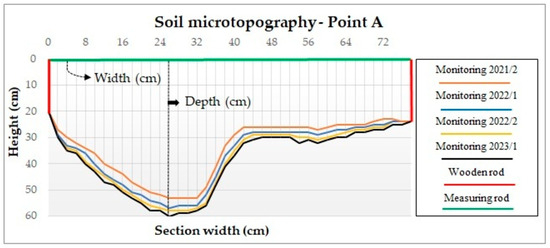
Figure 9.
Soil microtopography at site A of the Waterfall of Stone that Swallows Trail on the PNSB coast.
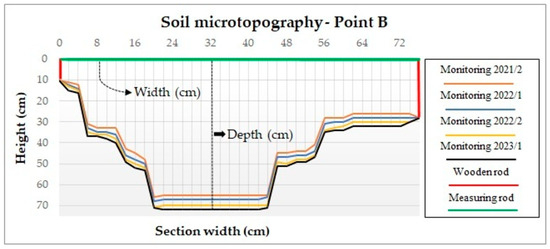
Figure 10.
Soil microtopography at site B of the Waterfall of Stone that Swallows Trail, on the PNSB coast.
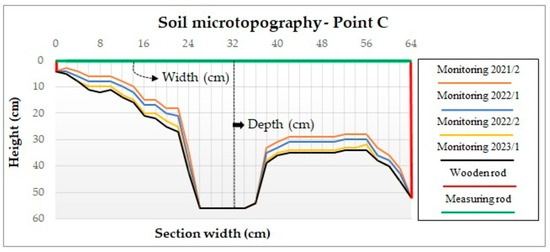
Figure 11.
Soil microtopography at site C of the Waterfall of Stone that Swallows Trail on the PNSB coast.
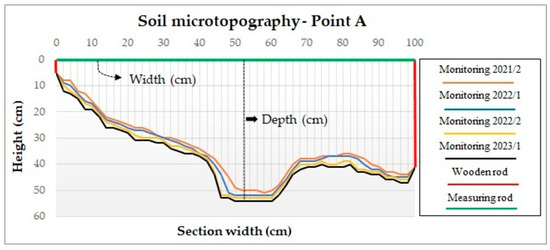
Figure 12.
Soil microtopography at point A of the Caixa D’Aço Natural Pool Trail on the coast of the PNSB.
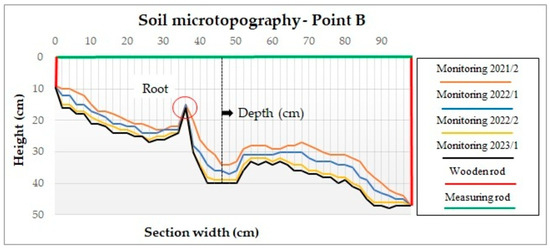
Figure 13.
Soil microtopography at site B of the Caixa D’Aço Natural Pool Trail on the PNSB coast.
Figure 9 shows that, during the first monitoring period of this site (2021), for example, the maximum depth of this rill was approximately 25 cm, while in the last monitoring period (2023), the depth increased by ~8 cm. Furthermore, it should be noted that the width of this rill also showed space–time evolution, since the value in the last monitoring period was ~4 cm greater than that in the first period (Figure 9). This space–time evolution corroborates the increase in the total cross-sectional area between the monitoring periods, since this area was 0.265 m2 in the first monitoring period (2021), 0.284 m2 in the second period (2022/1), 0.295 m2 in the third period (2022/2), and 0.304 m2 in the last period (2023). Therefore, this indicates an increase of approximately 0.039 m2 in the cross-sectional area from the beginning of monitoring.
Figure 10, which shows the soil microtopography at site B of the WSS Trail, also indicates a space–time evolution of the monitoring period erosion feature. In the central portion of this rill, for example, it was possible to identify that in the first monitoring period (2021), the maximum soil depth surface was ~65 cm, while in the last monitoring period (2023), this depth was greater than 70 cm (Figure 10). This space–time evolution was reinforced by the increase in the total cross-sectional area between the monitoring periods, since the total area was 0.327 m2 in the first monitoring period (2021), 0.336 m2 in the second period (2022/1), 0.258 m2 in the third period (2022/2), and 0.372 m2 in the last one (2023), i.e., an increase of about 0.044 m2 in the total cross-sectional area from the beginning of the monitoring period (Figure 10).
Figure 11, which shows the microtopography of the soil at site C of the WSS Trail, also shows a space–time evolution of the monitored erosion feature, especially in the lateral portions of the cross section (Figure 11). The exception was found in the central portion of this erosive feature. This occurred because the soil loss was severe at this site, and, in turn, reached the rocky layer underlying the soil layer, as can be seen in Figure 7B. Although the central portion of this rill did not indicate a space–time evolution at this point due to the rock outcrop, which is more resistant to the erosion process, it was possible to identify lateral soil loss in the other portions of this cross section. We considered the total cross-sectional area at this site, which was 0.177 m2 in the first monitoring period, 0.192 m2 in the second, 0.205 m2 in the third, and 0.210 m2 in the last, that is, an increase of 0.032 m2 from the beginning of the monitoring period (Figure 11).
Figure 12 indicates the data associated with the monitoring of soil microtopography at site A of the CDN Trail. It is possible to identify that, in the central portion of this cross section, that is, inside the erosion feature, the maximum depth during the first monitoring period (2021) was approximately 14 cm. In the last period, this depth was approximately 4 cm greater in relation to the first. This space–time evolution is corroborated by data on the total area of the cross-section, which was 0.336 m2 in the first monitoring period, 0.355 m2 in the second, 0.37 m2 in the third, and 0.381 m2 in the fourth. This indicates an increase of approximately 0.045 m2 in the total area from the beginning of the monitoring period.
Figure 13, which presents the soil microtopography data from site B of the CDN Trail, also shows a space–time evolution of the monitored erosion feature that is similar to the behavior of the other monitoring sites,. At this site, it was possible to identify a significant space–time evolution of soil loss by exposing the roots, the greater distance between the lines that indicate the soil surface, or the increase in the total value of the cross-sectional area (Figure 13). In the first monitoring period, for example, the total cross-sectional area was approximately 0.259 m2, while in the second monitoring period, it was 0.284 m2. In the third monitoring period, the total value of this area was 0.307 m2, and in the last monitored period, 0.318 m2. This indicates an increase of about 0.059 m2 from the beginning of the first monitoring period.
4. Discussion
When jointly considering the obtained data, it was possible to identify that these factors are related to each other, since certain physical-chemical parameters, for example, when subjected to certain dynamics of use and precipitation, tend to condition the evolution of erosive features such as those that were evidenced during the soil microtopography monitoring period (Figure 9, Figure 10, Figure 11, Figure 12 and Figure 13) [9,14,17,18].
Knowing that water erosion is a process of mobilization, transport, and deposition of soil sediment through the action of rainwater, the concentration of rainfall in the PNSB region, especially in specific periods, tends to intensify aggregate breakdown and the detachment of soil particles from the bed of the trails, corroborating the evolution of the erosive features that were identified (Figure 9, Figure 10, Figure 11, Figure 12 and Figure 13). In this sense, the impact of the kinetic energy of raindrops when they reach the soil surface causes its sealing, compaction, and detachment through splash erosion. Consequently, this material is lost and transported through runoff, therefore leading to the space–time evolution of the erosion features monitored. This culminates in an increase in the area of the soil surface and its cross-sections, as observed during the monitoring periods [9,14,17,18].
It is worth mentioning that Rangel and Guerra [22], as well as Lima et al. [9], have already identified that the evolution of cross-sectional areas on trails during monitoring periods of soil microtopography can also be associated with the presence or removal of organic material/litter by surface runoff. Therefore, this evolution is not strictly associated with the loss of mineral material from the soil. This behavior reinforces a possible influence of physical–chemical characteristics on this evolution, given that the organic matter content, for example, can accentuate or delay the evolution of the erosion processes.
Considering that the beds of the trails are the places with the most trampling and least vegetation cover compared to their edges, the values of bulk density, total porosity, organic matter, and pH, for example, tended to be different from those of soil samples that were collected on the edges, as evidenced in the data in Table 1 and Table 2. In the soils on the trail beds, the minimal vegetation cover and the intensive trampling of the soil tend to contribute to the decrease in porosity values and organic matter content, in addition to favoring the increase in bulk density values and soil loss. This explains not only the evolution of the monitored erosion features (Figure 9, Figure 10, Figure 11, Figure 12 and Figure 13), but also the values of porosity, organic matter, and bulk density (Table 1 and Table 2). At the trail edges, the presence of vegetation cover and low trampling tend to reduce bulk density and affect pH values, while also directly affecting total porosity values and organic matter content (Table 1 and Table 2).
The lack of vegetation cover on the trail beds also contributes to the dynamics of this behavior, in addition to exposing the soil to the impact of the kinetic energy of raindrops (splash), which in turn contributes to its compaction. Its respective loss also influences the levels of organic matter [8,33,34,35,36].
As the lack of soil trampling on the edges favors a greater development of vegetation compared to the beds of the trails, the mechanical action of roots during the growth and retraction processes increases the amount of empty space inside the soil that can be filled by air and water, that is, the value of total soil porosity [35,36,37]. In addition, because it is composed predominantly of plant and animal residues, organic matter provides nutrients for the endopedonic fauna, which, together with the agents secreted by the roots, favor an increase in microbial activity and total soil porosity [33,36,38].
The soil’s characteristic chemical conditions influence the formation of aggregates, retention, and water infiltration. They also increase aggregate stability, the number of pores, and biological activity, in addition to reducing the density [8,14,38,39,40,41]. By acting as a cementing agent that unites soil particles, organic matter forms organic substances that, when released and made available to the soil, bind and agglutinate the particles, increasing aggregate stability and reducing their erodibility [39,42]. Therefore, the ability of organic matter to affect the structural integrity of the soil, form aggregates, and stimulate the development of its biota favors aeration and increased permeability, which in turn increases water infiltration, reduces runoff, and increases soil resistance to erosion. Its absence, on the other hand, tends to trigger water erosion processes, remove soil material, and both cause and reduce nutrient retention [8,41,43,44].
In addition to vegetation cover influencing the disposition of organic matter, it also influences the total soil porosity, which in turn controls percolation, infiltration of water inside the soil, the penetration of air, and the movement of roots. The modifications to the distribution, volumes, sizes, and shapes of these pores through use and soil cover, for example, affect permeability, aeration, hydraulic conductivity, and, consequently, the dynamics of water erosion processes [8,44,45,46].
Considering that porosity values are inversely proportional to their density, and that intensive trampling by people contributes to reducing soil porosity, this behavior implies that the soils on the bed of the trail are more susceptible to erosion compared to the soils on the edge, either due to low porosity values, low levels of organic matter, or high bulk density values. This justifies not only the values found in Table 1 and Table 2, but also the evolution of soil microtopography (Figure 9, Figure 10, Figure 11, Figure 12 and Figure 13). On the other hand, the edge soils, which are not trampled, have low erodibility due to the maximum values of porosity and organic matter and the low values of bulk density, thus favoring the dynamics of the values shown in Table 1 and Table 2 [8,45].
Erodibility tends to increase with high rainfall in the PNSB region, which, in turn, tends to be concentrated in specific periods, especially during the beginning of summer and the holiday (vacation) period (December and January) (Figure 13). In addition to the absence of vegetation covering the low levels of organic matter in the trails’ soils and, in turn, increasing the instability of its aggregates, it facilitates the rupture of its particles due to the impact of raindrops, thus favoring the formation of crusts in the topsoil layer, reducing water infiltration, and increasing the soil loss via runoff. Therefore, when concentrated in specific periods, the rain tends to intensify the compaction of soils due to trampling by people on the beds of the trails, favoring the formation of preferential paths of water that culminate in the development of erosion features. This influences not only the values of some physical–chemical parameters (Table 1 and Table 2), but also the loss of organic and mineral particles, as evidenced in the monitoring period of soil microtopography with the evolution of the cross-sectional area (Figure 9, Figure 10, Figure 11, Figure 12 and Figure 13).
The pH values were all acidic (pH < 7), with the highest values found at the beds of the trails and the lowest associated with the trail edges (Table 1 and Table 2). The fact that the edges have greater vegetation cover and, consequently, higher levels of organic matter may indicate the excretion of certain acidic substances, either by the action of the roots or by the decomposition of vegetable and animal matter. Soils obtained on the beds of the trails, on the contrary, lack vegetation cover and materials for decomposition (Table 1 and Table 2). The more acidic soils at the trail edges tend to present colloidal complexes deficient in chemical elements that confer greater stability, that is, they lead to reductions in erodibility and increase the shear resistance of soil particles, since some of these elements result not only in greater biological activity, but also in stability of the aggregates [47,48,49].
Soils on the edges, despite having lower pH values, are less susceptible to erosion processes because, in addition to not suffering from trampling or the direct impact of raindrops, these soils are more porous, less dense, less compacted, and have higher levels of organic matter, which, by producing and releasing humus into the soil, favor their aggregate stability. In contrast, the soils on the trails, despite having less acidic pH values than the soils on the edges, in addition to being subjected to intensive public use and the impact of raindrops, have higher bulk density values, low porosity, and low levels of organic matter. This justifies our findings (Table 1 and Table 2), and the evolution of erosion was evidenced by monitoring the soil microtopography (Figure 9, Figure 10, Figure 11, Figure 12 and Figure 13).
The granulometry and textural classification of the soils indicate the predominance of clayey, medium-texture soil (clay-sandy loam), in which clay and sand fractions predominate in the granulometric composition of the soils. The predominance of coarse sand fractions and clay fractions causes the soils to have low erodibility, considering that the coarse sand fractions, due to their diameters, weights, and fast decanting speeds, make their removal and transport difficult due to the action of water. The clay fractions, in turn, have high aggregation capacity, the colloids and specific surfaces with cohesive strength, and a significant presence of fractions of silt and fine sand, especially in soils on the beds of trails. These favor the formation and loss of soil through erosion, since these fractions are easily removed by low cohesion and insufficient weight in the face of detachment and transport caused by the action of water [50,51,52,53].
Further, these soils have granulometric compositions of solid particles with minimal cohesion, so these characteristics together can be fundamental conditioning factors for soil loss, which became evident due to the evolution of the area of the cross sections recorded during the monitoring of the soil microtopography (Figure 9, Figure 10, Figure 11, Figure 12 and Figure 13). On the other hand, the soils on the edges had the highest values of porosity and organic matter, the presence of vegetation cover, low values of bulk density and pH, a lack of trampling, and greater presence of granulometric fractions of clay. These factors increase the cohesion of soil particles, hinder soil loss, and elucidate the data (Table 1 and Table 2) [8,10,14,17,20].
In this sense, the joint action of soil physical and chemical characteristics, mainly the values of bulk density, total porosity, granulometry, and organic matter content associated with rainfall indices in the coastal region of the PNSB, as well as the intense public use of the trails of this protected area, were assessed. These conditions culminate in the development and evolution of erosion features along the trails, as evidenced in cross sections of the soil microtopography (Figure 9, Figure 10, Figure 11, Figure 12, Figure 13). This is because public use tends to influence some of these physical–chemical characteristics, while the dynamics of regional rainfall together with other intrinsic characteristics of the soil (granulometry) favor the evolution of erosion features.
5. Conclusions
The obtained data indicate the intensive trampling of the soil resulting from public use is associated with the intrinsic characteristics of the location, such as the granulometric fractions of high erodibility and concentrated rains, especially in periods that coincide with greater local visitation. These conditions are leading to the environmental degradation of the trails of this conservation unit, as evidenced by the evolution of the erosion features in the cross-sectional areas monitored during the survey.
Monitoring the soil microtopography has demonstrated a loss of solid organic and inorganic particles which culminates in a degradation process, given that in all the cross sections monitored, there were increases in the areas of erosion features from the beginning of the monitoring. Such behavior, therefore, evidences the surface runoff process, which has a high capacity to remove solid materials. In addition, the reduction in soil protection against the impact of raindrops is enhanced by the trampling of the ground resulting from the intense flow of people along the trails.
The physical–chemical characteristics of the soil also showed an association with the degradation process, given that compaction, evidenced by the values of bulk density, especially on the bed of the trails, contributes to the reduction in water infiltration and to the increase in surface runoff. This, in turn, culminates in soil loss along the trails. Organic matter content also contributes to the dynamics of this process; all results were higher at the edges of the trails compared to those obtained in the respective beds, and these contents affect soil erodibility.
Intrinsic pedological and climatic factors, such as soils with coarse texture and intense rainfall in concentrated periods, also contribute to the evolution of the monitored erosion processes. The presence of sand and silt fractions and low levels of clay in the soils from the bed of the trails, for example, contribute to soil loss, especially when accompanied by compacted soils and by concentrated rainfall in specific periods.
This collective evidence shows the need for management and recovery actions for degraded areas along these trails through strategic management actions and improvement of their physical–chemical attributes, whether through the incorporation of organic matter or the construction of steps.
Finally, it is concluded that the obtained data can be fundamental tools for identifying environmental weaknesses or potential, as well as supporting actions aimed at planning and managing trails for public use in conservation units, especially when these protected areas are in high demand for public use and have intrinsic environmental characteristics that favor the triggering of environmental degradation processes.
Author Contributions
Data curation, G.M.d.L.; formal analysis, G.M.d.L., A.J.T.G., L.d.A.R., C.A.B., and M.A.F.; funding acquisition, A.J.T.G.; investigation, G.M.d.L., A.J.T.G., L.d.A.R., C.A.B., and M.A.F.; methodology, G.M.d.L.; project administration, A.J.T.G.; supervision, A.J.T.G., L.d.A.R., C.A.B., and M.A.F.; validation, G.M.d.L., A.J.T.G., L.d.A.R., C.A.B., and M.A.F.; visualization, G.M.d.L., A.J.T.G., L.d.A.R., C.A.B., and M.A.F.; writing of the original draft, G.M.d.L., A.J.T.G., L.d.A.R., C.A.B., and M.A.F.; writing—review and editing, G.M.d.L., A.J.T.G., L.d.A.R., C.A.B., and M.A.F. All authors have read and agreed to the published version of the manuscript.
Funding
This research was funded by FAPERJ (Fundação Carlos Chagas Filho de Amparo à Pesquisa do Estado do Rio de Janeiro), grant number E-26/201.369/2023.
Institutional Review Board Statement
Not applicable.
Informed Consent Statement
Not applicable.
Data Availability Statement
Data are contained within the article.
Acknowledgments
The authors of this research would like to thank the Post-Graduate Program in Geography (UFRJ), CAPES, and FAPERJ for the financial support needed to carry out the field work, and the Chico Mendes Institute of Biodiversity (ICMBio) for the necessary authorization to carry out the research.
Conflicts of Interest
The authors declare no conflicts of interest. The funders had no role in the design of the study; in the collection, analyses, or interpretation of data; in the writing of the manuscript; or in the decision to publish the results.
References
- Centeri, C. Soil Water Erosion. Water 2022, 14, 447–501. [Google Scholar] [CrossRef]
- Boardman, J.; Poesen, J.; Evans, M. Slopes: Soil erosion. In The History of the Study of Landforms or the Development of Geomorphology: Volume 5: Geomorphology in the Second Half of the Twentieth Century; Geological Society of London: London, UK, 2022. [Google Scholar] [CrossRef]
- Ferreira, C.S.S.; Seifollahi-Aghmiuni, S.; Destouni, G.; Ghajarnia, N.; Kalantari, Z. Soil degradation in the European Mediterranean region: Processes, status and consequences. Sci. Total Environ. 2022, 805, 150106–150123. [Google Scholar] [CrossRef]
- Golubović, T.D. Environmental Consequences of Soil Erosion. In Advances in Environmental Engineering and Green Technologies; Milutinović, S., Živković, S., Eds.; IGI Global: Hershey, PA, USA, 2022; pp. 112–131. [Google Scholar]
- Yin, C.; Zhao, W.; Pereira, P. Soil conservation service underpins sustainable development goals. Glob. Ecol. Conserv. 2022, 33, 1–8. [Google Scholar] [CrossRef]
- Guerra, A.J.T.; Bezerra, J.F.R.; Jorge, M.C.O. Recuperação de voçorocas e de áreas degradadas, no Brasil e no mundo—Estudo de caso da voçoroca do Sacavém—São Luís—MA. Rev. Bras. Geomorfol. 2023, 24, 1–20. [Google Scholar] [CrossRef]
- Dragovich, D.; Bajpai, S. Managing Tourism and Environment—Trail Erosion, Thresholds of Potential Concern and Limits of Acceptable Change. Sustainability 2022, 14, 4291–4307. [Google Scholar] [CrossRef]
- Pereira, L.S.; Rodrigues, A.M.; Jorge, M.C.O.; Guerra, A.J.T.; Booth, C.A.; Fullen, M.A. Detrimental effects of tourist trails on soil system dynamics in Ubatuba Municipality, São Paulo State, Brazil. Catena 2022, 216, 106431. [Google Scholar] [CrossRef]
- Lima, G.M.; Rangel, L.A.; Guerra, A.J.T. Monitoramento da microtopografia do solo em trilhas de uso público no litoral do Parque Nacional da Serra da Bocaina. Rev. Bras. Geomorfol. 2023, 24, 1–17. [Google Scholar] [CrossRef]
- Lima, G.M.; Guerra, A.J.T. Áreas degradadas por processos erosivos hídricos na Trilha do Morro Dois Irmãos, no município do Rio de Janeiro (RJ). Rev. Ciência Geográfica 2023, 27, 376–395. [Google Scholar] [CrossRef]
- Costa, N.M.C.; Oliveira, F.L. Trilhas: “caminhos” para o geoturismo, a geodiversidade e a geoconservação. In Geoturismo, Geodiveridade e Geoconservação: Abordagens Geográficas e Geológicas; Guerra, A.J.T., Jorge, M.C.O., Eds.; Oficina de Textos: São Paulo, Brazil, 2018; pp. 201–223. [Google Scholar]
- Bhammar, H.; Li, W.; Molina, C.M.M.; Hickey, V.; Pendry, J.; Narain, U. Framework for Sustainable Recovery of Tourism in Protected Areas. Sustainability 2021, 13, 2798–2808. [Google Scholar] [CrossRef]
- Zhang, X.; Zhong, L.; Yu, H. Sustainability assessment of tourism in protected areas: A relational perspective. Glob. Ecol. Conserv. 2022, 35, 1–14. [Google Scholar] [CrossRef]
- Marion, J.L. Trail sustainability: A state-of-knowledge review of trail impacts, influential factors, sustainability ratings, and planning and management guidance. J. Environ. Manag. 2023, 340, 117868. [Google Scholar] [CrossRef] [PubMed]
- Spernbauer, B.S.; Monz, C.; D’antonio, A.; Smith, J.W. Factors influencing informal trail conditions: Implications for management and research in urban-proximate parks and protected areas. Landsc. Urban Plan. 2023, 231, 104661. [Google Scholar] [CrossRef]
- Fonseca Filho, R.E.; Varajão, A.F.D.C.; Castro, P.T.A. Compactação e erosão de trilhas geoturísticas de parques do Quadrilátero Ferrífero e Serra do Espinhaço meridional. Rev. Bras. Geomorfol. 2019, 20, 825–839. [Google Scholar] [CrossRef]
- Rangel, L.A.; Jorge, M.C.; Guerra, A.J.T.; Fullen, M.A. Soil Erosion and Land Degradation on Trail Systems in Mountainous Areas: Two Case Studies from South-East Brazil. Soil Syst. 2019, 3, 56–70. [Google Scholar] [CrossRef]
- Figueiredo, M.A.; Martins, J.V.A. Erosão em trilhas e sua relação com o turismo em áreas protegidas: Uma breve discussão. In Turismo em Áreas Protegidas; Sutil, T., Ladwig, N.I., Silva, J.G.S., Eds.; UNESC: Criciúma, Brazil, 2021; pp. 173–195. [Google Scholar]
- Wolf, I.D.; Croft, D.B.; Green, R.J. Nature Conservation and Nature-Based Tourism: A paradox? Environments 2019, 6, 104–126. [Google Scholar] [CrossRef]
- ICMBIO. Instituto Chico Mendes de Conservação da Biodiversidade. ICMBio Realiza Operação de Ordenamento da Visitação nas Praias do Meio e Caixa D’aço em Trindade no Feriado de Carnaval de 2022. Available online: https://www.icmbio.gov.br/parnaserradabocaina/destaques/190-icmbio-realiza-operacao-de-ordenamento-da-visitacao-nas-praias-do-meio-e-caixa-d-aco-em-trindade-no-feriado-de-carnaval-de-2022.html (accessed on 20 July 2023).
- ICMBIO. Instituto Chico Mendes de Conservação da Biodiversidade. Parque Nacional da Serra da Bocaina Promoveu Ação de Ordenamento Turístico na Trindade. Available online: http://www.icmbio.gov.br/parnaserradabocaina/destaques/152-parque-nacional-da-serrada-bocaina-promoveu-acao-de-ordenamento-turistico-na-trindade.html (accessed on 20 July 2023).
- Rangel, L.A.; Guerra, A.J.T. Microtopografia e compactação do solo em trilhas geoturísticas no litoral do Parque Nacional da Serra da Bocaina—Estado do Rio de Janeiro. Rev. Bras. Geomorfol. 2018, 19, 391–405. [Google Scholar] [CrossRef]
- MMA (Ministério do Meio Ambiente). Plano de Manejo do Parque Nacional da Serra da Bocaina; Instituto Brasileiro de Meio Ambiente; Ministério do Meio Ambiente: Brasília, Brazil, 2002. Available online: https://www.icmbio.gov.br/parnaserradabocaina/extras/62-plano-de-manejo-e-monitorias.html (accessed on 19 July 2023).
- Leuzinger, M.D.; Santana, P.C.; Souza, L.R. Parques Nacionais do Brasil: Pesquisa e Preservação; CEUB: Brasília, Brazil, 2020; pp. 1–748. [Google Scholar]
- Carvalho Filho, A.; Lumbreras, J.F.; Wittern, K.P.; Lemos, A.L.; Santos, R.D.; Calderano Filho, B.; Oliveira, R.P.; Aglio, M.L.D.; Souza, J.S.; Chaffin, C.E.; et al. Mapa de Reconhecimento de Baixa Intensidade dos solos do Estado do Rio de Janeiro; Escala 1:250.000; Embrapa Solos: Rio de Janeiro, Brazil, 2003. [Google Scholar]
- Guerra, A.J.T.; Jorge, M.C.O.; Fullen, M.A.; Bezerra, J.F.R. The geomorphology of Angra dos Reis and Paraty municipalities, Southern Rio de Janeiro State. Rev. Geonorte 2013, 9, 1–21. [Google Scholar]
- Kamino, L.H.Y.; Rezende, E.A.; Santos, L.J.C.; Felippe, M.F.; Assis, W.L. Atlantic Tropical Brazil. In The Physical Geography of Brazil: Environment, Vegetation and Landscape; Salgado, A.A.R., Santos, L.J.C., Paisani, J.C., Eds.; Springer: New York, NY, USA, 2019; pp. 41–74. [Google Scholar]
- Teixeira, P.C.; Donagemma, G.K.; Fontana, A.; Teixeira, W.G. Manual de Métodos de Análise de Solos; Embrapa Solos: Rio de Janeiro, Brazil, 2017; pp. 1–574. [Google Scholar]
- USDA. United States Department of Agriculture. Soil Texture Calculator. Available online: https://www.nrcs.usda.gov/resources/education-and-teaching-materials/soil-texture-calculator (accessed on 20 July 2023).
- Shakesby, R.A. The soil erosion bridge: A device for micro-profiling soil surfaces. Earth Surf. Process. Landf. 1993, 18, 823–827. [Google Scholar] [CrossRef]
- Ferreira, C.G. Erosão hídrica em solos florestais. Estudo em povoamentos de Pinu spinaster e Eucalyptus globulus em Macieira—Alcôba. Rev. Fac. Let. Geogr. 1996/7, 12/13, 145–244. [Google Scholar]
- Silva, A.O.; Botelho, R.G.M. Diagnóstico das condições ambientes e de uso público na trilha do Peito do Pombo por meio do Protocolo de Avaliação Rápida (Sana—Macaé—RJ). Rev. Iberoam. Tur. 2021, 11, 177–195. [Google Scholar] [CrossRef]
- Igwe, P.U.; Ezeukwu, J.C.; Edoka, N.E.; Ejie, O.C.; Ifi, G.I. A Review of Vegetation Cover as a Natural Factor to Soil Erosion. Int. J. Rural Dev. Environ. Health Res. 2017, 1, 21–28. [Google Scholar] [CrossRef]
- Xia, L.; Song, X.; Fu, N.; Cui, S.; Li, L.; Li, H.; Li, Y. Effects of forest litter cover on hydrological response of hillslopes in the Loess Plateau of China. Catena 2019, 181, 104076. [Google Scholar] [CrossRef]
- Prescott, C.E.; Vesterdal, L. Decomposition and transformations along the continuum from litter to soil organic matter in forest soils. For. Ecol. Manag. 2021, 498, 119522. [Google Scholar] [CrossRef]
- Sayer, E.J.; Rodtassana, C.; Sheldrake, M.; Bréchet, L.M.; Ashford, O.S.; Lopez-Sangil, L.; Kerdraon-Byrne, D.; Castro, B.; Turner, B.L.; Wright, S.J. Revisiting nutrient cycling by litterfall—Insights from 15 years of litter manipulation in old-growth lowland tropical forest. In Advances in Ecological Research; Holzer, J.M., Baird, J., Hickey, G.M., Eds.; Elsevier: Amsterdam, The Netherlands, 2022; Volume 62, pp. 173–223. [Google Scholar]
- Giweta, M. Role of litter production and its decomposition, and factors affecting the processes in a tropical forest ecosystem: A review. J. Ecol. Environ. 2020, 44, 11. [Google Scholar] [CrossRef]
- Gmach, M.R.; Cherubin, R.; Kaiser, K.; Cerri, C.E.P. Processes that influence dissolved organic matter in the soil: A review. Sci. Agric. 2020, 77, e20180164. [Google Scholar] [CrossRef]
- Zhang, X.; Li, Z.; Nie, X.; Huang, M.; Wang, D.; Xiao, H.; Liu, C.; Peng, H.; Jiang, J.; Zeng, G. The role of dissolved organic matter in soil organic carbon stability under water erosion. Ecol. Indic. 2019, 102, 724–733. [Google Scholar] [CrossRef]
- Wiesmeier, M.; Urbanski, L.; Hobley, E.; Lang, B.; von Lützow, M.; Marin-Spiotta, E.; van Wesemael, B.; Rabot, E.; Ließ, M.; Garcia-Franco, N.; et al. Soil organic carbon storage as a key function of soils—A review of drivers and indicators at various scales. Geoderma 2019, 333, 149–162. [Google Scholar] [CrossRef]
- Cotrufo, M.F.; Lavallee, J.M. Soil organic matter formation, persistence, and functioning: A synthesis of current understanding to inform its conservation and regeneration. Adv. Agron. 2022, 172, 1–66. [Google Scholar] [CrossRef]
- FAO. Global Status of Black Soils; Food and Agriculture Organization of the United Nations: Rome, Italy, 2022; pp. 1–176. [Google Scholar] [CrossRef]
- Fernández-Raga, M.; Palencia, C.; Keesstra, S.; Jordán, A.; Fraile, R.; Angulo-Martínez, M.; Cerdà, A. Splash erosion: A review with unanswered questions. Earth-Sci. Rev. 2017, 171, 463–477. [Google Scholar] [CrossRef]
- Yadav, G.K.; Dadhich, S.K.; Bhateshwar, M.C. Recent Innovative Approaches in Agricultural Science; Bhumi Publishing: Maharashtra, India, 2022; pp. 1–218. [Google Scholar]
- D’acqui, L.P.; Certini, G.; Cambi, M.; Marchi, E. Machinery’s impact on forest soil porosity. J. Terramechanics 2020, 91, 65–71. [Google Scholar] [CrossRef]
- Meadema, F.; Marion, J.L.; Arredondo, J.; Wimpey, J. The influence of layout on Appalachian Trail soil loss, widening, and muddiness: Implications for sustainable trail design and management. J. Environ. Manag. 2020, 257, 109986. [Google Scholar] [CrossRef] [PubMed]
- Totsche, K.U.; Amelung, W.; Gerzabek, M.H.; Guggenberger, G.; Klumpp, E.; Knief, C.; Lehndorff, E.; Mikutta, R.; Peth, S.; Prechtel, A.; et al. Microaggregates in soils. J. Plant Nutr. Soil Sci. 2017, 181, 104–136. [Google Scholar] [CrossRef]
- Matsumoto, S.; Ogata, S.; Shimada, H.; Sasaoka, T.; Hamanaka, A.; Kusuma, G.J. Effects of pH-induced changes in soil physical characteristics on the development of soil water erosion. Geosciences 2018, 8, 134. [Google Scholar] [CrossRef]
- Schlatter, D.C.; Kahl, K.; Carlson, B.; Huggins, D.R.; Paulitz, T. Soil acidification modifies soil depth-microbiome relationships in a no-till wheat cropping system. Soil Biol. Biochem. 2020, 149, 107939. [Google Scholar] [CrossRef]
- Ker, J.C.; Curi, N.; Schaefer, C.E.G.R.; Vidal-Torrado, P. Pedologia: Fundamentos; Sociedade Brasileira de Ciência do Solo: Viçosa, Brazil, 2015; pp. 1–343. [Google Scholar]
- Nguyen, V.B.; Nguyen, Q.B.; Zhang, Y.W.; Lim, C.Y.H.; Khoo, B.C. Effect of particle size on erosion characteristics. Wear 2016, 348–349, 126–137. [Google Scholar] [CrossRef]
- Guerra, A.J.T.; Fullen, A.; Jorge, M.C.O.; Bezerra, J.F.R.; Shokr, M.S. Slope processes, mass movements and soil erosion: A review. Pedosphere 2017, 27, 27–41. [Google Scholar] [CrossRef]
- Jorge, M.C.O. Solos: Conhecendo sua História; Oficina de Textos: São Paulo, Brazil, 2021; pp. 1–62. [Google Scholar]
Disclaimer/Publisher’s Note: The statements, opinions and data contained in all publications are solely those of the individual author(s) and contributor(s) and not of MDPI and/or the editor(s). MDPI and/or the editor(s) disclaim responsibility for any injury to people or property resulting from any ideas, methods, instructions or products referred to in the content. |
© 2024 by the authors. Licensee MDPI, Basel, Switzerland. This article is an open access article distributed under the terms and conditions of the Creative Commons Attribution (CC BY) license (https://creativecommons.org/licenses/by/4.0/).