Abstract
Soil compaction is a major concern in the context of ensuring sustainable forest and agricultural management practices. Productivity gains during the last decades were also achieved by increasing mechanization. This change was associated with growing machine weights and impacts on trafficked soils. Up to now, knowledge about the resilience of compaction phenomena is still poor. At 11 forest sites on compaction-sensitive silt and loam substrates in the federal state of Baden-Wuerttemberg (Germany), fine root distribution, macroporosity, and apparent gas diffusion coefficients were used to characterize the status of recovery from former soil compaction by machine impact. The time span of recovery at the investigated sites ranged from 6 to 37 years. The investigated soil physical parameters indicate the beginning of soil structure recovery in the wheel tracks, comprising the first 10 cm of soil depth at most sites that were trafficked 10 years or more before the investigation. Synchronously with this restructuring, fine root propagation has started to recover in the topsoils. However, a high persistence of damage was observed below that depth. A synoptic interpretation of the data led to the conclusion that time spans up to almost four decades are not sufficient for the restoration of soil functionality in formerly compacted soils characterized by silt loam texture and low activity of soil biota. In view of the long-lasting persistence of the negative compaction effects, soil protection strategies combined with monitoring of their strict compliance must be implemented into forest practice. In case of an insufficient natural recovery potential, active measures to accelerate the regaining of soil functionality in compacted soils at irregular wheel tracks should be considered in order to shorten the time spans of disturbed soil conditions.
1. Introduction
Beginning in the 1960s in Northern America and Scandinavia, mechanization in forest harvesting and logging operations started to replace manual systems [1,2]. This transition was almost complete within the next three decades. Following this trend, specialized forest machines also became more and more common in Central Europe [3].
More than 40 years of trafficking history led to the alarming accumulation of soil structure damage in forest stands [4], which endangers the fulfillment of the multiple functions and services of forest soils and forest ecosystems. The increase in soil disturbances can be attributed to the long-lasting persistence of soil deformation effects and to the poor compliance with soil-protection regulations, which aim to concentrate damage at skid trails and prohibit trafficking away from these lanes [5].
Up to now, only a few investigations have given valuable information about the persistence of soil structure damage and the impedance of related soil functions. This information is essential to judge the necessity of active countermeasures in order to support the restructuring of compacted soils. In most of these studies, soil physical parameters such as bulk density and penetration or shear resistance were used to judge the status of soil structure recovery [6,7,8,9,10]. Hildebrand [11] showed that comparisons of compacted and uncompacted soils based solely on bulk density might lead to misinterpretation. The same applies to parameters linked directly to bulk density, such as penetration or shear resistance. Hildebrand and Schack-Kirchner [12] postulated that the gas budget in the rhizosphere of forest soils is a sensitive indicator and closely linked to soil structure and root growth. Ampoorter et al. [13] confirmed this finding. Von Wilpert and Schäffer [14] proved that fine root propagation is an ecologically sensitive indicator for the evaluation of enduring soil compaction effects.
Investigations using sensitive parameters such as soil gas concentrations, gas exchange properties or fine root propagation for the detection of recovery stages are rather rare or do not cover long time periods of natural regeneration. Goutal et al. [15] reported a decreased air-filled porosity and elevated CO2 concentrations in compacted soils 3 to 4 years after a logging operation in France. Schack-Kirchner [16] found a highly significant reduction in the gas diffusion coefficients in the upper soil layer at a loamy investigation site 12 years after machine passage in Baden-Wuerttemberg. Summarizing the results from six study sites in Southern Germany spanning from sandy loams to silty clays, Kremer [17] concluded that within the considered time span of 35 years, no significant recovery of the sensitive parameters took place. Von Wilpert and Schäffer [14] found a rather transient stage and not an overall recovery of soil aeration properties and root propagation 24 years after machine impact at a luvisol in Baden-Wuerttemberg. Ebeling et al. [18] showed a significantly reduced gas diffusivity 40 years after the last machine impact for a loamy sandy podzol in Lower Saxony. For cambisols on limestone with a high activity of soil biota and high clay content, the authors could find evidence of a structure recovery within a time span of 10–20 years.
In this paper, investigations of macroporosity, gas exchange properties, and fine root propagation are presented from 11 study sites in Baden-Wuerttemberg, characterized by time spans of soil structure recovery from 6 to 37 years. The evaluation of the results is performed in the sense of pattern recognition rather than a classical “space for time” substitution with statistical testability. The expectation was that the longer the time span for the restructuring of the formerly compacted soils lasted, the more closely the soil structure and fine rooting should approximate towards natural site-specific levels.
2. Materials and Methods
2.1. Investigation Sites
In Central Europe, there is a lack of long-term wheeling experiments conducted under controlled experimental conditions (accurately reported machine configurations, soil water content, and soil physical preconditions) that cover long time ranges between impact and investigation of recovery. For this reason, the material of this study had to be extracted from well-documented practical harvesting campaigns, where wheeling activity at the formerly passed skid trails could be excluded unequivocally. With an inquiry at the competent forest authorities, the technical and operational aspects of the harvesting and logging operations were clarified for the presented sites.
Figure 1 and Table 1 give an overview of the locations of the investigation sites and their characteristics. At Biberach (BIB), Ettenheim (ETT 1 and ETT 2), Mengen (MEN), Rottweil (ROT), Stockach (STO), Weil im Schoenbuch (WIS 1 and WIS 2), and Wolfegg (WOL), luvisols developed on loess loam covered Triassic or Pleistocene deposits. The transition zones between the Ah/E and the clay enriched Bt or Bv/Cv horizons varied in depth between 40 and 50 cm. The sites at BIB, WIS 2, and MEN showed stagnic properties beginning at depths of more than 40 cm. The parent material of the stagnosol at Ravensburg (RAV) was a freshwater molasse sediment. There, rooting below 30 cm was limited due to pseudogleyization. The soil type at Todtmoos (TOD) was a cambisol developed on a para-gneiss periglacial coverbed.
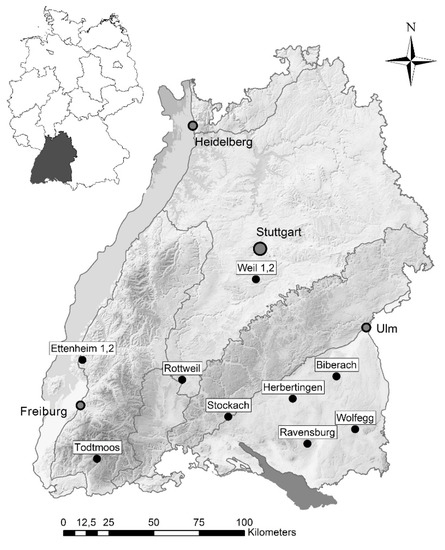
Figure 1.
Location of the 11 investigation sites in Baden-Wuerttemberg (Germany).

Table 1.
Site conditions, logging operations, and time span of soil structure recovery.
The two skid trail situations at MEN and ROT resulted from forest operations after storm events in 1967. We have to assume that at these two sites the machine impact spread over the whole forest stand. At the other sites, the investigated skid trails were part of regular skid trail systems that were set up for the first mechanized thinning campaigns (WIS 1, STO, and TOD) or had been in use during several harvesting campaigns (RAV, WIS 2, WOL, BIB, ETT 1 and ETT 2). The weights of the machines exceeded 10 Mg with the exception of WIS 2, MEN (~8 Mg at both sites), and ROT (~5 Mg). The time spans elapsed since vehicle movement ranged from 6 to 37 years.
2.2. Soil Physical Analysis and Root Counting
Persisting disturbances of soil structure and fine root propagation were assessed by examination of macroporosity, soil gas diffusivity, and fine root density densities.
At each investigation site, two profile pits were dug across the skid trails (up to 4.8 m wide and 0.6–1.0 m deep) and one in the un-trafficked forest close to the skid trails (varying in width from 0.4–2.0 m and depth from 0.6–1.0 m). The widths of the skid trail pits were defined according to the locations of wheel ruts, which were visible at the soil surface as depressions of several centimeters. Because side-effects close to the wheel track locations were expected, the width of the pits was extended into the right and left transition zones to the undisturbed forest stand. As strata for the analysis of the soil physical parameters and rooting densities, the skid trail trench walls were categorized into “wheel tracks”, “median strips” (in between the two-wheel track ruts), and “margin zones” (outside the wheel track, transition to the adjacent untrafficked forest stand).
At each of these skid trail strata and at a control plot five replicates of undisturbed soil columns (100 cm3) were sampled in four depth layers down to a maximum depth of 34 cm (0–4 cm, 10–14 cm, 20–24 cm, and 30–34 cm measured from the top of the mineral soil surface). At STO (16), BIB (21), MEN (35), and ROT (37) sampling depths were 0–4 cm, 5–9 cm, 15–19 cm, and 25–29 cm and 200 cm3 soil columns were used. In the lab, total pore volume was determined using vacuum pycnometry [20] and macroporosity (volume of the pores with diameters larger than 10 μm) was calculated by taking the weight after dehydration of the soil cores on a kaolin bed at a water suction of −300 hPa [21]. The gas diffusion properties were analysed using a one-chamber method [22,23] after dehydration at a water suction of −300 hPa. The gas flux of the inert gas neon from the inside of the chamber through the soil cores (Ds) was analysed by measuring the decrease in neon concentration in subsequent time intervals with a Chrompack Micro GC CP-2002 (molsieve 5 Å column). Helium was used as carrier gas. By dividing the measured Ds of neon by its binary diffusion coefficient (D0) in free atmosphere, a proportionality factor is gained that characterizes the reduction of the diffusion velocity through the soil pore system in relation to the one in free atmosphere (relative apparent diffusion coefficient Ds/D0).
At all investigation sites, fine roots (∅ < 2 mm) were counted using the profile wall method [24,25]. The grid cell dimension was 4 × 4 cm. Distribution of fine roots was determined across the whole profile walls at the skid trail strata and at the control pit.
2.3. Modelling of Root Densities
A methodological approach for modelling of fine root densities is the use of Generalized Additive Models (GAMs). In contrast to Linear or Generalized Linear Models (LMs, GLMs), GAMs offer much flexibility in modelling continuous root density surfaces without integrating uncertain stratification information [26,27].
For the prediction of the root densities, a two-dimensional smoothing function where S is the smoothing term in the x and y directions was used.
In the model formula, we integrated a log link, and a quasi-Poisson family assumption. Smoothing in the horizontal and vertical directions was restricted to the trench wall boundaries. An exponential covariance function was used to cope with the spatial autocorrelation between root counts of neighbouring grid cells.
First, we used the modelled fine root data of the GAM to calculate the depth gradients at the wheel track situations based on the field classification of the wheel rut location. In a second approach, we did not use this strata information, but instead looked up the skid trail positions with the lowest fine root densities. Therefore, the x-coordinates of the minima for the first five horizontal grid cell layers were calculated. The detection algorithm was limited to a distance of 150 cm to each side of the skid trail centre. For the assignment of the horizontal extent of the most impacted area, the means of the minima were determined as centre locations. The spreading in the horizontal direction was defined based on the horizontal extent of the wheel rut depression detected at the topsoil of the skid trail transects. This spreading was assumed to provide a suitable approximation for the re-positioning of the area with a maximum impact concerning fine root propagation. Figure 2 shows this approach for the depth layer from 8–12 cm of skid trail 2 at WIS 1 (6).
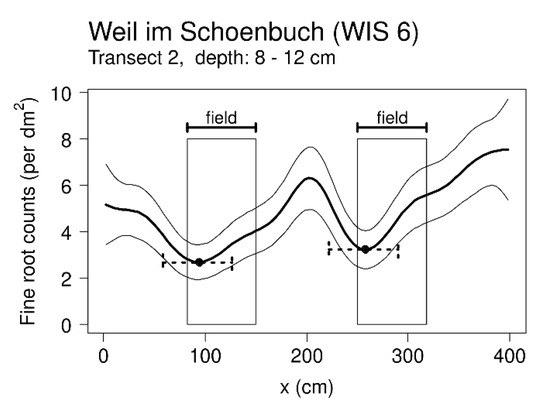
Figure 2.
Modelled fine root densities for the depth of 8–12 cm at transect 2 at (WIS 1). Mean root density (bold line) is shown together with the confidence interval (± twofold standard deviations; narrow lines). The transparent-filled bar represents the field classification of the wheel track location. The filled dots show the two minima of fine rooting for this depth layer, which was used as a centre location for the reallocation of the horizontal spreading (dotted line).
With this algorithm, 28 locations characterized by local minima of fine rooting at 14 transects could be detected. At 12 locations, the calculated minima were located at the same horizontal position in all depth layers; at the remaining 16, they spread over 3 or fewer neighbouring grid cells. For 8 transects, no local minima could be derived. An overview of the modelled minima at the investigation sites is given in Appendix A Table A1. Figure 3 shows the two principal shapes of the root density curves that did not portray local minima. Although wheel rut depressions were visible in the field, the recalculation didn´t reveal corresponding minima of fine root counts at these locations. For these transects, the original field stratification of the wheel track location was used to extract the GAM model result for this stratum for calculation of inference statistics.
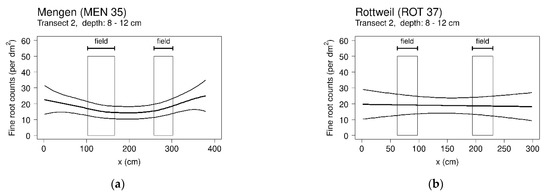
Figure 3.
(a) The modelled fine root densities decrease from the margin zones towards the centre of skid trail transect 2 at MEN (35). (b) The root density curve at ROT (37) follows a straight line across the whole transect.
In 52.4% of the tests for the investigated depths layers based on the field stratification of the wheel track situation, significant differences were detected. Using the reallocated skid trail locations, 54.8% of the comparisons showed a significant result. Thus, the results for the reallocated locations are presented in the following chapters as “wheel track” situations.
2.4. Statistical Analysis
The statistical computations were performed using the open-source software R 3.2.2 [28]. Groupwise testing of macroporosity at the different skid trail strata is presented in Figure 4; the post hoc Kruskal–Dunn test from the package “PMCMR” was used. The non-parametric Wilcoxon rank test (package “exactRankTests”) was applied for the pairwise comparisons of macropore volume and apparent gas diffusion coefficients (Ds/Do) at the wheel track strata and control situations. Differences between wheel track and control situations were tested at significance levels of p < 0.05 and p < 0.01. With the package “mgcv” the GAMs were fitted and the predicted standard deviations and confidence limits were calculated. For the graphical presentations of the rooting depth gradients, the cubic smoothing spline function “sreg” from the package “fields” was applied.
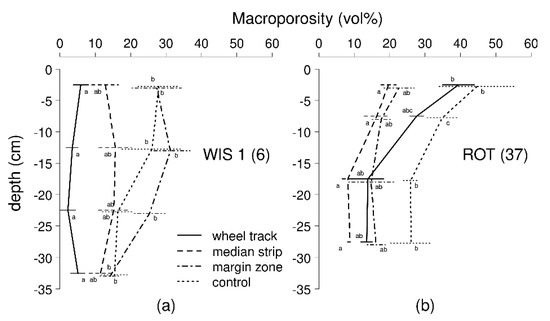
Figure 4.
Macroporosities for the skid trail strata and control situation at (a) WIS 1 (6) and (b) ROT (37). Statistical distinctness between the strata was tested with the multiple non-parametric Kruskal–Dunn test at a significance level of p < 0.05 and is marked by small Arabic letters. The horizontal lines represent the two-fold standard deviations.
3. Results
In this paper the macropore volume (diameter of pores > 10 µm) and relative apparent diffusion coefficient measured at −300 hPa are presented for the characterization of the status of soil structure recovery. In addition to these two soil structural parameters, comparisons of fine root densities in wheel tracks and control situations are shown in order to judge the persistence of reduced root propagation in the trafficked soils.
3.1. Macropore Volume
In Figure 4, macroporosities for all investigated skid trail strata are shown for WIS 1 (6) and ROT (37). These two sites represent the longest and shortest time-period of soil structure recovery for which different patterns of the persisting loss of macroporosity at the skid trail strata can be observed exemplarily.
At the WIS 1 (6), the depth gradients are ranked clearly according to the expected impact at the skid trail strata. The most persistent loss of macropore volume (Figure 4a) was found at the wheel track strata (less than 5.2 vol%) in all the investigated depth layers compared with the control (15–29 vol%). The median strip represents an intermediate status: the groupwise testing did not reveal any significant difference between this and the other strata. Macroporosity at the margin zones and at the control situation were significantly higher compared with the wheel track strata (with the exception of the depth layer of 20–25 cm at the control site).
In contrast to the findings at the site WIS 1 (6), at ROT (37), the clarity of the ranked relationship between the skid trail strata was lost (Figure 4b). As expected, the macropore volume was highest in all depth layers at the control site. The lowest macroporosities were found at the median strip situation. The depth profiles at the margin zone, and even more pronounced at the wheel track location, represent an intermediate status of persisting macropore volume loss.
In Figure 5, the ratios of macroporosity between wheel tracks and controls are presented for all investigation sites categorized in three-time spans of soil structure recovery. At the study sites with recovery time spans of up to 12 years (Figure 5a), all differences are significant down to a depth of 24 cm (with the exception of WOL (12)). At all sites, a pronounced but significant only for the WIS 1 (6)-persistence of macroporosity loss is still visible in 30–34 cm. At TOD (14), STO (16), and ETT 1 (18); the ratios are grouped above 48% (Figure 5b). In the upper soil, the levels of significance are lower compared with the sites characterized by shorter time spans of soil structure recovery. In the upper soil of the sites with recovery time spans of more than 20 years, the variation in ratios is high compared with the sites with recovery time spans of less than 20 years: the ratios extend from 62% up to 167%. In the depth below 15 cm, all wheel track locations show a high and, in most cases, significant persistence of reduced macroporosity (Figure 5c) compared with the corresponding controls. The depth gradient at the site ETT 1 shows unexpected discontinuity in the depth layer of 10–14 cm. This may have been caused by trafficking away from the regular skid trail system during or after the clear-cutting operations, which was overlooked during the selection procedure of the site.
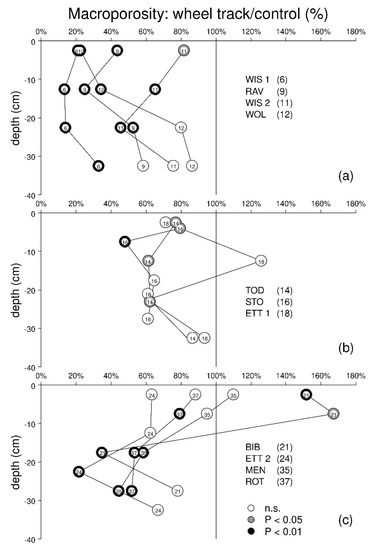
Figure 5.
Ratios of macroporosity (wheel track/controlx100) for sites with (a) recovery time of up to 12 years, (b) recovery time from 12 to 18 years, and (c) recovery time from 21 to 37 years. The significance levels of the pairwise Wilcoxon rank test are highlighted by differing grey shading intensities (  p < 0.01,
  p < 0.05, and ◯ = not significant).
 p < 0.01,
  p < 0.05, and ◯ = not significant).
3.2. Diffusive Permeability
The relations between the wheel track strata and control for the relative apparent diffusion coefficients measured at −300 hPa (Figure 6) show a pattern comparable to that presented for macroporosity.
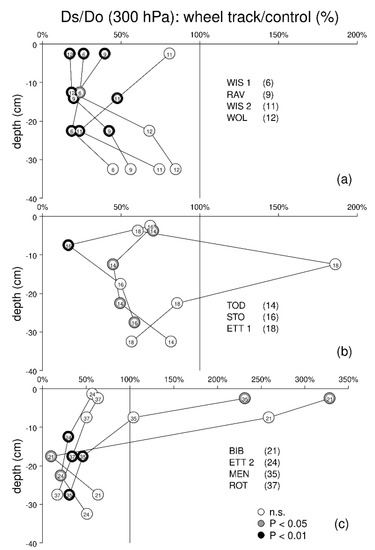
Figure 6.
Ratios of relative apparent diffusion coefficients Ds/Do measured at −300 hPa (wheel track/controlx100) for sites with (a) recovery time of up to 12 years, (b) recovery time from 12 to 18 years, and (c) recovery time from 21 to 37 years. The significance levels of the pairwise Wilcoxon rank test are highlighted by differing grey shading intensities (  p < 0.01,
  p < 0.05, and ◯ = not significant).
 p < 0.01,
  p < 0.05, and ◯ = not significant).
At the study sites with recovery time spans of up to 12 years (Figure 6a), the diffusion velocities at the wheel tracks are substantially lower in all depth layers compared with the corresponding controls. In most cases, the ratios lie below 50%. However, significant differences could only be proved down to a depth of 24 cm (with the exception of WIS 2 (11) in 0–5 cm and WOL (12) in 20–24 cm). Not as substantial as presented for the sites with time periods for structure recovery of up to 11 years, but still obvious, the ratios at the sites TOD (14) and STO (16) reveal the persistence of reduced diffusion properties in the wheel tracks (Figure 6b). Besides the outlying values in the 5–10 cm depth in STO (16) and ETT 1 (18) in 10–14 cm, the ratios span from 44% to 82%. In correspondence with the findings for macroporosity, the range of proportions for Ds/Do in the topsoil is wide for the sites with recovery time spans of more than 20 years (Figure 6c). In the uppermost soil layer at the wheel tracks at BIB (21) and MEN (35), 3.3-fold and 2.3-fold higher relative apparent diffusion coefficients were detected at the wheel tracks compared with the control situations, respectively. An outlier exceeding the diffusion velocities at the control was also present at the depth of 5–9 cm (BIB 21). At the other sites, this effect cannot be observed. There, the ratios in the topsoil and in the deeper soil layers still reveal a substantial and most often highly significant disturbance of gas exchange properties.
At the study site BIB (21), the original wheel rut was filled with loose mineral and organic matter (Figure 7). Due to this filling, in which a high activity of pore-generating soil biota was found, the microporosity, as well as the gas exchange properties, were much higher compared with the control strata. The abrupt boundary to the bleached mineral soil indicates that no spreading of pore volume generation took place into the compacted area below and to the sides of the wheel rut. This finding is consistent with the sharp transition of diffusion velocities as well as the reduced macropore volumes at the wheel tracks below 14 cm at this site and at MEN (35) in 0–4 cm.
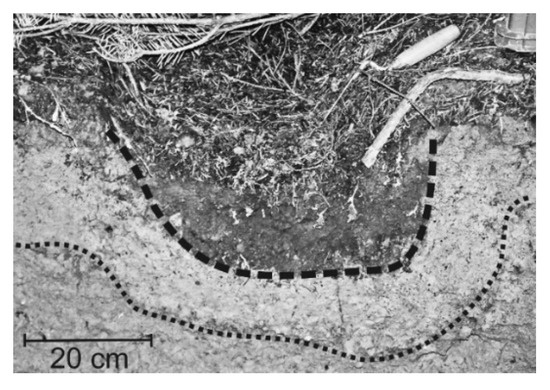
Figure 7.
Filling of wheel rut with loose organic and mineral material at the study site BIB (21). The bold dashed line indicates the boundary of the former depression zone. The transition to the unbleached mineral soil is marked by the dotted line (photograph: H. Buberl).
3.3. Recovery of Fine Rooting
In Figure 8, the modelled fine root densities are presented for the study sites WIS 1 (6) and ROT (37) in order to illustrate the different patterns of fine rooting after a short and long timespan for the regaining of site-specific rooting conditions.
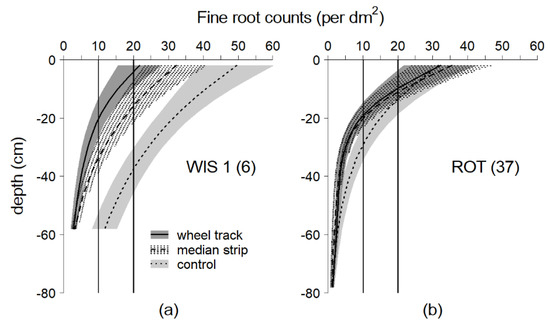
Figure 8.
Depth gradients of the mean fine root densities at WIS 1 (a) and ROT (b) for wheel track, median strip, and control strata. Confidence intervals were calculated using the standard deviations of the GAM predictions (±2 sd). The bold vertical reference lines indicate the boundaries for intense rooting (20 fine roots × 100 cm–2); the finer reference lines the threshold for weak rooting (10 fine roots × 100 cm–2).
As it was presented for the macroporosity parameter, the depth gradients of fine rooting for the site WIS 1 (6) are arranged according to the expected intensity of impact (Figure 8a). In contrast to the control strata, where intense fine rooting (more than 20 fine roots × 100 cm–2) reached down to approximately 40 cm, this intensity was only achieved in the uppermost grid cell layer at the wheel track. The intensively rooted zone at the median strip spread down to 16 cm. Throughout the whole control profile, fine rooting did not fall below the threshold of 10 fine roots × 100 cm–2, which is classified as a weak rooting density. This threshold was only surpassed in the upper 20 cm at the wheel track and above 36 cm at the median strip. As for the macroporosity presented in Figure 4, the median strip represents an intermediate status of recovery concerning the persistence of reduced fine root propagation.
At the investigation site ROT (37) with the longest period of soil restructuring, fine root densities for the three strata were comparable in the upper 10 cm soil depth and below 60 cm (Figure 9b). In between, the mean fine root densities at the control profile exceeded the densities found at the wheel track and median strip. A statistical significance (p < 0.05) between the control situation and wheel track strata could be proved from 20 cm down to 36 cm.
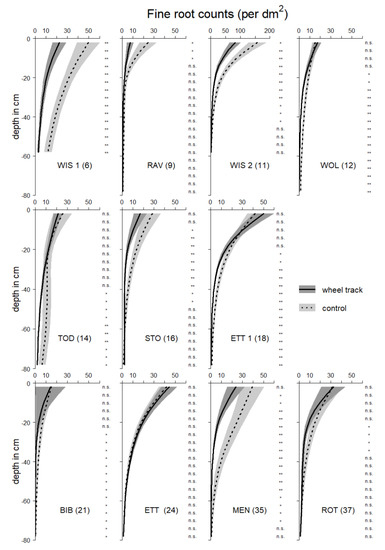
Figure 9.
Depth gradients for the mean fine root densities of the wheel track and control strata. Confidence limits were derived based on the GAM predictions. Significance levels were assigned on the basis of three (** p < 0.01) and two standard deviations (* p < 0.05), n.s.= not significant).
Figure 9 presents the fine root depth gradients for the wheel track strata and control situations for all investigation sites in a chronological manner.
At WIS 1 (6), WIS 1 (12), and RAV (12), all the upper soil layers reveal a significant persistence of reduced fine rooting (Figure 9a). Fine rooting in the deeper soil layers at RAV (9) was limited by stagnic properties beginning at a soil depth of 25 to 30 cm. Thus, at that site no deeper-reaching effects caused by wheeling activity can be detected, as is possible for the other representations within this time span of recovery. The site WOL (12) exhibits reduced fine root propagation below 16 cm down to 80 cm soil depth.
For the sites shown in Figure 9b,c, no consistent chronology concerning the recovery of fine root propagation according to the time span of recovery can be derived. As a common characteristic for both groups, overlapping of the confidence bands in the uppermost layer(s) can be observed. With the exception of ETT (24), reduced root densities in the wheel tracks persisted in different depths and vertical extents. Even at the sites where the investigations took place more than 3 decades after the last trafficking, root propagation was still reduced in relation to the controls. This can be seen in particular at MEN (35).
As a characteristic for the sites BIB (21), MEN (35), and ROT (37), the confidence bands for the wheel track locations are wide, reflecting a high variability within these strata. At the sites with a shorter time span of recovery, the confidence bands at the wheel tracks are narrow compared with the corresponding control strata.
At WIS 2 (11) the intensity of fine rooting and at TOD (14) the shape of the depth gradients differ from the other investigation sites. At WIS 2 (11), ash and sycamore were the dominant tree species, which are characterized by a more intense fine root exploration in the top soil. The fine root density curve at the control site at TOD (14) shows hardly any decrease below 20 cm down to 60 cm of soil depth, whereas the other sites portrayed continuously declining density curves. There, a higher macroporosity and diffusion velocities in the cambisol allowed for intense rooting even in deeper soil horizons.
4. Discussion
In forest stands, nutrition and water supply can only be maintained if fine roots have sufficient access to these essential resources. This is ensured by a hierarchical pore system in naturally structured forest soils. Disturbance of gas exchange processes caused by pore volume loss and pore continuity in compacted forest soils impedes the survival and propagation of the fine roots, which have a high oxygen demand [29,30,31]. Parameters closely linked to soil aeration status were shown to be suitable to characterize the ecological damage [11,12,32]. Thus, macroporosity, relative apparent diffusion velocity, and fine root propagation were used for the evaluation of the recovery status of the formerly compacted soils at 11 sites in Baden-Wuerttemberg, with time spans reaching from 6 to 37 years of soil structure recovery.
4.1. Soil Physical Parameters Indicate Restructuring of the Pore System at the Topsoils
The comparisons for the macropore volume and apparent diffusion coefficient between wheel track strata and controls revealed a high persistence of pore volume loss and decreased gas diffusion velocity down to a 35 cm soil depth, even more than 3 decades after the trafficking events. Closer to the soil surface, the still persisting impedances differed in intensity depending on the time spans of recovery. Extremely lower macroporosities and diffusion velocities compared with the controls (ratios considerably smaller than 50%) were found at the sites with time spans of recovery of up to 12 years. At the investigation sites with longer periods of recovery, the ratios exceed 50%. This might be cautiously interpreted as an indication of topsoil structure recovery.
At two investigation sites, even higher topsoil macroporosity and diffusion coefficients compared with the control sites were found. There, the former wheel ruts obviously acted as traps for organic and mineral matter. Loosely packed organic and mineral filling of the wheel ruts in combination with a sufficient water supply led to favourable conditions for soil-structuring biota that in one case were furthermore promoted by a liming campaign. This effect was reported in earlier studies [33,34,35] but its ecological relevance was questioned [34]. This doubt can be confirmed by the presented results: The “apparent recovery effect” was obviously limited to the organically enriched uppermost part of the wheel track situation. A significant spreading of the biological restructuring into the compacted soil below the wheel tracks, attributed to, e.g., earthworm burrowing as reported by Capowiez et al. [36], cannot be deduced from our soil physical measurements and was also not confirmed by Ampoorter et al. [32].
The high persistence of a reduced macroporosity and gas diffusion velocity in the deeper soil characterized by time spans of recovery of more than 20 years seems to be contradictory. Two aspects might explain this long persistence of damage: In contrast to specialized forest machinery equipped with wide tyres, small-tyred machines may sink deep into the mineral soil when used in wet soil conditions, causing intense subsoil damage. Furthermore, wheeling at sites with storm damage was in former times not restricted to equidistant skid trails, with the consequence of areal soil structure damage. Both aspects might have led to severe inhibition of the restructuring soil biota due to the widespread destruction of habitats.
In the soil depth below 30 cm, the macropore volume and gas diffusion coefficient at the wheel tracks were still markedly lower compared with those of the control strata. However, the statistical testing did not reveal significant differences due to the higher variability of the measured parameters. This depth can be cautiously interpreted as a transition zone to the subsoil, where pore volume loss and gas diffusion properties had been less affected by the wheeling activity.
4.2. Recovery of Root Propagation
Based on the extended material of this study, the principal findings of von Wilpert and Schäffer [13], who found hardly any recovery of fine rooting within recovery time spans of up to 12 years, are substantiated. This can be explained by the “bottleneck effect” of a disturbed gas exchange at the topsoil: loss of pore volume and lack of pore continuity in the uppermost soil layers limit the oxygen supply and carbon dioxide disposal in the whole root zone [29,30].
At the sites with longer time delays between trafficking and root counting, no clear chronological ordering according to the hypotheses of a step-by-step approximation of fine root densities towards site-specific levels can be detected. Even at sites with time spans of soil structure recovery of more than 30 years, the depth gradients of fine rooting at the wheel tracks exhibit significantly lower densities compared with the control. Although the statistical testing of the macroporosity and diffusion velocity reveal a restructuring in the topsoil, this effect is not sufficient to overcome the impedance of fine root propagation in the deeper soil. If limitations of gas exchange persist in the deeper soil (as realized at the sites with long periods of a potential structure recovery), fine rooting might still be affected substantially in the deeper soil layers.
One of the study sites was characterized by a higher content of coarse fragments and another by tree species with a higher rooting capacity [37]. Soils with higher contents of sand or coarse fragments are assumed to be less prone to machine impacts [38,39]. At both sites, site-specific soil structure properties and fine root propagation should be achieved in shorter time periods. In contrast to this expectation, the fine root propagation and the soil structural parameters do not indicate an outstanding recovery dynamic.
4.3. Methodological and Statistical Aspects
4.3.1. Space for Time Substitution
The space for time substitution is a frequently used approach in ecosystem research when continuous measurements over longer time spans are lacking [40]. Its use is not reliable, when the comparability of sites is not given or unrecognised effects in the past were of a large magnitude. We tried to ensure a high comparability between the sites and operations through a detailed inquiry at the forest districts responsible for forest management and a verification process in the field. Vossbrink and Horn [41] proved that even lighter machines used in forest operations might cause soil stress comparable to that from heavy weighted machines due to dynamic force components. Thus, comparable impacts at the investigated sites can be assumed. However, uncertainty concerning the comparability of the original disturbance intensity remains. Besides this aspect, the unknown dynamic and velocity of the soil re-structuring processes at the different sites is critical for the evaluation of the data in the sense of a space for time substitution. Comparability concerning this aspect can only be achieved when study sites are located close together and site conditions do not differ among the considered representations. Neither of the mentioned aspects can be fully complied with in a retrospective study, looking back for decades. Nevertheless, the presented results give valuable information for judging the persistence of soil compaction phenomena in the sense of pattern recognition.
4.3.2. Modelling of Fine Root Surfaces
Fine root patterns derived at trench walls across skid trails give valuable information about the vertical and horizontal spreading of damaged soil compartments [14]. Generalized Additive Models (GAMs) [26,27] are a powerful tool to analyse root surfaces without integrating the uncertain field information on skid trail stratification. In this study, inference statistics between control situations and skid trail locations with the maximum impedance of rooting (reallocated “wheel track”) were performed after detecting the local minima of root densities in the first five topsoil grid layers across the skid trails. A high matching rate detected for the horizontal locations of the minima confirms the suitability of this approach for an objective derivation of the most impacted zone below skid trails concerning fine root propagation. In addition, the failure of the algorithm at the sites with longer time spans of recovery indicates that field stratification involves a risk of misinterpretation, e.g., when sampling of soil cores at formerly passed skid trails is stratified according to the visual depression at the soil surface in the field. Furthermore, prevention of wheel rutting during harvesting and logging operations has become a major concern in forest machinery construction during the last decades. This fact also underpins the value and need of flexible statistical tools that are able to cope with uncertain or even missing information for stratification purposes and pattern recognition.
5. Conclusions
In the assessment of soil structure damage caused by heavy machinery and the judgment of their ecological relevance, the persistence of soil functionality disturbance is of great importance. Although numerous case studies have proved the negative effects on soil physical properties persisting over decades, there is still a high uncertainty concerning the persistence of the damage for different soil types and site conditions.
For the investigated sites with a silt loam texture and low activity of soil biota, long- lasting negative effects on the soil structure and fine root propagation exceeding time spans of more than three decades have been proved. The prognosis concerning soil disturbances caused by the much heavier machines that are used in practical forestry today is even more alarming. The lack of compliance with existing regulations in addition to the lack of awareness concerning long-term effects induced by soil compaction, as well as the long-lasting persistence of damage, are the main reasons for the historical accumulation of soil structure damage. The results presented in this study underpin the necessity for an implementation of soil protection strategies that ensure the preservation of naturally structured soils as a prerequisite for fulfilling the diverse ecosystem services. This is becoming more and more relevant in the face of the upcoming threats to forest ecosystems initiated by climate change.
If time spans of more than three decades are necessary for at least a partial restoration of soil functionality, we have to discuss whether it is justifiable or not to leave irregularly deformed soils in their critical physical conditions. If the latter is answered affirmatively, active measures have to be considered in order to restore soil structure deficits. Although soil tilling by ploughing or milling is a well-known strategy in agricultural management practices, its use in forestry is subject to several restrictions and success is uncertain [42,43]. Thus, methods that are based on biological pore structure generation and stabilization promise more success. Planting or sowing compaction-tolerant herbal or woody plant species might be a realistic option to accelerate the natural recovery processes and to promote a deeper soil restructuring [44,45].
More investigations on this topic are essential in order to develop practicable and feasible strategies for the activation and stabilization of soil-structuring processes in compacted soils. This would be in accordance with the EU-Soil Strategy 2030 [46], which aims to reduce the number of compacted soils, take active measures in the case of low natural recovery potential, and create greater awareness of the vulnerability of soils concerning compaction threads.
Funding
This work was funded by the Federal Ministry of Education and Research (Germany) (BMBF project n 0339767).
Informed Consent Statement
Not applicable.
Data Availability Statement
Data available on request.
Conflicts of Interest
The author declares no conflict of interest.
Appendix A

Table A1.
Location of modelled fine root density; the five depth layers were located at the same horizontal grid cell position. Minima: The interval represents the range of horizontal grid cell positions for the minima in the first five grid layers at the transects of the investigation sites. Skid trail locations with identical minima in all of these layers are printed in italics.
| Transect 1 | Transect 1 | |||
|---|---|---|---|---|
| Site | Wheel Track 1 | Wheel Track 2 | Wheel Track 1 | Wheel Track 2 |
| Min–max (cm) | Min–max (cm) | |||
| Ravensburg (RAV) | 118–130 | 282–286 | – | – |
| Weil im Schoenbuch (WIS 2) | 50–54 | 250–258 | 118–122 | 242 |
| Todtmoos (TOD) | 146 | 358–362 | 102–114 | 318 |
| Stockach (STO) | 94–102 | 298–306 | 166 | 346 |
| Biberach (Bib) | – | – | – | – |
| Ettenheim (ETT 2) | – | – | – | – |
| Rottweil (ROT) | 62 | 206–210 | – | – |
References
- Macdonald, P.; Clow, M. What a difference a skidder makes: The role of technology in the origins of the industrialization of tree harvesting systems. Hist. Technol. 2003, 2, 127–149. [Google Scholar] [CrossRef]
- Nordfjell, T.; Öhman, E.; Lindroos, O.; Ager, B. The technical development of forwarders in Sweden between 1962 and 2012 and of sales between 1975 and 2017. Int. J. For. Eng. 2019, 1, 1–13. [Google Scholar] [CrossRef]
- Hamberger, J. Wie Mechanisierung und Umweltvorsorge die Forstwirtschaft Veränderten. LWFaktuell 2003, 39, 33–39. Available online: https://www.lwf.bayern.de/service/publikationen/lwf_aktuell/076550/index.php (accessed on 23 April 2022).
- Schäffer, J.; Buberl, H.; von Wilpert, K. Deformation damages in forest topsoils—An assessment based on Level-I soil monitoring data from Baden-Württemberg (SW Germany). J. Plant Nutr. Soil Sci. 2012, 1, 24–33. [Google Scholar] [CrossRef]
- Gaertig, T.; Ebeling, C.; Riggert, R. Bodenschutz beim Forstmaschineneinsatz. Bodenschutz 2018, 1, 9–15. [Google Scholar] [CrossRef]
- Hatchell, G.E.; Rolston, C.W. Natural recovery of surface soils disturbed in logging. Tree Plant. Notes 1971, 2, 5–9. Available online: https://www.srs.fs.usda.gov/pubs/ja/1971/ja_1971_hatchell_001.pdf (accessed on 23 April 2022).
- Froehlich, H.A.; Miles, D.W.R.; Robbins, R.W. Soil bulk density recovery on compacted skid trails in central Idaho. Soil Sci. Soc. Am. J. 1985, 49, 1015–1017. [Google Scholar] [CrossRef]
- Webb, R.H.; Steiger, J.W.; Wilshire, H.G. Recovery of compacted soils in Mojave Desert ghost towns. Soil Sci. Soc. Am. J. 1986, 5, 1341–1344. [Google Scholar] [CrossRef]
- Labelle, E.R.; Jaeger, D. Soil Compaction Caused by Cut-to-Length Forest Operations and Possible Short-Term Natural Rehabilitation of Soil Density. Soil Sci. Soc. Am. J. 2011, 6, 2314–2329. [Google Scholar] [CrossRef] [Green Version]
- Klaes, B.; Struck, J.; Schneider, R.; Schüler, G. Middle-term effects after timber harvesting with heavy machinery on a fine-textured forest soil. Eur. J. For. Res. 2016, 6, 1083–1095. [Google Scholar] [CrossRef]
- Hildebrand, E.E. Der Einfluss der Bodenverdichtung auf die Bodenfunktionen im Forstlichen Standort. Forstwiss. Cent. 1983, 102, 111–125. Available online: https://www.freidok.uni-freiburg.de/fedora/objects/freidok:5830/datastreams/FILE1/content (accessed on 23 April 2022). [CrossRef] [Green Version]
- Hildebrand, E.E.; Schack-Kirchner, H. The Influence of Compaction on Soil Structure and Functions in Forest Sites. In Modern Trends in Applied Terrestrial Ecology; Ambasht, R.S., Ambasht, N.K., Eds.; Springer Science + Business Media (Springer eBook Collection): Boston, MA, USA, 2002; pp. 1–11. [Google Scholar] [CrossRef]
- Ampoorter, E.; van Nevel, L.; de Vos, B.; Hermy, M.; Verheyen, K. Assessing the effects of initial soil characteristics, machine mass and traffic intensity on forest soil compaction. For. Ecol. Manag. 2010, 10, 1664–1676. [Google Scholar] [CrossRef] [Green Version]
- Von Wilpert, K.; Schäffer, J. Ecological effects of soil compaction and initial recovery dynamics. A preliminary study. Eur. J. For. Res. 2006, 125, 129–138. [Google Scholar] [CrossRef]
- Goutal, N.; Renault, P.; Ranger, J. Forwarder traffic impacted over at least four years soil air composition of two forest soils in northeast France. Geoderma 2013, 193–194, 29–40. [Google Scholar] [CrossRef]
- Schack-Kirchner, H. Struktur und Gashaushalt von Waldböden Ber. Forsch. Waldökosyst. 1994, 112, 145. [Google Scholar]
- Kremer, J. Befahrungsbedingte Strukturveränderungen von Waldböden und ihre Auswirkungen auf das Wachstum von Fichten, Kiefern und Buchen auf ausgewählten Standorten; GCA-Verlag: Herdecke, Germany, 1998; p. 177. [Google Scholar]
- Ebeling, C.; Lang, F.; Gaertig, T. Structural recovery in three selected forest soils after compaction by forest machines in Lower Saxony, Germany. For. Ecol. Manag. 2016, 359, 74–82. [Google Scholar] [CrossRef]
- Food and Agriculture Organization (FAO). Guidelines for Profile Description, 4th ed.; Food and Agriculture Organization (FAO): Rome, Italy, 2006; p. 97. Available online: https://www.ipcinfo.org/fileadmin/user_upload/soils/docs/FAO_guidelines_soil_description__20063.pdf (accessed on 23 April 2022).
- Danielson, R.E.; Sutherland, P.L. Porosity. In Methods of Soil Analysis. Part 1. Physical and Mineralogical Methods, 2nd ed.; Klute, A., Ed.; Agronomy monograph; American Society of Agronomy: Madison, WI, USA, 1986; Volume 9, pp. 443–450. [Google Scholar]
- Hartge, K.H.; Horn, R. Die Physikalische Untersuchung von Böden, 4th ed.; E. Schweizerbart’sche Verlagsbuchhandlung: Stuttgart, Germany, 2009; p. 178. [Google Scholar]
- Frede, H.G. Der Gasaustausch des Bodens; Göttinger Bodenkundliche Ber: Göttingen, Germany, 1986; Volume 87, p. 130. [Google Scholar]
- Kühne, A.; Schack-Kirchner, H.; Hildebrand, E.E. Gas diffusivity in soils compared to ideal isotropic porous media. J. Plant Nutr. Soil Sci. 2012, 1, 34–45. [Google Scholar] [CrossRef]
- Böhm, W. Methods of Studying Root Systems; Ecological Studies 33; Springer: Berlin, Germany, 1979; p. 208. [Google Scholar]
- van Nordwijk, M.; Brouwer, G.; Meijboom, F.; Oliveira, M.; do Rosario, G.; Bengough, A.G. Trench profile techniques and core break methods. In Root methods—A handbook; Springer: Berlin, Germany, 2000; pp. 212–233. [Google Scholar]
- Wood, S.N. Generalized Additive Models: An Introduction with R; Chapman & Hall; CRC: Boca Raton, FL, USA, 2006; p. 391. [Google Scholar]
- Schäffer, J.; von Wilpert, K.; Kublin, E. Analysis of fine rooting below skid trails using linear and generalized additive models. Can. J. For. Res. 2009, 39, 2047–2058. [Google Scholar] [CrossRef]
- R Core Team. R: A Language and Environment for Statistical Computing; R Foundation for Statistical Computing: Vienna, Austria. Available online: https.//www.R-project.org/ (accessed on 10 November 2015).
- Gaertig, T. Bodengashaushalt, Feinwurzeln und Vitalität von Eichen; Freiburger Bodenkundliche Abhandlungen: Freiburg, Germany, 2001; Volume 40, p. 157. [Google Scholar]
- Gaertig, T.; Schack-Kirchner, H.; Hildebrand, E.E.; Wilpert, K.V. The impact of soil aeration on oak decline in southwestern Germany. For. Ecol. Manag. 2002, 159, 15–25. [Google Scholar] [CrossRef]
- Qi, J.; Marshall, J.D.; Mattson, K.G. High soil carbon dioxide concentrations inhibit root respiration of Douglas fir. New Phytol. 1994, 128, 435–442. [Google Scholar] [CrossRef]
- Ampoorter, E.; de Schrijver, A.; de Frenne, P.; Hermy, M.; Verheyen, K. Experimental assessment of ecological restoration options for compacted forest soils. Ecol. Eng. 2011, 11, 1734–1746. [Google Scholar] [CrossRef]
- Benthaus, M.; Matthies, D. Regeneration befahrener Waldböden. Allg. Forst Z. 1993, 9, 448–451. [Google Scholar]
- Schack-Kirchner, H.; Hildebrand, E.E.; von Wilpert, K. Bodensauerstoffhaushalt unter Fahrspuren. Allg. Forst Z. 1993, 3, 118–121. [Google Scholar]
- Eklkofer, E.; Matthies, D. Das Wuchsverhalten eines gepflanzten Fichtenbestandes auf einem vorverdichteten Standort—30 Jahre nach Befahrung. Allg. Forst Z. 1995, 22, 1222–1226. [Google Scholar]
- Capowiez, Y.; Cadoux, S.; Bouchard, P.; Roger-Estrade, J.; Richard, G.; Boizard, H. Experimental evidence of the role of earthworms in compacted soil regeneration based on field observations and results from a semi-field experiment. Soil Biol. Biochem. 2009, 4, 711–717. [Google Scholar] [CrossRef]
- Horn, A.; Murach, D. Vertikale Feinwurzelverteilung und Hinweise auf interspezifische Wurzelkonkurrenz in Eschen/Buchen-Naturverjüngungen. Forstarchiv 2003, 74, 46–52. [Google Scholar]
- Greacen, E.L.; Sands, R. Compaction of forest soils. A review. Soil Res. 2002, 2, 163–189. [Google Scholar] [CrossRef]
- Cambi, M.; Certini, G.; Neri, F.; Marchi, E. The impact of heavy traffic on forest soils: A review. For. Ecol. Manag. 2015, 338, 124–138. [Google Scholar] [CrossRef]
- Pickett, S.T.A. Space-for-Time Substitution as an Alternative to Long-Term Studies. In Long-Term Studies in Ecology; Likens, G.E., Ed.; Springer: New York, NY, USA, 2012; pp. 110–135. [Google Scholar] [CrossRef]
- Vossbrink, J.; Horn, R. Modern forestry vehicles and their impact on soil physical properties. Eur. J. For. Res. 2004, 2, 259–267. [Google Scholar] [CrossRef]
- Horn, R.; Lebert, M. Möglichkeiten und Grenzen der Bodenbearbeitung der physikalischen Bodenrekultivierung in der Forstwirtschaft. Allg. Forst Z. 1992, 47, 998–1004. [Google Scholar]
- Gaertig, T.; Hildebrand, E.E.; Schäffer, J.; von Wilpert, K. Wirkung mechanischer Bodenlockerung auf Bodenbelüftung und Durchwurzelung. Allg. Forst Z. 2000, 55, 1124–1126. [Google Scholar]
- Meyer, C.; Lüscher, P.; Schulin, R. Enhancing the regeneration of compacted forest soils by planting black alder in skid lane tracks. Eur. J. For. Res. 2014, 3, 453–465. [Google Scholar] [CrossRef]
- Flores Fernández, J.L.; Rubin, L.; Hartmann, P.; Puhlmann, H.; von Wilpert, K. Initial recovery of soil structure of a compacted forest soil can be enhanced by technical treatments and planting. For. Ecol. Manag. 2018, 431, 54–62. [Google Scholar] [CrossRef]
- EU-COM. EU Soil Strategy for 2030—Reaping the Benefits of Healthy Soils for People, Food, Nature and Climate. 2021. Available online: https://eur-lex.europa.eu/legal-content/EN/TXT/?uri=CELEX%3A52021DC0699 (accessed on 23 April 2022).
Publisher’s Note: MDPI stays neutral with regard to jurisdictional claims in published maps and institutional affiliations. |
© 2022 by the author. Licensee MDPI, Basel, Switzerland. This article is an open access article distributed under the terms and conditions of the Creative Commons Attribution (CC BY) license (https://creativecommons.org/licenses/by/4.0/).