Article

Landscape Influence on the Browning of a Lake Watershed in the Adirondack Region of New York, USA

1
Department of Civil and Environmental Engineering, Syracuse University, Syracuse, NY 13244, USA
2
Department of Biology, State University of New York at Geneseo, Geneseo, NY 14454, USA
3
Department of Environmental and Forest Biology, SUNY College of Environmental Science and Forestry, Syracuse, NY 13210, USA
*
Author to whom correspondence should be addressed.
Soil Syst. 2020, 4(3), 50; https://doi.org/10.3390/soilsystems4030050
Submission received: 30 June 2020 / Revised: 26 July 2020 / Accepted: 6 August 2020 / Published: 12 August 2020

Abstract

:
Watershed recovery from long-term acidification in the northeastern U.S. has been characterized by an increase in the influx of dissolved organic matter (DOM) into surface waters. Increases in carbon quantity and shifts to more aromatic and “colored” OM has impacted downstream lakes by altering thermal stratification, nutrient cycling and food web dynamics. Here, we used fluorescence spectroscopy coupled with parallel factor analysis (PARAFAC) to model predominant carbon quality fractions and their seasonal changes within surface waters along landscape positions of Arbutus Lake watershed in the Adirondack region of NY, USA. All DOM components were terrestrial in origin, however their relative fractions varied throughout the watershed. DOM in headwater streams contained high fractions of recalcitrant (~43%) and microbial reprocessed humic-like OM (~33%), sourced from upland forest soils. Wetlands above the lake inlet contributed higher fractions of high molecular weight, plant-like organic matter (~30%), increasing dissolved organic carbon (DOC) concentrations observed at the lake inlet (492.5 mg L−1). At the lake outlet, these terrestrial fractions decreased significantly during summer months leading to a subsequent increase in reprocessed OM likely through increased microbial metabolism and photolysis. Comparisons of specific ultraviolet absorbance between this study and previous studies at Arbutus Lake show that OM draining upland streams (3.1 L·mg C−1 m−1) and wetland (4.1 L·mg C−1 m−1) is now more aromatic and thus more highly colored than conditions a decade ago. These findings provide insight into the emerging role that watersheds recovering from acidification play on downstream water quality.

1. Introduction

Throughout the 20th century, elevated atmospheric deposition of strong acids (SO42− and NO3) critically impacted terrestrial and aquatic ecosystems within base-poor montane regions of the northeastern United States [1,2]. These areas are characterized by a limited ability to neutralize inputs of strong acids and as a result have experienced long-term depletion of exchangeable base cations from soil (Ca2+, Mg2+, Na+ and K+) [3,4,5]. The subsequent mobilization of inorganic monomeric Al from soil [6] has contributed impacts on terrestrial and aquatic ecosystems such as: vegetative stress [7], suppression of soil microbial biomass [8], disruption of aquatic food webs [9], as well as the stabilization of soil organic matter (SOM) [10,11].
Since the passage of the Clean Air Act and associated rules, there have been significant long-term decreases in atmospheric deposition of SO42− and NO3 [1,12]. Coincidently, terrestrial and aquatic ecosystems have responded to the alleviation in acidic inputs. Monomeric Al concentrations, particularly the inorganic fraction, have significantly decreased in soils and surface waters [12,13]. Acid impacted biota such as red spruce (Picea rubens Sarg.) [14,15] and brook trout (Salvelinus fontinalis) [16] have shown signs of recovery. Additionally, SOM concentrations and forest floor thickness have decreased [13], while dissolved organic carbon (DOC) concentrations in soil and surface waters across northeastern U.S. and Europe have increased [12,17].
Organic and mineral soils serve as the largest carbon sink on the planet. Although only a small percentage is mobilized as dissolved organic matter (DOM) [18], that fraction serves as one of the largest sources of OC to freshwater and marine ecosystems [19,20]. DOM is a complex mixture of organic molecules, dependent on source material and the biogeochemical processes exacted upon it as it is transported through terrestrial and aquatic ecosystems [21,22]. Any change to the processing of DOM within soils, such as Al or Fe complexation and microbial degradation, could have significant impacts on DOM quantity and quality transported to surface waters [22,23]. Thus, the deacidification of northeastern North American and European forests is believed to have contributed to the increase in DOC concentrations recently observed in surface waters, called “browning” or “brownification” [12,17,24] The influx of “colored” organic matter contributes to increased light attenuation and strengthening summer stratification in lakes [25]. Additionally, nutrient contributions associated with DOM can enhance lake productivity and subsequent O2 depletion in deeper waters, as well as to enhance production of reactive oxygen species, which have been found to impose stress on zooplankton populations and cause subsequent shifts in lacustrine food web dynamics [26,27]. Legacy Hg can also be transported into surface waters by DOM [28,29] where under anoxic environments it is microbially transformed into the neurotoxin, methylmercury.
The Arbutus Lake watershed within the Adirondack Mountains of New York State has been a site for long-term biogeochemical studies, including DOC mass budgets [30] and initial investigations into carbon quality at both the watershed [31] and in-lake spatial patterns [32]. Arbutus, like many Adirondack lakes, is experiencing long term increases in DOC [12]. The objective of this study was to assess the landscape and seasonal patterns of DOM sourcing through a lake watershed impacted and recovering from long-term changes in acid deposition. Our approach included measurement of absorbance and fluorescence spectroscopy of the chromophoric organic matter (CDOM). These measurements coupled with a multiparameter statistical method, parallel factor analysis (PARAFAC) [33,34] were used to characterize predominant DOM fractions in order to provide insight into DOM sourcing and processing at the watershed level.

2. Materials and Methods

2.1. Study Area

The Arbutus Lake watershed (43˚58′48” N, 74˚13′48” W) is located within the Huntington Wildlife Forest in the Adirondack Mountains of New York State (Figure 1). The watershed has an area of 352 ha, with an elevational range from 513 to 748 m [35]. Over a 30-year period (1984–2013) the annual temperature averaged 5.1 °C and annual precipitation averaged 1086 mm in nearby Newcomb, NY [36]. The overstory vegetation consists of mixed northern hardwoods and conifers with distributions varied by elevation. Upper slopes contain more hardwoods including American beech (Fagus grandifolia), sugar maple (Acer saccharum), red maple (Acer rubrum), yellow birch (Betula alleghaniensis) and white pine (Pinus strobus). Downslope and around the lake, the forest vegetation is characterized by a greater abundance of conifers such as eastern hemlock (Tsuga canadensis), red spruce (Picea rubens) and balsam fir (Abies balsamea) [31]. Upland soils are largely Becket–Mudal series Spodosols (coarse, loamy, mixed, frigid, Typic Haplorthods) [31]. The Archer Creek subcatchment has an area of 135 ha and represents the major inlet of water (45%) to Arbutus Lake (Figure 1) [37]. Four percent of Archer Creek catchment is wetland, including a palustrine peatland (Greenwood Mucky peats) largely at the base of the watershed prior to discharge into Arbutus Lake [38]. Arbutus Lake is a medium till drainage lake with a trophic status between oligotrophic and mesotrophic [39]. The lake has a surface area of 50 ha, an average depth of 3.0 m, a maximum depth of 8.4 m and a mean hydraulic residence time of 0.6 years [40].

2.2. Sample Collection

Surface and ground water samples were collected weekly across a 12-month period between November 2016 and October 2017. Collections were made 49 times at the lake inlet and 50 times at the outlet (n = 99), as well as the outlets of the upland subwatersheds S14 and S15 subcatchments (n = 98), throughout the entire 12-month period which included a range of temperature and flow conditions. Triplicate grab samples were collected at the wetland from April 2017, through October (n = 85). Samples were collected in opaque, brown polyethylene bottles and kept on ice until transport to the Biogeochemistry Laboratory in the State University of New York—College of Environmental Science and Forestry (SUNY-ESF) in Syracuse, NY. There, samples were stored in the dark at 4 °C until analysis at either the Biogeochemistry Laboratory SUNY ESF or the Center of Environmental Systems Engineering at Syracuse University.

2.3. Hydrology and Chemistry

Stage height and discharge have been measured at the outlet of Arbutus Lake since 1991, using a v-notch weir. Discharge at the Archer Creek inlet to Arbutus Lake has been measured since 1994 using an H-flume. Major solutes were measured in the Biogeochemistry Laboratory (SUNY-ESF), which participates with the US Geological Survey quality assurance/quality control (QA/QC) program, in accordance with long-term measurements at Huntington Forest [32]. Samples were filtered with a Durapore® 0.45 µm polyvinylidene difluoride (PVDF) membrane. DOC was analyzed via UV oxidation and sodium persulfate and infrared detection of CO2 using the Tekmar-Dohrmann Phoenix 8000 TOC® analyzer. Calcium was analyzed via ICP-ES using PerkinElmer DIV 3300.

2.4. Optical Measurements

DOM ultraviolet-visible absorbance and fluorescence scans—excitation–emission matrices (EEMs)—were measured using a 1-cm quartz cuvette in a Horiba Aqualog spectrofluorometer at Syracuse University. The excitation range was set from 240 to 550 nm at 2-nm increments, with an emission coverage of 247.68 to 830.02 nm with 2.33-nm increments. The excitation and emission slit widths were set to 10 nm, and the integration time was 0.1 s. EEMs were corrected for instrument-specific factors and inner filter effects. All EEMs were also blank-subtracted and normalized against the Raman peak area of fresh Milli-Q water.

2.5. Statistical Analyses

Two separate PARAFAC analyses were conducted on EEMs from samples, including wetland triplicates, collected during the 12-month period. Two PARAFAC models were necessary because of significant differences between organic matter characteristics of upland surface waters and lake-outlet. The upland PARAFAC analysis was conducted on subcatchment (S14, S15) streams, the wetland and the inlet EEMs (n = 232). The lake PARAFAC analysis was conducted on the inlet and outlet EEMs (n = 99). Both models successfully validated the predominant fluorescent DOM components using the “drEEM” v 0.3.0 toolbox, in Matlab v2019a [33,34]. The relative fractions of similar components between both models were then determined for each individual sample (e.g., %CUBT = (CUC1 + CLC1)/(CUC1 + CLC1 + CUC2 + CLC2 + CUC3 + CLC3), where “UBT” represents the ubiquitous terrestrial fraction, “UC” represents the upland model component, and “LC” represents the lake model component. Specific ultraviolet absorbance (SUVA) was calculated by normalizing the absorption coefficient at 254 nm by the DOC concentration (mg L−1) [41].
Wilcoxon signed-rank test, descriptive statistics and principal component analysis (PCA) [42] were conducted on “R” statistical software v 3.6.5.

3. Results

3.1. Hydrology

For all gauging stations, approximately 40%–50% of the total cumulative discharge for the study year occurred during the winter and snowmelt months (January–April) (Table 1). Flow conditions decreased appreciably during summer due to increases in water losses from evapotranspiration. Discharge at the lake outlet was somewhat lower than inlet values suggesting that inflow from ephemeral drainage may be less than the inlet, the lake is experiencing net groundwater outseepage or evaporation losses exceed precipitation inputs.

3.2. Parafac Model Components

Three unique fluorescent components were identified by the upland PARAFAC model, and three unique fluorescence components were identified by the lake PARAFAC model (Figure 2). Upland component 1 (UC1) had excitation maxima at 265 nm and at 345 nm and a broad emission peak ranging from 375 to >550 nm (max at 455). Upland component 2 (UC2) had excitation maxima at 275 nm and at 400 nm, with a broad emission peak ranging from 410 to >550 nm (max at 510 nm). Upland component 3 (UC3) exhibited an excitation maximum at 315 nm, with a broad emission peak ranging from 275 to 450 nm (max at 405 nm). Lake component 1 (LC1) had excitation maxima at 265 and 345 nm, with a broad emission spectrum ranging from 350 to 550 nm (max at 465 nm). Lake component 2 (LC2) revealed excitation maxima at 310 nm and emission peak ranging from 375 to > 550 nm (max at 425 nm). Lake component 3 (LC3) had excitation maxima at 280 and 420 nm and emission spectrum ranging from 410 to >550 nm (max at 510 nm).

3.3. Spatial Patterns

DOC concentrations generally were lower at the upland subwatersheds, increased in the lower stream reached with the highest average DOC concentration observed at the lake inlet (mean ± std; 5.9 ± 1.6 mg C L−1), followed by the wetland (5.1 ± 1.4 mg C L−1) and then decreased in the lake outlet (5.1 ± 0.5 mg C L−1). However, differences among these lower elevation watershed and lake sites were not significant (p-values > 0.05). Streams draining from the S14 and S15 subwatersheds contained DOC concentrations significantly lower than watershed sites at lower elevations (p-values < 0.05). The average DOC concentration in stream water from the S14 subwatershed was slightly higher, albeit not significant, than in stream water from S15 (S14:1.6 ± 0.3 mg C L−1; S15:1.4 ± 0.4 mg C L−1; p-value = 0.163).
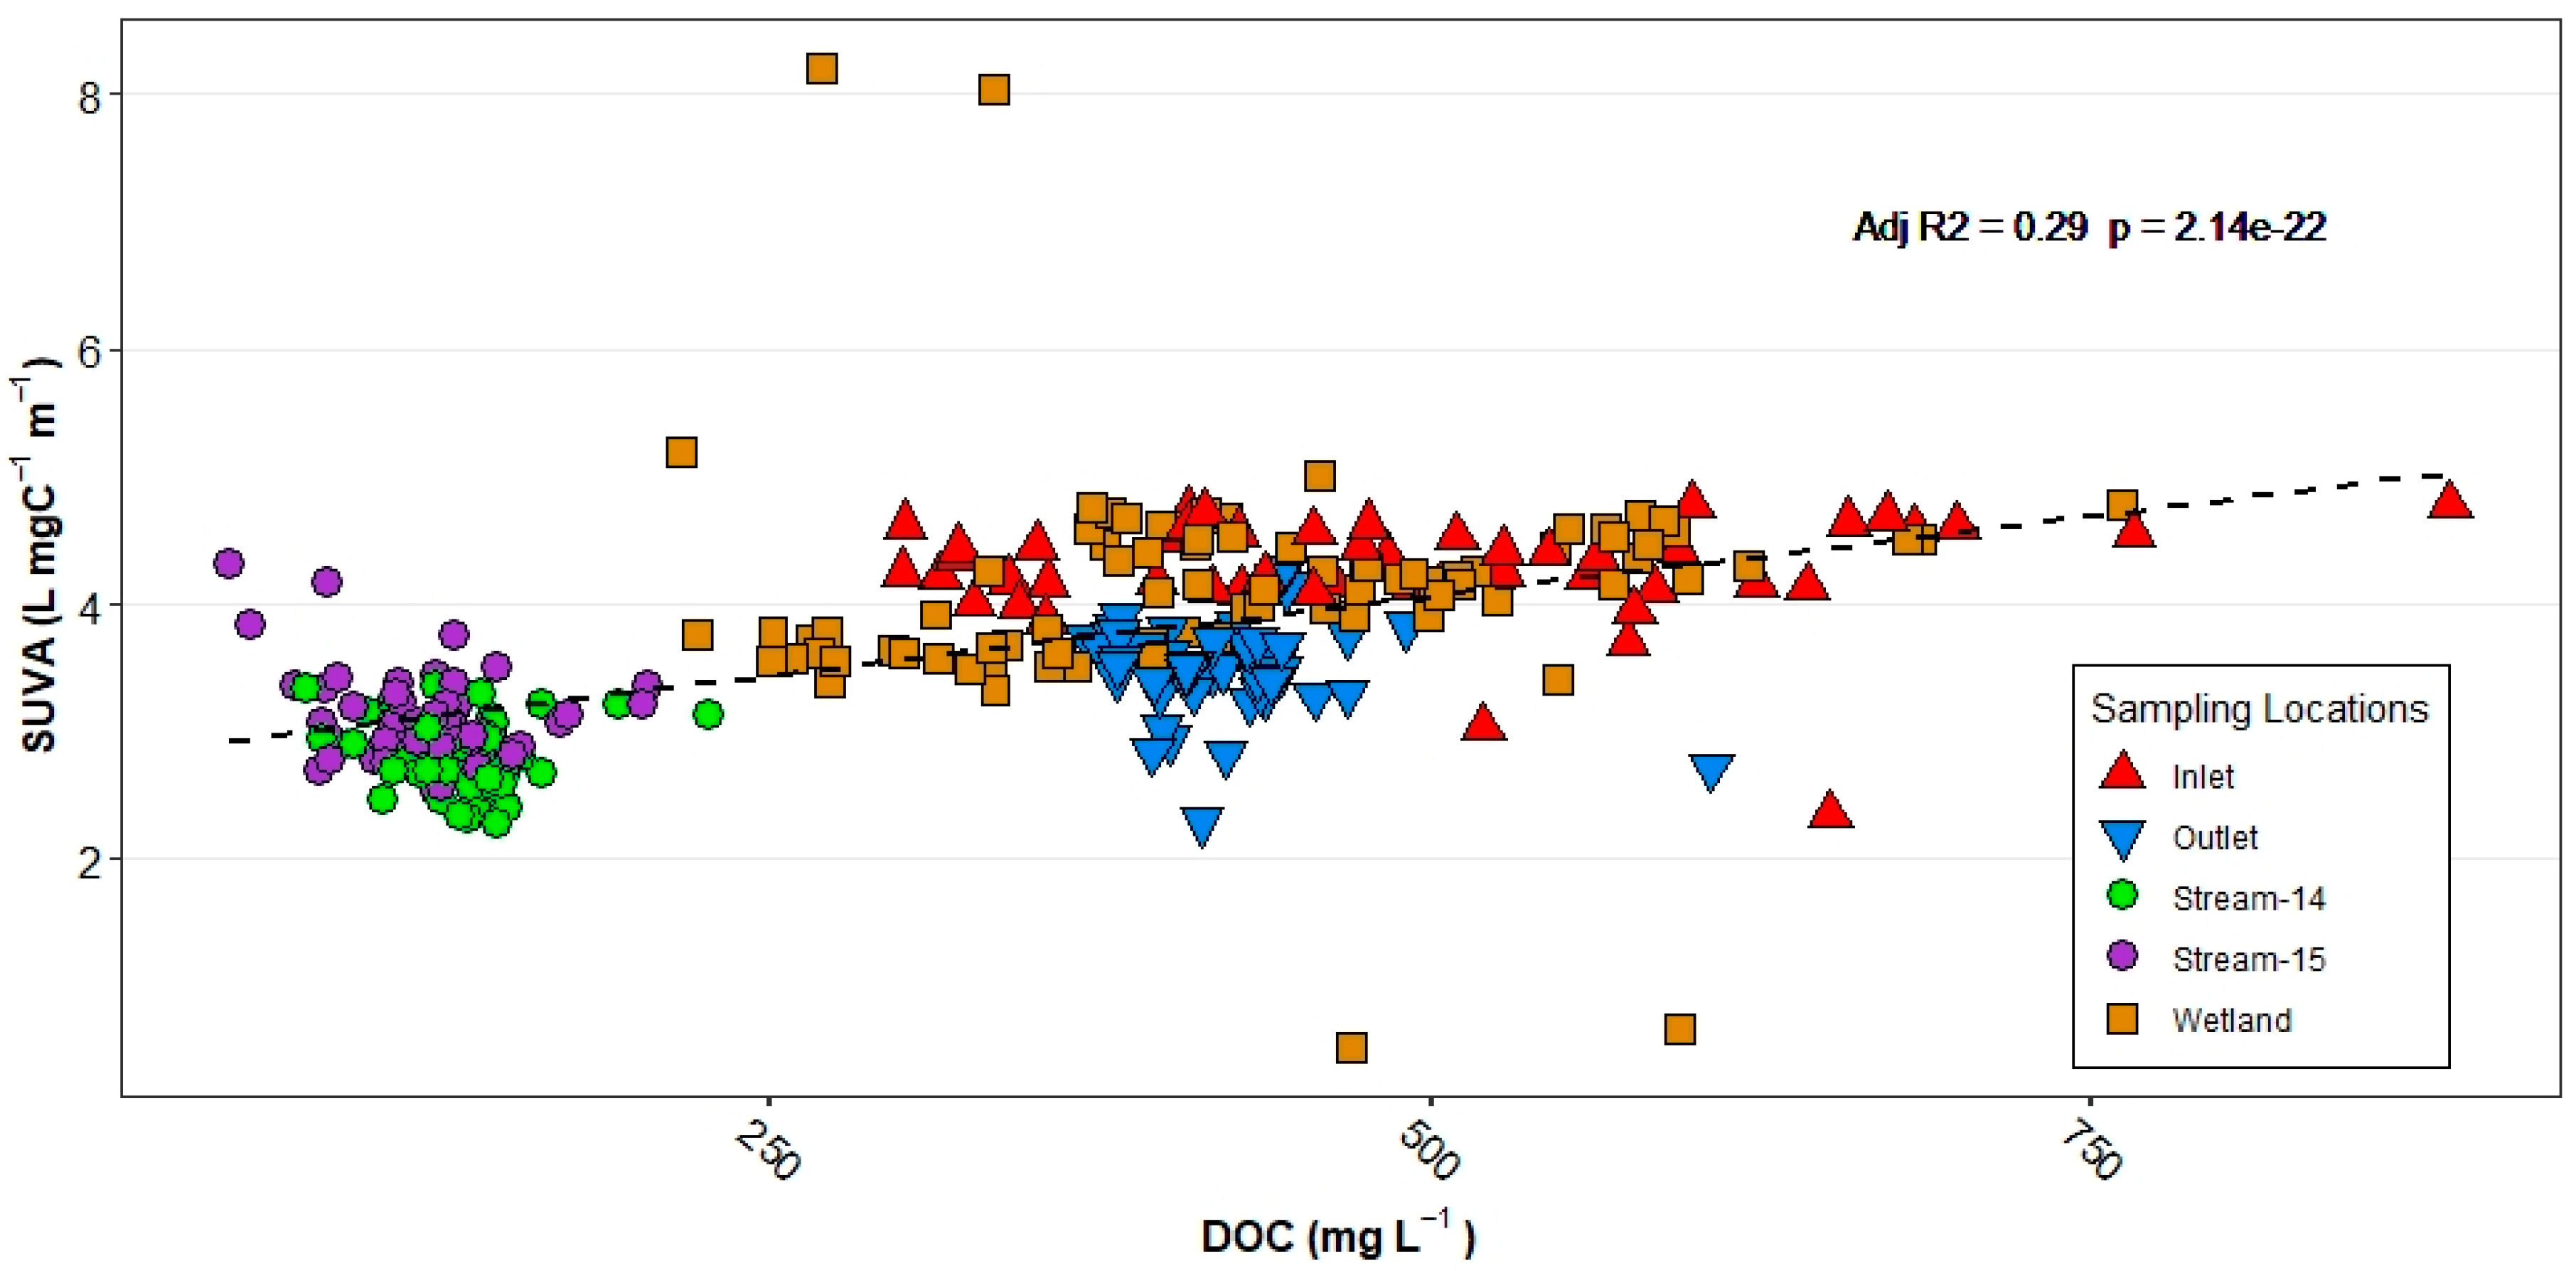
SUVA and DOC generally followed a similar spatial pattern (Figure 3). The highest SUVA values were found at the lake inlet (4.3 ± 0.4 L·mg C−1 m−1). This value was significantly higher than those found at the lake outlet (3.5 ± 0.4 L·mg C−1 m−1; p-value < 0.001), but not significantly different from the wetland (4.1 ± 0.4 L·mg C−1 m−1; p-value = 0.3). SUVA at the wetland was also significantly higher than at the outlet (p-value < 0.001). SUVA values in stream waters draining from S14 (4.1 ± 5.3 L·mg C−1 m−1) were significantly higher than those from S15 (3.1 ± 0.4 L·mg C−1 m−1; p-value = 0.01). Note high SUVA for 3 samplings in late summer 2017 at S14 drove significant differences between this site and other surface waters samples (July 28, 2017:24.9 L·mg C−1 m−1; August 3, 2017:23.1 L·mg C−1 m−1; August 9, 2017:25.3 L·mg C−1 m−1; p-values < 0.001). Excluding the July and August outlier values in S14, mean SUVA values draining the two subwatersheds were not significantly different but were lower than values at lower reach sites (Table A1).
Calcium concentrations generally increased with watershed elevation. Significantly higher concentrations were observed within the S14 watershed (776.5 ± 104.7 mg µmol L−1; p-values < 0.001) than all other sample collection sites (stream S15: 292.8 ± 109.6 µmol L−1; wetland 184.8 ± 37.5 µmol L−1; inlet 161.7 ± 41.6 µmol L−1; outlet 121.5 ± 47.4 µmol L−1).
The DOM fraction characterized as “ubiquitous–terrestrial” (UBT) was calculated as the sum of UC1 and LC1 model loadings normalized by the total model loadings for each sample. The lake inlet contained the highest percentage of the ubiquitous-terrestrial fraction (44.5% ± 0.9%) and were significantly higher than values at all the other surface water sites (p-values < 0.001). There was no significant difference between stream waters and the wetland (S14:42.9% ± 0.8%; S15 43.0% ± 0.7%; 43.1% ± 0.6%). The lake outlet contained the smallest fraction of ubiquitous–terrestrial DOM, significantly less than all other sites sampled, but also exhibited the greatest variation (41.0% ± 2.4%; p-values < 0.001).
The DOM fraction characterized as “high molecular weight terrestrial” (HMT) was calculated as the sum of UC2 and LC3 model loadings normalized by the total model loadings for each sample. The wetland contained the highest percentage of this fraction (30.4% ± 2.2%; Figure 4), significantly higher than all other surface waters sampled (p-values < 0.001). The lake inlet contained the next highest percentage (25.7% ± 1.5%) followed by subwatershed stream waters (S14:23.9% ± 2.7%; S15:23.6% ± 1.3%). There was no significant difference observed between these streams, however at S14, during the same three summer samplings with high SUVA observation, very high HMT fractions were also observed (July 28, 2017:34.0%; August 3, 2017:33.4%; August 9, 2017:33.7%). As observed with the ubiquitous–terrestrial fraction, the lake outlet contained the lowest percentage of the high molecular weight terrestrial fraction (15.2% ± 1.4%; Figure 4).
The DOM fraction characterized as “microbial reprocessed ‘humic-like’” (MRH) presented a differing spatial pattern than other DOM fractions. The lake outlet contained a significantly higher percentage of this fraction than all other surface water sites as well as the highest seasonal variability (43.8% ± 3.8%; p-values < 0.001). On the other hand, the wetland and inlet contained the lowest percentages (26.4% ± 1.9% and 29.8.0% ± 2.0%, respectively; Figure 4). In streams draining S14 and S15, there was no significant difference in the mean percentages of the microbial reprocessed humic-like fraction (p-value = 1.0), however S14 showed greater variability (S14:33.1% ± 2.7%; S15:33.4% ± 1.6%.

3.4. Seasonal Patterns

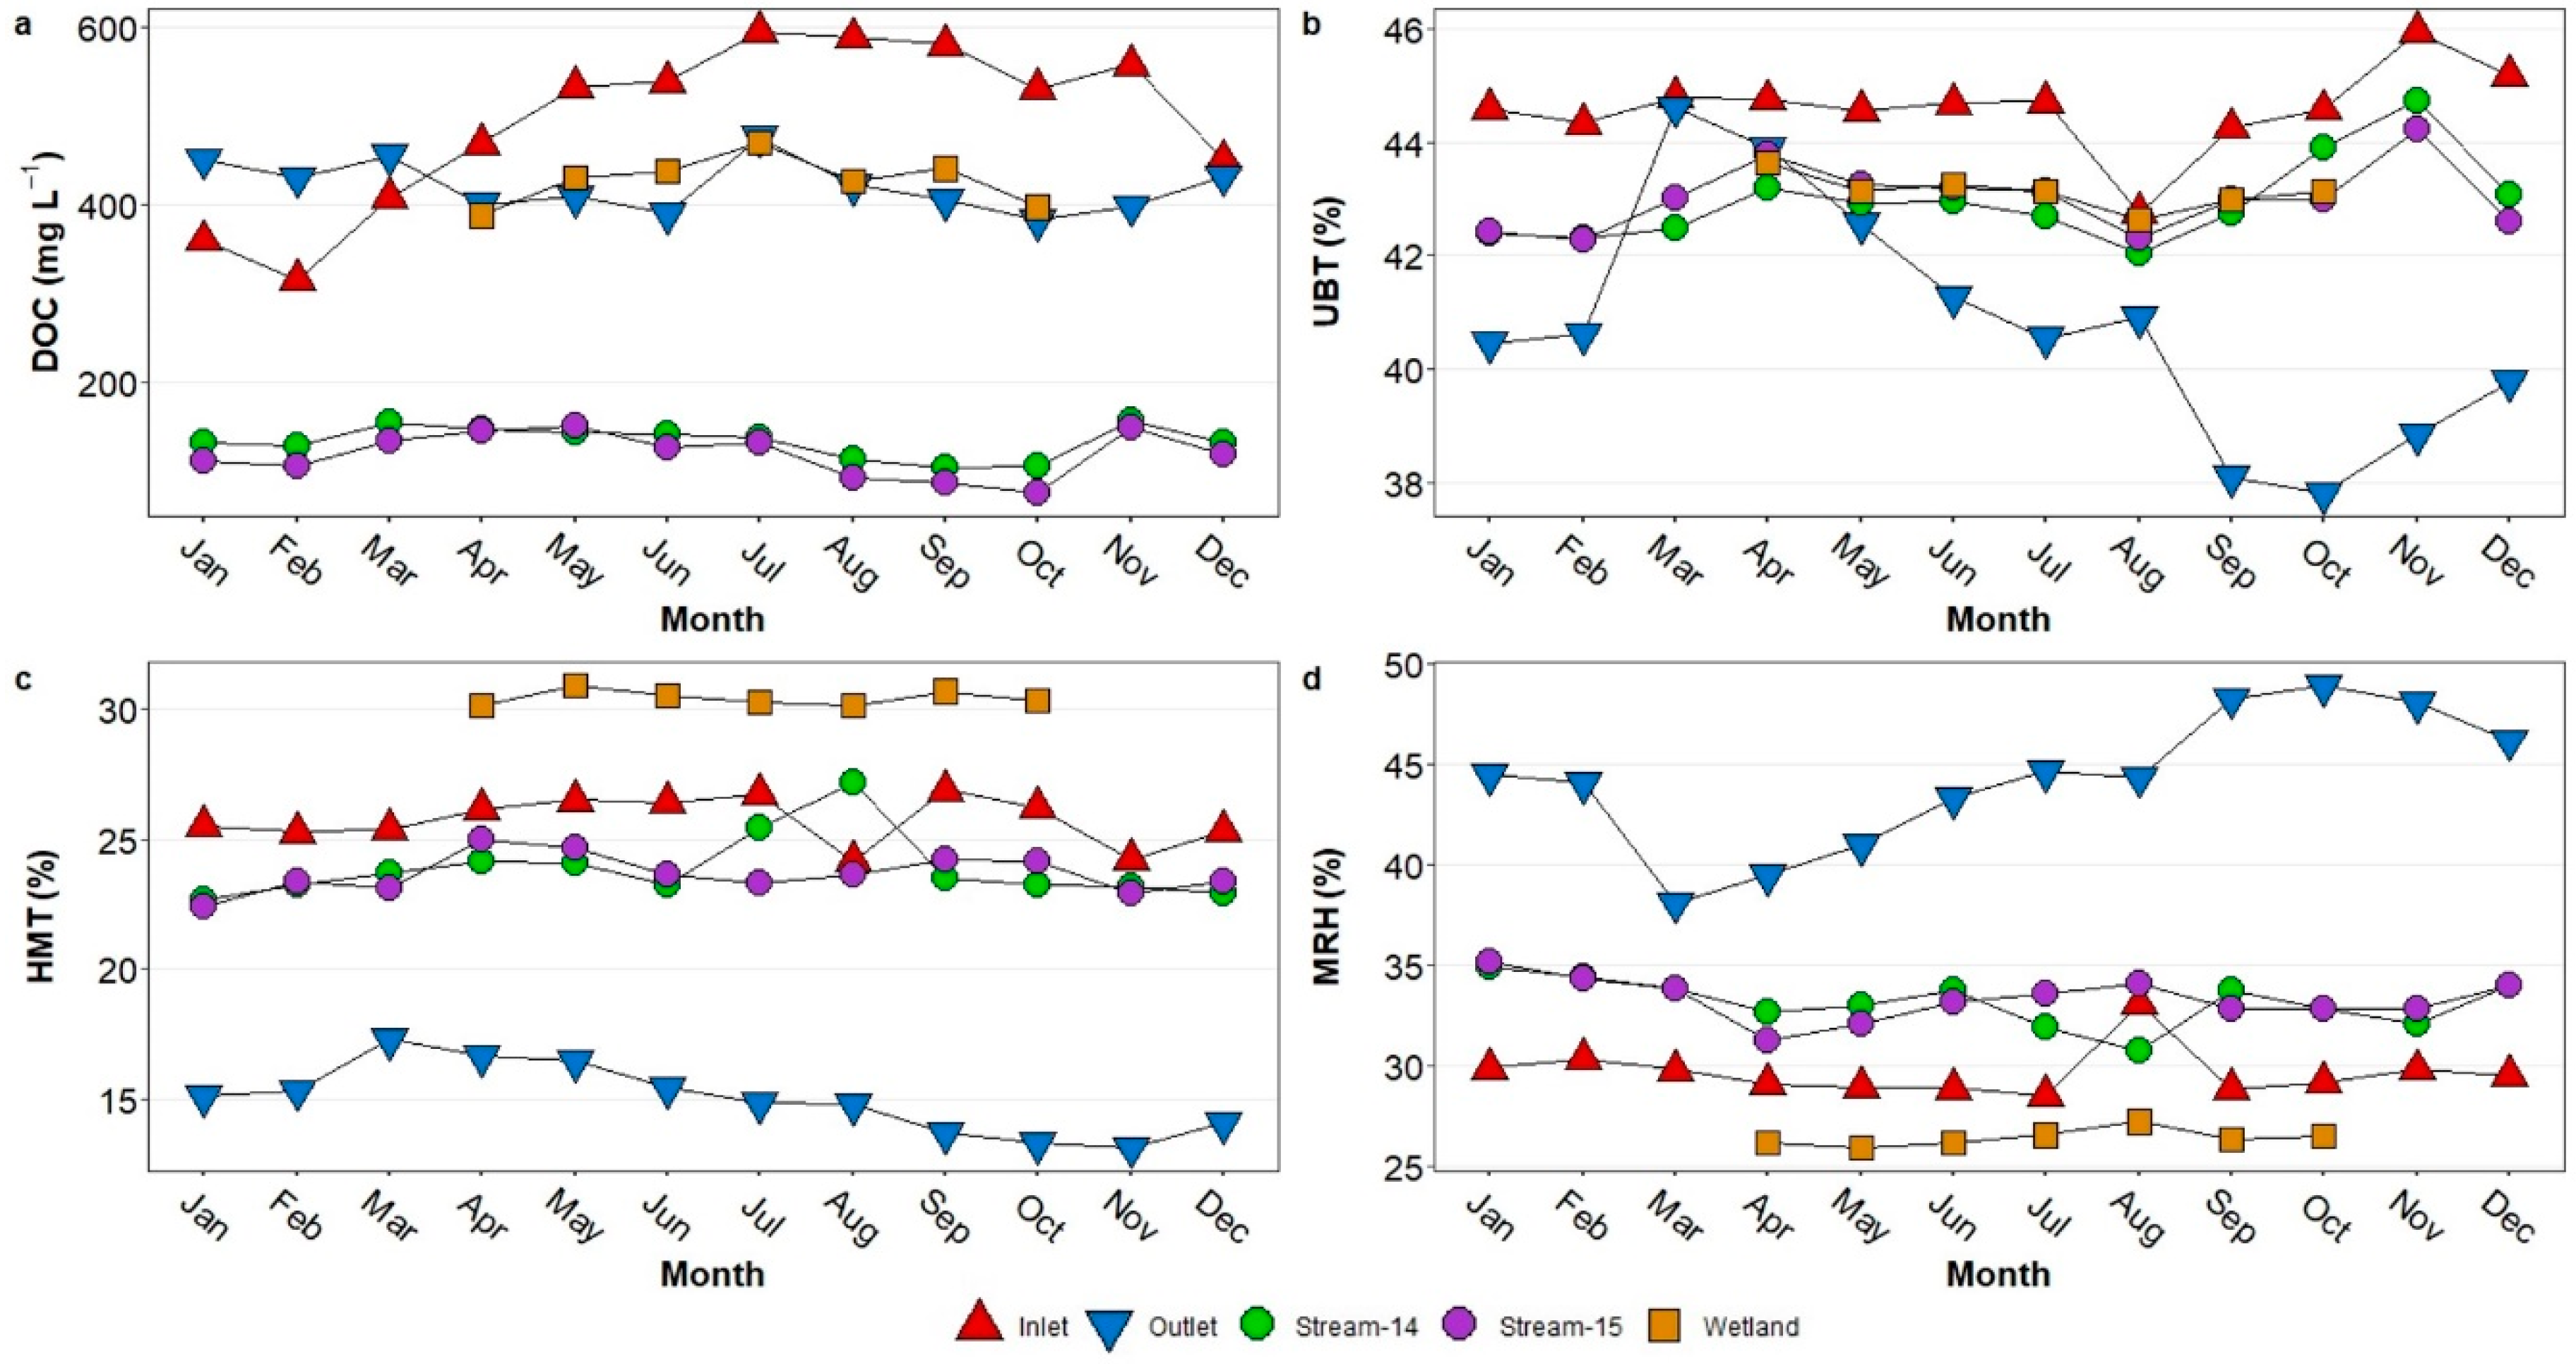
Monthly mean DOC concentrations at the lake inlet nearly doubled between February (3.8 ± 0.1 mg C L−1) and July (7.1 ± 1.1 mg C L−1), while concentrations at the outlet remained more consistent seasonally, albeit also peaking in July (5.7 ± 1.0 mg C L−1). In streams draining from S14 and S15 subwatersheds, there was little observed seasonal change in DOC concentration (Figure 5a, but more variation among DOM fractions.
The ubiquitous terrestrial fraction peaked in November in both subwatershed streams (S14:44.7% ± 0.4%; S15:44.2% ± 0.6%), was well as at the lake inlet (46.0% ± 0.4%; Figure 5b). Coincidentally, ubiquitous terrestrial fraction at the lake outlet was lowest in November (38.9% ± 0.3%) having decreased from a maximum monthly value in March at (44.6% ± 0.3%). There was little seasonal variation in relative percentages of the high molecular weight terrestrial fraction except in the outlet which also decreased from 17.3% ± 0.3% in March to 13.1% ± 0.2% in November (Figure 5c). The stream draining from S14 experienced a spike in the high molecular weight terrestrial fraction in July and August, while the lake inlet experienced a decrease in the same fraction in August. Coinciding with those monthly anomalies, diverging deviations in the microbial reprocessed humic-like fraction, at S14 and the lake inlet, were also observed (Figure 5d). Additionally, at the lake outlet, the microbial reprocessed humic-like fraction increased from a low value in March (38.1% ± 0.3%) to a maximum monthly value in November (48.0% ± 0.1%).

3.5. Principal Component Analysis (PCA)

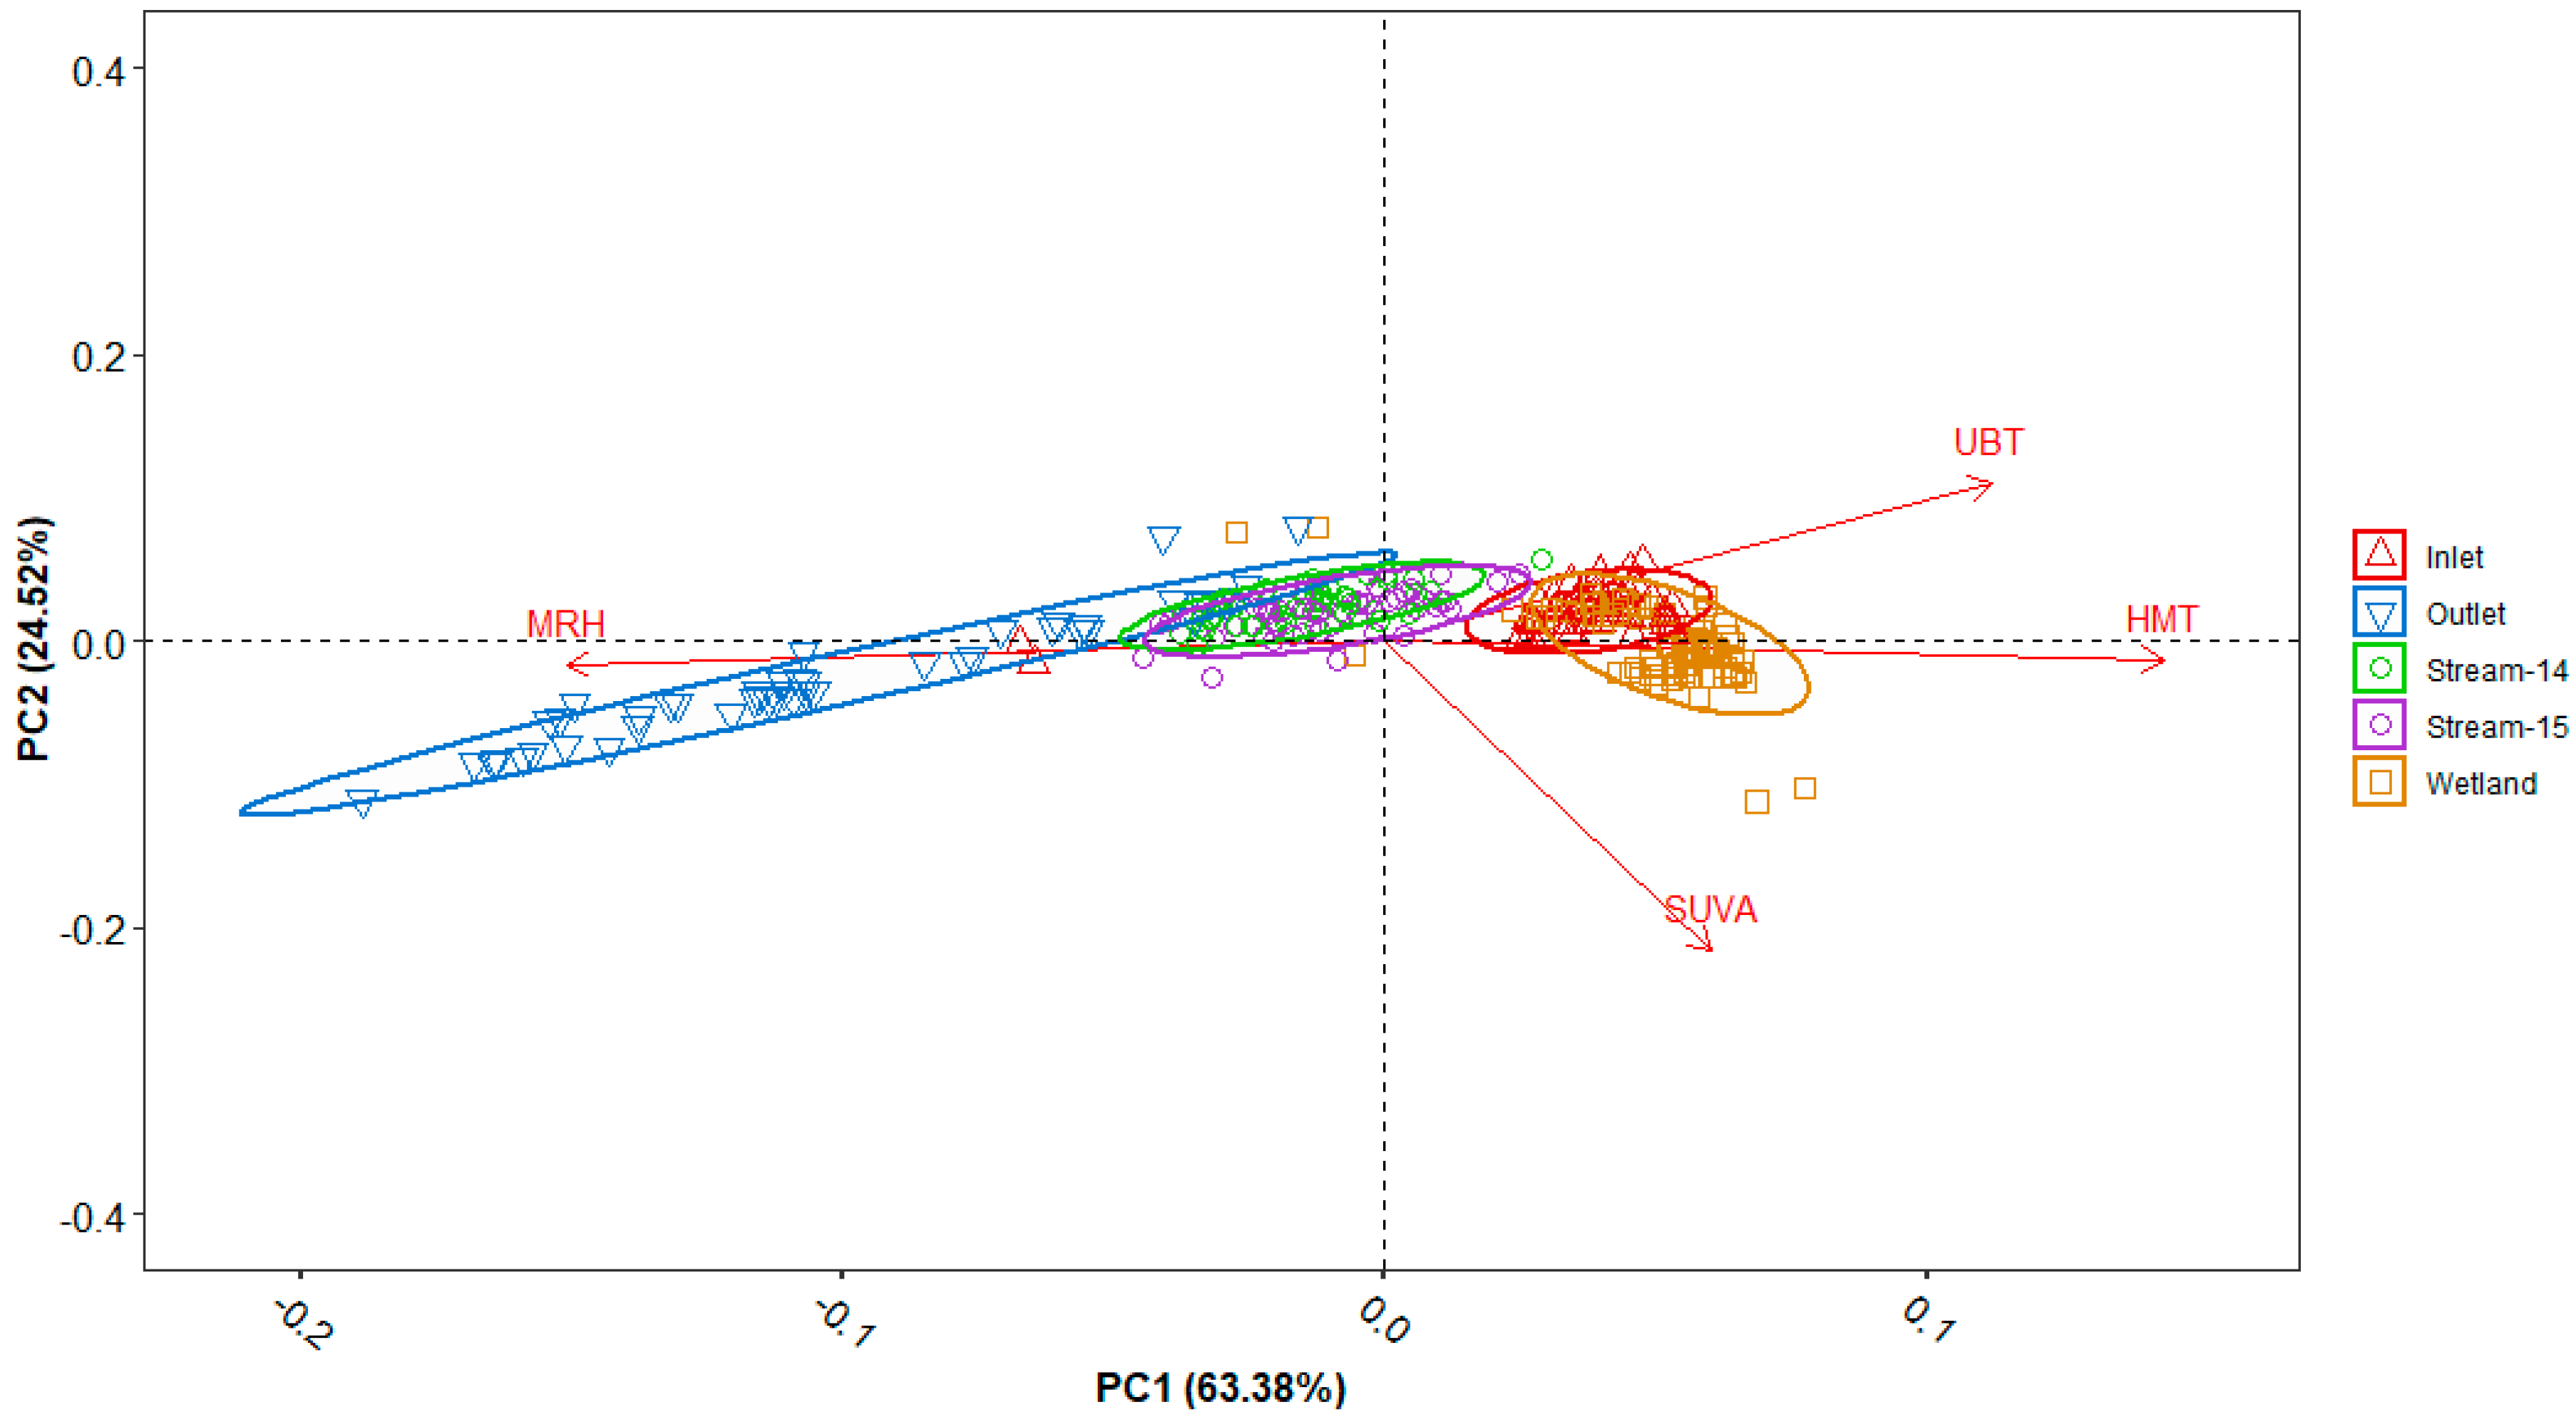
The PCA loadings analysis shows that 64.38% of the model variance is explained by PC1 (Figure 6). The distribution of components along PC1 (X-axis) reveals that microbial reprocessed humic-like DOM is the only component on the negative axis, while SUVA, ubiquitous terrestrial and high molecular weight DOM are positioned on the positive axis (Figure 6). PC2 explains 24.52% of the model variance where the ubiquitous terrestrial component is distributed on the positive axis. The high molecular weight terrestrial and microbial reprocessed humic-like DOM fractions are relatively uninfluenced by PC2, while SUVA is more strongly negative PC2. PCA scores for individual samples reveal spatial patterns as well. Lake outlet samples align strongly with the microbial reprocessed humic-like component, only found within the negative PC1 axis and distributed across PC2 positive and negative axes. The scores for streams draining from S14 and S15 are mostly along the PC1 axis and mostly within positive PC2. PCA scores from these sites are largely distributed around the center of the loadings plot. These values are however more influenced by the microbial reprocessed humic-like components than lake inlet and wetland samples as shown by their more negative PC1 positions (Figure 6). Lake inlet and wetland samples are mostly distributed on the positive PC1 axis. Inlet samples remain in positive PC2, more influenced by the ubiquitous terrestrial fraction. Wetland samples overlap with the inlet but are most influenced by the high molecular weight terrestrial component towards a more positive PC1, as well as a more negative PC2 due to higher SUVA influence.

4. Discussion

4.1. Parafac Component Interpretation

The six fluorescence PARAFAC components identified in this study (Figure 2) are spectrally similar to those identified in other studies, including samples collected from Arctic rivers [43], boreal lakes [44] and drinking water reservoirs [45] (Table 2). Comparisons of the fluorescence character of the components in this study with other investigations can be used to gain insight into the various sources and transformations of DOM as it is transported through watersheds [22]. Although modeled separately, common components emerged between the upland and lake waters. UC1 and LC1 exhibited broad humic-like peaks within the A and C EEM regions [46], typically indicative of unprocessed terrestrially derived OM [44,45]. UC2 and LC3 were spectrally similar with humic-like peaks within the M regions [46]. Unlike the C regions exhibited in UC1 and LC1, the M region is “blue-shifted” towards shorter wavelengths, indicative of terrestrially sources OM that has undergone processing, microbial and/or photolytic [45,46]. UC3 and LC2 were also spectrally similar exhibiting dual excitation peaks, with the highest emission maximum around 510 nm. These more “red-shifted humic-like” OM components have been found in, estuaries [47] and wetlands [48] and associated with vascular plant-derived OM and high lignin phenol concentrations [43].

4.2. Upland Streams

The ubiquitous humic-like component made up the greatest fraction of DOM in streams draining from subwatersheds 14 and 15 (Figure 4). Similar components have been linked to recalcitrant soil organic matter [44,49], which provides some insight into why fractions of this component remained relatively stable seasonally, peaking in November with stream DOC concentrations (Figure 5a,b, potentially due to leachate from leaf senescence [50]. Along with recalcitrant OM, watershed soils imparted additional terrestrially derived, but microbially reprocessed OM into stream waters (Figure 4). Higher values of this DOM fraction are associated with deeper subsoils as OM sorbed to soil is microbially transformed and remobilized [23].
The underlying bedrock at S14 is significantly more base-rich, and ground water contributes more to streamflow than at S15 [30]. However, there was little difference in the overall DOM fractions between the two streams, except for during the months of July and August when the high molecular weight terrestrial fraction significantly increased at S14 (Figure 5c). These high monthly values were driven by outliers on the sample dates of July 28, August 3 and August 9 and are supported by similarly high SUVA values on the same sampling dates, suggesting a short-term influx of highly colored, plant-like organic matter being flushed the subwatershed. Closer examination of the seasonal hydrograph of both streams does not reveal any storm events that could explain this pulse of plant-like organic matter. Comparison to a previous DOM study at the Arbutus Lake watershed suggests that DOC concentrations have decreased in the upland watersheds, but SUVA has increased [31]. Our study found that DOC at S15 had decreased from 1.6 ± 0.8 mg C L−1 in 2011 to 1.4 ± 0.4 mg C L−1, but SUVA increased from 1.9 ± 0.6 L·mg C−1 m−1 in 2011 to 3.1 ± 0.4 L·mg C−1 m−1 [31]. This pattern was mirrored in the stream at S14, where DOC concentrations decreased from 2.0 ± 0.7 mg C L−1 in 2011 to 1.6 ± 0.3 mg C L−1. SUVA increased from 1.8 ± 0.5 L·mg C−1 m−1 in 2011 to from 4.1 ± 5.3 L·mg C−1 m−1 taking the samples from the summer months of July and August into account [31]. Even without the outliers, SUVA at S14 still increased by 1 L·mg C−1 m−1. These observations suggest that there have been subtle shifts in carbon quality draining the forested watersheds. These shifts towards more terrestrial and highly colored forms of organic matter contributing to the “browning” of northeastern lakes [24,25].

4.3. Wetland Drainage

Although only sampled during the growing season (March–November), the wetland exhibited little change in DOM quantity and quality during this period (Figure 5). This consistent contribution is likely due to buffering of DOM by wetland soils as well as leaching from aquatic plants, as both are important sources of DOM in wetlands [48]. Thus, it is not surprising that the ubiquitous terrestrial and high molecular weight components dominated DOM fractions in wetland drainage (Figure 4). The wetland contained the highest fraction of high molecular weight DOM, contributing high concentrations of highly colored, plant-like organic matter to Arbutus Lake as a high fraction of high molecular weight DOM was also observed at the inlet (Figure 4). The ubiquitous terrestrial fraction in the wetland and inlet was similar to more upland stream waters, suggesting the supply of soil DOM is consistent throughout the watershed. The main difference arose in the fractions of plant-like and microbially reprocessed OM (Figure 4). The influence of the wetland on the water quality of Arbutus Lake has been noted in previous studies [30,31]. Our PCA results also support these observations showing significant overlap in PCA scores from both the lake inlet and wetland on the positive PC1 axis and separated by a stronger SUVA and high molecular weight DOM influence on wetland along the PC2 axis (Figure 6). Compared to values measured between 2005–2007 (wetland: 3.3 ± 0.3 L·mg C−1 m−1; inlet: 2.8 ± 0.2 L·mg C−1 m−1 [28]), SUVA has increased at the wetland and lake inlet, however current SUVA values were not significantly different than those reported in 2011 (wetland: 4.4 ± 0.7 L·mg C−1 m−1; inlet: 4.3 ± 0.5 L·mg C−1 m−1) [31]. DOC concentrations have also not changed significantly from 2011 values at the wetland (5.0 ± 1.2 mg C L−1) and lake inlet (5.3 ± 1.7 mg C L−1) [31]. These changes suggest that over time, waters exiting forested watersheds have become more colored and with the wetlands contributing considerable amounts of colored OM to the lake inlet.

4.4. Within-Lake Processing

Diverging seasonal patterns emerged between DOC concentrations at the lake inlet and outlet (Figure 5a,b. The lake inlet experienced increasing DOC concentrations between February and November, but little change in the carbon quality fractions. On the other hand, DOC concentrations at the lake outlet did not appreciably vary seasonally, however there were strong seasonal patterns among DOM components. This pattern suggests that terrestrial DOM sources are driving DOC increases during the growing season as temperatures increase and discharge from the surrounding watershed decreases (Table 1) [31]. Previous observations of decreasing DOC fluxes in the lake between the months of March–November [32] align with patterns of decreasing terrestrial DOM fractions (Figure 5b,c. Concurrently, reprocessed DOM fractions increased substantially during the summer period (Figure 5d). These observations support the role of the lake as a DOM sink [32] and that retention and loss are due largely to microbial decomposition as proposed in previous studies [31]. This speculation is supported by our observations of the microbial reprocessed humic-like component as the overwhelmingly largest fraction of DOM at the Arbutus Lake outlet (Figure 4). In comparison with the lake inlet, a 10% decrease in plant-like OM likely contributed to this increase in the microbial reprocessed humic-like fraction and a previous study found that approximated 10% (0.5 mg C L−1) of the total DOC was microbially decomposed [31].
These observations do not rule out DOM degradation by photolysis. Lignin phenols, the functional groups found in plant-like DOM [43] are aromatic and can be oxidized by photolysis. Low watershed discharge during summer (Table 1) increased the residence time of water and DOM, which lead to greater exposure to UV radiation and the subsequent processing. We observed the highest seasonal SUVA values during the winter (Table A1) at the lake outlet during the ice-cover period, the same period Kang et al. 2016 observed net increases of DOC and DON when compared to the lake inlet [32]. Implications of the photoreactivity of terrestrial OM includes photochemically produced reactive intermediates such as reactive oxygen species which have been found to induce DNA damage in lake zooplankton [27].

4.5. Limitations and Future Work

Weekly sampling produced robust annual dataset for this study, however this strategy failed to capture hydrologic events which could have generated “pulses” of organic matter transported through the surface water system, especially within the upland streams. Although the Archer Creek inlet represents about 45% of the total flow into Arbutus Lake [37], ephemeral streams around lake also contribute, but are not monitored. The trend in increasing SUVA we reported in the upland streams is overshadowed by the significant highly colored terrestrial input by the wetland above the lake inlet. This pattern suggests that we have been underestimating increasing flux of colored organic material into the lake via ephemeral streams, and future work should be conducted on modeling that flux.
Future fluorescence work at this site should also emphasize analysis of freshly collected samples, such as microbial biomass or fresh leaf litter leachate. Most often optical analyses take place within 7 days of collection [49] or are frozen until time of analysis [45]. Our samples were analyzed the summer following collection suggesting some optical degradation had occurred, however significant seasonal and spatial patterns still emerged (Figure 5) lending insights into the nature of DOM at the watershed level.

5. Conclusions

Fractions of DOM components at the Arbutus Lake watershed varied by the different processes enacted upon them, despite a similar terrestrial origin. Upland streams contained low concentrations of DOM, sourced predominantly from surrounding soils as evidenced by high fractions of ubiquitous terrestrial and microbial reprocessed humic-like organic matter. In contrast, the wetland in the lower reaches of the watershed prior to drainage into Arbutus Lake contributed higher fractions of highly aromatic and high molecular weight plant-OM as well as high fractions of ubiquitous terrestrial OM. The lake inlet was most influenced by the wetland containing similarly high SUVA values, DOC concentrations and high molecular weight fractions. Lake processing of organic matter lead to significantly lower fractions of ubiquitous terrestrial and high molecular weight terrestrial fractions when compared to upland surface waters. These differences could explain why one overall DOM model could not be validated for the entire lake-watershed system. The lake outlet also exhibited some of the greatest seasonal changes in carbon fractions as inputs of terrestrial organic matter were processed from highly “colored” and aromatic forms into subsequent byproducts during summer and early fall months. Inputs of highly “colored” terrestrial carbon have also increased over the past 10 to 15 years from the surrounding watershed, especially in upland stream waters.

Author Contributions

Conceptualization, N.A.L., M.M. (Marykate McHale), M.M. (Mario Montesdeoca) and C.T.D.; methodology, N.A.L., M.M. (Mario Montesdeoca), P.M., T.Z.; software, T.Z.; validation, N.A.L.; formal analysis, N.A.L, M.M. (Marykate McHale), P.M.; investigation, N.A.L., M.M. (Marykate McHale), P.M.; resources, C.T.D., T.Z., M.M. (Mario Montesdeoca), P.M.; data curation, N.A.L., M.M. (Marykate McHale); writing—original draft preparation, N.A.L.; writing—review and editing, N.A.L., C.T.D.; visualization, N.A.L.; supervision, C.T.D., M.M. (Mario Montesdeoca); project administration, C.T.D, M.M. (Mario Montesdeoca), P.M.; funding acquisition, C.T.D, M.M. (Mario Montesdeoca), P.M., T.Z. All authors have read and agreed to the published version of the manuscript.

Funding

This work is supported by the National Science Foundation’s Educational Model Program on Water–Energy Research (NSF-EMPOWER) and the New York State Energy Research and Development Authority (NYSERDA).

Acknowledgments

They authors would like to thank Colin Beier for collaboration on projects related to forest soil and surface-water interactions at the Huntington Wildlife Forest, Newcomb, NY.

Conflicts of Interest

The authors declare no conflict of interest.

Appendix A

Table A1. Average seasonal (standard deviation) values for surface water chemistry and carbon quality at the Arbutus Lake watershed.
Season.SpeciesS14S15WetlandInletOutlet
WinterCa2+
(µmol L−1)
740.0 (138.0)266.4 (76.9)153.4 (52.4)161.6 (79.1)
DOC
(mg C L−1)
1.7 (0.4)1.4 (0.4)4.4 (1.1)5.4 (0.2)
SUVA
(L·mg C−1 m−1)
2.9 (0.3)3.2 (0.4)4.2 (0.2)3.6 (0.3)
UBT (%)42.4 (0.4)42.6 (0.6)44.6 (0.4)42.1 (2.1)
HMT (%)23.2 (1.1)23.0 (1.8)25.4 (0.4)16.0 (1.1)
MRH (%)34.4 (1.4)34.4 (2.0330.0 (0.5)41.9 (3.2)
SnowmeltCa2+
(µmol L−1)
637.4 (71.0)174.1 (40.6)131.8 (19.3)110.1 (15.9)104.6 (7.0)
DOC
(mg C L−1)
1.8 (0.1)1.7 (0.2)4.7 (1.0)5.6 (1.1)4.8 (0.4)
SUVA
(L·mg C−1 m−1)
2.6 (0.3)3.0 (0.3)3.9 (0.3)4.3 (0.1)3.8 (0.2)
UBT (%)43.2 (0.7)43.8 (0.4)43.6 (0.6)44.8 (0.4)43.9 (0.8)
HMT (%)24.1 (0.2)25.0 (0.4)30.1 (1.7)26.1 (0.8)16.6 (0.4)
MRH (%)32.7 (0.8)31.3 (0.5)26.2 (1.2)29.1 (0.5)39.5 (1.1)
SpringCa2+
(µmol L−1)
774.7 (66.8)219.5 (70.6)165.2 (23.2)148.1 (24.9)103.7 (11.0)
DOC
(mgl C L−1)
1.7 (0.1)1.6 (0.2)5.2 (1.1)6.4 (0.8)4.8 (0.2)
SUVA
(L·mg C−1 m−1)
2.7 (0.2)3.0 (0.2)4 (0.4)4.3 (0.4)3.6 (0.2)
UBT (%)43.0 (0.4)43.2 (0.3)43.2 (0.5)44.6 (0.3)41.8 (1.1)
HMT (%)23.6 (0.9)24.1 (0.9)30.7 (1.6)26.5 (0.5)15.9 (0.8)
MRH (%)33.4 (0.9)32.7 (1.1)26.1 (1.3)28.9 (0.7)42.3 (1.9)
SummerCa2+
(µmol L−1)
828.8 (69.9)365.6 (99.6)204.0 (25.5)173.5 (14.2)100.5 (2.7)
DOC
(mg C L−1)
1.4 (0.3)1.2 (0.4)5.3 (1.6)7.0 (1.7)5.2 (0.6)
SUVA
(L·mg C−1 m−1)
7.7 (9.6)3.0 (0.3)4.3 (1.3)4.3 (0.7)3.4 (0.5)
UBT (%)42.5 (0.5)42.8 (0.5)42.9 (0.6)43.8 (1.4)39.9 (2.8)
HMT (%)25.5 (4.7)23.7 (0.9)30.4 (2.7)25.8 (2.5)14.5 (1.3)
MRH (%)32.0 (4.7)33.5 (1.0)26.7 (2.5)30.4 (3.8)45.6 (4.1)
FallCa2+
(µmol L−1)
809.5 (74.8)343.2 (120.1)221.9 (21.2)188.1 (47.2)123.2 (27.4)
DOC
(mg C L−1)
1.6 (0.3)1.4 (0.5)4.8 (1.5)6.1 (1.2)4.9 (0.3)
SUVA
(L·mg C−1 m−1)
3.0 (0.2)3.3 (0.4)4.3 (0.5)4.3 (0.2)3.3 (0.3)
UBT (%)43.8 (0.8)43.2 (0.9)43.1 (0.4)45.2 (0.7)38.9 (0.9)
HMT (%)23.1 (1.3)23.5 (1.1)30.3 (2.1)25.3 (1.2)13.6 (0.5)
MRH (%)33.1 (1.5)33.3 (1.5)26.5 (1.8)29.5 (0.8)47.5 (1.3)

References

  1. Driscoll, C.T.; Lawrence, G.B.; Bulger, A.J.; Butler, T.J.; Cronan, C.S.; Eagar, C.; Lambert, K.F.; Likens, G.E.; Stoddard, J.L.; Weathers, K.C. Acidic Deposition in the Northeastern United States: Sources and Inputs, Ecosystem Effects, and Management Strategies. BioScience 2001, 51, 180. [Google Scholar] [CrossRef] [Green Version]
  2. Greaver, T.L.; Sullivan, T.J.; Herrick, J.D.; Barber, M.C.; Baron, J.S.; Cosby, B.J.; Deerhake, M.E.; Dennis, R.L.; Dubois, J.-J.B.; Goodale, C.L.; et al. Ecological Effects of Nitrogen and Sulfur Air Pollution in the US: What Do We Know? Front. Ecol. Environ. 2012, 10, 365–372. [Google Scholar] [CrossRef]
  3. Bailey, S.W.; Hornbeck, J.W.; Driscoll, C.T.; Gaudette, H.E. Calcium Inputs and Transport in A Base-Poor Forest Ecosystem as Interpreted by Sr Isotopes. Water Resour. Res. 1996, 32, 707–719. [Google Scholar] [CrossRef]
  4. Lawrence, G.B.; David, M.B.; Lovett, G.M.; Murdoch, P.S.; Burns, D.A.; Stoddard, J.L.; Baldigo, B.P.; Porter, J.H.; Thompson, A.W. Soil Calcium Status and the Response of Stream Chemistry to Changing Acidic Deposition Rates. Ecol. Appl. 1999, 9, 1059–1072. [Google Scholar] [CrossRef]
  5. Likens, A.G.E.; Driscoll, C.T.; Buso, D.C. Long-Term Effects of Acid Rain Response and Recovery of a Forest Ecosystem. Science 1996, 272, 244–246. [Google Scholar] [CrossRef]
  6. Cronan, C.S.; Schofield, C.L. Relationships between Aqueous Aluminum and Acidic Deposition in Forested Watersheds of North America and Northern Europe. Envrion. Sci. Technol. 1990, 24, 1100–1105. [Google Scholar] [CrossRef]
  7. Hawley, G.J.; Schaberg, P.G.; Eagar, C.; Borer, C.H. Calcium Addition at the Hubbard Brook Experimental Forest Reduced Winter Injury to Red Spruce in a High-Injury Year. Can. J. Forest Res. 2006, 36, 2544–2549. [Google Scholar] [CrossRef]
  8. Kunito, T.; Isomura, I.; Sumi, H.; Park, H.D.; Toda, H.; Otsuka, S.; Nagaoka, K.; Saeki, K.; Senoo, K. Aluminum and Acidity Suppress Microbial Activity and Biomass in Acidic Forest Soils. Soil Biol. Biochem. 2016, 97, 23–30. [Google Scholar] [CrossRef]
  9. Baker, J.P.; Schofield, C.L. Aluminum toxicity to fish in acidic waters. Water Air Soil Pollut. 1982, 18, 289–309. [Google Scholar] [CrossRef]
  10. Li, W.; Johnson, C.E. Relationships among PH, Aluminum Solubility and Aluminum Complexation with Organic Matter in Acid Forest Soils of the Northeastern United States. Geoderma 2016, 271, 234–242. [Google Scholar] [CrossRef]
  11. Tonitto, C.; Goodale, C.L.; Weiss, M.S.; Frey, S.D.; Ollinger, S.V. The Effect of Nitrogen Addition on Soil Organic Matter Dynamics: A Model Analysis of the Harvard Forest Chronic Nitrogen Amendment Study and Soil Carbon Response to Anthropogenic N Deposition. Biogeochemistry 2014, 11, 431–454. [Google Scholar] [CrossRef]
  12. Driscoll, C.T.; Driscoll, K.M.; Fakhraei, H.; Civerolo, K. Long-Term Temporal Trends and Spatial Patterns in the Acid-Base Chemistry of Lakes in the Adirondack Region of New York in Response to Decreases in Acidic Deposition. Atmos. Environ. 2016, 146, 5–14. [Google Scholar] [CrossRef] [Green Version]
  13. Lawrence, G.B.; Shortle, W.C.; David, M.B.; Smith, K.T.; Warby, R.A.F.; Lapenis, A.G. Early Indications of Soil Recovery from Acidic Deposition in U.S. Red Spruce Forests. Soil Sci. Soc. Am. J. 2012, 76, 1407–1417. [Google Scholar] [CrossRef] [Green Version]
  14. Wason, J.W.; Beier, C.M.; Battles, J.J.; Dovciak, M. Acidic Deposition and Climate Warming as Drivers of Tree Growth in High-Elevation Spruce-Fir Forests of the Northeastern US. Front. For. Glob. Chang. 2019, 2, 63. [Google Scholar] [CrossRef] [Green Version]
  15. Kosiba, A.M.; Schaberg, P.G.; Rayback, S.A.; Hawley, G.J. The Surprising Recovery of Red Spruce Growth Shows Links to Decreased Acid Deposition and Elevated Temperature. Sci. Total Environ. 2018, 637–638, 1480–1491. [Google Scholar] [CrossRef]
  16. Baldigo, B.P.; George, S.D.; Lawrence, G.B.; Paul, E.A. Declining Aluminum Toxicity and the Role of Exposure Duration on Brook Trout Mortality in Acidified Streams of the Adirondack Mountains, New York, USA. Environ. Toxicol. Chem. 2020, 39, 623–636. [Google Scholar] [CrossRef] [Green Version]
  17. Monteith, D.T.; Stoddard, J.L.; Evans, C.D.; de Wit, H.A.; Forsius, M.; Høgåsen, T.; Wilander, A.; Skjelkvåle, B.L.; Jeffries, D.S.; Vuorenmaa, J.; et al. Dissolved Organic Carbon Trends Resulting from Changes in Atmospheric Deposition Chemistry. Nature 2007, 450, 537–540. [Google Scholar] [CrossRef]
  18. Fahey, T.J.; Siccama, T.G.; Driscoll, C.T.; Likens, G.E.; Campbell, J.; Johnson, C.E.; Battles, J.J.; Aber, J.D.; Cole, J.J.; Fisk, M.C.; et al. The Biogeochemistry of Carbon at Hubbard Brook. Biogeochemistry 2005, 75, 109–176. [Google Scholar] [CrossRef]
  19. Schmidt, M.W.I.; Torn, M.S.; Abiven, S.; Dittmar, T.; Guggenberger, G.; Janssens, I.A.; Kleber, M.; Kögel-Knabner, I.; Lehmann, J.; Manning, D.A.C.; et al. Persistence of Soil Organic Matter as an Ecosystem Property. Nature 2011, 478, 49–56. [Google Scholar] [CrossRef] [Green Version]
  20. Battin, T.J.; Kaplan, L.A.; Findlay, S.; Hopkinson, C.S.; Marti, E.; Packman, A.I.; Newbold, J.D.; Sabater, F. Biophysical Controls on Organic Carbon Fluxes in Fluvial Networks. Nat. Geosci. 2008, 1, 95–100. [Google Scholar] [CrossRef]
  21. Ussiri, D.A.N.; Johnson, C.E. Characterization of Organic Matter in a Northern Hardwood Forest Soil by 13C NMR Spectroscopy and Chemical Methods. Geoderma 2003, 111, 123–149. [Google Scholar] [CrossRef]
  22. Jaffé, R.; McKnight, D.; Maie, N.; Cory, R.; McDowell, W.H.; Campbell, J.L. Spatial and Temporal Variations in DOM Composition in Ecosystems: The Importance of Long-Term Monitoring of Optical Properties: Variations in DOM Composition in Ecosystems. J. Geophys. Res. Biogeosci. 2008, 113. [Google Scholar] [CrossRef]
  23. Kaiser, K.; Kalbitz, K. Cycling Downwards—Dissolved Organic Matter in Soils. Soil Biol. Biochem. 2012, 52, 29–32. [Google Scholar] [CrossRef]
  24. SanClements, M.D.; Oelsner, G.P.; McKnight, D.M.; Stoddard, J.L.; Nelson, S.J. New Insights into the Source of Decadal Increases of Dissolved Organic Matter in Acid-Sensitive Lakes of the Northeastern United States. Environ. Sci. Technol. 2012, 46, 3212–3219. [Google Scholar] [CrossRef]
  25. Brothers, S.; Köhler, J.; Attermeyer, K.; Grossart, H.P.; Mehner, T.; Meyer, N.; Scharnweber, K.; Hilt, S. A Feedback Loop Links Brownification and Anoxia in a Temperate, Shallow Lake. Limnol. Oceanogr. 2014, 59, 1388–1398. [Google Scholar] [CrossRef]
  26. Solomon, C.T. Dissolved Organic Matter Causes Genetic Damage in Lake Zooplankton via Oxidative Stress. Funct. Ecol. 2017, 31, 806–807. [Google Scholar] [CrossRef] [Green Version]
  27. Williamson, C.E.; Overholt, E.P.; Pilla, R.M.; Leach, T.H.; Brentrup, J.A.; Knoll, L.B.; Mette, E.M.; Moeller, R.E. Ecological Consequences of Long-Term Browning in Lakes. Sci. Rep. 2016, 5. [Google Scholar] [CrossRef] [Green Version]
  28. Dittman, J.A.; Shanley, J.B.; Driscoll, C.T.; Aiken, G.R.; Chalmers, A.T.; Towse, J.E.; Selvendiran, P. Mercury Dynamics in Relation to Dissolved Organic Carbon Concentration and Quality during High Flow Events in Three Northeastern U.S. Streams. Water Resourc. Res. 2010, 46. [Google Scholar] [CrossRef]
  29. Schartup, A.T.; Ndu, U.; Balcom, P.H.; Mason, R.P.; Sunderland, E.M. Contrasting Effects of Marine and Terrestrially Derived Dissolved Organic Matter on Mercury Speciation and Bioavailability in Seawater. Environ. Sci. Technol. 2015, 49, 5965–5972. [Google Scholar] [CrossRef]
  30. Piatek, K.B.; Christopher, S.F.; Mitchell, M.J. Spatial and Temporal Dynamics of Stream Chemistry in a Forested Watershed. Hydrol. Earth Syst. Sci. 2009, 13, 423–439. [Google Scholar] [CrossRef] [Green Version]
  31. Kang, P.G.; Mitchell, M.J. Bioavailability and Size-Fraction of Dissolved Organic Carbon, Nitrogen, and Sulfur at the Arbutus Lake Watershed, Adirondack Mountains, NY. Biogeochemistry 2013, 115, 213–234. [Google Scholar] [CrossRef]
  32. Kang, P.G.; Mitchell, M.J.; McHale, P.J.; Driscoll, C.T.; Inamdar, S.; Park, J.-H. Importance of Within-Lake Processes in Affecting the Dynamics of Dissolved Organic Carbon and Dissolved Organic and Inorganic Nitrogen in an Adirondack Forested Lake/Watershed. Biogeosciences 2016, 13, 2787–2801. [Google Scholar] [CrossRef] [Green Version]
  33. Murphy, K.R.; Stedmon, C.A.; Graeber, D.; Bro, R. Fluorescence Spectroscopy and Multi-Way Techniques. PARAFAC. Anal. Methods 2013, 5, 6557. [Google Scholar] [CrossRef] [Green Version]
  34. Stedmon, C.A.; Bro, R.; Colin, A. Stedmon and Rasmus Bro. Characterizing Dissolved Organic Matter Fluorescence with Parallel Factor Analysis: A Tutorial. Limnol. Oceanogr. Methods 2008, 6, 572–579. [Google Scholar] [CrossRef]
  35. Park, J.H.; Mitchell, M.J.; Driscoll, C.T. Winter-Time Climatic Control on Dissolved Organic Carbon Export and Surface Water Chemistry in an Adirondack Forested Watershed. Environ. Sci. Technol. 2005, 39, 6993–6998. [Google Scholar] [CrossRef]
  36. New York State Energy Research and Development Authority (NYSERDA). Importance of Acidic and Mercury Deposition in Relation to Climate Change in the Adirondack Mountains: Biogeochemical Responses. N. Y. Stat Energy Res. Dev. Auth. Rep. 2015, 15-04s, 9. [Google Scholar]
  37. McHale, M.R.; Mitchell, M.J.; McDonnel, J.J.; Cirmo, C.P. Nitrogen Solutes in an Adirondack Forested Watershed: Importance of Dissolved Organic Nitrogen. Biogeochemistry 2000, 48, 165–184. [Google Scholar] [CrossRef]
  38. Bischoff, J.M.; Bukaveckas, P.; Mitchell, M.J.; Hurd, T. N Storage and Cycling in Vegetation of a Forested Wetland: Implications for Watershed N Processing. Water Air Soil Pollut. 2001, 128, 97–114. [Google Scholar] [CrossRef]
  39. Owen, J.S.; Mitchell, M.J.; Michener, R.H. Stable Nitrogen and Carbon Isotopic Composition of Seston and Sediment in Two Adirondack Lakes. Can. J. Fish. Aquat. Sci. 1999, 56, 2186–2192. [Google Scholar] [CrossRef]
  40. Driscoll, C.T.; van Dreason, R. Seasonal and long-term temporal patterns in the chemistry of Adirondack Lakes. Water Air Soil Pollut. 1993, 67, 319–344. [Google Scholar] [CrossRef]
  41. Weishaar, J.L.; Aiken, G.R.; Bergamaschi, B.A.; Fram, M.S.; Fujii, R.; Mopper, K. Evaluation of Specific Ultraviolet Absorbance as an Indicator of the Chemical Composition and Reactivity of Dissolved Organic Carbon. Environ. Sci. Technol. 2003, 37, 4702–4708. [Google Scholar] [CrossRef] [PubMed]
  42. Duan, W.; He, B.; Nover, D.; Yang, G.; Chen, W.; Meng, H.; Zou, S.; Liu, C. Water Quality Assessment and Pollution Source Identification of the Eastern Poyang Lake Basin Using Multivariate Statistical Methods. Sustainability 2016, 8, 133. [Google Scholar] [CrossRef] [Green Version]
  43. Walker, S.A.; Amon, R.M.W.; Stedmon, C.A. Variations in High-Latitude Riverine Fluorescent Dissolved Organic Matter: A Comparison of Large Arctic Rivers: FDOM in Large Arctic Rivers. J. Geophys. Res. Biogeosci. 2013, 118, 1689–1702. [Google Scholar] [CrossRef]
  44. Kothawala, D.N.; von Wachenfeldt, E.; Koehler, B.; Tranvik, L.J. Selective Loss and Preservation of Lake Water Dissolved Organic Matter Fluorescence during Long-Term Dark Incubations. Sci. Total Environ. 2012, 433, 238–246. [Google Scholar] [CrossRef]
  45. Shutova, Y.; Baker, A.; Bridgeman, J.; Henderson, R.K. Spectroscopic Characterization of Dissolved Organic Matter Changes in Drinking Water Treatment: From PARAFAC Analysis to Online Monitoring Wavelengths. Water Res. 2014, 54, 159–169. [Google Scholar] [CrossRef]
  46. Coble, P.G. Characterization of Marine and Terrestrial DOM in Seawater Using Excitation-Emission Matrix Spectroscopy. Mar. Chem. 1996, 51, 325–346. [Google Scholar] [CrossRef]
  47. Santín, C.; Yamashita, Y.; Otero, X.L.; Álvarez, M.Á.; Jaffé, R. Characterizing Humic Substances from Estuarine Soils and Sediments by Excitation-Emission Matrix Spectroscopy and Parallel Factor Analysis. Biogeochemistry 2009, 96, 131–147. [Google Scholar] [CrossRef]
  48. Yamashita, Y.; Scinto, L.J.; Maie, N.; Jaffé, R. Dissolved Organic Matter Characteristics Across a Subtropical Wetland’s Landscape: Application of Optical Properties in the Assessment of Environmental Dynamics. Ecosystems 2010, 13, 1006–1019. [Google Scholar] [CrossRef]
  49. Yamashita, Y.; Kloeppel, B.D.; Knoepp, J.; Zausen, G.L.; Jaffé, R. Effects of Watershed History on Dissolved Organic Matter Characteristics in Headwater Streams. Ecosystems 2011, 14, 1110–1122. [Google Scholar] [CrossRef]
  50. Cawley, K.M.; Campbell, J.; Zwilling, M.; Jaffé, R. Evaluation of Forest Disturbance Legacy Effects on Dissolved Organic Matter Characteristics in Streams at the Hubbard Brook Experimental Forest, New Hampshire. Aquat. Sci. 2014, 76, 611–622. [Google Scholar] [CrossRef]
Figure 1. Site map showing the location of surface waters in the Arbutus Lake watershed, Huntington Wildlife Forest, New York.
Soilsystems 04 00050 g001
Figure 2. Excitation (dashed lines) versus emission (solid lines) loadings for the upland (UC1–UC3) and lake (LC1–LC3) parallel factor analysis (PARAFAC) models.
Soilsystems 04 00050 g002
Figure 3. Relationship between specific ultraviolet absorbance (SUVA) and dissolved organic carbon (DOC) at the Arbutus Lake watershed. Three SUVA values > 20 L·mg C−1 m−1 from Summer 2017 are not included in this plot.
Soilsystems 04 00050 g003
Figure 4. Distribution of mean (+ standard deviation) of DOM component fractions (HMT—high molecular weight terrestrial; UBT—ubiquitous terrestrial; MRH—microbial reprocessed humic-like materials) in surface waters at the Arbutus Lake watershed.
Soilsystems 04 00050 g004
Figure 5. Average monthly values for (a) DOC (mg C L−1); (b) ubiquitous terrestrial (UBT%); (c) high molecular weight terrestrial (HMT%); (d) microbial reprocessed humic-like (MRH%) in surface waters at the Arbutus Lake watershed.
Soilsystems 04 00050 g005
Figure 6. PCA loadings plot and identification similar PARAFAC components overlaid with PCA scores from surface waters at the Arbutus Lake watershed. Confidence ellipses were drawn based on the multivariate t-distribution.
Soilsystems 04 00050 g006
Table 1. Seasonal precipitation in mm yr−1 (% total cumulative) and discharge in mm yr−1 (% Table 2016. October 2017.
Season.Dates IncludedPrecipitationInletOutlet
FallNov ’16 – Dec ’16, Oct ‘17260.9(22%)126.6(15%)120.6(15%)
WinterJan ’17 – Mar ‘17296.9(24%)237.8(28%)195.8(25%)
SnowmeltApr ‘1794.8(8%)194.9(23%)169.2(22%)
SpringMay ’17 – Jun ‘17289.3(24%)171.6(20%)172.5(22%)
SummerJuly ’17 – Sep ‘17272.2(22%)132.1(15%)128.7(16%)
TotalNov ’16 – Oct ‘171214.2 863.0 786.8
Table 2. PARAFAC modeled DOM component properties, peak classification, sourcing and references to other studies reporting comparable peaks.
PARAFAC ComponentEx. Max (nm)Em. Max (nm)Traditional Classification (Peaks)Walker et al. 2013Shutova et al. 2013Kothawala et al. 2012SourcingDescription
UC1265 (345)455A+CC1C1AllochthonousHumic-like
UC2275 (400)510C3AllochthonousHigh Molecular Weight
UC3315405MC2C2AllochthonousHumic-like; reprocessed
LC1265 (365)465A+CC2C1AllochthonousHumic-like
LC2310425MC1C2AllochthonousHumic-like; reprocessed
LC3280 (420)510C3AllochthonousHigh Molecular Weight