Potassium and Metal Release Related to Glaucony Dissolution in Soils


Abstract
1. Introduction
2. Mineralogy of Glaucony
3. Materials and Methods
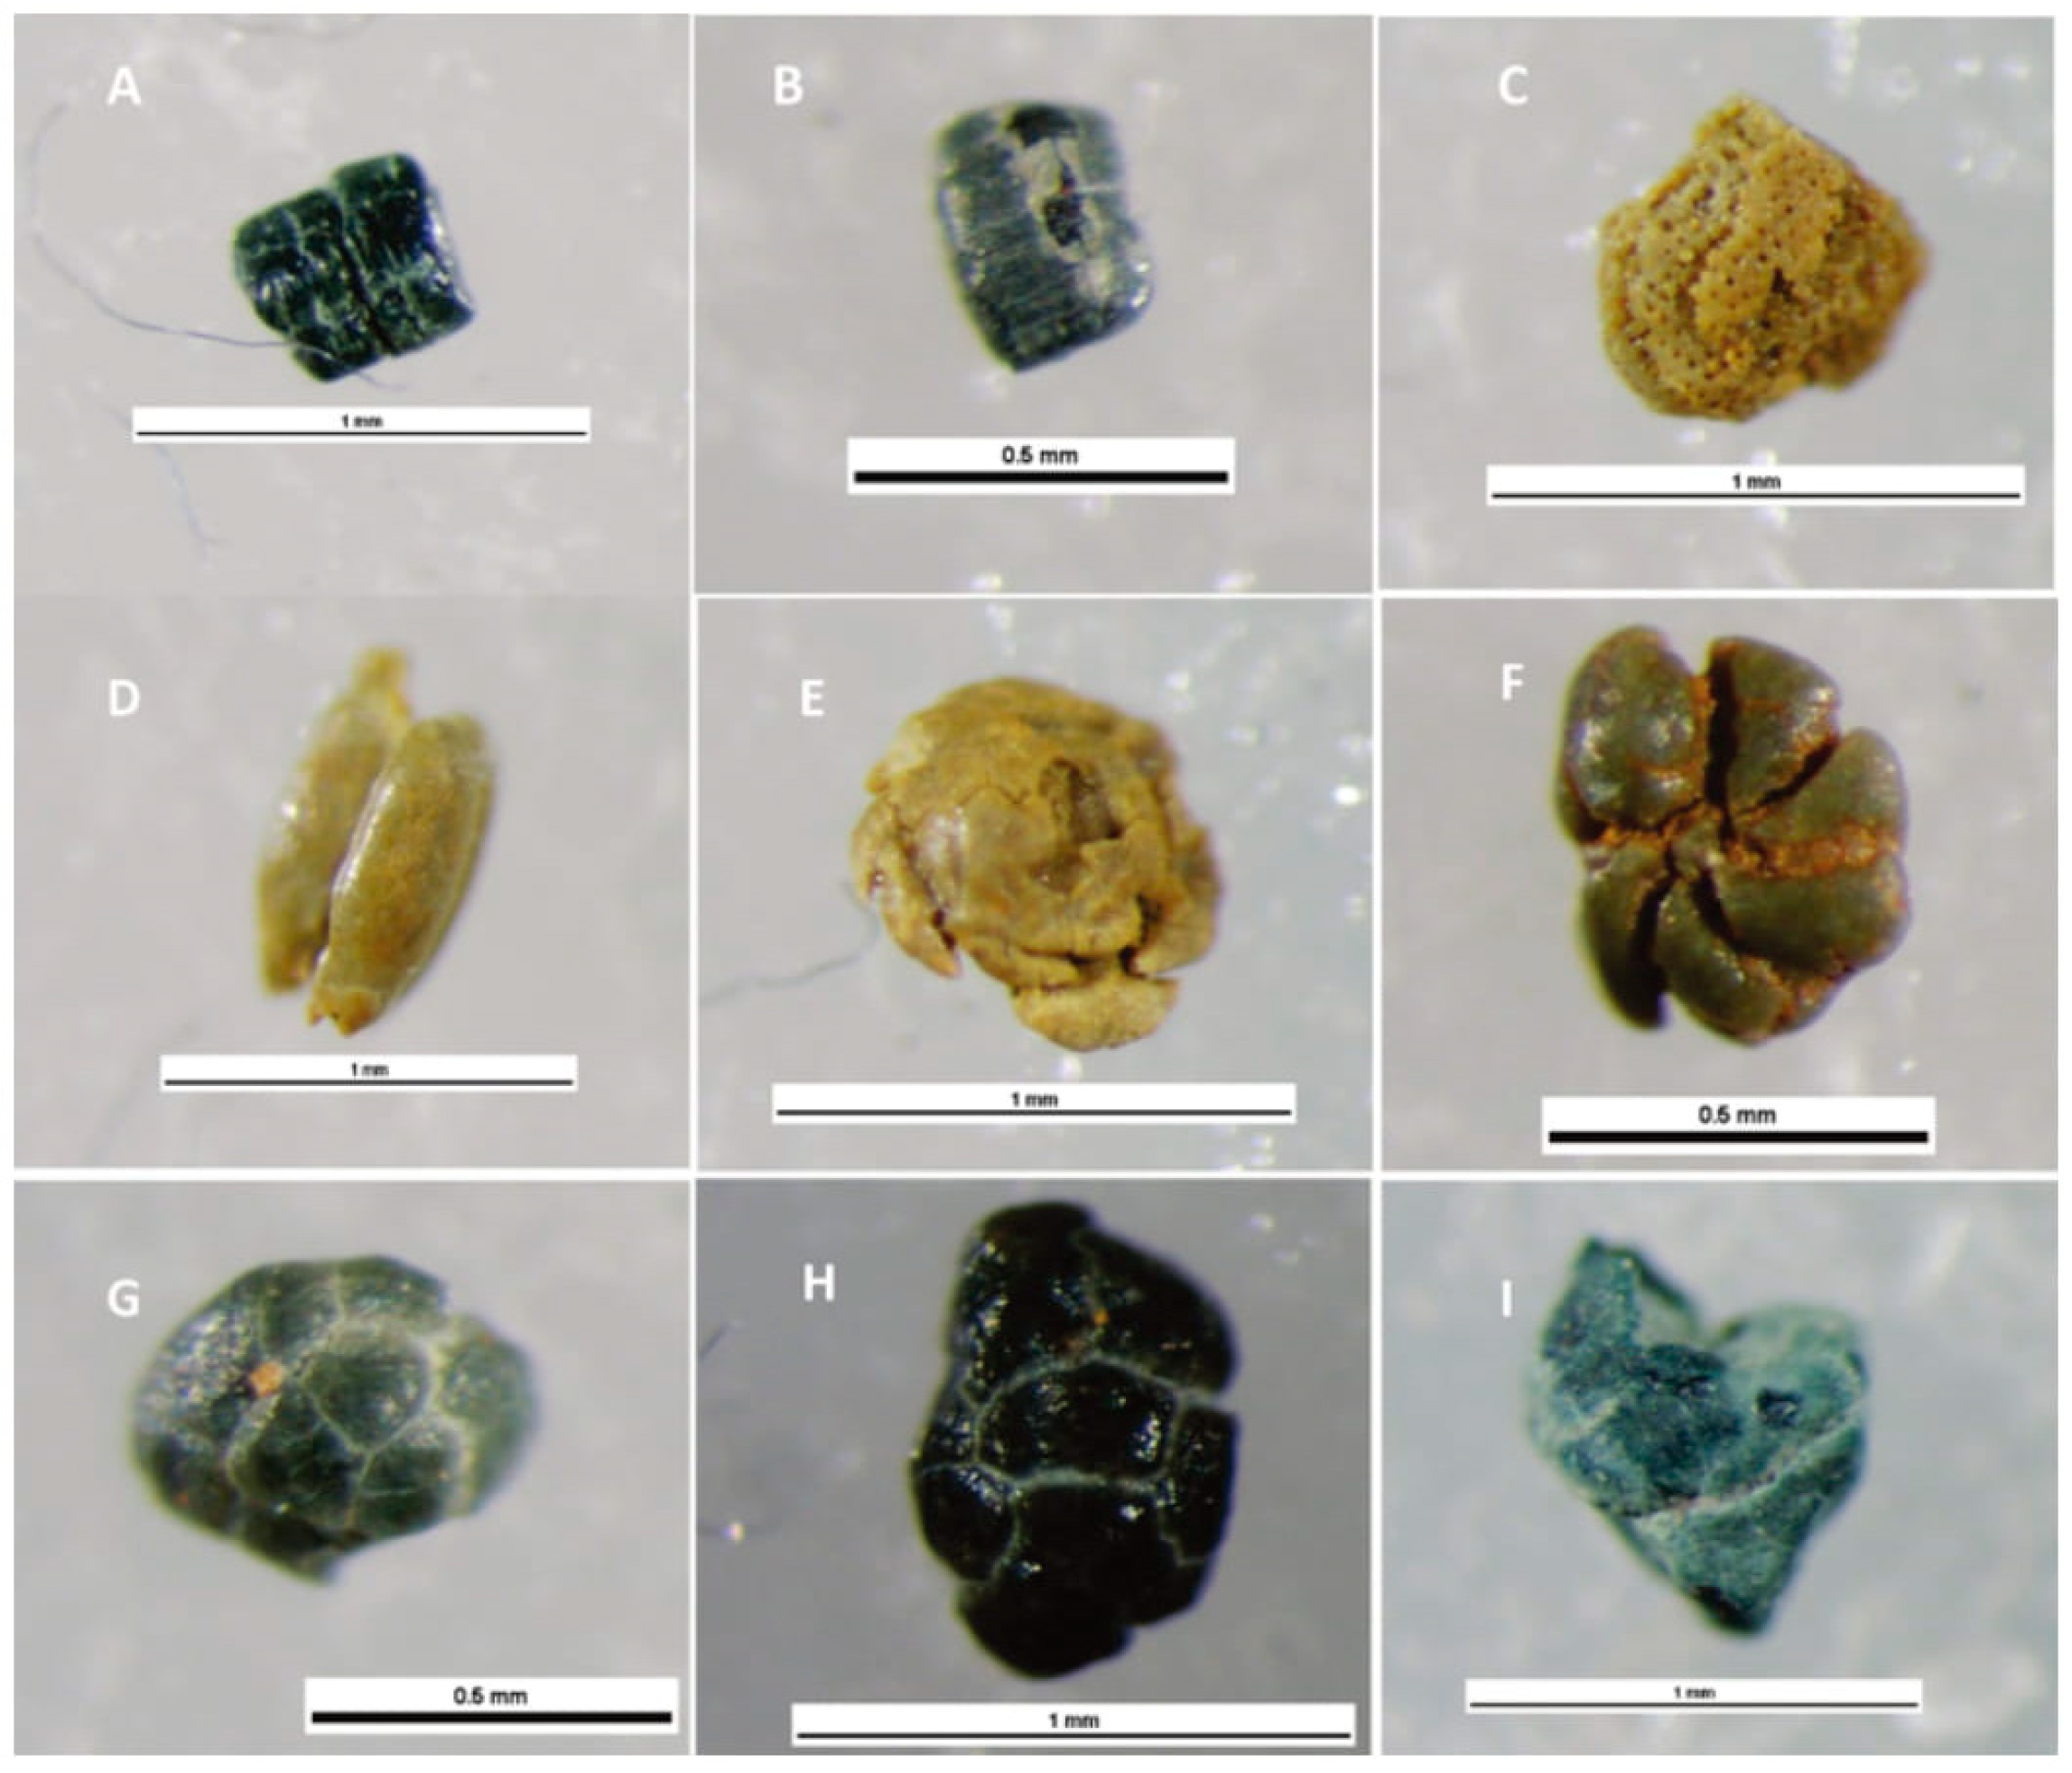
3.1. Field Work and Sample Collection
3.2. Sample Preparation
3.3. LA-ICP-MS
3.4. SEM with EDS
3.5. Solubility Analysis
Experiment 1
Experiment 2
4. Results
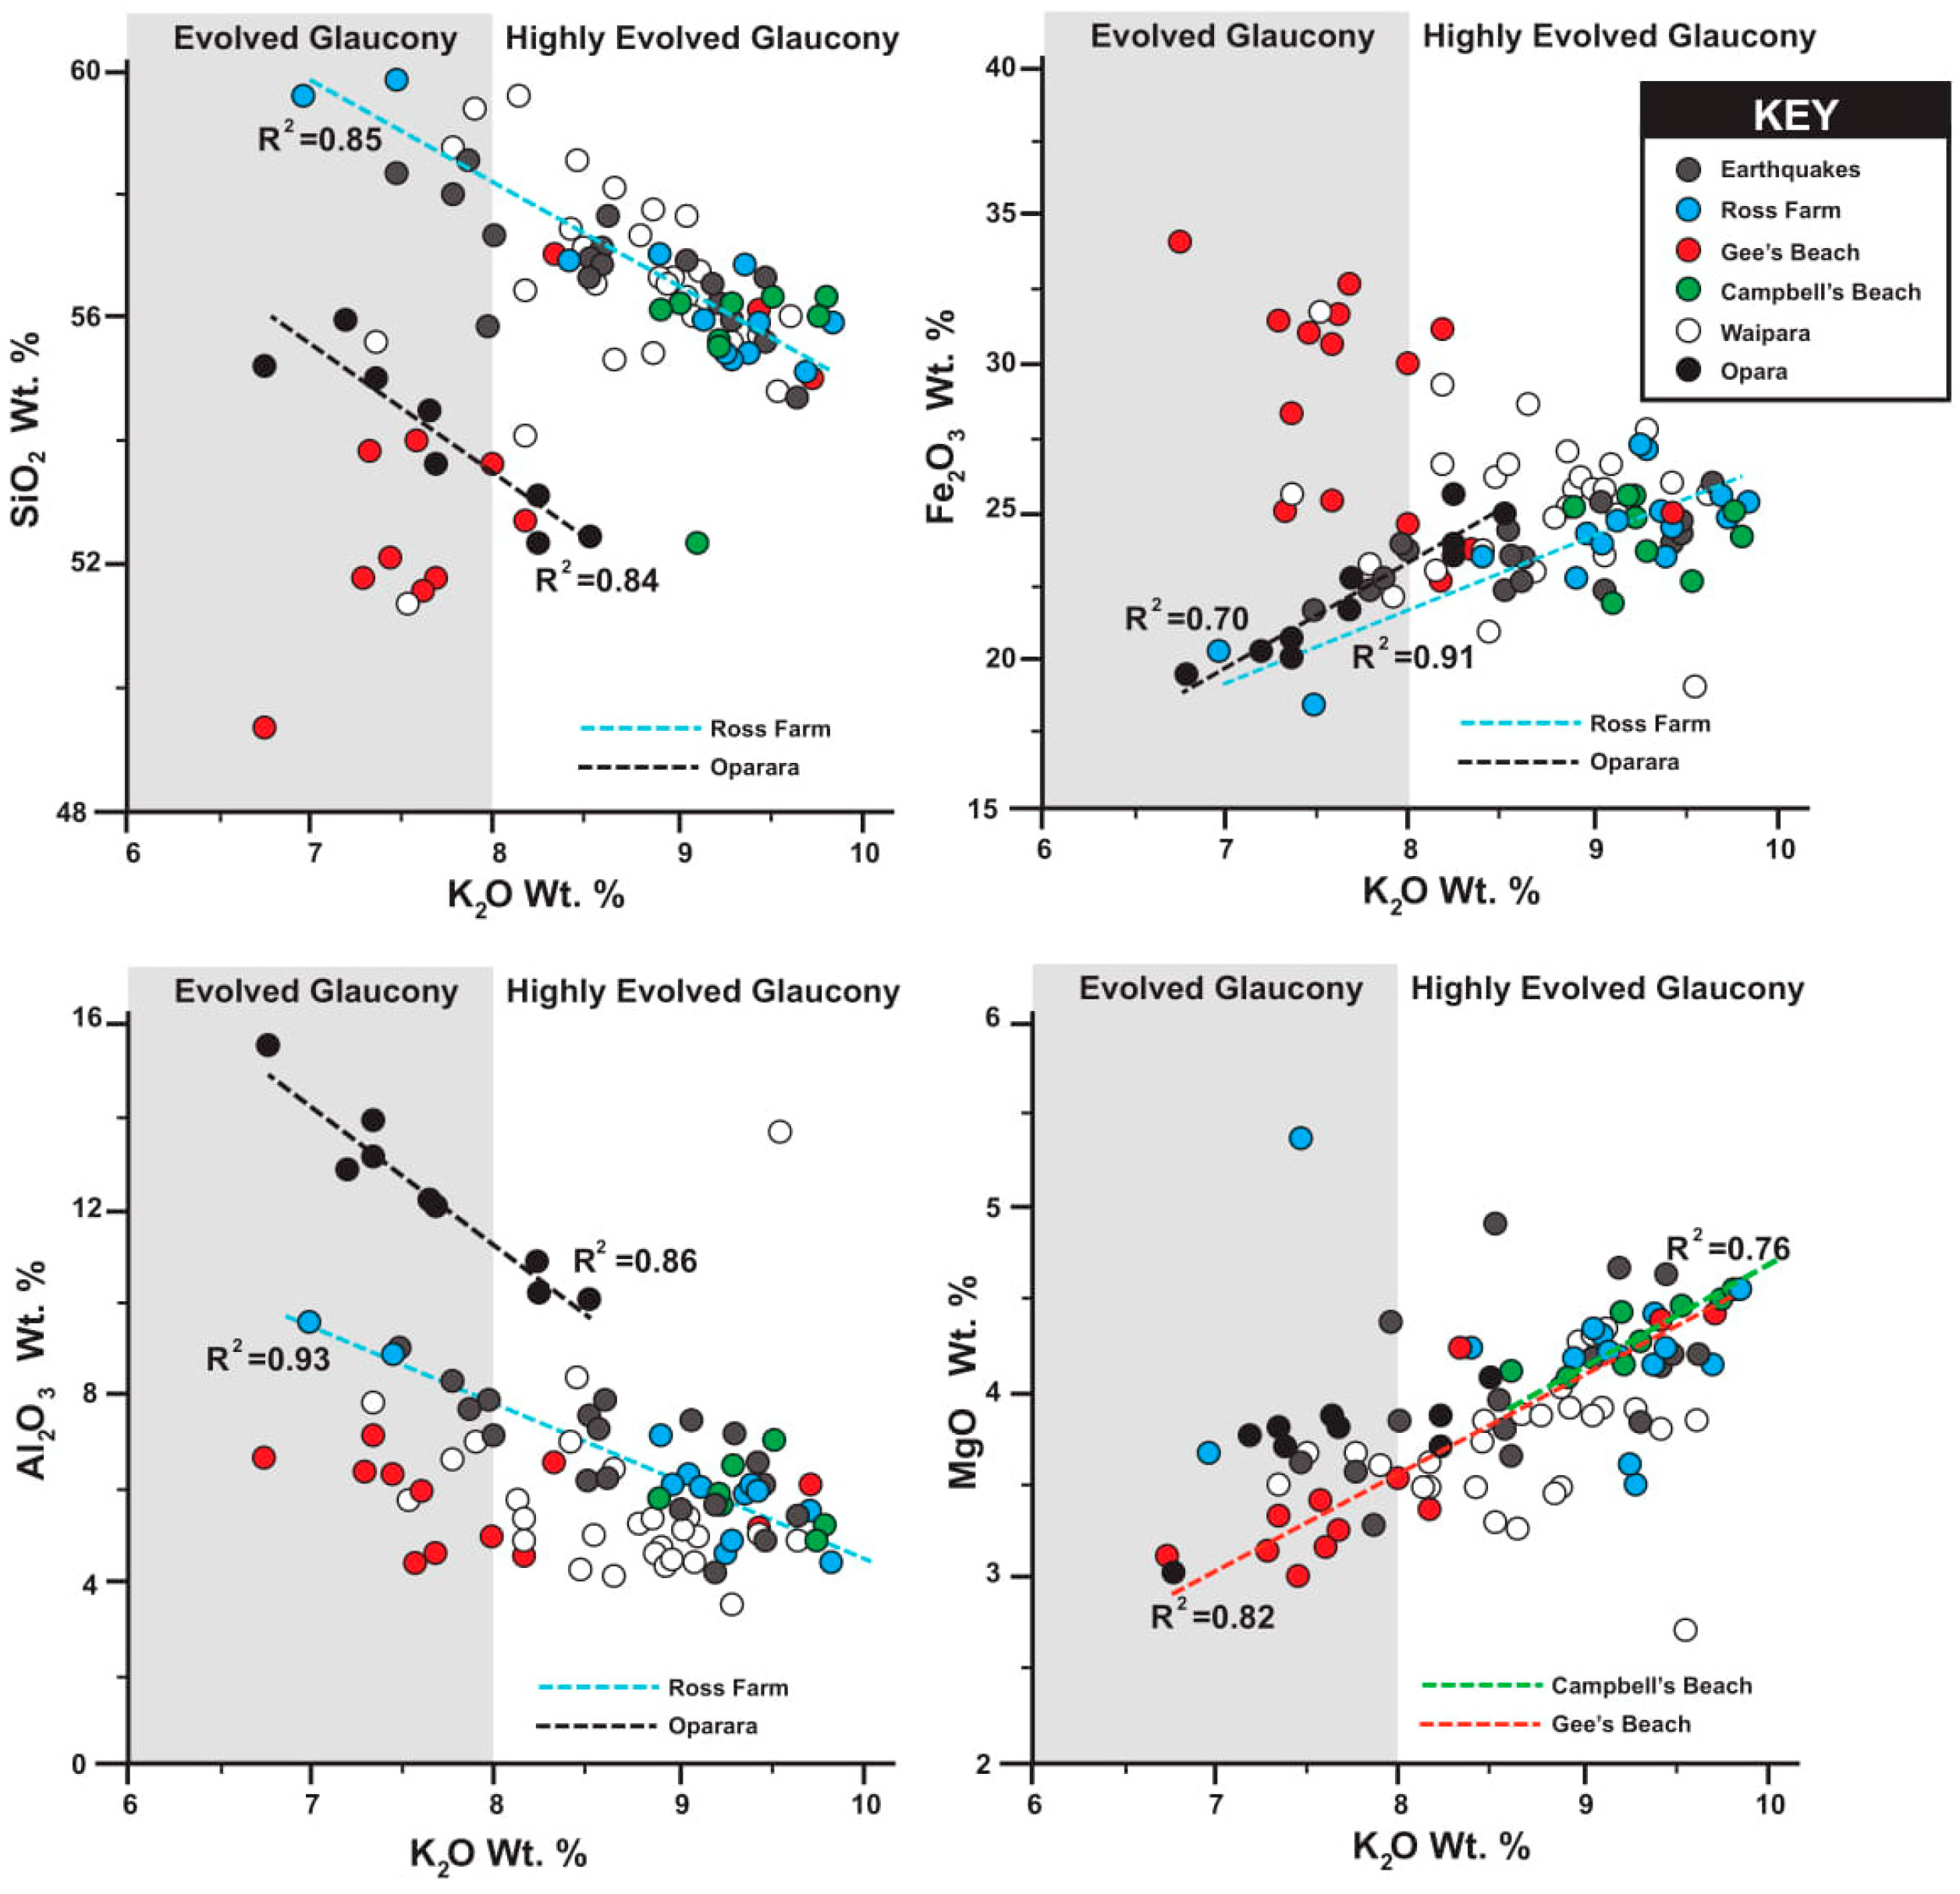
4.1. Major Elements
4.2. Trace Elements
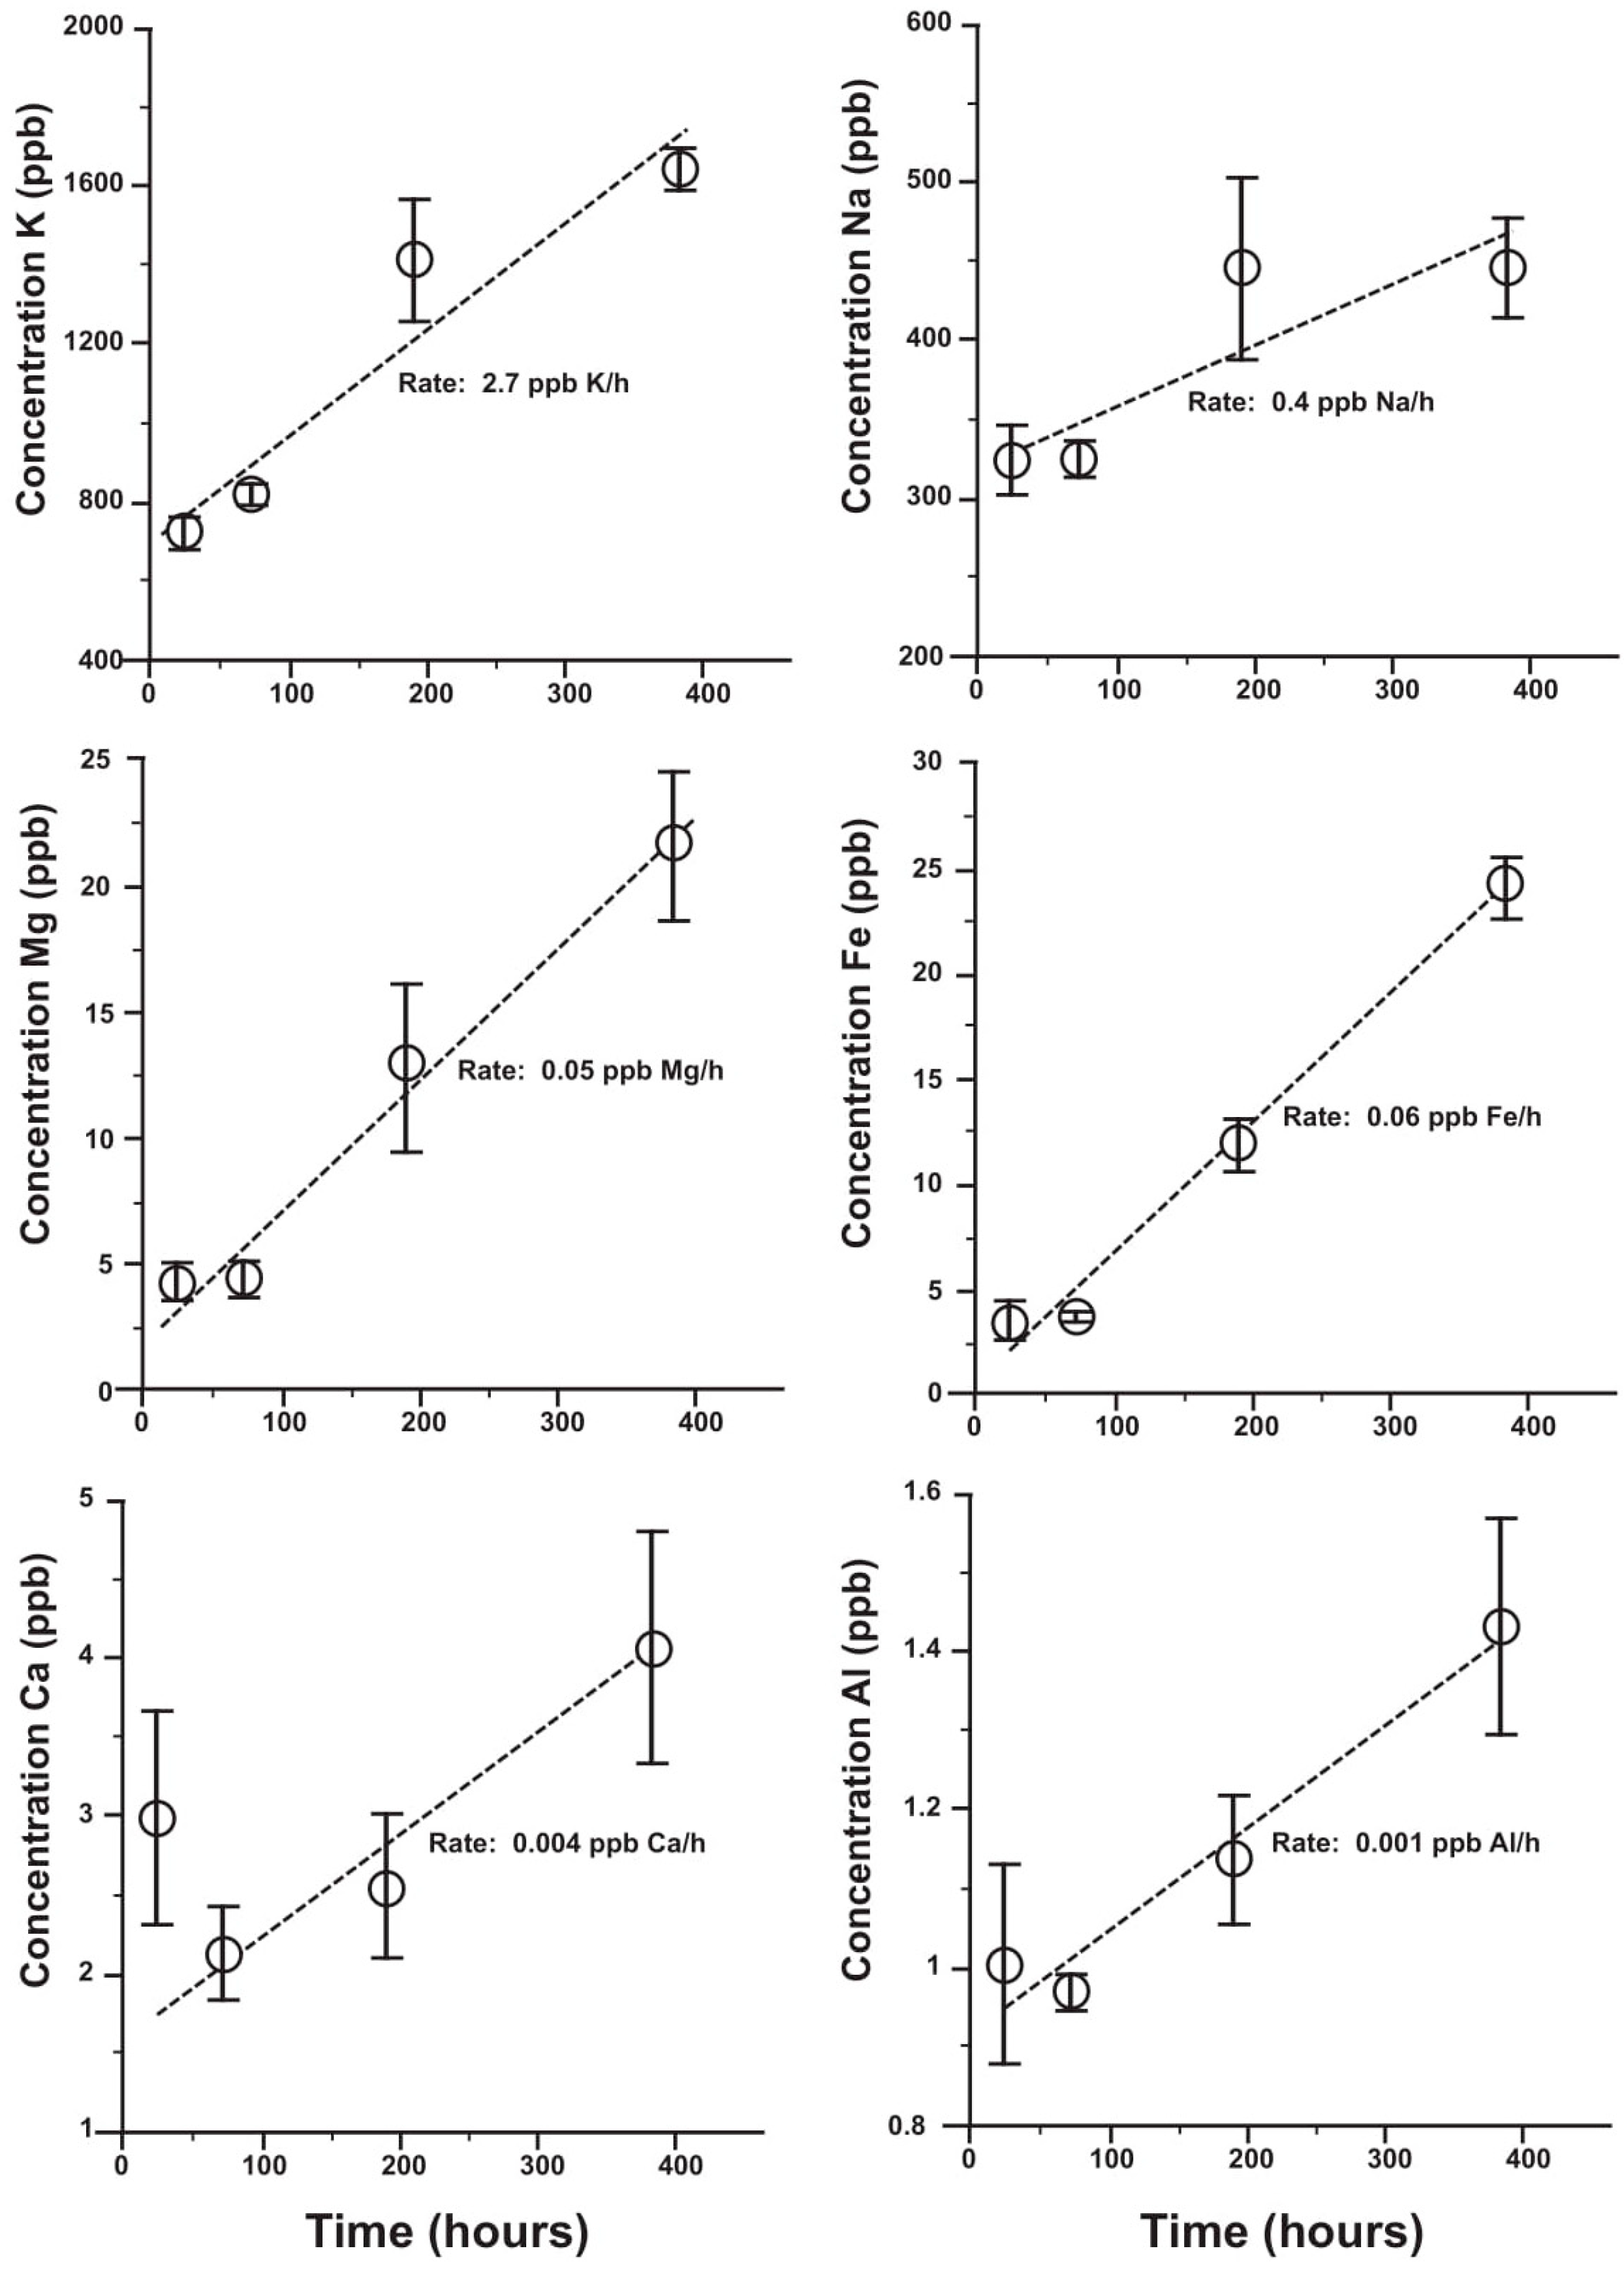
4.3. Solubility of Glaucony
4.3.1. Experiment 1—No Birnessite at pH 3.7
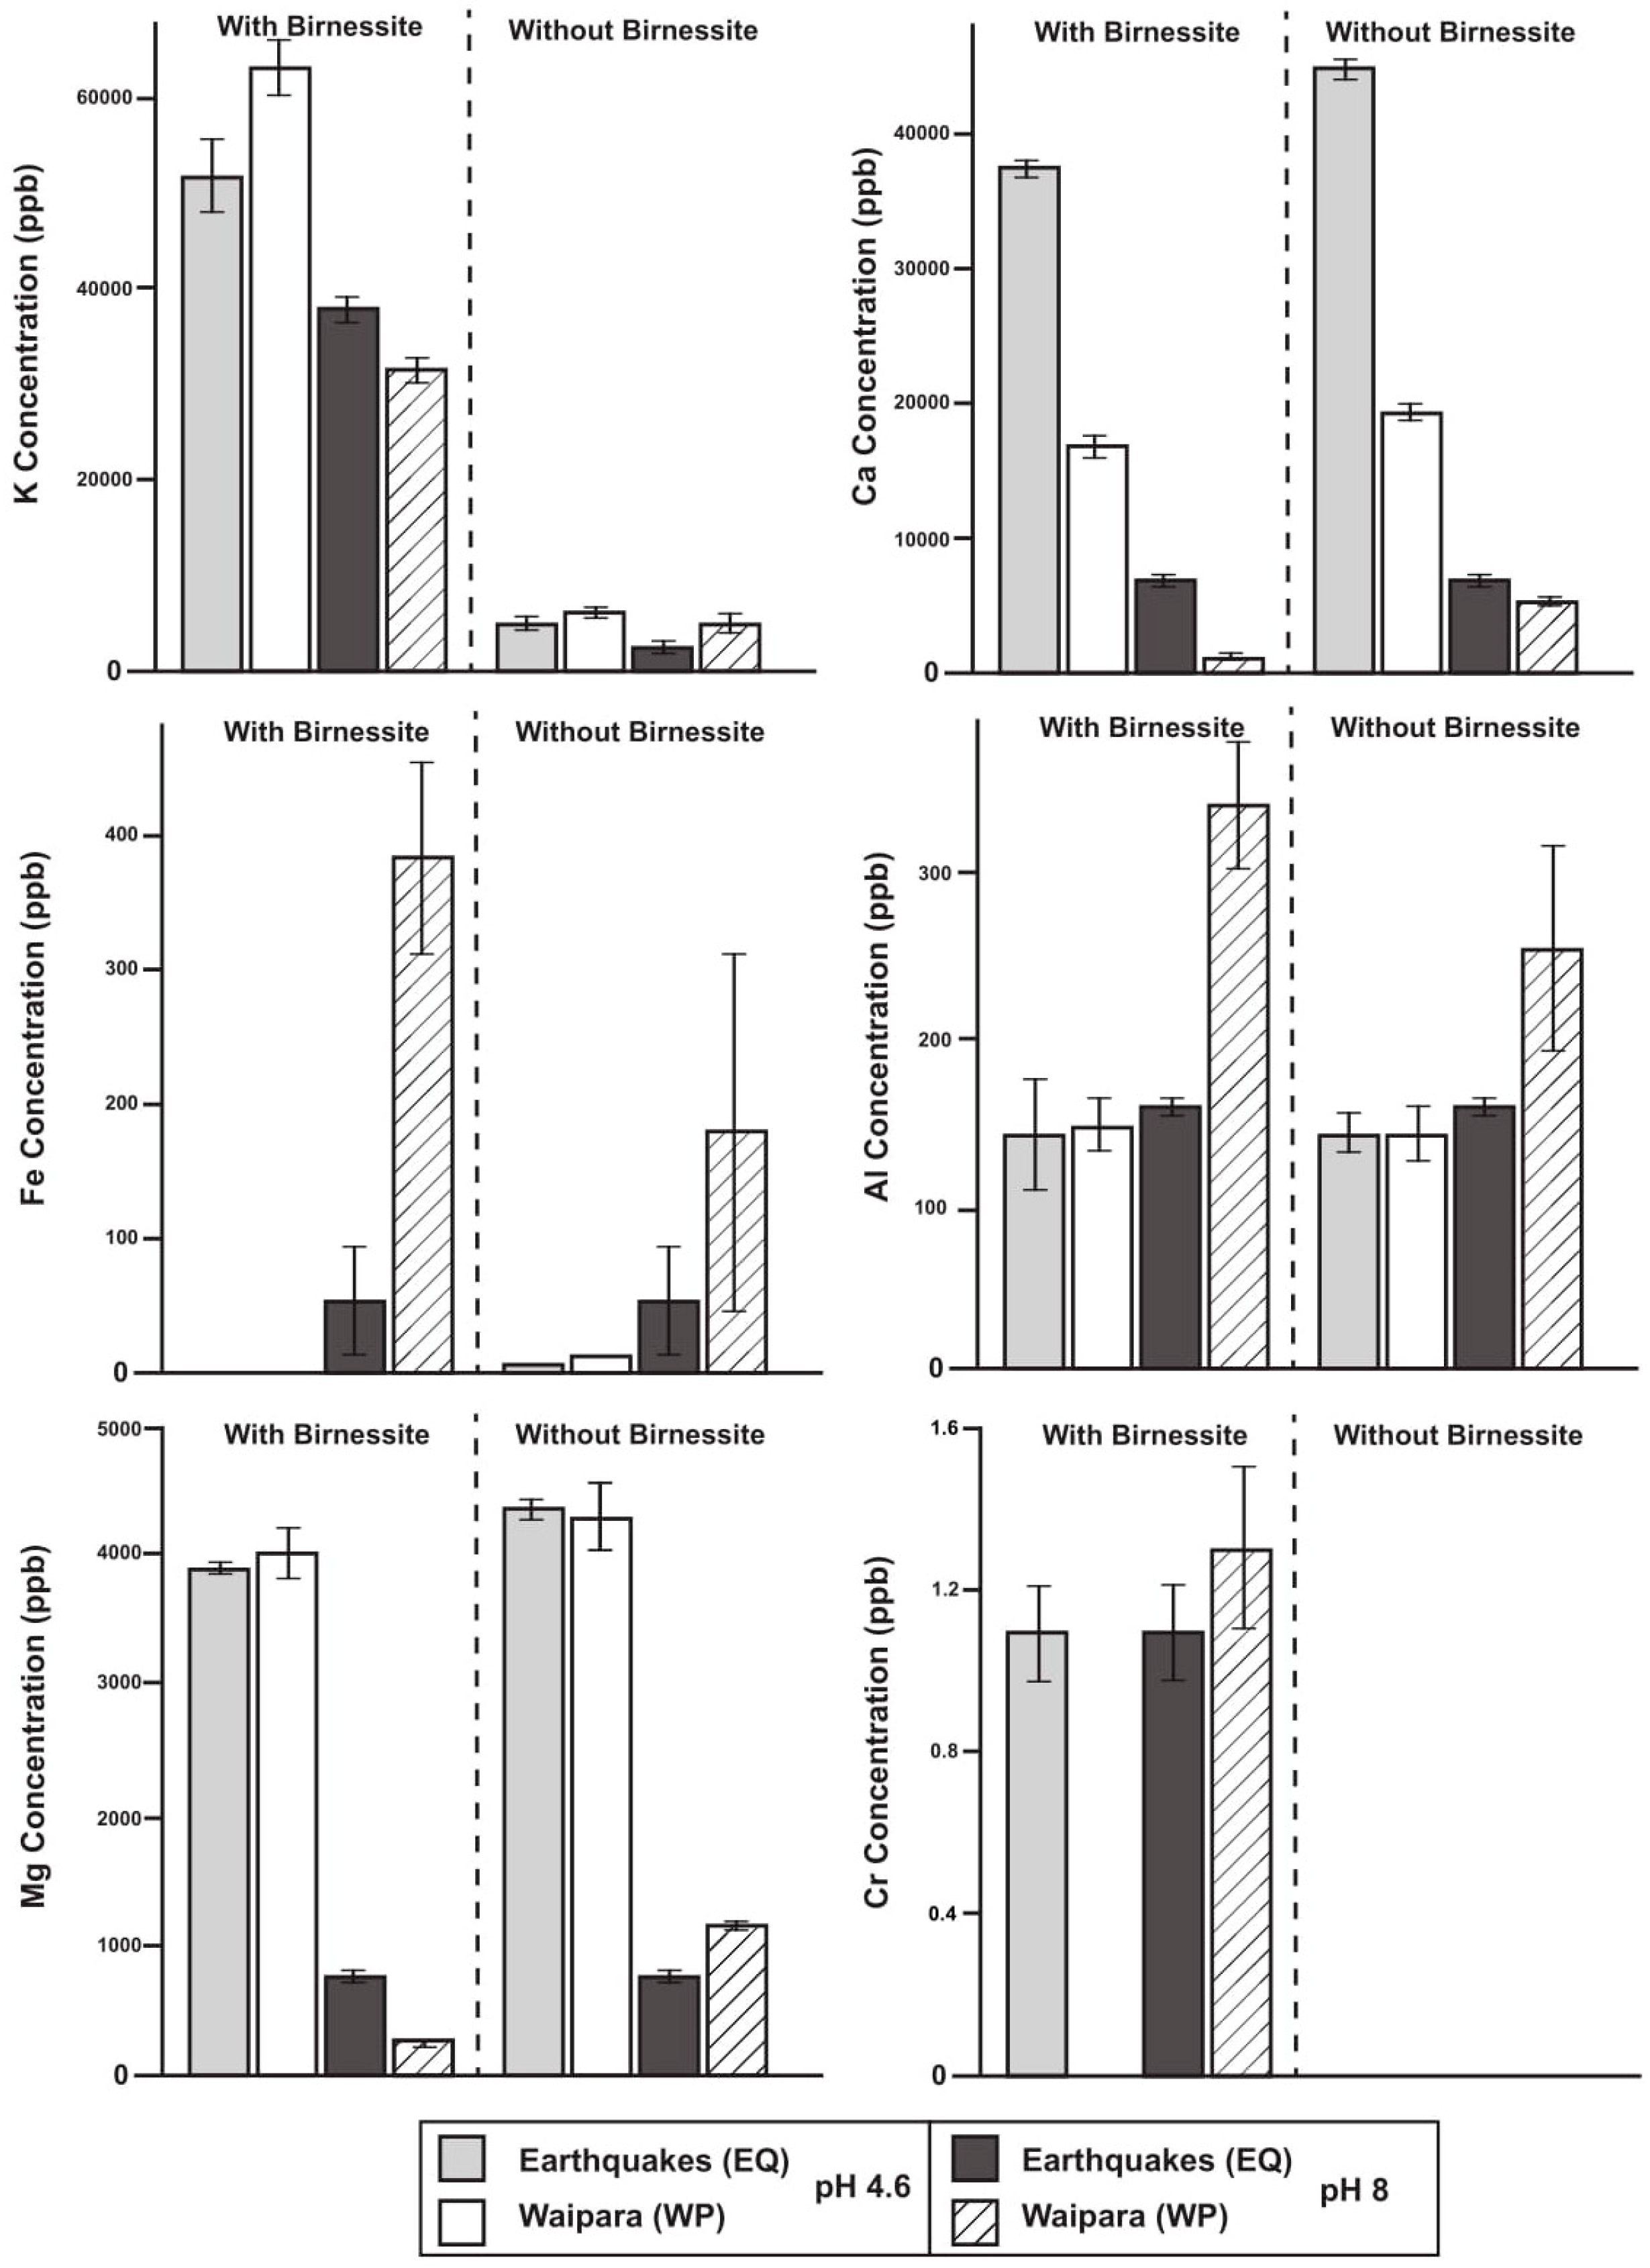
4.3.2. Experiment 2—With and Without Birnessite at pHs 4.6 and 8
5. Discussion
5.1. Glauconite Abundance and Geochemistry in Context to Paleoenvironment
5.2. Glaucony as a Source of Soil K and Fertilizer Resource
5.3. Chromium in Glauconitic Minerals: Contaminant or Micronutrient?
6. Conclusions
Author Contributions
Funding
Acknowledgments
Conflicts of Interest
References
- McLaren, R.G.; Cameron, K.C. Soil Science: An Introduction to the Properties and Management of New Zealand Soils; Oxford University Press: Auckland, New Zealand, 1990; p. 312. [Google Scholar]
- Karimi, E.; Abdolzadeh, A.; Sadeghipour, H.R.; Aminei, A. The potential of glauconitic sandstone as a potassium fertilizer for olive plants. Arch. Agron. Soil Sci. 2012, 58, 983–993. [Google Scholar] [CrossRef]
- Zorb, C.; Senbayram, M.; Peiter, E. Potassium in agriculture—Status and perspectives. J. Plant Physiol. 2014, 17, 656–659. [Google Scholar] [CrossRef] [PubMed]
- Sparks, D.L. Potassium Dynamics in Soils. In Proceedings of the Advances in Soil Science; Stewart, B.A., Ed.; Springer: New York, NY, USA, 1987; pp. 1–63. [Google Scholar]
- Sparks, D.L.; Huang, P.M. Physical Chemistry of Soil Potassium; CRC Press: Boca Raton, FL, USA, 1985. [Google Scholar]
- Rao, C.S.; Srinivas, K. Potassium dynamics and role of non-exchangeable potassium in crop nutrition. Indian J. Fertil. 2017, 13, 80–94. [Google Scholar]
- Sparks, D.L. Bioavailability of soil potassium. In Handbook of Soil Science; CRC Press: Boca Raton, FL, USA, 2000. [Google Scholar]
- Fixen, P.E.; Johnston, A.M. World fertilser nutrient reserves: A view to the future. J. Sci. Food Agric. 2011, 92, 1001–1005. [Google Scholar] [CrossRef] [PubMed]
- Heffer, P.; Prud, M. Fertilizer Outlook 2014–2018. In Proceedings of the 82nd IFA Annual Conference, Sydney, Australia, 26–28 May 2014. [Google Scholar]
- Dooley, J.H. Comprehensive chemistry of select greensand from the New Jersey coastal plain. In New Jersey Geological Survey Technical Memo; Rutgers, The State University of New Jersey: Camden, NJ, USA, 1998. [Google Scholar]
- Banerjee, S.; Chattoraj, S.L.; Saraswati, P.K.; Dasgupta, S.; Sarkar, U. Substrate control on formation and maturation of glauconites in the Middle Eocene Harudi Formation, western Kutch, India. Mar. Pet. Geol. 2012, 30, 144–160. [Google Scholar] [CrossRef]
- Doepel, J.J.G. Exploration Target Report, Dinner Hill Potash Deposit, Dandaragan Project, Western Australia; Potash West Technical Reports; Encanto Potash Corporation: Vancouver, BC, Canada, 2013. [Google Scholar]
- Seed, D.P. Studies of the Solid State—The Mineralogy and Environments of some New Zealand Galuconites. Ph.D. Thesis, University of Canterbury, Christchurch, New Zealand, 1964. [Google Scholar]
- McConchie, D.M.; Lewis, D.W. Varieties of glauconite in late Cretaceous and early Tertiary rocks of the South Island of New Zealand, and new proposals for classification. N. Z. J. Geol. Geophys. 1980, 23, 413–437. [Google Scholar] [CrossRef]
- Odin, G.S.; Matter, A. De glauconiarum origine. Sedimentology 1981, 28, 611–641. [Google Scholar] [CrossRef]
- Amorosi, A.; Sammartino, I.; Tateo, F. Evolution patterns of glaucony maturity: A mineralogical and geochemical approach. Deep Sea Res. Part II 2007, 54, 1364–1374. [Google Scholar] [CrossRef]
- McRae, S.G. Glauconite. Earth-Sci. Rev. 1972, 8, 397–440. [Google Scholar] [CrossRef]
- Franus, M.; Bandura, L.; Madej, J. Mono and Poly-Cationic Adsorption of Heavy Metals Using Natural Glauconite. Minerals 2019, 9, 470. [Google Scholar] [CrossRef]
- Franus, W.; Franus, M.; Latosińska, J.; Wójcik, R. The use of spent glauconite in lightweight aggregate production. Bol. Soc. Esp. Ceram. Vidr. 2011, 50, 193–200. [Google Scholar] [CrossRef]
- Derkowski, A.; Środoń, J.; Franus, W.; Uhlík, P.; Banaś, M.; Zieliński, G.; Čaplovičová, M.; Franus, M. Partial dissolution of glauconitic samples: Implications for the methodology of K-Ar and Rb-Sr dating. Clays Clay Miner. 2009, 57, 531–554. [Google Scholar] [CrossRef]
- Cook, G.H. Geology of New Jersey; Daily Advertiser Office: Wagga Wagga, NSW, Australia, 1868; Volume 1. [Google Scholar]
- TIFAC Technologies for Agricultural Application of Glauconite—A Potash Mineral. Available online: https://tifac.org.in/index.php/8-publication/194-technologies-for-agricultural-application-of-glauconite-a-potash-mineral (accessed on 25 October 2019).
- Franzosi, C.; Castro, L.N.; Celeda, A.M. Technical evaluation of glauconies as alternative potassium fertilizer from the Salamanca Formation, Patagonia, Southwest Argentina. Nat. Resour. Res. 2014, 23, 311–320. [Google Scholar] [CrossRef]
- Kapoutsos, D. Provenance Changes and Glauconite Formation in the Broken River to Iron Creek/Waipara Greensand Formations Marks the Late Cretaceous—Eocene Transgression. Master’ Thesis, University of Canterbury, Christchurch, New Zealand, 2005. [Google Scholar]
- Huggett, J.M. Minerals: Glauconites and Green Clays. In Reference Module in Earth Systems and Environmental Sciences; Elsevier: Amsterdam, The Netherlands, 2013; ISBN 978-0-12-409548-9. [Google Scholar]
- Stille, P.; Clauer, N. The process of glauconitization: Chemical and isotopic evidence. Contrib. Mineral. Petrol. 1994, 117, 253–262. [Google Scholar] [CrossRef]
- Pearce, N.J.G.; Perkins, W.T.; Westgate, J.A.; Gorton, M.P.; Jackson, S.E.; Neal, C.R.; Chenery, S.P. A compilation of new and published major and trace element data for NIST SRM 610 and NIST SRM 612 glass reference materials. Geostand. Newslett. 1997, 21, 115–144. [Google Scholar] [CrossRef]
- Oze, C.; Bird, D.K.; Fendorf, S. Genesis of hexavalent chromium from natural sources in soil and groundwater. Proc. Natl. Acad. Sci. USA 2007, 104, 6544–6549. [Google Scholar] [CrossRef]
- Smaill, J.B. Geochemical Variations in Glauconitic Minerals: Application As a Potassium Fertiliser Resource. Master’ Thesis, University of Canterbury, Christchurch, New Zealand, 2015. [Google Scholar]
- Tedrow, J.C.F. Greensand and Greensand Soilsof New Jersey: A Review; Rutgers Cooperative Extension, NJ Agricultural Experiment Station, Rutgers, the State University of New Jersey: New Brunswick, NJ, USA, 2002; p. 40. [Google Scholar]
- Barringer, J.L.; Reilly, P.A.; Eberl, D.D.; Blum, A.E.; Bonin, J.L.; Rosman, R.; Hirst, B.; Alebus, M.; Cenno, K.; Gorska, M. Arsenic in sediments, groundwater, and streamwater of a glauconitic Coastal Plain terrain, New Jersey, USA—Chemical “fingerprints” for geogenic and anthropogenic sources. Appl. Geochem. 2011, 26, 763–776. [Google Scholar] [CrossRef]
- Rao, C.S.; Rao, A.S. Characterization of indigenous glauconitic sandstone for its potassium-supplying potential by chemical, biological, and electroultrafiltration methods. Commun. Soil Sci. Plant Anal. 1999, 30, 1105–1117. [Google Scholar] [CrossRef]
- Mazumder, A.K.; Sharma, T.; Rao, T.C. Extraction of potassium from glauconitic sandstone by the roast-leach method. Int. J. Miner. Process. 1993, 38, 111–123. [Google Scholar] [CrossRef]
- Tang, Y.; Webb, S.M.; Estes, E.R.; Hansel, C.M. Chromium(III) oxidation by biogenic manganese oxides with varying structural ripening. Environ. Sci. 2014, 16, 2127–2136. [Google Scholar] [CrossRef]
- Moore, T.A.; Black, A.; Centeno, J.A.; Harding, J.S.; Trumm, D.A. Metal Contaminants in New Zealand: Sources, Treatments, and Effects on Ecology and Human Health; Rezolutionz Press: Christchurch, New Zealand, 2005. [Google Scholar]
- Richard, F.C.; Bourg, A.C.M. Aqueous geochemistry of chromium: A review. Water Res. 1991, 25, 807–816. [Google Scholar] [CrossRef]
- Kotas, J.; Stasicka, Z. Chromium occurrence in the environment and methods of its speciation. Environ. Pollut. 2000, 107, 263–283. [Google Scholar] [CrossRef]
- Shanker, A.K.; Cervantes, C.; Loza-Tavera, H.; Avudainayagam, S. Chromium toxicity in plants. Environ. Int. 2005, 31, 739–753. [Google Scholar] [CrossRef] [PubMed]
- Rai, D.; Eary, L.E.; Zachara, J.M. Environmental chemistry of chromium. Sci. Total Environ. 1989, 86, 15–23. [Google Scholar] [CrossRef]
- Rock, M.L.; James, B.R.; Helz, G.R. Hydrogen peroxide effects on chromium oxidation state and solubility in four diverse, chromium-enriched soils. Environ. Sci. Technol. 2001, 35, 4054–4059. [Google Scholar] [CrossRef] [PubMed]
- Oze, C.; Sleep, N.H.; Coleman, R.G.; Fendorf, S. Anoxic oxidation of chromium. Geology 2016, 44, 543–546. [Google Scholar] [CrossRef]


| Outcrop | Samples | Units Sampled | Glaucony % | Dominant Host Grain |
|---|---|---|---|---|
| Earthquakes (44.87510° S, 170.62227° E) | EQ | Kokoamu Greensand; Otekaike Limestone | 25–40; 10 | Pellet + Trace Vermicular |
| Ross Farm (44.88038° S, 170.73837° E) | RF | Kokoamu Greensand | 20–80 | Pellet + Trace Vermicular + Bioclast |
| Gee’s Beach (45.16936° S, 170.90735° E) | GB | Gee Greensand | 40–50 | Bioclast + Pellets + Trace Vermicular |
| Campbell’s Beach (45.16938° S, 170.90730° E) | CB | Gee Greensand | 50–60 | Bioclast + Pellets + Trace Vermicular |
| Waipara (43.065121° S, 172.650291° E) | WP | Waipara Greensand | 40–65 | Pellets + Amorphous Grains |
| Oparara Quarry (41.215781° S, 172.145864° E) | OP | Stoney Creek Limestone | 10 | Bioclasts + Amorphous Grains |
| Sample | pH | Solution | Glaucony | Birnessite | Time |
|---|---|---|---|---|---|
| (mL) | (g) | (g) | (hours) | ||
| EQ | 4.6 | 10 | 0.25 | 0.015 | 103.25 |
| EQ | 4.6 | 10 | 0.25 | 0 | 103.25 |
| EQ | 8 | 10 | 0.25 | 0.015 | 103.25 |
| EQ | 8 | 10 | 0.25 | 0 | 103.25 |
| WP | 4.6 | 10 | 0.25 | 0.015 | 103.25 |
| WP | 4.6 | 10 | 0.25 | 0 | 103.25 |
| WP | 8 | 10 | 0.25 | 0.015 | 103.25 |
| WP | 8 | 10 | 0.25 | 0 | 103.25 |
| MgO | Al2O3 | SiO2 | K2O | Fe2O3 | |
|---|---|---|---|---|---|
| Oparara Quarry | |||||
| Average | 3.74 | 12.34 | 54.11 | 7.66 | 22.15 |
| Standard Deviation (N * = 9) | 0.29 | 1.78 | 1.3 | 0.57 | 2.22 |
| Minimum | 3.03 | 10.07 | 52.29 | 6.77 | 19.47 |
| Maximum | 4.09 | 15.55 | 55.94 | 8.51 | 25.55 |
| Earthquakes | |||||
| Average | 4.06 | 6.73 | 56.72 | 8.72 | 23.77 |
| Standard Deviation (N = 19) | 0.41 | 1.26 | 0.97 | 0.66 | 1.21 |
| Minimum | 3.27 | 4.19 | 54.66 | 7.48 | 21.64 |
| Maximum | 4.9 | 8.97 | 58.5 | 9.65 | 26.08 |
| Ross Farm | |||||
| Average | 4.2 | 6.29 | 56.57 | 8.95 | 23.99 |
| Standard Deviation (N = 14) | 0.46 | 1.48 | 1.45 | 0.82 | 2.35 |
| Minimum | 3.51 | 4.41 | 55.14 | 6.97 | 18.45 |
| Maximum | 5.38 | 9.59 | 59.83 | 9.84 | 27.17 |
| Campbell’s Beach | |||||
| Average | 4.35 | 5.84 | 56 | 9.4 | 24.41 |
| Standard Deviation (N = 11) | 0.17 | 0.73 | 0.33 | 0.32 | 0.98 |
| Minimum | 4.1 | 4.88 | 55.47 | 8.91 | 22.62 |
| Maximum | 4.54 | 7.04 | 56.35 | 9.81 | 25.48 |
| Gee’s Beach | |||||
| Average | 3.53 | 5.72 | 53.23 | 7.95 | 29.57 |
| Standard Deviation (N = 12) | 0.52 | 0.96 | 2.14 | 0.87 | 3.36 |
| Minimum | 3 | 4.37 | 49.35 | 6.75 | 23.85 |
| Maximum | 4.41 | 7.18 | 57.02 | 9.73 | 34.15 |
| Waipara Greensand | |||||
| Average | 3.71 | 5.7 | 56.55 | 8.66 | 25.38 |
| Standard Deviation (N = 27) | 0.34 | 1.99 | 1.7 | 0.59 | 2.58 |
| Minimum | 2.72 | 3.45 | 51.35 | 7.34 | 19.16 |
| Maximum | 4.33 | 13.76 | 59.58 | 9.64 | 31.73 |
| Outcrop | Sc | Ti | V | Cr | Mn | Co | Ni | Cu | Zn | Ga | Rb | Sr | Y | Zr | Nb | Cs | Ba | Pb | Th | U | |
|---|---|---|---|---|---|---|---|---|---|---|---|---|---|---|---|---|---|---|---|---|---|
| Concentration (ppm) | |||||||||||||||||||||
| Oparara | Average | 8 | 502 | 418 | 263 | 58 | 22 | 79 | 53 | 197 | 29 | 580 | 48 | 3.6 | 41 | 1 | 40 | 43 | 12 | 0.6 | 0.6 |
| STDEV (N = 10) | 2.4 | 103 | 61 | 36 | 27 | 2.8 | 11 | 18 | 19 | 4.2 | 47 | 26 | 6.9 | 3.9 | 0.2 | 10 | 10 | 5.4 | 0.5 | 0.4 | |
| Earthquakes | Average | 8.4 | 397 | 121 | 201 | 29 | 2.5 | 29 | 20 | 130 | 21 | 250 | 11 | 3.2 | 14 | 1 | 3.8 | 6.6 | 3.4 | 0.2 | 0.6 |
| STDEV (N = 11) | 2 | 177 | 63 | 56 | 19 | 1.1 | 5.7 | 14 | 48 | 3.6 | 20 | 2.5 | 2.4 | 5.4 | 0.2 | 1.7 | 5.6 | 1.5 | 0.1 | 0.2 | |
| Ross Farm | Average | 9.2 | 448 | 102 | 282 | 16 | 3 | 29 | 27 | 145 | 20 | 280 | 10 | 4.3 | 19 | 2 | 3.5 | 7 | 5 | 0.3 | 0.6 |
| STDEV (N = 7) | 5.3 | 238 | 28 | 69 | 15 | 1.2 | 3.5 | 11 | 31 | 3.8 | 33 | 7 | 4.6 | 3.5 | 0.4 | 1.6 | 7 | 2.9 | 0.3 | 0.1 | |
| Campbell’s Beach | Average | 6.6 | 272 | 74 | 305 | 6.7 | 3.2 | 32 | 18 | 130 | 17 | 273 | 8.2 | 6.6 | 21 | 1.6 | 2.2 | 3.6 | 2.7 | 0.3 | 0.6 |
| STDEV (N = 3) | 0.2 | 96 | 3.4 | 69 | 0.7 | 0.3 | 1.9 | 5.5 | 20 | 0.3 | 7.2 | 1.1 | 3 | 1.4 | 0.1 | 1 | 0.4 | 1.8 | 0.3 | 0.1 | |
| Gee’s Beach | Average | 6.2 | 570 | 153 | 174 | 45 | 11 | 61 | 31 | 200 | 12 | 253 | 11 | 5.4 | 24 | 2.2 | 6.2 | 15 | 12 | 0.4 | 0.4 |
| STDEV (N = 8) | 1.6 | 470 | 124 | 111 | 31 | 4.8 | 31 | 12 | 60 | 3.3 | 13 | 3.6 | 5.2 | 7.3 | 1.5 | 3.4 | 14 | 11 | 0.4 | 0.2 | |
| Waipara | Average | 18 | 915 | 251 | 334 | 56 | 4.1 | 19 | 21 | 189 | 25 | 335 | 7 | 1.2 | 26 | 4.6 | 5.8 | 24 | 5 | 1.2 | 0.8 |
| STDEV (N = 20) | 8.4 | 463 | 73 | 102 | 36 | 1.9 | 21 | 11 | 26 | 7.8 | 48 | 2 | 0.9 | 9.3 | 2.4 | 2.2 | 27 | 2.3 | 1.2 | 0.6 | |
| Total for all grains | Average | 12 | 616 | 212 | 268 | 42 | 7.2 | 38 | 28 | 172 | 22 | 336 | 15 | 3.2 | 25 | 2.6 | 10 | 19 | 6.6 | 0.7 | 0.7 |
| STDEV (N = 59) | 7.4 | 405 | 130 | 100 | 32 | 7.1 | 28 | 17 | 46 | 7.4 | 117 | 18 | 4.1 | 11 | 2.2 | 13 | 21 | 5.8 | 0.8 | 0.4 | |
© 2019 by the authors. Licensee MDPI, Basel, Switzerland. This article is an open access article distributed under the terms and conditions of the Creative Commons Attribution (CC BY) license (http://creativecommons.org/licenses/by/4.0/).
Share and Cite
Oze, C.; Smaill, J.B.; Reid, C.M.; Palin, M. Potassium and Metal Release Related to Glaucony Dissolution in Soils. Soil Syst. 2019, 3, 70. https://doi.org/10.3390/soilsystems3040070
Oze C, Smaill JB, Reid CM, Palin M. Potassium and Metal Release Related to Glaucony Dissolution in Soils. Soil Systems. 2019; 3(4):70. https://doi.org/10.3390/soilsystems3040070
Chicago/Turabian StyleOze, Christopher, Joshua B. Smaill, Catherine M. Reid, and Michael Palin. 2019. "Potassium and Metal Release Related to Glaucony Dissolution in Soils" Soil Systems 3, no. 4: 70. https://doi.org/10.3390/soilsystems3040070
APA StyleOze, C., Smaill, J. B., Reid, C. M., & Palin, M. (2019). Potassium and Metal Release Related to Glaucony Dissolution in Soils. Soil Systems, 3(4), 70. https://doi.org/10.3390/soilsystems3040070