Carbaryl Photochemical Degradation on Soil Model Surfaces

Abstract
:1. Introduction
2. Materials and Methods
2.1. Chemical
2.2. Preparation of Solid Model Media Doped with Carbaryl
2.2.1. Kaolin Layer Samples
2.2.2. Powder Samples
2.3. Characterization of Solid Supports
2.4. Irradiation Systems
2.4.1. Solar Simulated Irradiation
2.4.2. Monochromatic Irradiation at 365 nm
2.5. Extraction and HPLC Analysis
2.6. Toxicity Experiments
3. Results
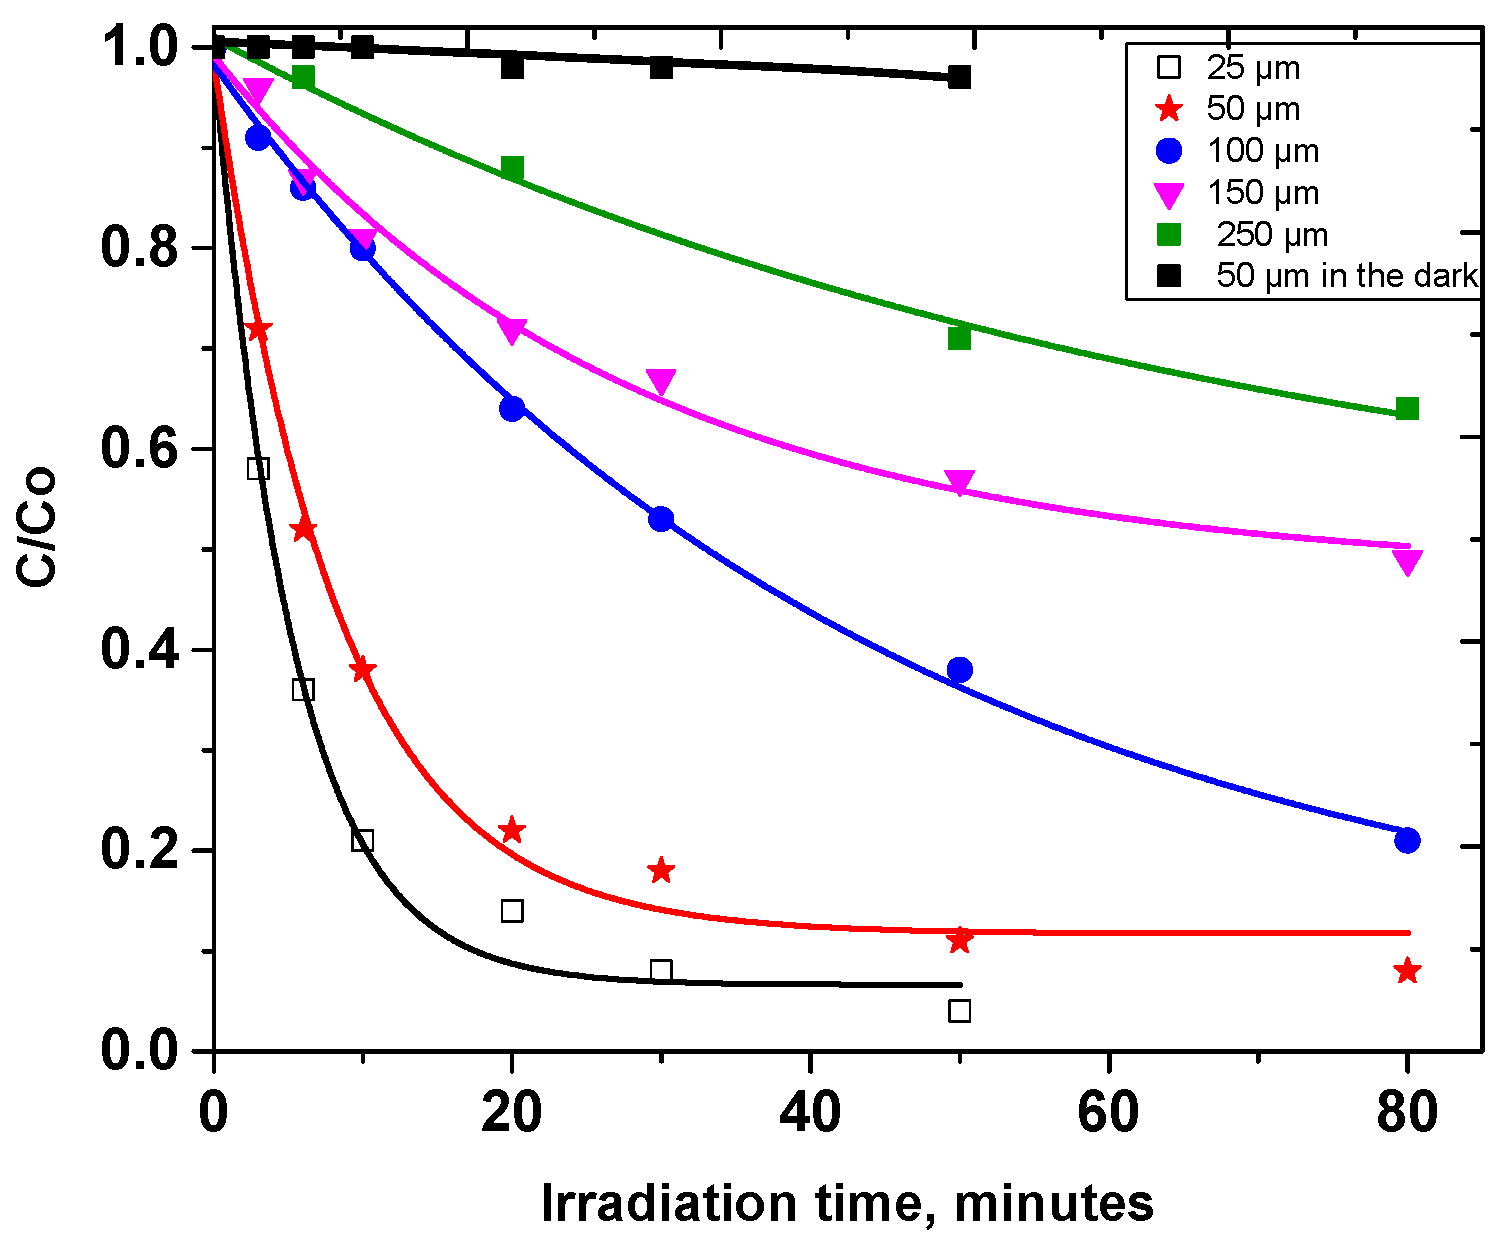
3.1. Photodegradation of Carbaryl on Kaolin
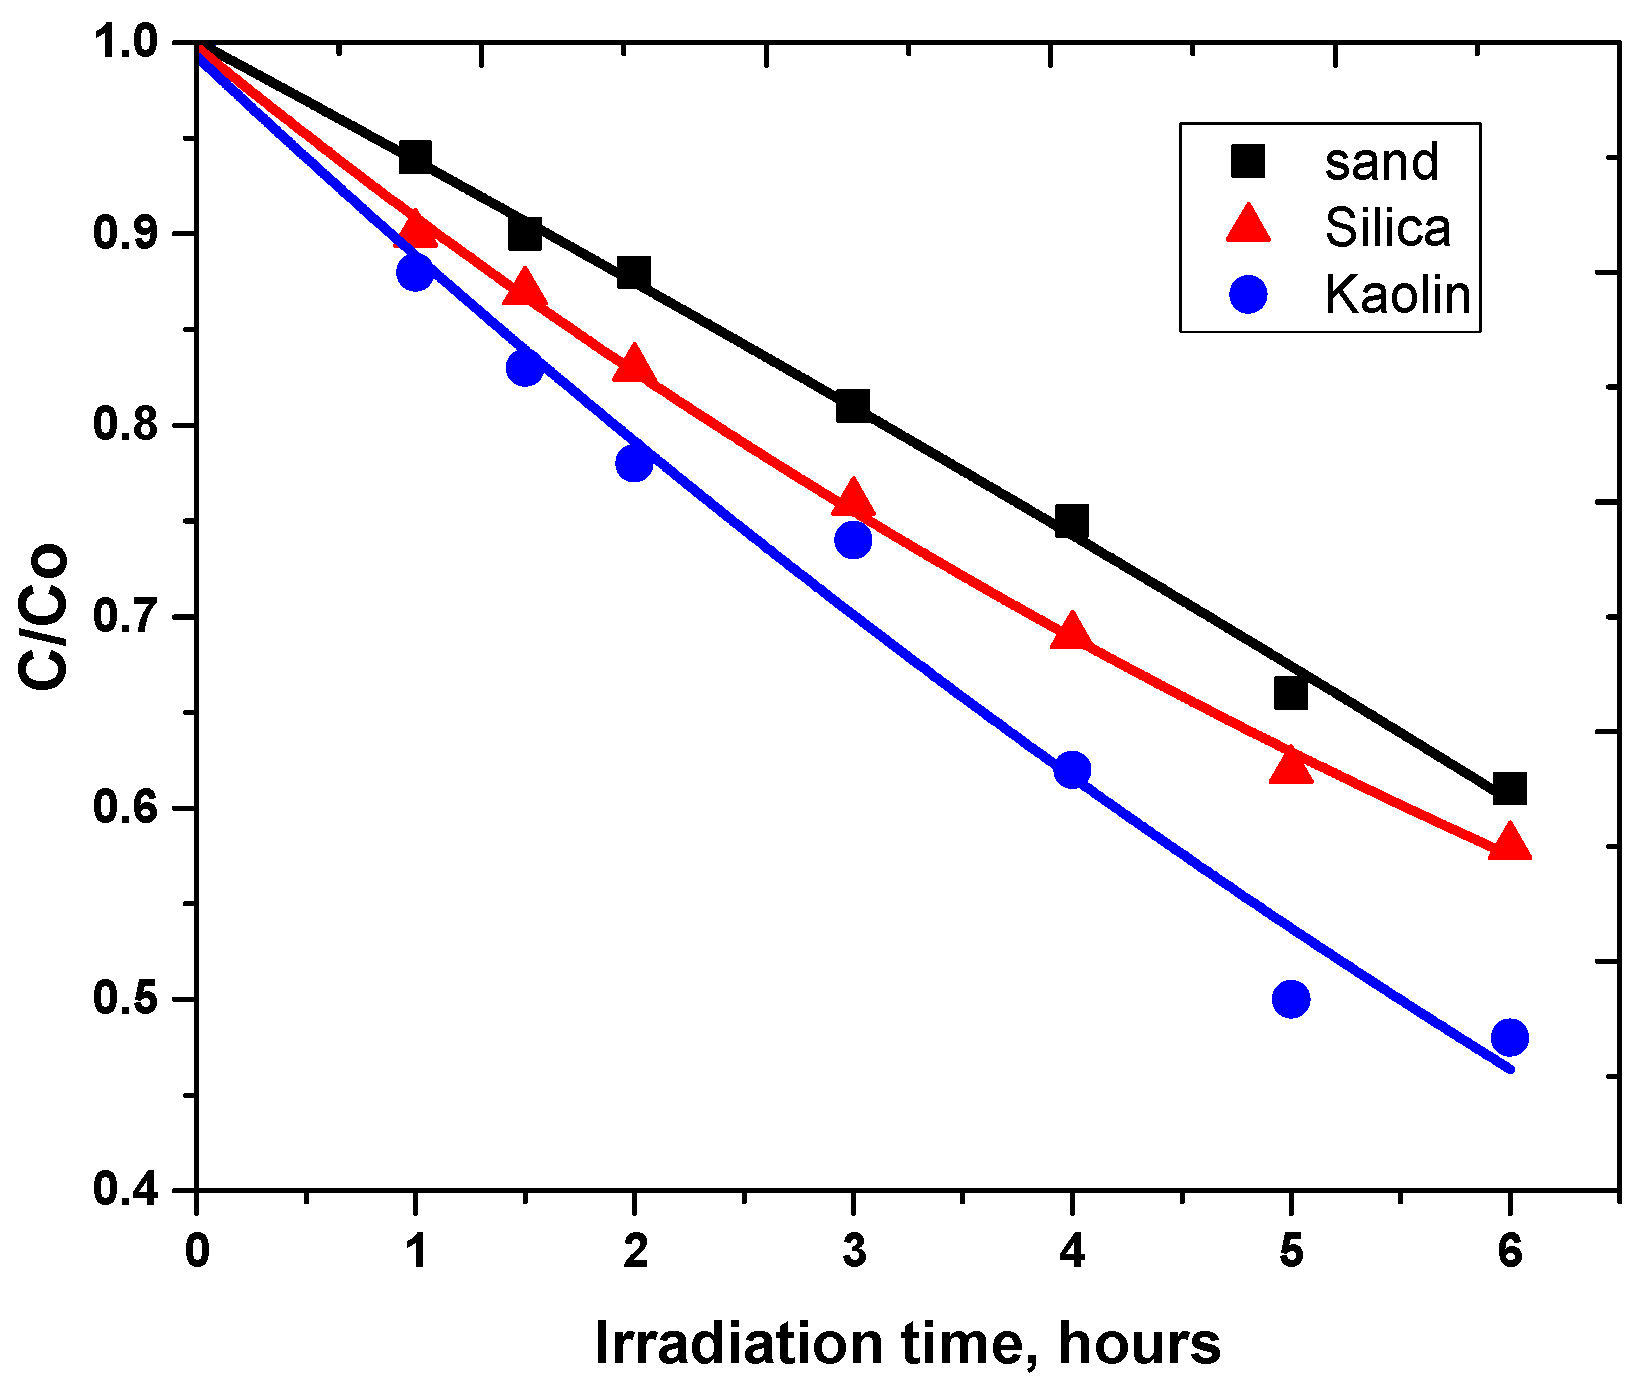
3.2. Photodegradation of Carbaryl on Kaolin, Silica and Sand
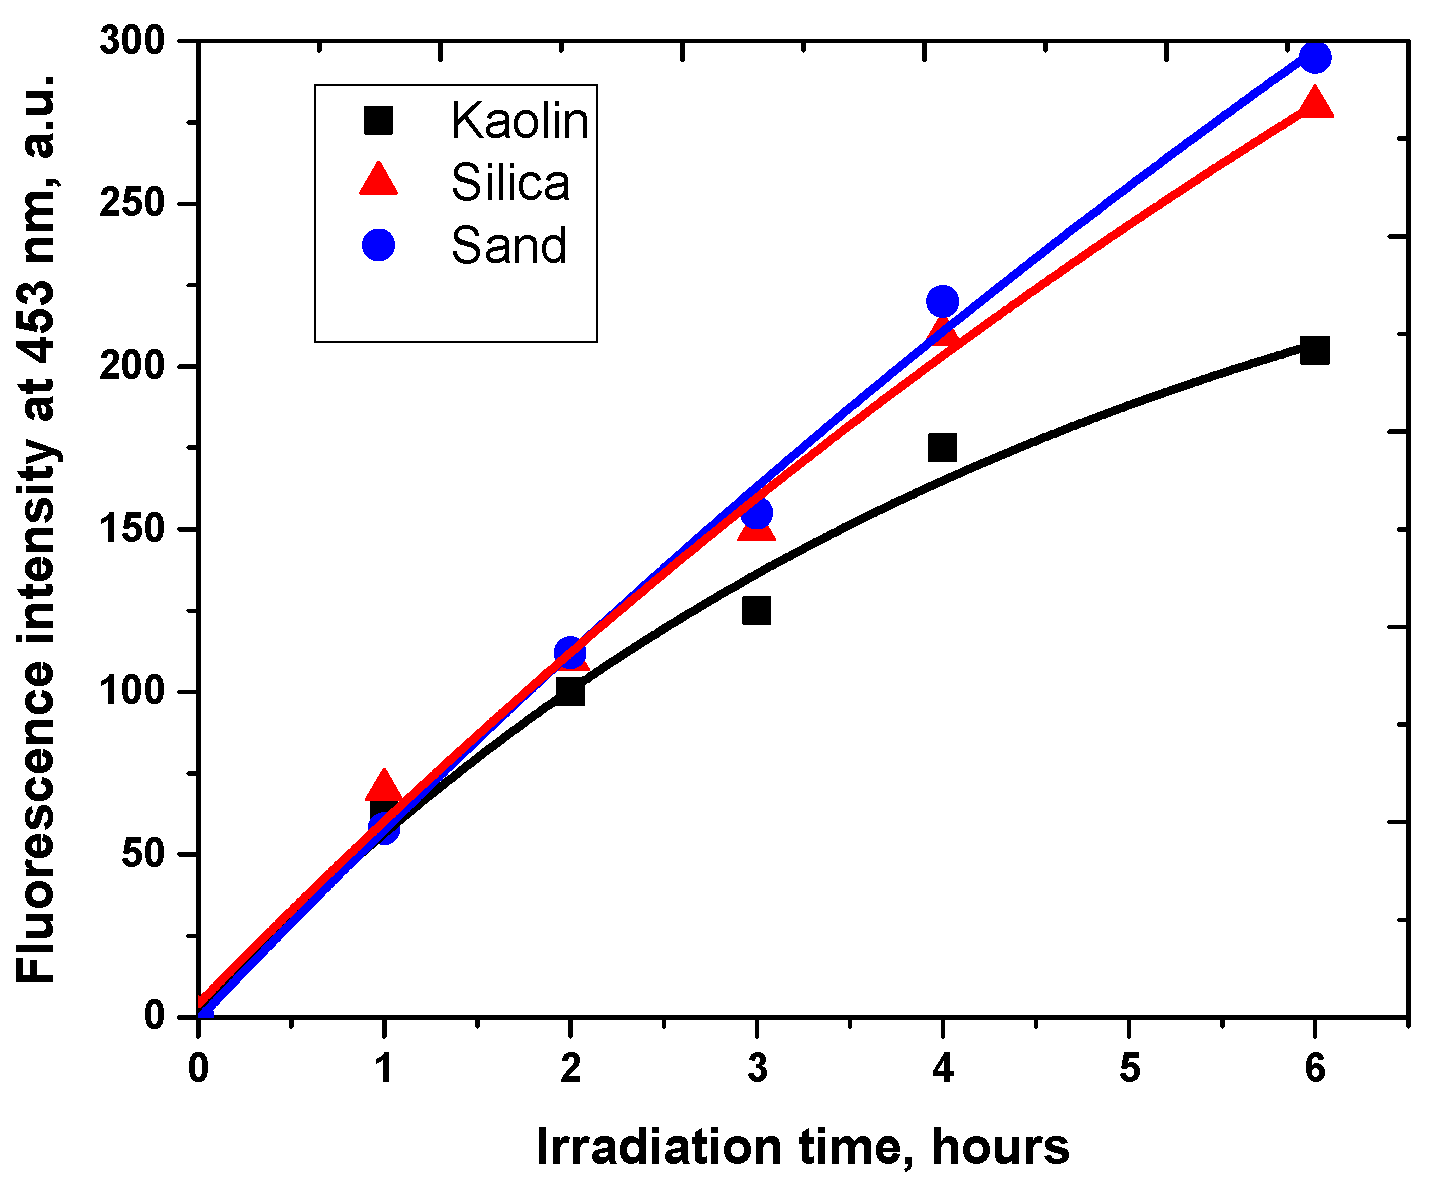
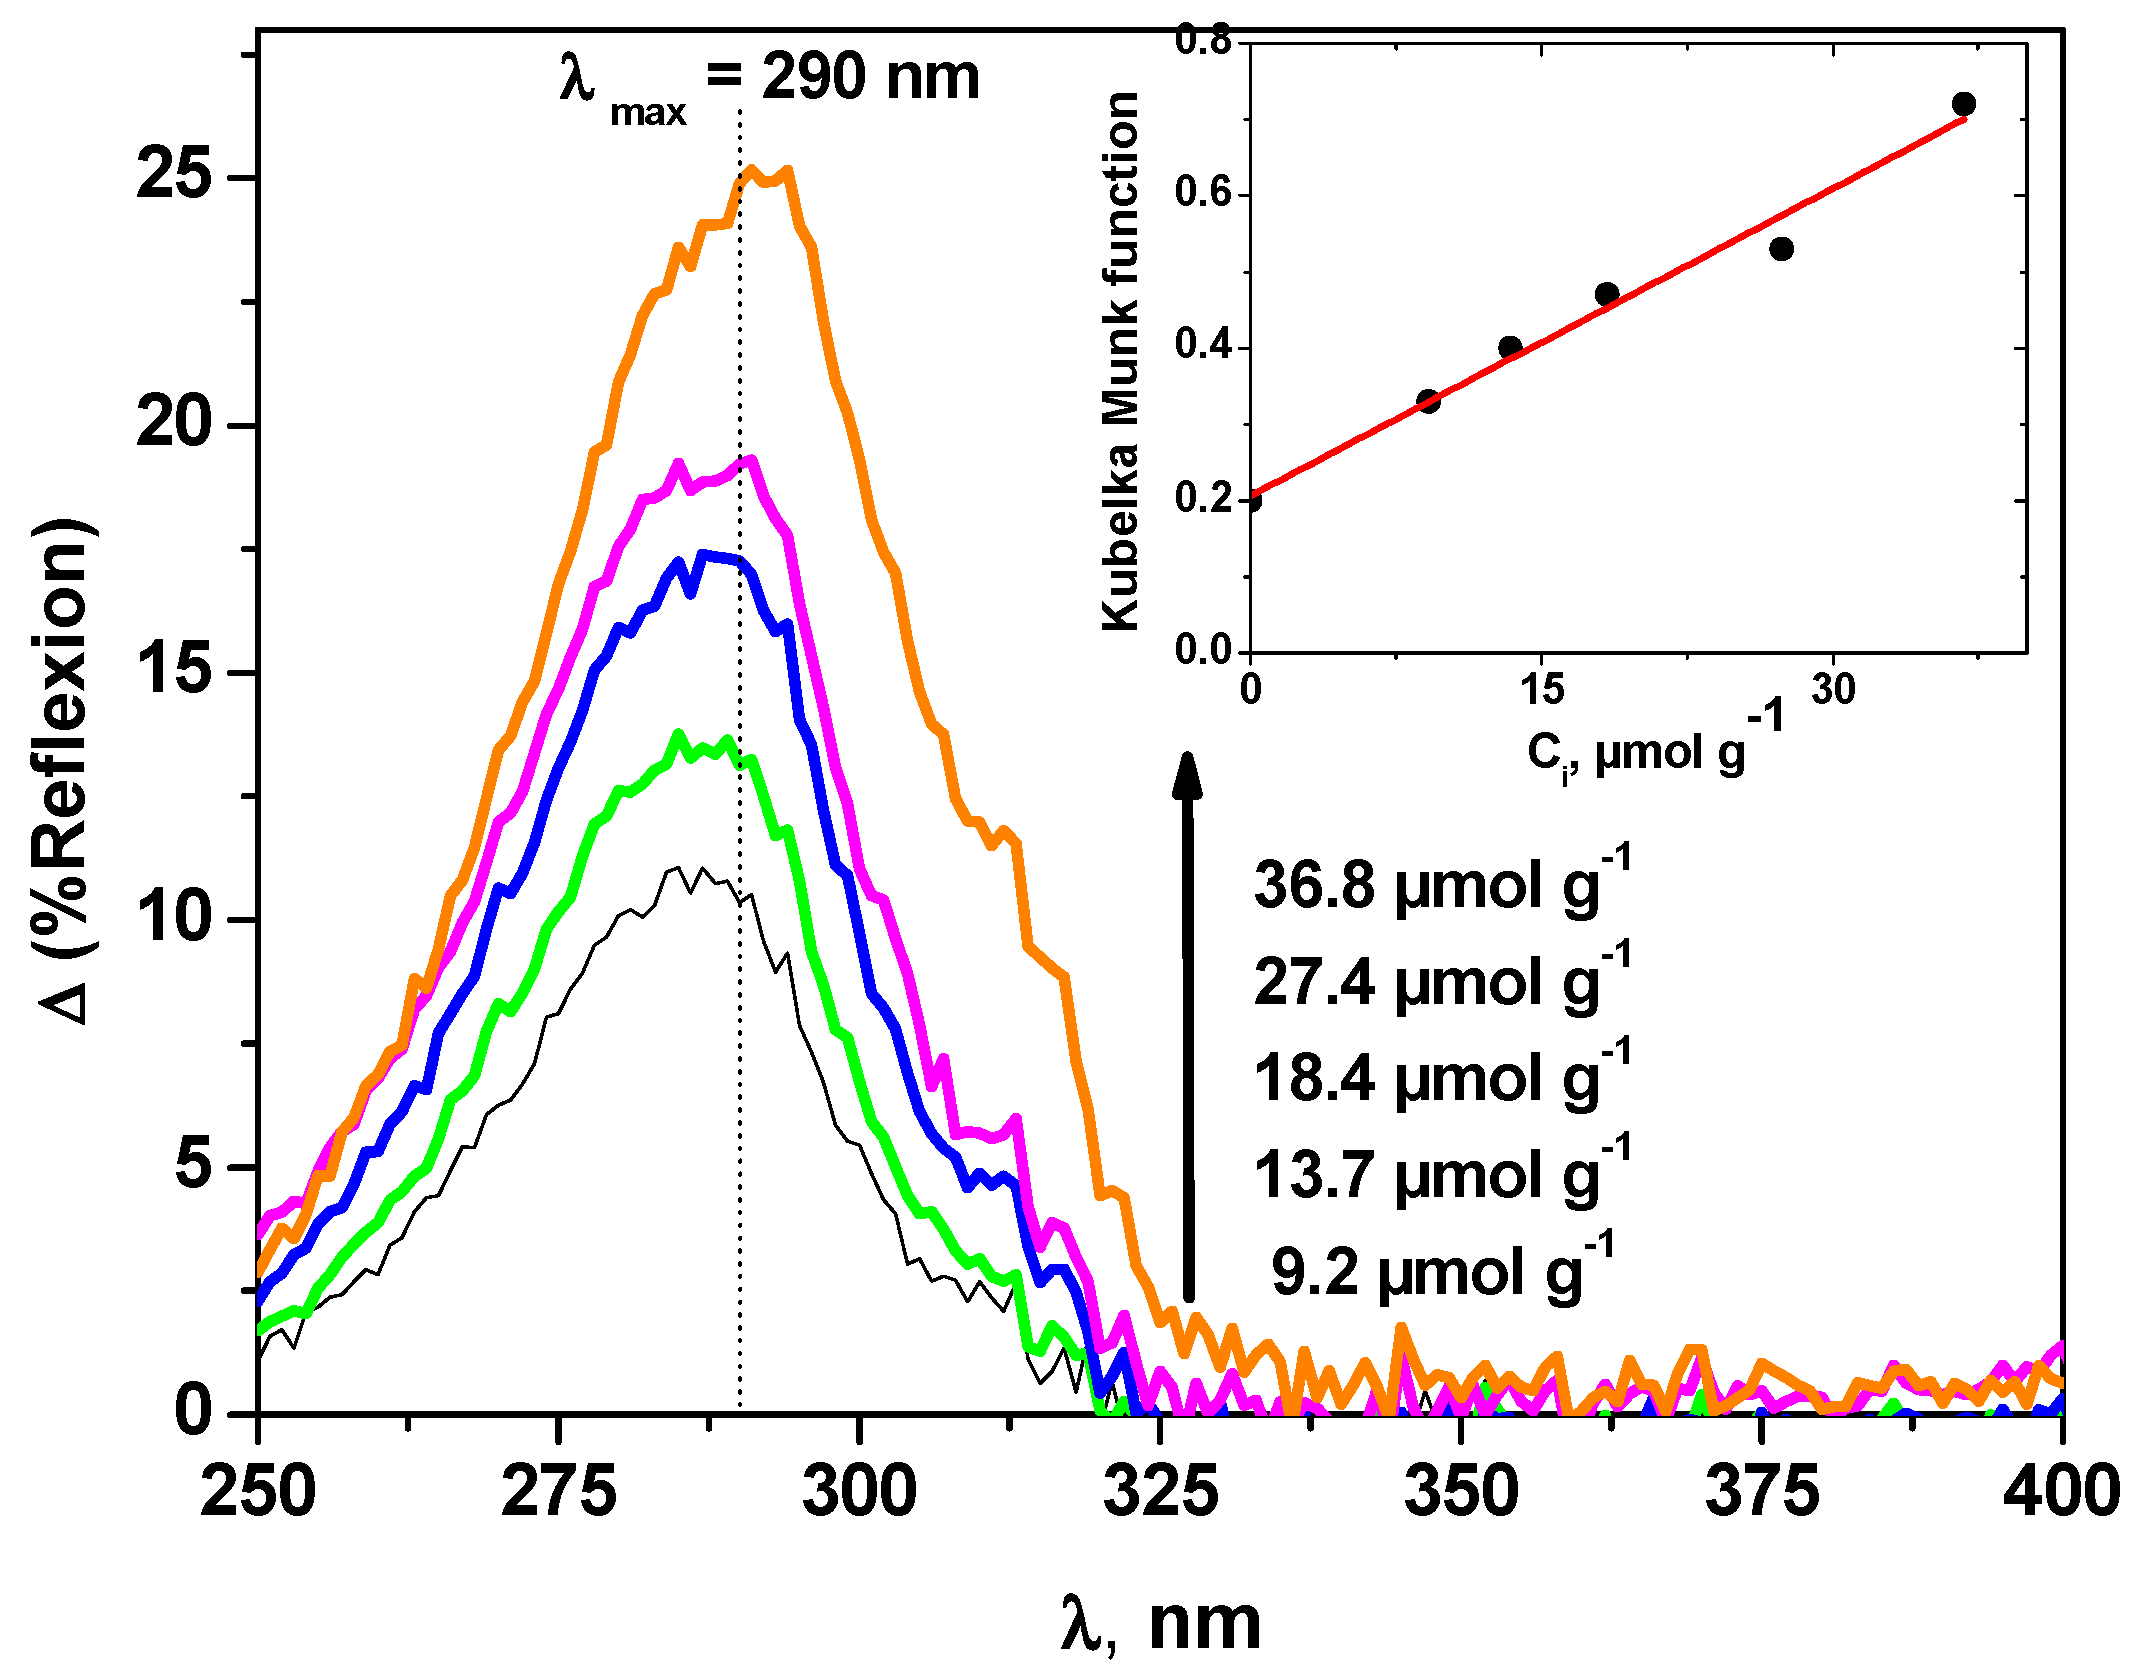
3.3. Photoinductive Properties of the Model Supports
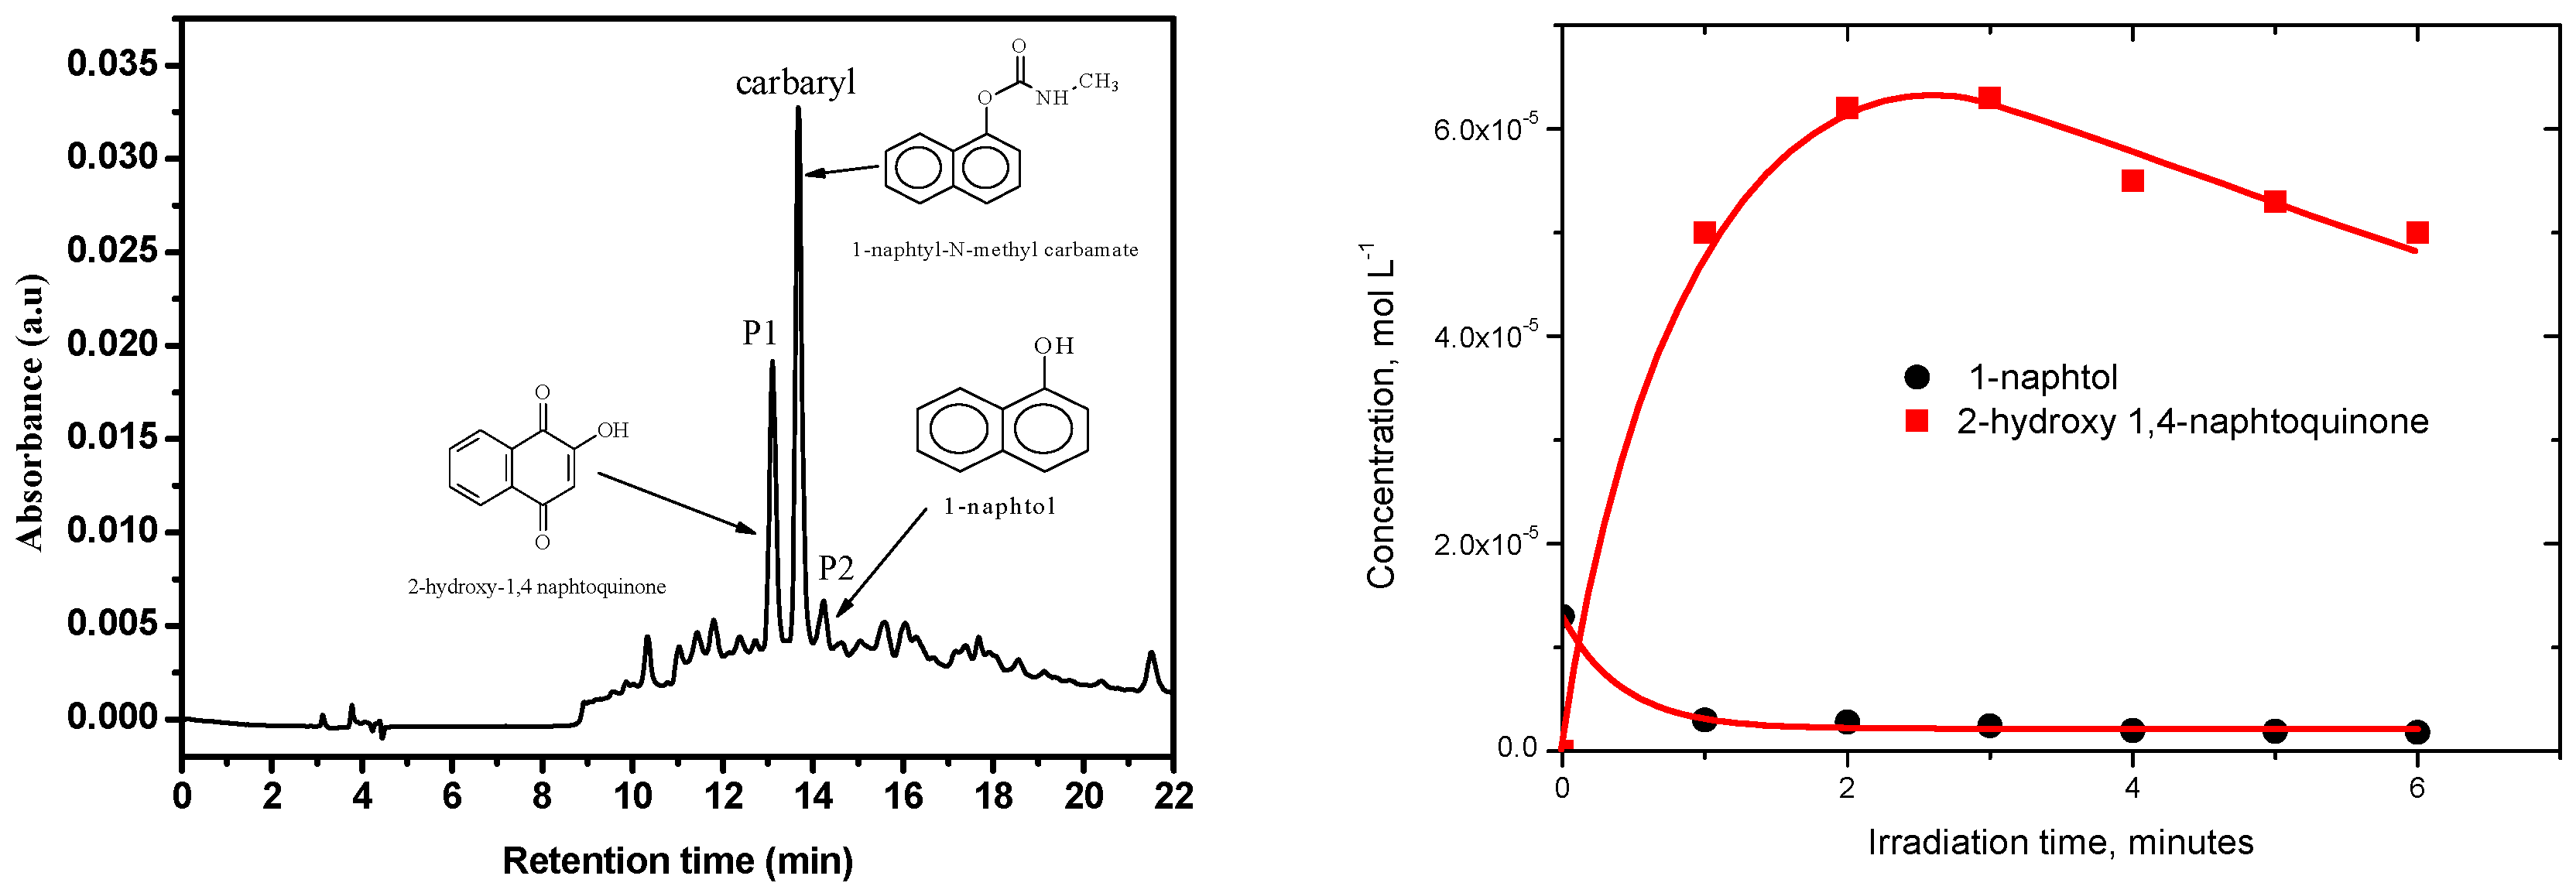
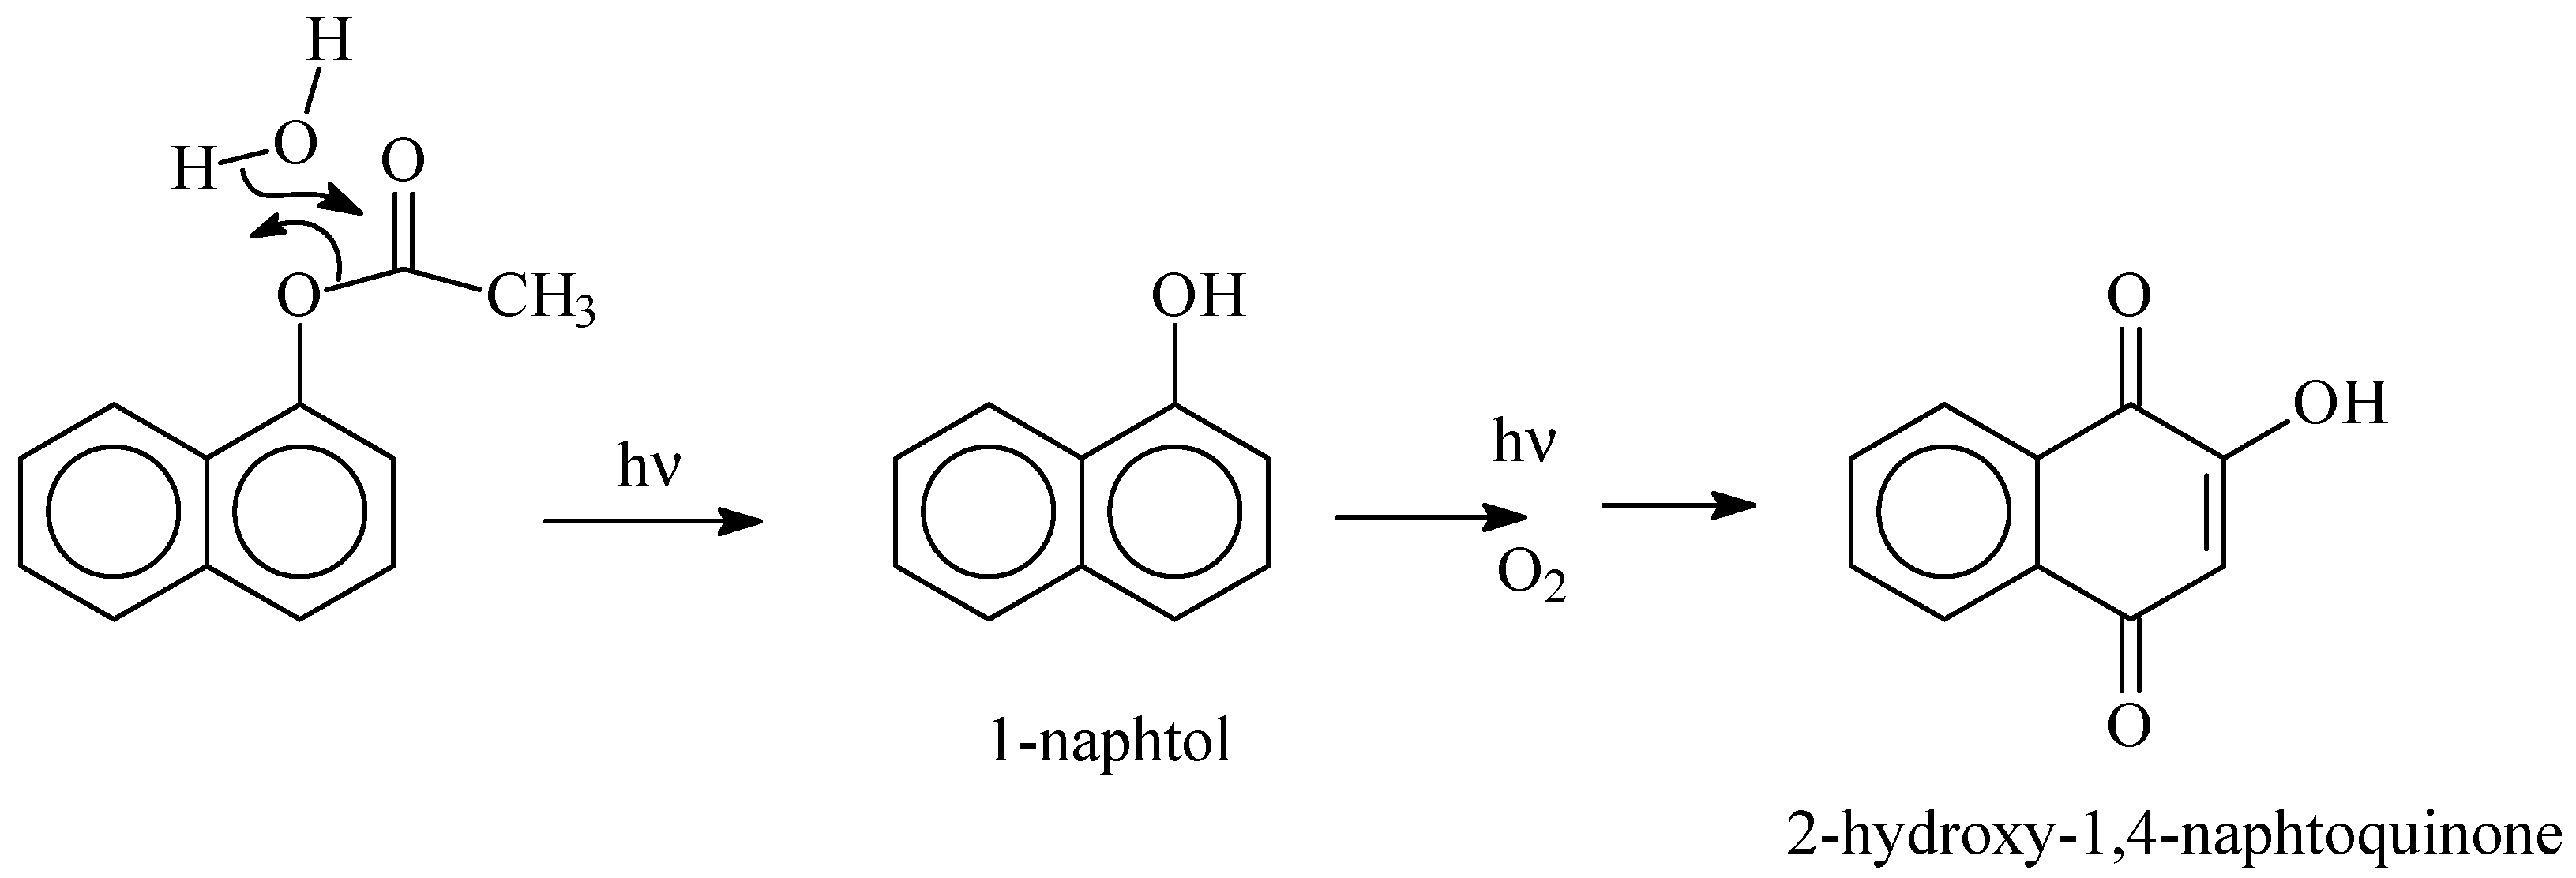
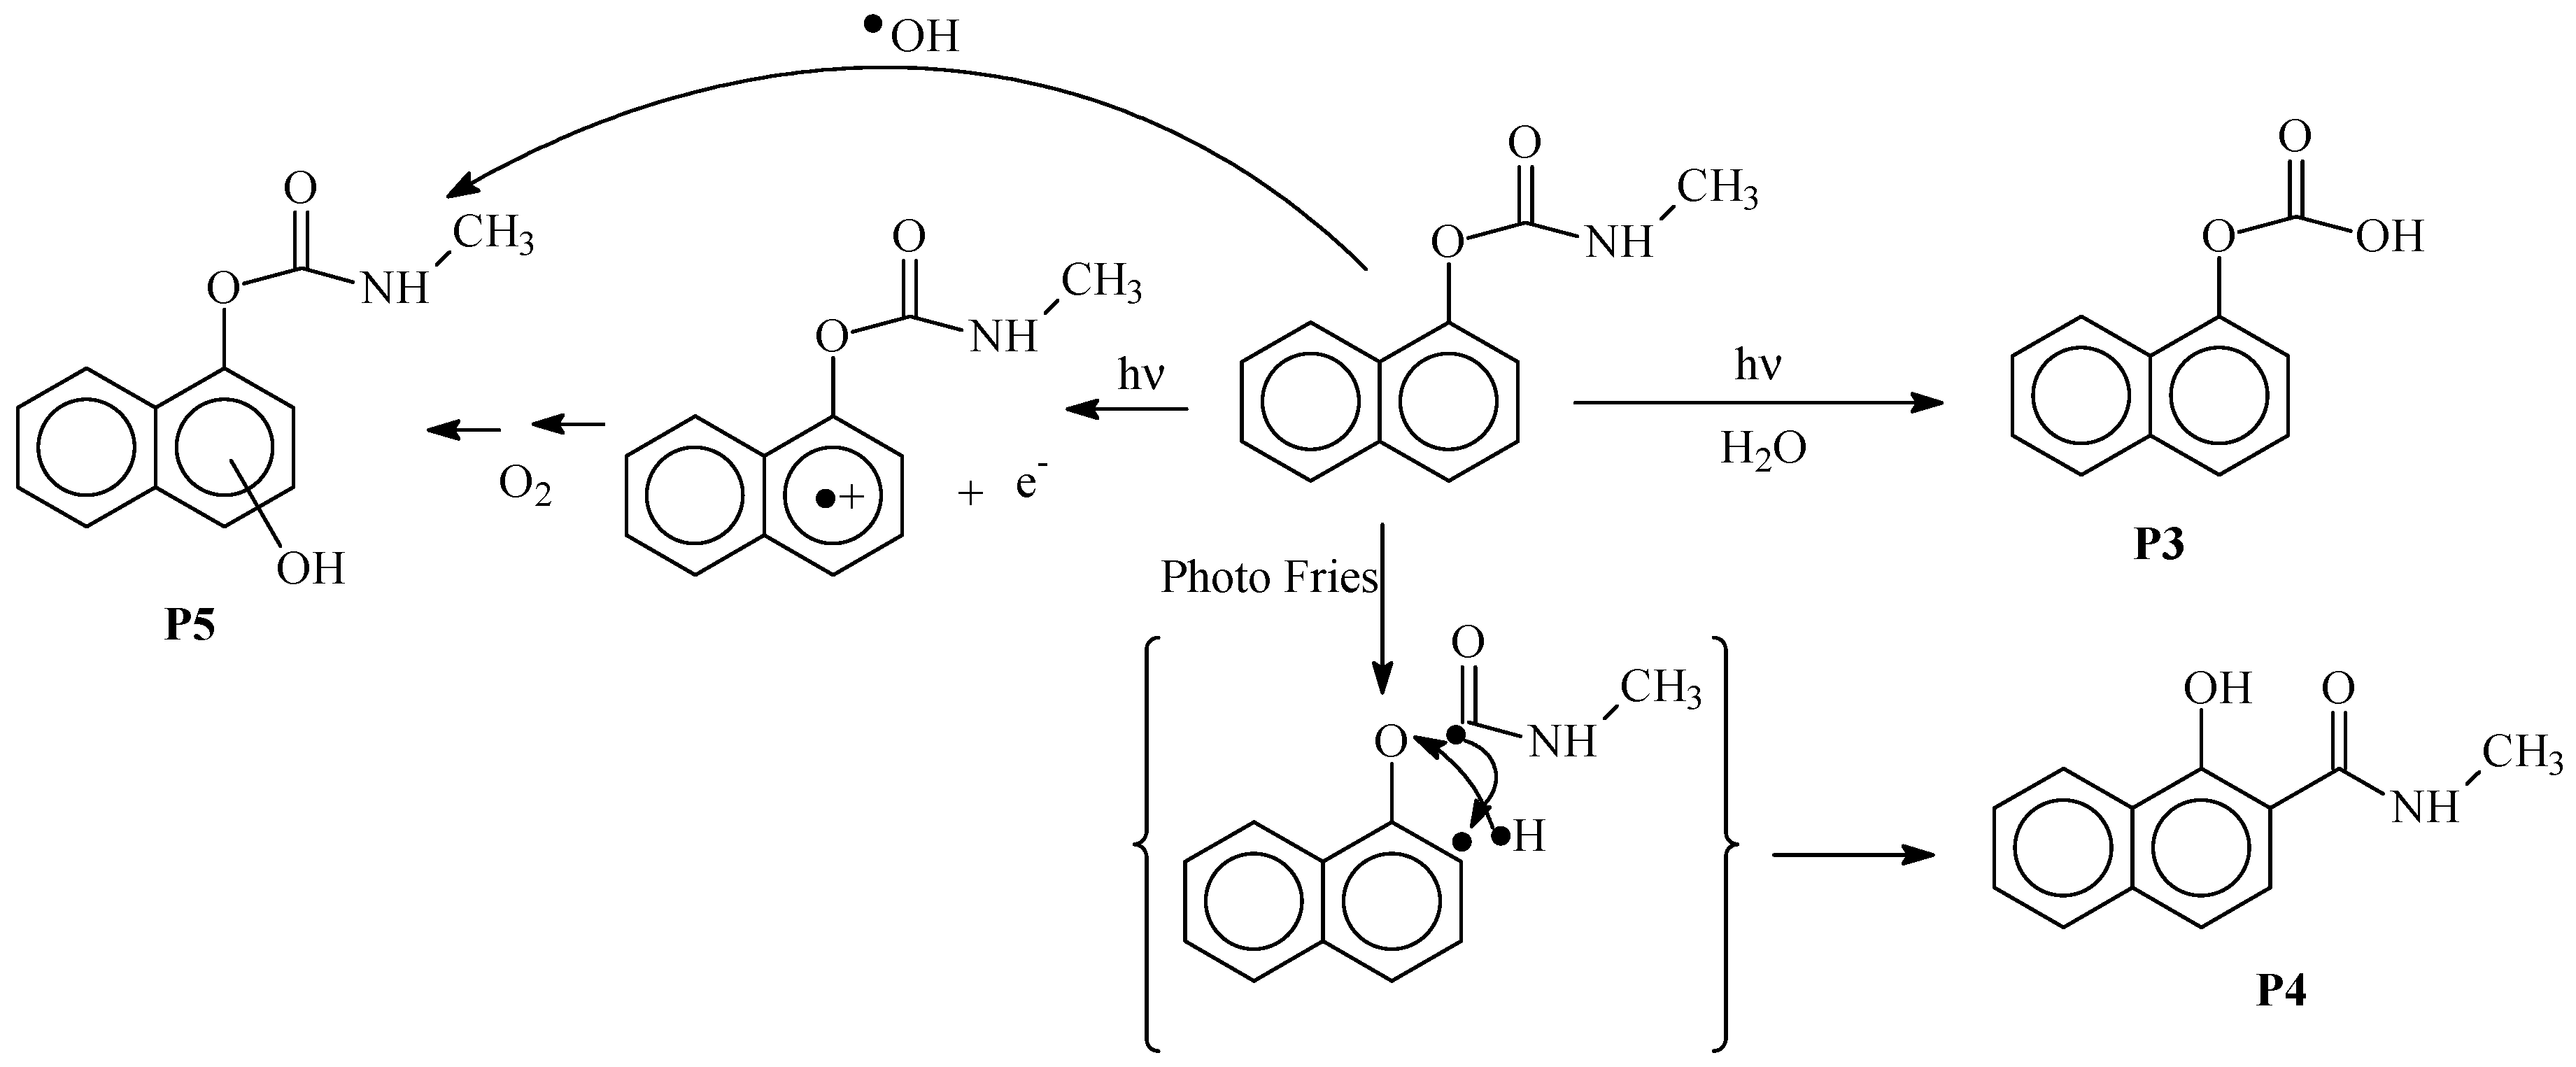
3.4. Photoproducts and Mechanisms
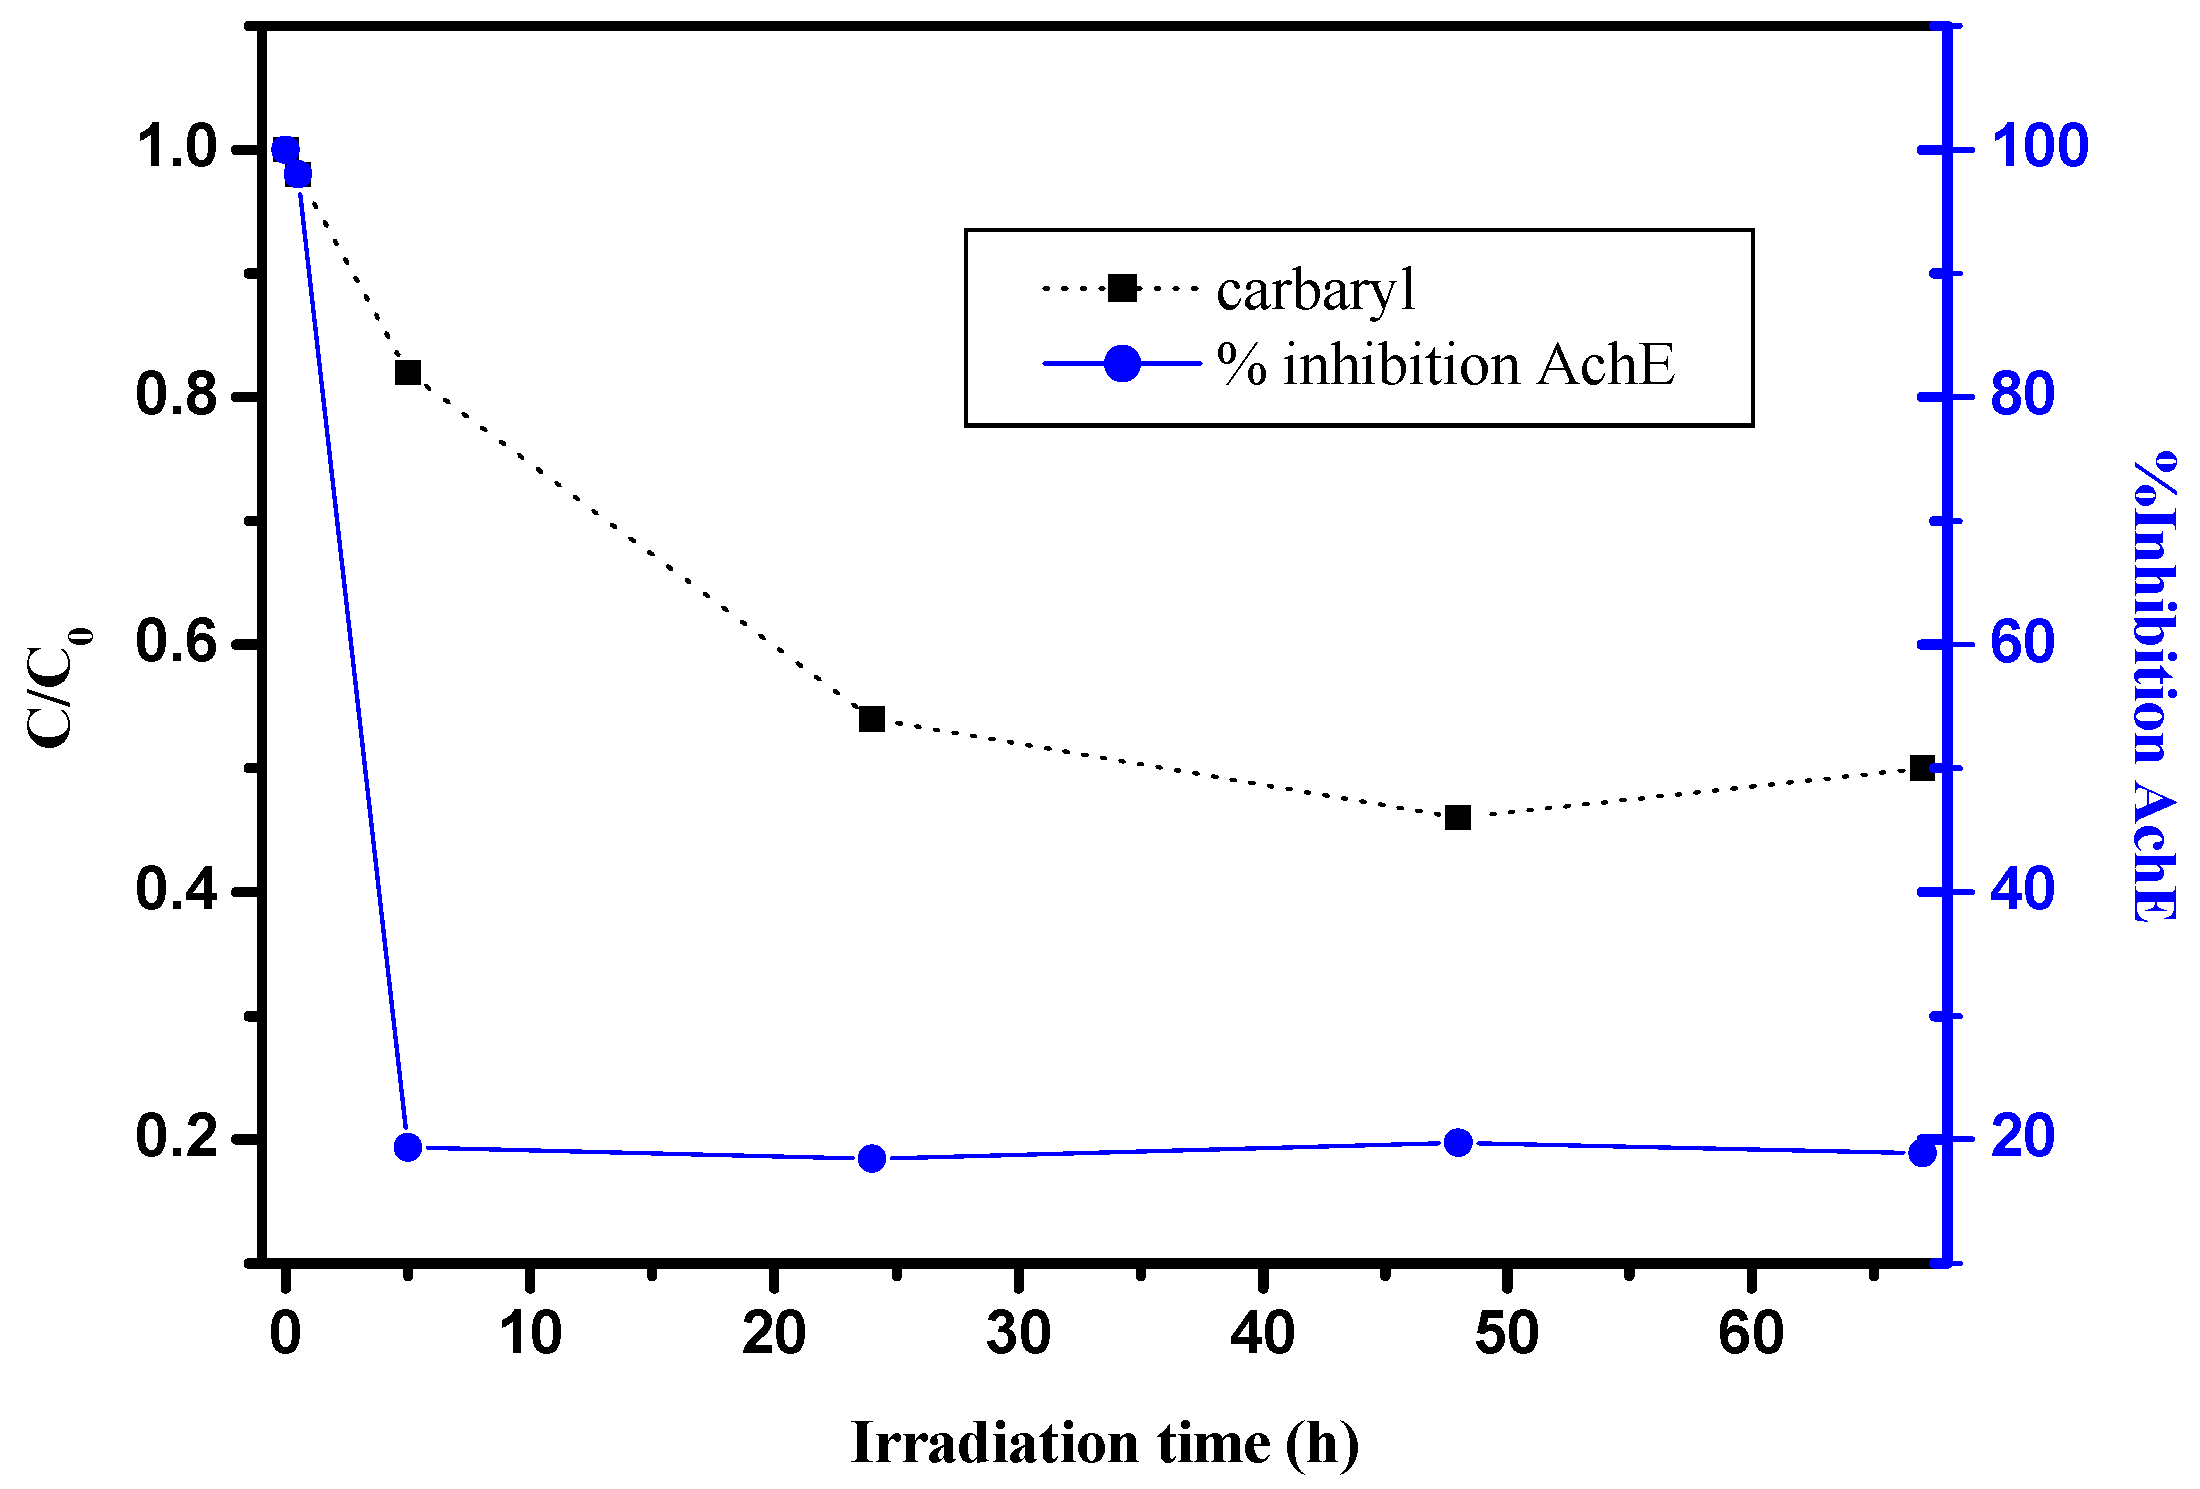
3.5. Toxicity Assessment
4. Conclusions
Author Contributions
Funding
Acknowledgments
Conflicts of Interest
References
- Bradbury, S. Amended Registration Decision for Carbaryl; Office of Prevention, Pesticides and TOXIC Substances, US Environmental Protection Agency: Washington, DC, USA, 2008.
- Hastings, F.L.; Holsten, E.H.; Shea, P.J.; Werner, R.A. Carbaryl: A review of its use against bark in coniferous forests of North America. Environ. Entomol. 2001, 30, 803–810. [Google Scholar] [CrossRef]
- Tomlin, C. (Ed.) The Pesticide Manual, 12th ed.; Crop Protection Publications: Surrey, UK, 2000; pp. 133–134. [Google Scholar]
- Ware, G.W. The Pesticide Manual; Thomson Publication: Fresno, CA, USA, 2000; pp. 57, 83, 302. [Google Scholar]
- Mathew, L.; Reddy, M.L.P.; Rao, T.P.; Iyer, C.S.P.; Damodaran, A.D. Simple spectrophotometric method for the determination of carbaryl in soil and insecticide formulation. Analyst 1995, 120, 1799–1801. [Google Scholar] [CrossRef]
- Khalaf, K.D.; Morales-Rubio, A.; De la Guardia, M. Simple and rapid fow-injection spectrophotometric determination of carbaryl after liquid-liquid extraction. Anal. Chim. Acta 1993, 280, 231–238. [Google Scholar] [CrossRef]
- Bernieri, T.; Rodrigues, D.; Barbosa, I.R.; Ardenghi, P.G.; da Silva, L.B. Occupational exposure to pesticides and thyroid function in Brazilian soybean farmers. Chemosphere 2019, 218, 425–429. [Google Scholar] [CrossRef] [PubMed]
- Martin, J.D.; Crawford, C.G.; Larson, S.J. Pesticides in Streams—Preliminary Results from Cycle I of the National Water Quality Assessment Program (NAWQA); United States Geological Survey: Reston, VA, USA, 2003; pp. 1992–2001.
- Walters, J.; Goh, K.S.; Li, L.; Feng, H.; Hernandez, J.; White, J.J. Environmental monitoring of carbaryl applied in urban areas to control the glassy-winged sharpshooter in California. Environ. Monit. Assess. 2003, 82, 265–280. [Google Scholar] [CrossRef] [PubMed]
- Ni, Y.; Xiao, W.; Kokot, S. Application of chemometrics methods for the simultaneous kinetic spectrophotometric determination of aminocarb and carbaryl in vegetable and water samples. J. Hazard. Mater. 2009, 168, 1239–1245. [Google Scholar] [CrossRef] [PubMed]
- Mauriz, E.; Calle, A.; Abad, A.; Montoya, A.; Hildebrandt, A.; Barceló, D.; Lechuga, L.M. Determination of carbaryl in natural water samples by a surface Plasmon resonance flow-through immunosensor. Biosens. Bioelectron. 2006, 21, 2129–2136. [Google Scholar] [CrossRef] [PubMed]
- Demirbas, A. Spectrophotometric determination of carbaryl pesticide and its product in soil and strawberry samples. Sci. Total Environ. 1998, 220, 235–241. [Google Scholar] [CrossRef]
- Carlson, R.W.; Bradbury, S.P.; Drummond, R.A.; Hammermeister, E. Neurological effects on startle response and escape from predation by medaka exposed to organic chemicals. Aquat. Toxicol. 1998, 43, 51–68. [Google Scholar] [CrossRef]
- Juhler, R.K.; Larsen, S.; Meyer, O.; Jensen, N.D.; Spano, M.; Giwercman, A.; Bonde, J.P. Human semen quality in relation to dietary pesticide exposure and organic diet. Arch. Environ. Contam. Toxicol. 1999, 37, 415–423. [Google Scholar] [CrossRef] [PubMed]
- Delescluse, C.; Ledirac, N.; Li, R.; Piechocki, M.P.; Hines, R.N.; Gidrol, X.; Rahmani, R. Induction of cytochrome P450 1A1 gene expression, oxidative stress, and genotoxicity by carbaryl and thiabendazole in transfected human HepG2 and lymphoblastoid cells. Biochem. Pharmacol. 2001, 61, 399–407. [Google Scholar] [CrossRef]
- Kaline, C.C.S.; Caio, R.D.A.; Vagne, M.O.; Luiz, B.C., Jr.; Ranilson, S.B. Kinetic and physicochemical properties of brain acetylcholinesterase from the peacock bass (Cichla ocellaris) and in vitro effect of pesticides and metal ions. Aquat. Toxicol. 2013, 126, 191–197. [Google Scholar]
- De Bertrand, N.; Barceló, D. Photodegradation of carbamate pesticides aldicarb, carbaryl and carbofuran in water. Anal. Chim. Acta 1991, 254, 235–244. [Google Scholar] [CrossRef]
- Lars, C.; Rainer, B.; Yerbolat, S. Application of selected partial order tools to analyze fate and toxicity indicators of environmentally hazardous chemicals. Ecol. Indic. 2013, 29, 191–202. [Google Scholar]
- Deuel, L.E.; Brown, K.W.; Price, J.; Turner, F.T. Dissipation of Carbaryl and the 1-Naphthol Metabolite in Flooded Rice Fields 1. J. Environ. Qual. 1985, 14, 349–354. [Google Scholar] [CrossRef]
- Samanidou, V.; Fytianos, K.; Pfister, G.; Bahadir, M. Photochemical decomposition of carbamate pesticides in natural waters of northern Greece. Sci. Total Environ. 1988, 76, 85–92. [Google Scholar] [CrossRef]
- Michelle, D.B.; Austin, S.H.; Nik, V.; Melissa, Y.; Caren, C.H. Specific time of exposure during tadpole development influences biological effects of the insecticide carbaryl in green frogs (Lithobates clamitans). Aquat. Toxicol. 2013, 130–131, 139–148. [Google Scholar]
- Brahmia, O.; Richard, C. Phototransformation of carabaryl in aqueous solution: Laser flash photolysis and steady state studies. J. Photochem. Photobiol. A Chem. 2003, 156, 9–14. [Google Scholar] [CrossRef]
- Miller, P.L.; Chin, Y.P. Photoinduced degradation of carbaryl in a wetland surface water. J. Agric. Food Chem. 2002, 50, 6758–6765. [Google Scholar] [CrossRef] [PubMed]
- Qiu, Y.; Wu, M.; Jong, J.; Li, L.; Sheng, D. Enhanced irreversible sorption of carbaryl to soils amended with crop-residue-derived biochor. Chemosphere 2013, 93, 69–74. [Google Scholar] [CrossRef] [PubMed]
- Gupta, N.; Pillai, A.K.; Parmar, P. Spectrophotometric determination of trace carbaryl in water and grain samples by inhibition of the rhodamine-B oxidation. Spectrochim. Acta Part A 2015, 139, 471–476. [Google Scholar] [CrossRef] [PubMed]
- Chen, H.; He, X.; Rong, X.; Chen, W.; Cai, O.; Liang, W.; Li, S.; Huang, Q. Adsorption and biodegradation of carbaryl on montmorillonite, kaolinite and goethite. Appl. Catal. Sci. 2009, 46, 102–108. [Google Scholar] [CrossRef]
- McConkey, B.M.; Duxbury, C.L.; Dixon, D.G.; Greenberg, B. Toxicity of a PAH photooxidation product to the bacteria photobacterium phosphoreum and the duckweed lena gibba: Effect of phenanthrene and its primary photoproduct, phenanthrenequinone. Environ. Toxicol. Chem. 1997, 16, 892–899. [Google Scholar] [CrossRef]
- Brack, W.; Altenburger, R.; Küster, Z.; Meissner, B.; Wenzel, K.D.; Schürmann, G. Identification of toxic products of anthracene photomodification in simulated sunlight. Environ. Toxicol. Chem. 2003, 22, 2228–2237. [Google Scholar] [CrossRef] [PubMed]
- Lampi, M.A.; Gurska, J.; McDonald, K.I.C.; Xie, F.; Huang, X.D.; Dixon, D.G.; Greenberg, B.M. Photoinduced toxicity of polycyclic aromatic hydrocarbons to Daphnia magna: Ultraviolet-mediated effects and the toxicity of polycyclic aromatic hydrocarbon photoproducts. Environ. Toxicol. Chem. 2005, 25, 1079–1087. [Google Scholar] [CrossRef]
- Balmer, M.E.; Goss, K.U.; Schwarzenbach, R.P. Photolytic transformation of organic pollutant on soil surfaces-an experimental approach. Environ. Sci. Technol. 2000, 34, 1240–1245. [Google Scholar] [CrossRef]
- Ciani, A.; Goss, K.U.; Schwarzenbach, R.P. Light penetration in soil and particulate minerals. Eur. J. Soil Sci. 2005, 56, 561–574. [Google Scholar] [CrossRef]
- Šikovec, M.; Novič, M.; Hudnik, V.; Franko, M. On-line thermal lens spectrometric detection of Cr(III) and Cr(VI) after separation by ion chromatography. J. Chromatogr. A 1995, 706, 121–126. [Google Scholar] [CrossRef]
- Menager, M.; Sarakha, M. Simulated solar light phototransformation of organophosphorus azinphos methyl at the surface of clays and goethite. Environ. Sci. Technol. 2013, 47, 765–772. [Google Scholar] [CrossRef] [PubMed]
- Ciani, A.; Goss, K.U.; Schwarzenbach, R.P. Determintation of molar absorption coefficients of organic compounds adsorbed in porous media. Chemosphere 2005, 6, 1410–1418. [Google Scholar] [CrossRef] [PubMed]
- Kubelka, P.; Munk, F. An article on optics of paint layers. Z. Tech. Phys. 1931, 12, 593–601. [Google Scholar]
- Ciani, A.; Goss, K.U.; Schwarzenbach, R.P. Photodegradation of organic compounds adsorbed in porous mineral layers: Determination of quantum yields. Environ. Sci. Technol. 2005, 39, 6712–6720. [Google Scholar] [CrossRef] [PubMed]
- Chen, Y.; Wang, K.; Lou, L. Photodegradation of dye pollutants on silica gel supported TiO2 particles under visible light irradiation. J. Photochem. Photobiol. A Chem. 2004, 163, 281–287. [Google Scholar] [CrossRef]
- Yue, Y.D.; Hua, R.M.; Tang, F.; Chen, X.Y. Effect of soil particle size on distribution and photodegradation of selected pesticides in soil. J. Anhui Agric. Univ. 1993, 20, 309–314. [Google Scholar]
- Ahn, M.Y.; Filley, T.R.; Jafvert, C.T.; Nies, L.; Hua, I.; Bezares-Cruz, J. Photodegradation of decabromodiphenyl ether adsorbed onto clay minerals metal oxides and sediment. Environ. Sci. Technol. 2006, 40, 215–220. [Google Scholar] [CrossRef] [PubMed]
- Feng, W.; Nansheng, D. Photochemistry of hydrolytic iron(III) species and photoinduced degradation of organic compounds. A minireview. Chemosphere 2000, 41, 1137–1147. [Google Scholar] [CrossRef]
- Louit, G.; Foley, S.; Cabilic, J.; Coffigny, H.; Taran, F.; Valleix, A.; Renault, J.P.; Pin, S. The reaction of coumarin with the OH radical revisited: Hydroxylation product analysis determined by fluorescence and chromatography. Radiat. Phys. Chem. 2005, 72, 119–124. [Google Scholar] [CrossRef]
- Katagi, T. Photoinduced oxidation of the organophosphorus fungicide toclofos methyl on clay minerals. J. Agric. Food Chem. 1990, 38, 1595–1600. [Google Scholar] [CrossRef]
- Bianco Prevot, A.; Pramauro, E.; De la Guardian, M. Photocatalytic degradation of carbaryl in aqueous TiO2 suspensions containing surfactants. Chemosphere 1999, 39, 493–502. [Google Scholar] [CrossRef]
- Massey, K.A.; Van Engelen, D.L.; Warner, I.M. Dtermination of carbaryl as its prilary metabolite, 1-naphtol, by reversed-phase high performance chromatography with fluorometric detection. Talanta 1995, 42, 1457–1463. [Google Scholar] [CrossRef]
- Pramauro, E.; Bianco Prevot, A.; Vincenti, M.; Brizzolesi, G. Photocatalytic degradation of carbaryl in aqueous solutions containing TiO2 suspensions. Environ. Sci. Technol. 1997, 31, 3126–3131. [Google Scholar] [CrossRef]
- Anguiano, O.L.; Vacca, M.; Araujo, M.E.R.; Montagna, M.; Venturino, A.; Ferrari, A. Acute toxicity and esterase response to carbaryl exposure in two different populations of amphipods Hyalella curvispina. Aquat. Toxicol. 2017, 188, 72–79. [Google Scholar] [CrossRef] [PubMed]
- Saxena, P.N.; Gupta, S.K.; Murthy, R.C. Comparative toxicity of carbaryl, carbofuran, cypermethrin and fenvalerate in Metaphire posthuma and Eisenia fetid. Ecotoxicol. Environ. Saf. 2014, 100, 218–225. [Google Scholar] [CrossRef] [PubMed]
- Lima, M.P.R.; Cardoso, D.N.; Soares, A.M.V.M.; Loureiro, S. Carbaryl toxicity prediction to soil organisms under high and low temperature regimes. Ecotoxicol. Environ. Saf. 2015, 114, 263–272. [Google Scholar] [CrossRef] [PubMed]


| Z (µm) | 25 | 50 | 100 | 150 | 250 |
| kZ (h−1) | 0.096 | 0.049 | 0.024 | 0.011 | 0.006 |
| kZ × Z (h−1 µm) | 2.4 | 2.5 | 2.4 | 1.7 | 1.25 |
| Kaolin | Silica | Sand | |
|---|---|---|---|
| Particle size (µm) | 5 | 10 | 310 |
| Specific surface (m²/g) | 15 | 294 | 0.1 |
| Pore size (nm) | 30–100 | 20 | 40–150 |
| Silicon (wt %) | 54.2 | 99.1 | 95.4 |
| Iron (wt %) | 2.6 | 0.00 | 0.1 |
| Titanium (wt %) | 0.9 | 0.00 | 0.1 |
| Kaolin | Silica | Sand | |
|---|---|---|---|
| k (h−1) | 0.075 | 0.092 | 0.12 |
| % of conversion after 5 h | 35 | 46 | 38 |
| Product | tret min | Accurate Mass [M + H]+ (m/z) | Elemental Composition | Mass Error ppm | Proposed Structure |
|---|---|---|---|---|---|
| Carbaryl | 12.7 | 202.0875 | C12H12O2N+ | +3.4 | 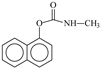 |
| P1 | 13.4 | 175.0379 | C10H7O3+ | −9.3 |  |
| P2 | 14.2 | 145.0663 | C10H9O+ | +6.6 |  |
| P3 | 11.0 | 189.0543 | C11H9O3+ | −4.6 |  |
| P4 | 9.6 | 202.0862 | C12H12O2N+ | −3.0 | 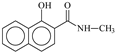 |
| P5 | 9.4 | 218.0810 | C12H12O3N+ | −3.3 |  |
© 2019 by the authors. Licensee MDPI, Basel, Switzerland. This article is an open access article distributed under the terms and conditions of the Creative Commons Attribution (CC BY) license (http://creativecommons.org/licenses/by/4.0/).
Share and Cite
Siampiringue, M.; Chahboune, R.; Wong-Wah-Chung, P.; Sarakha, M. Carbaryl Photochemical Degradation on Soil Model Surfaces. Soil Syst. 2019, 3, 17. https://doi.org/10.3390/soilsystems3010017
Siampiringue M, Chahboune R, Wong-Wah-Chung P, Sarakha M. Carbaryl Photochemical Degradation on Soil Model Surfaces. Soil Systems. 2019; 3(1):17. https://doi.org/10.3390/soilsystems3010017
Chicago/Turabian StyleSiampiringue, Marie, Rajae Chahboune, Pascal Wong-Wah-Chung, and Mohamed Sarakha. 2019. "Carbaryl Photochemical Degradation on Soil Model Surfaces" Soil Systems 3, no. 1: 17. https://doi.org/10.3390/soilsystems3010017
APA StyleSiampiringue, M., Chahboune, R., Wong-Wah-Chung, P., & Sarakha, M. (2019). Carbaryl Photochemical Degradation on Soil Model Surfaces. Soil Systems, 3(1), 17. https://doi.org/10.3390/soilsystems3010017