Article

Conversion of a Semiarid Nevada Soil to Irrigated Agriculture Preferentially Removes Labile Carbon

by
Brittany R. Trimble
1,
Francisco J. Calderon
2,
Simon R. Poulson
3 and
Paul S. J. Verburg
1,*
1
Department of Natural Resources and Environmental Science, University of Nevada, Reno, NV 89557, USA
2
Agricultural Research Service, United States Department of Agriculture, Akron, CO 80720, USA
3
Department of Geological Sciences and Engineering, University of Nevada, Reno, NV 89557, USA
*
Author to whom correspondence should be addressed.
Soil Syst. 2018, 2(3), 38; https://doi.org/10.3390/soilsystems2030038
Submission received: 21 March 2018 / Revised: 13 May 2018 / Accepted: 15 June 2018 / Published: 22 June 2018
(This article belongs to the Special Issue Soil Organic Matter Dynamics)

Abstract

:
Due to the scarcity of arable land, semiarid rangelands are often converted to irrigated croplands, which is likely to affect soil organic carbon (SOC) due to changes in C inputs into the soil and environmental factors regulating decomposition. In this study, soil density and particle size fractions as well as their C and N contents, stable isotopic composition, and chemical characterization by mid-infrared spectroscopy were measured in a native shrubland and an adjacent agricultural site under alfalfa cultivation for at least 50 years in western Nevada. Cultivation significantly reduced the amount of C and N in the surface soils and the proportion of C present in the labile fractions. The δ13C and δ15N values of the SOC reflected dominant vegetation types at each site, and suggested most SOC was root-derived. The potential decomposition rate of SOC was higher in the shrubland than in the alfalfa surface soil reflecting the larger amount of labile C present in the shrubland soils. Spectroscopy results suggested that the greater recalcitrance of the alfalfa soils was due to insoluble SOC moieties. Additional analyses of buried, SOC-rich, A horizons at both sites showed that slower decomposition of ‘deep’ SOC was due to lower substrate quality supported by fractionation and spectroscopy data. The results of this study showed that converting a semiarid shrubland into irrigated cropland significantly reduced SOC content but increased overall stability of residual SOC.

1. Introduction

Soils represent one of the largest pools of carbon (C) on Earth, approximately 67% of which is in the form of organic C [1,2,3,4,5]. This soil organic carbon (SOC) pool contains more C than is stored in the atmosphere and living vegetation combined [2] and has a slow turnover rate, allowing for longer residence times than most other global C pools [2,6,7]. Soil C sequestration is affected by a number of processes, including inputs of C through net primary productivity [8,9], decomposition [3,10], inorganic C dynamics [1,11,12,13], and C uptake by biological soil crusts [14,15,16,17].
Soils in arid and semiarid regions typically have smaller C contents than more mesic regions, yet ~41% of the global area is occupied by drylands [18]. Soils in drylands contain approximately 241 Pg organic C and at least as much inorganic C [19], representing 21% of the global soil C pool (~2300 Pg; [1,3,20]). Although the C content of dryland soils is typically lower than soils in more mesic regions, recent research has shown that dryland ecosystems can have surprisingly high C uptake fluxes, some of which may be attributed to C uptake in soils, suggesting that these ecosystems have the potential to be important sinks for atmospheric CO2 [13,21,22].
Croplands comprise approximately 25% of drylands globally [18,23] with irrigated cropland exceeding 271 million hectares, an amount that is expected to grow due to the ever-increasing global population [24]. Conversion of native rangelands to irrigated agriculture is likely to have a profound effect on SOC due to changes in C inputs into the soil, tillage activities, and climatic variables regulating decomposition [25]. A change in the size of the SOC pool could have large implications on atmospheric CO2 levels [2,6,25,26,27,28,29] because of the vast land area occupied by drylands and the potentially large effects of disturbance due to the low organic matter (OM) contents and poor aggregate stability of these soils [30,31].
Several studies have addressed the effects of land-use change on SOC dynamics in semiarid shrublands [26], forests [25,32,33,34,35], and grasslands [36,37,38,39]. In general, the conversion from native vegetation to cropland results in a reduction of SOC due to a decrease in C inputs into the soil and increased C outputs through crop harvesting, eluviation, erosion, and microbial decomposition [6,7,37,40,41,42,43]. The turnover rate for SOC in undisturbed drylands is typically low due to low annual precipitation that limits decomposition. As a result, partially and/or completely undecomposed particulate organic matter (POM) from litter and roots can accumulate in the surface horizons [7,26,27,36,44,45,46,47]. Previous studies have shown that POM in soils typically easily decomposes due to its accessibility and generally labile chemical composition, making it very sensitive to management practices [46]. Additionally, POM acts as a nucleus in aggregate formation [48,49]. As a result, the impact of land conversion on SOC may be more pronounced in dryland soils than in soils in more mesic regions, particularly for the labile fractions including POM [25,37,46,47]. Indeed, losses of SOC upon conversion of native vegetation to (irrigated) agriculture are typically large. For instance, in southern Ethiopia, conversion of Acacia woodland to farmland resulted in a 10% loss of C contained in the top 10 cm of the soil after 20 years [34]. Additionally, Qiu et al. [37] calculated a 57% decrease in SOC in the top 10 cm of a semiarid grassland soil in the Loess Plateau of China approximately 20 years following conversion to cropland.
The chemical composition of SOC has traditionally been thought to be the main control on microbial decomposition, but recent research suggests that ecosystem properties may be more important for long-term decomposition, while the molecular structure of the SOC initially influences decomposition rates [45]. Microbial activity largely depends on soil temperature and water availability [45,46,50,51]. In drylands, microbial decomposition is water-limited [45,51,52] and microbial activity is typically controlled by periodic episodes of precipitation that result in brief increases in microbial activity [53,54,55]. As a result, irrigation is likely to alleviate moisture limitations for decomposition of SOC, potentially resulting in C losses from soils. Spatial distribution of vegetation represents another important control on microbial activity [56,57,58]. In most dryland ecosystems, bare soil is common since plant cover is typically less than 75% [55], and soil properties such as texture, SOC content, and bulk density can differ considerably between bare soil and soil under vegetation. For example, Schaeffer and Evans [57] observed higher microbial activity following precipitation events under shrub canopies due to the larger amount of SOC present beneath canopies compared with interspace areas in an arid ecosystem in Colorado. Conversion of areas with a discontinuous vegetative cover will likely affect both the quantity and quality of SOC as native vegetation is replaced by annual and/or perennial agricultural crops and effects of conversion may be different for vegetated compared to interspace areas.
In this paper, we quantified differences in soil C fractions between surface soils in shrublands and adjacent areas that have been under irrigated agriculture for at least 50 years near Reno, NV. During soil characterization, we found a buried, organic matter-rich, A horizon at 1 m depth in both the alfalfa and the shrubland sites, providing us with the opportunity to assess effects of management and controls on decomposition of SOC preserved at depth following deposition of alluvial materials. Previous research has studied differences in density fractions in semiarid shrublands between vegetated and bare soils [59,60,61], but few if any studies assessed changes in density fractions in response to land use change. Here we present a detailed examination of differences in density and particle size fractions between shrubland and irrigated croplands in combination with stable isotope analyses, chemical characterization, and measurement of microbial respiration to assess C quality. We expected that differences between the dominant vegetation types would be reflected in the properties of SOC, including relative amounts of labile vs. stable C, C/N ratio, δ13C and δ15N isotopic composition, and other properties of bulk soil and individual fractions. In an eight-week laboratory incubation study, we assessed the decomposability of the SOC present in surface soils and buried A horizons from each site under optimal temperature and moisture conditions.

2. Materials and Methods

2.1. Study Site

The study site is located at the University of Nevada-Reno Agricultural Experiment Station-Main Station Field Laboratory. This property consists of more than 320 hectares located on the eastern boundary of Reno (39°30′36.09″ N 119°43′45.93″ W) at an elevation of 1338 m above sea level. Agricultural fields have been under irrigation for over 50 years with a variety of crops and grazing regimes. Most of the fields on the property are irrigated with treated effluent from a nearby wastewater facility but the amounts of C added to the alfalfa soils through the effluent are negligible. Before conversion to agricultural lands in the 1950s, the area was most likely dominated by shrub-steppe vegetation. Mean annual precipitation is 195 mm. Mean maximum ambient temperature is highest in July, averaging 33 °C; temperature is lowest in January when the mean maximum is −4 °C. An agricultural field and an adjacent unmanaged shrubland on the property were selected as study sites for the project.
The agricultural site is an alfalfa (Medicago sativa L.) monoculture that is sprinkler-irrigated during the growing season and grazed by cattle when not used for alfalfa production. The alfalfa site was grazed by cattle in the winter of 2015 and the fall of 2016. In 2016, the alfalfa crop was harvested three times between May and September. Alfalfa is an herbaceous perennial legume that was historically brought to the USA from Asia as a multi-purpose forage crop [62]. Alfalfa fixes atmospheric N2 and is usually grown in monoculture and remains productive for up to six years. The adjacent unmanaged shrubland is about 800 m south of the alfalfa site and is dominated by rubber rabbitbrush (Ericameria nauseosa (Pall. ex Pursh) G.L. Nesom & Baird) and yellow rabbitbrush (Chrysothamnus viscidiflorus (Hook.) Nutt.) with mixed perennial grasses present in shrub interspace areas. Rabbitbrush is a perennial shrub with a deep taproot that is common in rangelands of the western USA [63,64]. These woody C3 plants typically inhabit elevations ranging from 200 to 3350 m. We recognize that the presence of rabbitbrush may indicate that some disturbance has occurred in the past, but the large size of the rabbitbrush on the site shows that the site has been dominated by shrub vegetation at the very least since the time when parts of the area were converted to irrigated agriculture. Both sites were located on the same floodplain based on a geomorphic assessment that included surveys of topography, elevation, and position relative to the river.
The surface soils (0–10 cm) at the agricultural site have a pH of 7.6 ± 0.2, and a bulk density of 1.21 ± 0.09 g cm−3. The surface soils (0–10 cm) at the shrubland site have a pH of 8.3 ± 0.1 with a bulk density of 0.87 ± 0.10 g cm−3 under shrub canopies, and a pH of 8.6 ± 0.1 with a bulk density of 0.95 ± 0.09 g cm−3 in canopy interspace areas. Soils at both sites belong to the Truckee series (fine-loamy, mixed, superactive, mesic Fluvaquentic Haploxerolls; [65]) formed in alluvium derived from mixed rocks.

2.2. Experimental Design

Five plots were randomly selected at the alfalfa site located at least eight m apart. In the shrubland, five plots were selected under a shrub canopy and five plots in an adjacent canopy interspace area with each pair of canopy-interspace plots being at least 20 m apart. Differences in plot proximity between study sites were due to limited availability of a suitable study area at the alfalfa site that would not interfere with farm operations since each plot contained permanently installed gas wells and soil temperature/moisture sensors as part of other ongoing studies. Each plot had a radius of one m and surface soils (0–10 cm) were sampled on the plot circumference 1 m from plot center at 0°, 120°, and 240°. Samples were bulked by plot and used for laboratory analyses. The buried, OM-rich, A horizon was sampled from a soil pit excavated at each site. In total, we had five sample materials for our study: surface soil from the alfalfa site; surface soil under shrub canopies and in shrub interspaces; buried A horizon from the alfalfa site; and buried A horizon from the shrubland. Soil samples were air dried and sieved with a 2 mm sieve prior to laboratory analyses.

2.3. Particle Size Fractionation

The soils from each plot were fractionated by particle size into sand and POM (50 µm–2 mm); silt (2–50 µm); and clay (<2 µm) fractions using the method by Kettler et al. [66]. Samples were oven-dried at 105°C to constant weight and suspended in a 0.5% mixture of DI water and sodium hexametaphosphate. Soil suspensions were shaken at low speeds for 16 h on a shaker table before being wet-sieved with a 50 µm sieve to separate out the sand and POM fraction from the silt and clay fractions. The sand and POM fraction was oven-dried at 55 °C to constant weight and stored. The leftover silt and clay solution was suspended and was left undisturbed for at least 90 min to allow the silt particles to settle, followed by decanting of the suspended clay solution. Both the clay and silt fractions were oven-dried at 105 °C, weighed, and stored. Each particle size fraction was finely ground using a Sampletek 200 vial rotator (Mavco Instruments, Science Hill, KY, USA) for isotope and chemical analyses. The particle size fractionation of the surface soil was conducted for each plot separately resulting in five replicates for the alfalfa, shrub canopy, and interspace soils but chemical characterization was done on composite samples for each soil. Each chemical analysis was performed in triplicate. For the buried A horizon, only one sample per site was taken but all analyses were conducted in triplicate.

2.4. Density Fractionation

The soils from each plot were also fractionated by density into three fractions: a free-floating light fraction; an occluded (light) fraction; and a heavy fraction using the method outlined by Sollins et al. [67]. The free-floating fraction typically consists of organic debris and is considered to be most labile whereas the occluded and heavy fractions contain more recalcitrant SOC [67]. Sodium polytungstate (NaPT) was added to DI water to adjust the density to 1.70 g cm−3. After vigorously mixing the soil in the NaPT solution, it was left for 48 h at room temperature, after which the suspended light fraction (<1.70 g cm−3) was aspirated. The remaining heavy material was mixed with the NaPT a second time and sonicated in an ice bath for five minutes to disrupt small aggregates. After allowing the suspended materials to settle for another 48 h, this occluded light fraction was aspirated. All fractions were rinsed separately with DI water in a centrifuge repeatedly and oven-dried at 105 °C. Density fractionation of the surface soil from each site was performed once for each plot, resulting in five samples each for the alfalfa, shrub canopy, and shrub interspace surface soils. The density fractionation for the buried layers was performed in triplicate, resulting in three samples each for the alfalfa and the shrubland buried A horizons. Each density fraction sample was finely ground using a Sampletek 200 vial rotator (Mavco Instruments) for isotope and chemical analyses.

2.5. Soil C, N, δ13C and δ15N

Each particle size and density fraction was analyzed for total soil C, N, and δ13C and δ15N isotopic composition. All soils, except for the alfalfa surface soil, showed effervescence after adding hydrochloric acid (HCl) to the soil during field sampling. Prior to isotope analysis, carbonates were removed using the acid-fumigation method [68]. One acid-fumigated and one non-fumigated sample of each fraction was weighed into 5 × 8 mm tin capsules (Costech Analytical Technologies, Inc., Valencia, CA, USA) for total C, total N, δ13C and δ15N isotopic analysis at the Nevada Stable Isotope Laboratory at UNR using a Eurovector elemental analyzer interfaced to a Micromass stable isotope ratio mass spectrometer, similar to the method described by Werner et al. [69]. Except for the alfalfa site buried A horizon sand and silt fractions, isotopic composition of fumigated and non-fumigated surface soil samples were similar, perhaps as a result of carbonate removal during the particle size and density fractionation processes. Consequently, for all fractions from each soil except for the alfalfa site buried A horizon sand and silt samples, we used the data for the non-fumigated samples. We were not able to analyze the amount of C present in the occluded fraction because the samples were too small for a reliable C, N, and isotopic analysis. The amount of C and N contained in the occluded fractions were calculated by subtracting C and N contained in the heavy and free-floating fraction from total soil C and N. The heavy, sand + POM and silt fractions from the alfalfa buried A horizon, and the silt fraction from the shrubland buried A horizon did not contain sufficient N for reliable δ15N analyses.
Above- and belowground vegetation samples were taken from the alfalfa, shrub canopy, and shrub interspace areas to assess the isotopic composition of vegetation. Samples were rinsed and oven-dried at 55 °C until constant weight. After drying, samples were ground using a Qiagen TissueLyser II (Qiagen, Germantown, MD, USA). Ground samples were analyzed for δ13C and δ15N isotopic compositions as described above.

2.6. Mid-Infrared Spectroscopy

The bulk soils and free-floating density fraction samples were dried at 60 °C and ground to a fine powder using an agate mortar and pestle prior to spectroscopic analysis. A Digilab FTS 7000 Fourier transform spectrometer (Varian, Inc., Palo Alto, CA, USA, now Agilent Technologies) was used to scan the samples in the mid infrared range (4000 to 400 cm−1). A Pike AutoDIFF accessory (Pike Technologies, Madison, WI, USA) was used to acquire diffuse reflectance spectra. KBr was used as background, and a deuterated triglycine sulfate detector and KBr beam splitter were used. A total of 64 co-added scans were used for each spectrum, at 4 cm−1 resolution. Spectral data were obtained as pseudo-absorbance, hereafter referred to as absorbance. Two replicate subsamples from each sample were scanned separately and averaged to obtain the spectrum for each sample. Assignments of spectral bands were based on Parikh et al. [70], unless noted otherwise. The average spectra for the different fractionations, soil layers, and land management types were obtained using the averaging feature of GRAMS/AI version 9.3 (Thermo Fisher Scientific Inc., Waltham, MA, USA).

2.7. Microbial Respiration

An eight-week laboratory incubation was performed to assess the susceptibility of SOC to decomposition in alfalfa and shrubland soils. Surface soils and buried A horizons were incubated at 60% water holding capacity at a constant temperature of 25 °C in 250 mL glass jars. Every seven days, the glass jars were opened and replenished with ambient air before closing the jars and taking a baseline CO2 sample from the headspace. Gas samples were taken using a 250 µL glass syringe through a septum installed in the lids of the incubation jars. Twenty-four hours after taking the baseline sample, another headspace sample was taken to quantify the CO2 accumulation over a 24-h period. Headspace samples were injected into a LI-COR LI-8100 Automated Soil CO2 Flux System (LI-COR Biosciences, Lincoln, NB, USA) configured for bench-top measurements. The 24-h respiration value was multiplied by seven to calculate weekly respiration rates allowing for calculation of cumulative CO2 production for the duration of the incubation. For the surface soils, we performed a single incubation for each plot, resulting in five samples each for the alfalfa, shrub canopy, and shrub interspace surface soils while five replicate incubations were performed for the buried A horizons.

2.8. Statistical Analyses

For each particle size and density fraction, we assessed differences in mass, total C and N, δ13C and δ15N isotopic composition among the alfalfa, shrub canopy, and canopy interspace soils using analysis of variance (ANOVA), followed by Tukey’s HSD post-hoc tests. Surface soil particle size and density fractionations were performed for each plot, resulting in five replicates for each surface soil. Particle size and density fractionation were carried out in triplicate for the buried A horizons but because we only sampled one pit per site, we did not include the buried horizons in the statistical analysis.
Differences in cumulative microbial respiration among the alfalfa, shrub canopy, and canopy interspace soils were analyzed using ANOVA, followed by Tukey’s HSD post hoc tests. A single soil incubation from each plot was performed, while bulked soils from the buried A horizons were incubated using five replicates. Again, only one pit was sampled at the alfalfa and shrubland sites so the data for the buried horizon were not included in the statistical analysis.
We recognize that the experimental design may be considered to be pseudo-replicated, in that we did not replicate our study across multiple floodplains with paired cultivated and shrubland sites. Instead, we present a detailed examination of cultivated and reference soils on a single floodplain, with sites within relatively close proximity to ensure maximum uniformity of soils. Soils on floodplains exhibit variation in properties due to differences in sedimentation conditions. Our experimental layout was designed to maximize soil uniformity while replicating across space, allowing us to identify effects of land use on soil properties. All analyses were performed in JMP® 13 (Version 13, SAS Institute Inc., Cary, NC, USA). Probability levels ≤ 0.05 were considered to be statistically significant.

3. Results

3.1. .Particle Size and Density Fraction Mass

The particle size distribution differed between the alfalfa and shrubland soils, with the sand content being more than twice as high in the alfalfa surface soil compared to the shrubland surface soils, whereas the silt, clay, and POM contents were lower in alfalfa than in shrubland surface soils (Figure 1A). Within the shrubland site, surface soil texture was similar between canopy and interspace areas. The patterns of particle size distribution in the buried layer resembled those in surface soils, with the alfalfa soils having higher sand concentration and lower silt and clay concentration than the shrubland soils. The POM concentration was similar in both buried A horizons, but was much lower than in the surface soils.
Density fraction analysis showed that more than 90% of the surface soil material was present as the heavy fraction, and the alfalfa surface soil contained a larger percentage of heavy material than the shrubland surface soils (Figure 1B). Approximately 75% of the light (= free-floating + occluded) fraction in the shrubland surface soils consisted of free-floating material, while less than 50% of the light fraction consisted of the free-floating fraction in the alfalfa surface soil. In the buried A horizons, more than 99% of the soil material was contained in the heavy fraction. The amount of light materials in the buried A horizons was similar between sites.

3.2. Carbon and Nitrogen

Total C and N concentrations were significantly lower in the alfalfa surface and buried horizons than in the shrubland soils (Figure 2). When accounting for differences in bulk density, C stocks were 2.55 ± 0.17, 3.11 ± 0.30, and 3.78 ± 0.33 kg C m−2 for the alfalfa, shrubland canopy, and shrubland interspace surface soils respectively, all of which were significantly different from each other. Total N stocks were 0.10 ± 0.01, 0.11 ± 0.01, and 0.14 ± 0.01 kg N m−2, for the alfalfa, shrubland canopy, and shrubland interspace surface soils respectively, with N content in the interspace soil being significantly higher than both other soils.
The proportion of C and N in the clay fraction was significantly higher in the alfalfa than in the shrubland surface soils, but C and N contained in silt and sand + POM fractions were similar in all soils (Figure 3A). In the buried layers, the proportions of C and N were larger in the clay fraction and smaller in the sand/POM fraction than in the surface soils. Density fractionation data showed that the proportions of C and N in the light (= free-floating + occluded) fraction were smaller in the alfalfa than in the shrubland surface soils, while C and N contained in the heavy fraction was higher in the alfalfa surface soils (Figure 3B). In both shrubland surface soils, almost 40% of the total C was contained in the light fraction even though the mass of the light fraction was only approximately 8%. In both alfalfa and shrubland surface soils, the light fraction contained equal amounts of C (and N) in free-floating and occluded fractions. In the buried horizons, proportionally more C and N was contained in the light fractions in the alfalfa soil compared to the shrubland soil, especially for the occluded fraction. The proportional amounts of C and N in the light fraction of the alfalfa buried A horizons were comparable to the surface soils despite the mass fractions of light material being much lower in the buried A horizons compared to surface soils (Figure 1B and Figure 3B).
The C/N ratios of the sand + POM, clay, and free-floating fractions were significantly lower in the alfalfa than in shrubland surface soils (Table 1). The C/N ratios of all fractions were lower in the buried horizon of the alfalfa compared to the shrubland buried horizon. In general, the C/N ratios of all texture and density fractions were higher in the buried vs. surface horizons except for the sand + POM fraction at the alfalfa site. Generally, the C/N ratios decreased in the following order; POM + sand > silt > clay, and light fraction > heavy fraction. The C/N ratios of above- and belowground vegetation were much higher at the shrubland than at the alfalfa site (Table 1).

3.3. Stable Isotope Composition

The δ13C values for all particle size fractions were statistically similar in the surface soils of both sites (Figure 4A). The δ13C of the free-floating and heavy fractions were isotopically lighter in the alfalfa than the shrubland surface soils. The heavy density fraction of the alfalfa surface soil and shrubland buried layer had similar δ13C values, but these were isotopically lighter than all other soils. The heavy density fraction in the alfalfa buried layer had the heaviest isotopic value of all soils.
The δ15N values were isotopically lighter for the sand + POM fraction in the alfalfa compared to the shrubland canopy surface soils, but δ15N was isotopically heavier in the clay fraction of the alfalfa than both shrubland surface soils (Figure 4B). The δ15N of the silt fraction was similar in both sites. The trends in δ15N values for the free-floating fraction were similar to those of the sand + POM fraction with the alfalfa surface soil having an isotopically lighter value compared to the shrubland canopy surface soil, but we did not observe differences between sites for the heavy density fraction. The %N was too low in the sand + POM and silt fractions to obtain reliable δ15N measurements for the buried A horizons, but the δ15N values for the clay fraction were isotopically heavier in the alfalfa than in the shrubland buried A horizon. The δ15N was similar in the free-floating fraction of the buried A horizon at both sites.
The above- and belowground parts of the rabbitbrush and alfalfa had similar δ13C values, reflecting C3 plants, but the grasses in the interspace areas had much heavier δ13C values consistent with the presence of C4 vegetation (Figure 4A) even though the C/N ratios of canopy and interspace aboveground vegetation were similar (Table 1). The δ15N values for above- and belowground rabbitbrush vegetation were isotopically heavier than alfalfa and the interspace grasses (Figure 4B).

3.4. Mid-Infrared Spectroscopy

The mid-infrared spectra from the bulk soil showed chemical differences in response to management and soil depth (Figure 5A). The surface soil samples, particularly the alfalfa surface soil, had prominent absorbance at the aliphatic CH band at 2930–2850 cm−1. The alfalfa surface soil displayed a shoulder of increased absorbance at 1400–1270 cm−1 (aliphatic C, carboxylate or ester C-O) but this shoulder was not very prominent in the shrubland surface soils. Both shrubland surface soils showed a peak at 1470–1440 cm−1 (amide II, aromatic stretch, C-O, carbonates; [71]) but this peak was absent in the spectrum of the alfalfa surface soil. The two buried horizons had different spectral properties, with the alfalfa buried horizon having higher absorbance at 1120 cm−1 (polysaccharide C-O-C, C-O) and at 1580–1400 cm−1 (aromatic C=C, and CH).
The mid-infrared spectra of the free-floating fractions also indicated chemical differences between the sites and layers (Figure 5B). The surface soil spectra, especially at the alfalfa site, had high absorbance at 1160–1000 cm−1 (polysaccharide C-O-C, C-O) relative to the buried horizons. The polysaccharide band around 1160 cm−1 coincides with the Si-O specular reflection band in bulk soils, but the free-floating fraction should not suffer from this artifact because of a smaller presence of mineral particles. The shoulder at 1735 cm−1 (carboxylic acid/carbonyl C=O) and the peak at 2930–2850 cm−1 (aliphatic CH) were more pronounced in the buried horizon free-floating fraction from the shrub location compared to the surface soils.

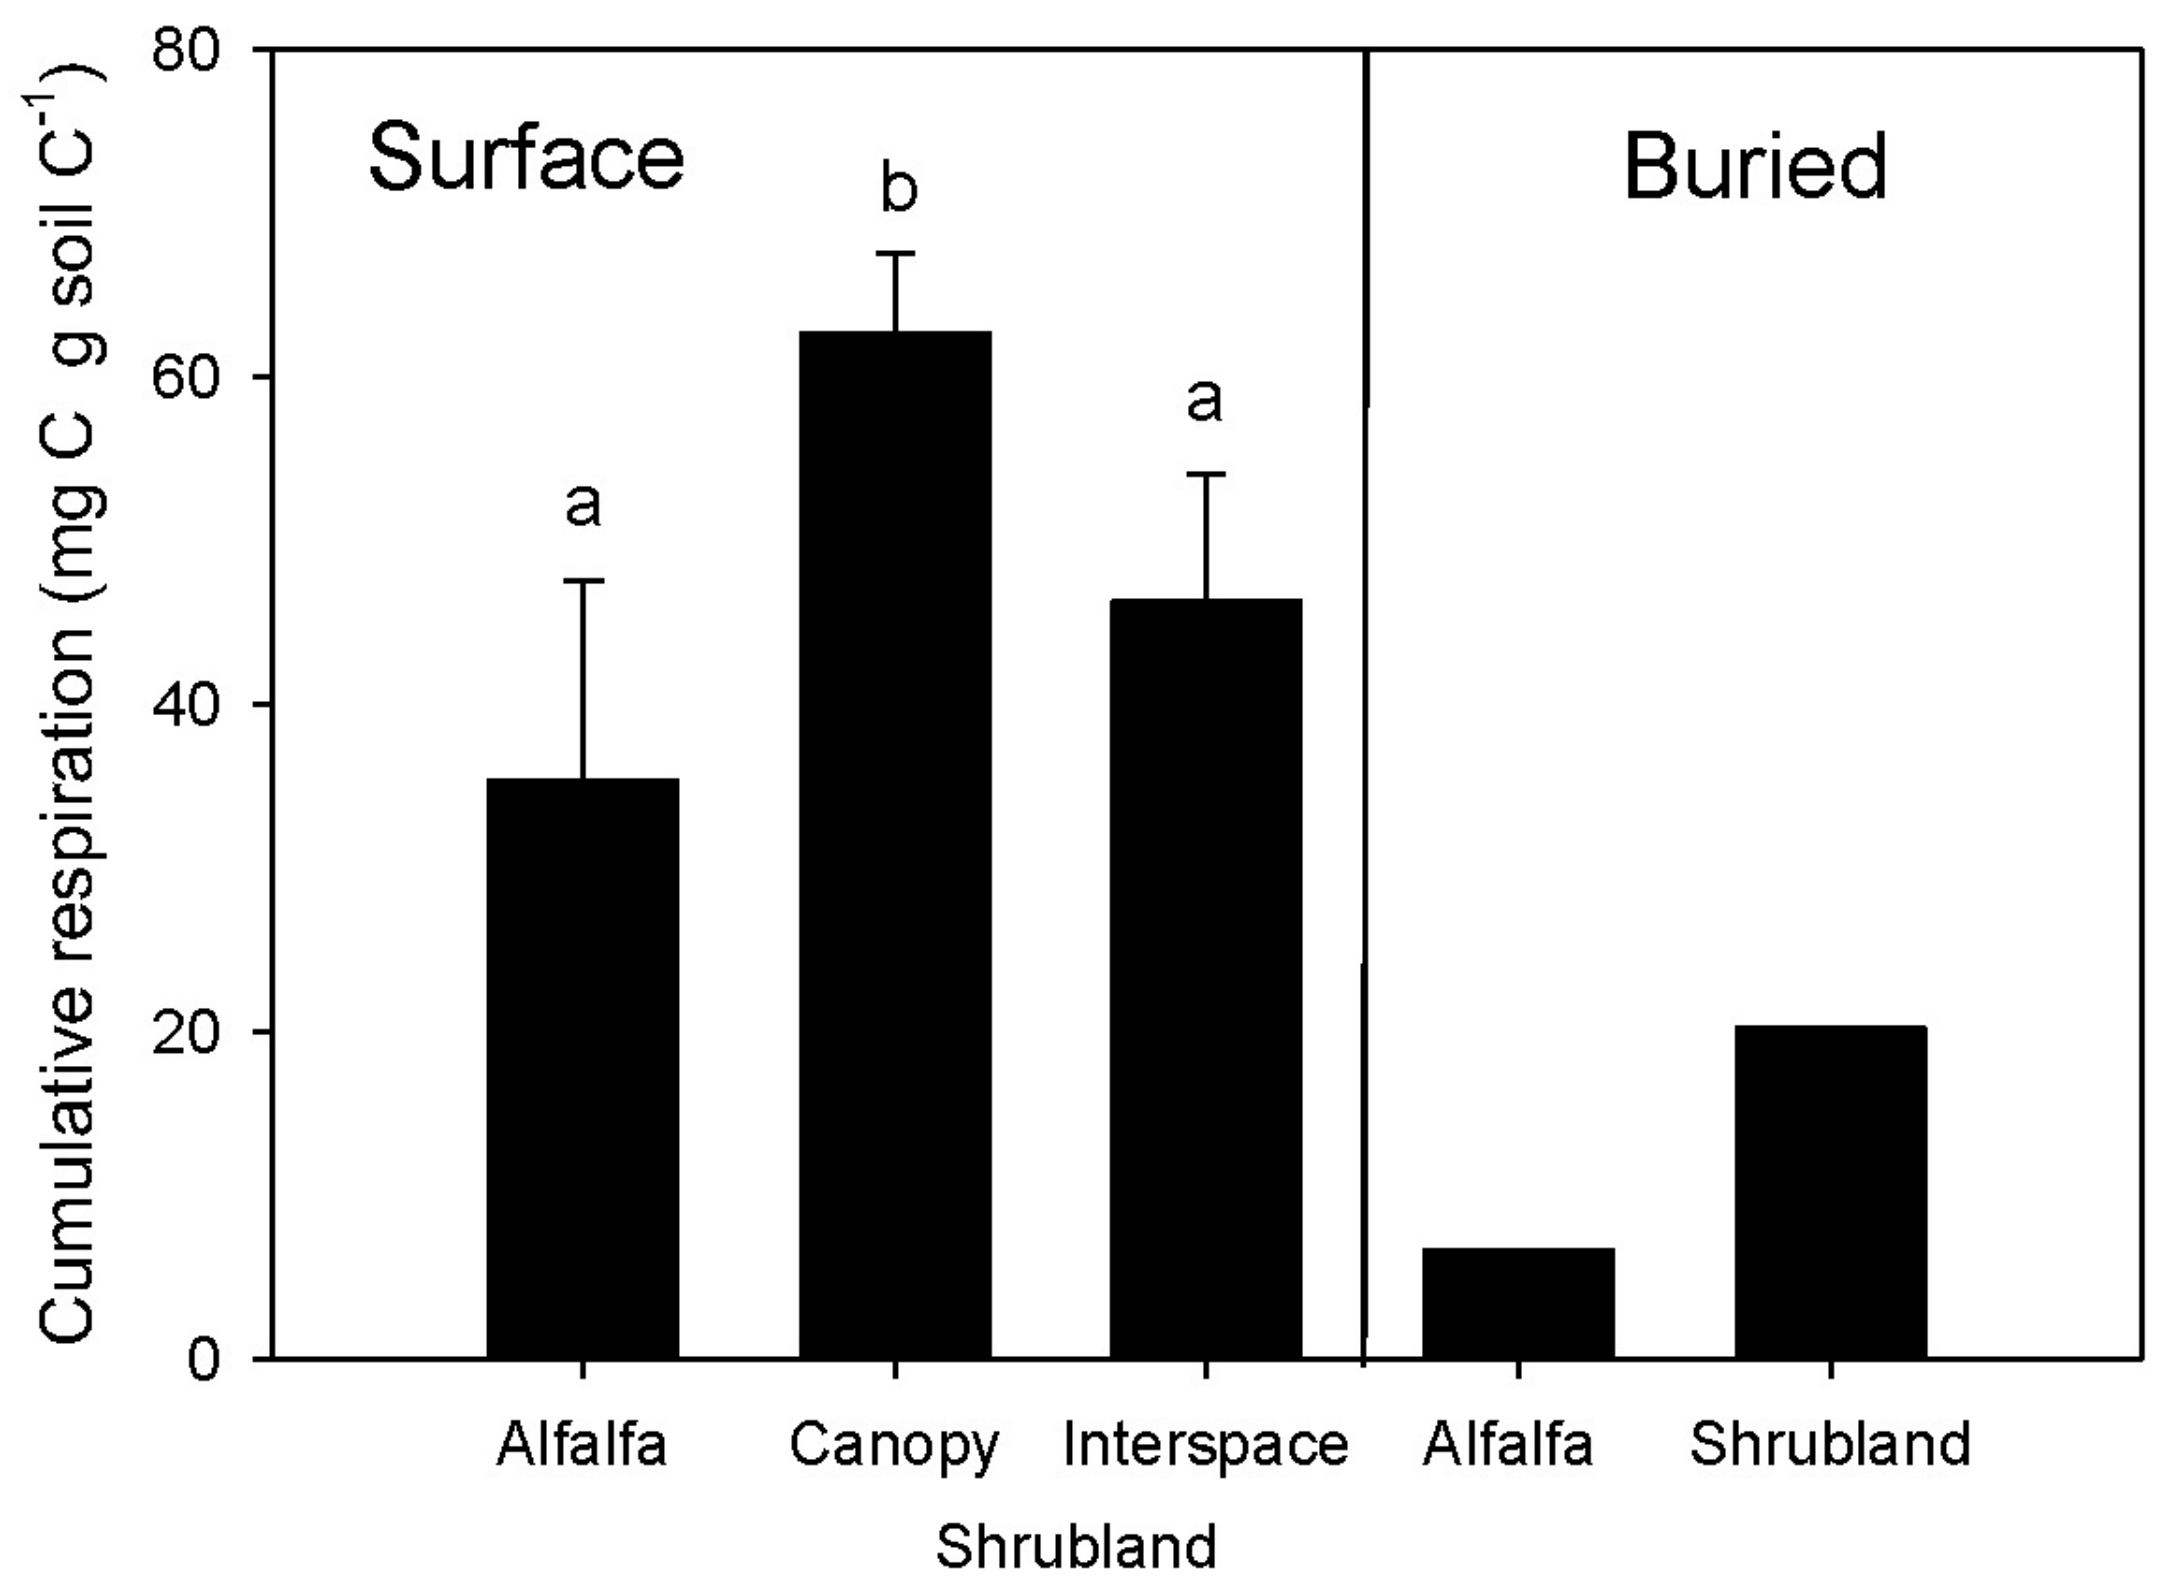
3.5. Microbial Respiration

Cumulative microbial CO2 production normalized by organic C content (expressed as mg respired C per g soil C) was lower in the alfalfa than in the shrubland canopy surface soil but similar to the shrub interspace surface soil (Figure 6). Cumulative CO2 production was much lower in the buried horizons than in the surface soils, but similar to the trends observed in the surface soil, cumulative respiration in the buried horizons was lower at the alfalfa than at the shrubland site.

4. Discussion

Our study showed that, over multi-decadal timescales, conversion of a semiarid shrubland to irrigated agriculture could result in an overall loss of soil C and N due to a combination of harvesting aboveground biomass and removal of water stress allowing for greater rates of SOC decomposition. Furthermore, proportions of C and N contained in the light fraction (= free-floating + occluded fractions) were lower in agricultural relative to shrubland surface soils. Changes in OM quality were reflected by reductions in decomposition rates under optimal conditions in managed vs. unmanaged surface soils. At both sites, SOC appeared to be mostly root-derived, and alfalfa contributed to SOC formation in the agricultural soil since conversion, based on isotopic data. Furthermore, SOC in the clay and heavy fractions appeared to be more highly decomposed in the alfalfa soil relative to the shrubland soil, suggesting increased stability of residual SOC in the alfalfa soils. Finally, data from buried A horizons showed that decomposability of ‘preserved’ C was limited by substrate quality more so than environmental conditions.
The eight-week laboratory incubation showed that microbial respiration (expressed per gram of soil C) was lower in the alfalfa than in shrub canopy surface soils (Figure 6), indicating the presence of less labile C in the alfalfa compared to shrubland surface soils. The density and particle size fractionation data showed that the alfalfa surface soils contained smaller proportions of C and N in the light density fraction and larger proportions in the clay and heavy fractions than both shrubland surface soils (Figure 3). The free-floating SOC fraction is thought to contain relatively undecomposed plant residues, has a shorter turnover time than the other density fractions [72], and thus represents the most labile soil C. Despite the relative SOC recalcitrance observed in the alfalfa surface soils during the incubation, the mid-infrared spectroscopy data showed that the free-floating fraction of the alfalfa surface soils had chemical properties that indicate that this fraction is relatively labile. The high absorbance at 1160–1000 cm−1, attributed to non-structural carbohydrates, would be consistent with higher decomposability (Figure 5B; [73]). The polar oxygen-containing groups such as C-O and C-O-C are considered to be labile [74]. In addition, the C/N ratio of the alfalfa free-floating fraction was lower than both the shrub canopy and interspace free-floating fractions (Table 1) suggesting higher decomposability [45]. The reduced C mineralization in the alfalfa surface soil most likely reflects an overall smaller proportion of light materials, possibly in combination with increased stability of the heavier soil fractions relative to the shrubland soils. Thus, decomposition was more limited by the quantity of labile OM rather than by its quality.
The mid-infrared spectra from the bulk soils confirmed differences in organic matter composition and indicated that bulk SOC was more resistant to decomposition under irrigated agriculture. The spectra show that the alfalfa surface soil has higher absorbance between 1270–1400 cm−1 than the shrubland soils (Figure 5A). This broad peak between 1270–1460 cm−1 is partially attributed to alkyl CH2 spectra common for agricultural soils [75]. Absorbance at ~1300 cm−1 has also been attributed to non-hydrolyzable, structurally disordered C networks present in humic substances [76]. Aliphatic CH absorbance at 2930–2850 cm−1 in our soils increased with total soil C agreeing with previous work in different soils (Figure 5A; [77]). Aliphatic CH absorbance in soils has also been related to hydrophobicity in soils [78]. We hypothesize that the greater recalcitrance of the alfalfa relative to the shrubland surface soils is due in part to the accumulation of insoluble long-chain hydrocarbons (such as waxes, suberins). Periodic irrigation could have resulted in the selective mineralization of more soluble or labile moieties, leaving behind the insoluble material.
The differences in organic matter quality are reflective of land use. The larger proportion of C and N contained in the light density fraction in the shrubland soils (Figure 3B) was most likely due to limited decomposition of labile OM in the shrubland in response to lower moisture conditions [79]. Irrigation most likely lifted the water stress from the alfalfa soil, encouraging decomposition of labile C [26,51,52,80]. Faster decomposition rates cause the breakdown of OM into smaller particles that allow for easier adsorption to mineral surfaces [81], and this sorption may explain why the alfalfa surface soil had a higher proportion of total C and N in the clay fraction than shrubland soils despite alfalfa soils having a lower clay content. Our results are consistent with other studies conducted in drylands that found a decrease in SOC in irrigated agricultural fields compared to native areas [5,7,25,26,82,83]. In most studies, decreases in SOC were due to preferential consumption of POM. In contrast, Fallahzade and Hajabbasi [84] observed a large increase in SOC upon conversion of native arid desert to alfalfa cultivation. However, annual precipitation was much lower in their study (60 mm) than in ours (195 mm), so native vegetation productivity was likely much more water-limited than ours relative to irrigated conditions. Differences in findings between their and our study suggest that effects of management on SOC is mediated by ambient moisture conditions. In addition, in our study, we found that the proportion of C in the POM fraction was not affected by land use but the proportion of C in the light fraction was lower in the alfalfa than shrubland soils suggesting that the density fractionation was a more robust method for identifying changes in SOC quality.
Differences in the C/N ratio, δ13C, and δ15N of the SOC—particularly in the free-floating fraction—are reflective of differences in vegetation type and are thus indicative of the origins of OM inputs at the alfalfa and shrubland sites (Table 1; Figure 4). The C/N ratios for alfalfa above- and belowground vegetation and free-floating fraction were significantly lower than shrubland canopy and interspace vegetation and surface soils, consistent with alfalfa being an N2-fixing species as opposed to rabbitbrush (Table 1). The lighter δ13C value of the free-floating and heavy fractions in the alfalfa surface soils appears to reflect the lighter δ13C value of the alfalfa roots compared to the rabbitbrush roots indicating that a large proportion of the SOC was root-derived at both sites (Figure 4A). The δ13C value of the rabbitbrush aboveground vegetation was significantly lighter than the δ13C values of the shrub soil fractions, further indicating that roots predominantly contributed to SOC formation. In addition, C4 grasses from shrub interspaces may have contributed to the shrub canopy SOC as C4 plants have a heavier δ13C value than C3 plants (Figure 4A). However, the significantly heavier δ13C values of the vegetation due to the presence of C4 grasses in the canopy interspaces were not reflected by δ13C values for the free-floating and POM fractions of the shrub interspace soil, suggesting that rabbitbrush-derived OM was likely the dominant contributor to shrub interspace SOC. Consequently, the presence of grasses appeared to have had a limited impact on shrubland SOC formation at our study site. The lighter δ15N value for the alfalfa sand + POM and free-floating fraction may reflect atmospheric N215N = 0‰) being the N source for this N-fixing species [85,86]. Conversely, the δ15N composition of SOC in the shrubland may reflect the δ15N of available mineral forms of N in the soil [85,86]. The δ13C value of the heavy density fraction was isotopically lighter in the alfalfa than in the canopy and/or interspace surface soil reflecting differences in δ13C values between alfalfa and rabbitbrush roots. These differences suggest that the slower cycling of recalcitrant SOC contained in the heavy density fraction in the alfalfa soils contains a significant amount of C derived from the alfalfa.
Both texture and density fractionation data showed that the difference in δ15N between labile (sand + POC and free-floating) and more recalcitrant (clay and heavy) fractions was larger in the alfalfa than in the shrubland surface soils (Figure 4B). The δ15N of organic matter has been shown to increase with increasing degree of decomposition [87,88,89] so our data suggest that organic matter in alfalfa soils is more highly processed than in shrubland soils. In contrast, δ13C values were similar across all fractions for each soil (Figure 4A), potentially because δ13C values tend to be relatively insensitive to degree of decomposition [89]. In addition, the OM present in the heavy density and clay fractions may contain more 13C-depleted plant-derived materials such as lignin rather than 13C-enriched materials such as cellulose and sugars [90]. Although the δ13C values were generally similar between fractions, the C/N ratios were much lower for the clay compared to silt and sand+POM fractions and the heavy fractions (compared to the light fractions), indicating progressive decomposition and thus increased SOC stability in the clay and heavy fractions.
We did not find large differences in total C and N or distribution of C and N across particle size and density fractions between canopy and interspace soils (Figure 2 and Figure 3) in contrast to other studies that have observed higher SOC content in the light density fraction of shrub canopy soils than in shrub interspace soils [59,60,61]. Potentially, shrub density at our site was higher than in other studies and, as a result, shrubs may have affected interspace areas more directly than in other studies, which is supported by the δ13C and δ15N data (Figure 4).
Our study showed that the alfalfa surface soils contained more sand and less clay and silt than shrubland soils (Figure 1A), but it is unclear if this difference can be fully ascribed to management activities or may also be influenced by differences in sedimentation conditions of the parent material given that both soils developed in alluvial deposits. Finding shrublands and agricultural sites with (initially) similar soils can be extremely challenging in this region, because most land that can be used for agriculture has long since been converted due to the scarcity of arable land. During our site selection, we ensured that both sites were on the same landform in the same soil type, and that both sites were in close proximity, to satisfy the assumption that the soils were similar prior to the start of cultivation. The lower silt and clay content in the alfalfa surface soil could have been due to long-term cultivation changing the particle size distribution of the soil by erosion or eluviation of finer particles out of the surface soil. For instance, Kozlovskii et al. [91] showed that tillage can cause clay eluviation rates of up to 0.9% of the initial amount per year, equivalent to a decrease in clay content by 45% over a 50 year period. Still, we cannot discount the possibility that differences in texture between sites reflect differences in initial soil conditions given spatial heterogeneity in alluvial settings. Despite uncertainties in the cause of particle size differences, the alfalfa soils contained larger amounts of total C and N in more stable clay fractions (Figure 3A) despite the clay content being lower (Figure 1A), suggesting that increased recalcitrance of SOC may have been caused by conversion of undisturbed shrublands into irrigated agriculture.
The presence of the buried A horizon at our study sites allowed us to test the hypothesis that organic matter present deeper in the soil may be stabilized due to unfavorable environmental conditions for decomposition rather than low substrate quality [45]. Our respiration data indicated that substrate limitations had a large impact on decomposition, potentially larger than environmental conditions. Microbial respiration rates expressed per g of soil C were much lower for the buried A horizon compared to the surface soil when soils were exposed to optimal temperature and moisture conditions (Figure 6). The lower microbial respiration rates most likely reflected the smaller proportions of POM and light materials in the buried compared to surface horizons (Figure 1). The mid-infrared spectra of the buried horizons showed absorbance patterns consistent with their increased aliphatic CH and carbonyl bands relative to the surface soils. The increased aliphatic CH in the buried horizons may indicate the presence of relatively high amounts of insoluble SOC that is not readily available for microbial processing (Figure 5). Surprisingly, more C appeared to be allocated to the light density fraction in the alfalfa than in the shrubland buried A horizon, while the opposite was true for the surface horizons (Figure 3B). Still, amounts of C and N contained in the sand + POM fraction was similar between sites and lower than in the surface horizons (Figure 3A). The δ15N value of most fractions of the buried layer in the shrubland was isotopically lighter than in the shrubland surface soils while C/N ratios were higher (Figure 4B; Table 1). These patterns are consistent with the observation by Amundson et al. [85] showing that δ15N values are inversely related to C/N ratios. However, the higher C/N ratio and lighter δ15N of the SOC in the buried A horizons compared to the surface horizons suggest that the SOC in the buried A horizon was less processed, while the respiration and spectroscopy data indicated the opposite. Potentially, the vegetation present during the development of this buried A horizon was different than the current vegetation.

5. Conclusions

Our study showed that the quantity and quality of the soil organic C differed between the native shrubland and areas subjected to irrigated agriculture for five decades. The particle size and C distribution in the surface soils was also different, with fewer fine particles being present in the cropland soil compared to the shrubland soil. Differences in texture between sites were likely related to tillage and irrigation resulting in loss of fine materials via erosion or eluviation at the managed site, but we cannot eliminate the possibility that these differences in texture may have been inherent given that soils developed in alluvial deposits. The alfalfa soils had lower SOC decomposition rates under optimal conditions and less C and N present in the bulk soil compared to the native shrubland soils. The shrubland soil contained more C in labile fractions that, when exposed to optimal environmental conditions, had higher decomposition rates than alfalfa soils. Those characteristics appeared to outweigh the presence of materials with lower C/N ratios in the alfalfa soils. The smaller amount of total and labile organic C in the alfalfa soils indicates that more decomposition had occurred in these soils in general since they are not water limited like the unmanaged shrubland. In addition, these differences in decomposition rates, as well as the degree of processing of SOC indicated by the isotopic results, are also reflected in the differences in C chemistry shown by the mid-infrared spectroscopy data. Our isotope data suggested that most of the SOC was root-derived, both in the alfalfa and shrubland soils. Furthermore, alfalfa contributed substantial amounts of OM to the formation of SOC, including C in the heavy fraction, over the ~50 year period since agricultural conversion. The proportion of C in the heavy fraction of the alfalfa soil was higher and appeared to be more microbially-processed than that of the shrubland soils, suggesting increased heavy-fraction SOC stability under alfalfa cultivation. Lastly, our study showed that decomposition of ‘deep’ organic matter appeared to be limited by substrate quality more so than environmental conditions. Overall, conversion of native rangelands to irrigated agriculture could result in a large release of C to the atmosphere as native organic matter decomposes, though the length of this pulse is uncertain. Over the long-term, our study also indicates that residual organic matter becomes more stable in alfalfa agricultural soils, thereby increasing turnover times and potentially making organic matter more resistant against future perturbations.

Author Contributions

B.R.T. and P.S.J.V. conceived and designed the experiments; B.R.T. performed the experiments; B.R.T., F.J.C., and P.S.J.V. analyzed the data; F.J.C. and S.R.P. contributed to the data collection and provided analytical capabilities; B.R.T. and P.S.J.V. wrote the paper.

Funding

This work was supported by the Nevada Agricultural Experiment Station/United States Department of Agriculture Formula Fund (Project NEV05288).

Acknowledgments

We thank Elana Ketchian for assistance with laboratory work. We thank Shauna Uselman and three anonymous reviewers for their valuable comments that greatly helped improve the paper.

Conflicts of Interest

The authors declare no conflict of interest.

References

  1. Emmerich, W.E. Carbon dioxide fluxes in a semiarid environment with high carbonate soils. Agric. For. Meteorol. 2003, 116, 91–102. [Google Scholar] [CrossRef]
  2. Jobbágy, E.G.; Jackson, R.B. The vertical distribution of soil organic carbon and its relation to climate and vegetation. Ecol. Appl. 2000, 10, 423–436. [Google Scholar] [CrossRef]
  3. Scharlemann, J.P.W.; Tanner, E.V.J.; Hiederer, R.; Kapos, V. Global soil carbon: Understanding and managing the largest terrestrial carbon pool. Carbon Manag. 2014, 5, 81–91. [Google Scholar] [CrossRef]
  4. Lal, R. Soil carbon dynamics in cropland and rangeland. Environ. Pollut. 2002, 116, 353–362. [Google Scholar] [CrossRef]
  5. Zhang, J.; Wang, X.; Wang, J. Impact of land use change on profile distributions of soil organic carbon fractions in the Yanqi Basin. Catena 2014, 115, 79–84. [Google Scholar] [CrossRef]
  6. Entry, J.A.; Sojka, R.E.; Shewmaker, G.E. Management of irrigated agriculture to increase organic carbon storage in soils. Soil Sci. Soc. Am. J. 2002, 66, 1957–1964. [Google Scholar] [CrossRef]
  7. Zach, A.; Tiessen, H.; Noellemeyer, E. Carbon turnover and carbon-13 natural abundance under land use change in semiarid savanna soils of La Pampa, Argentina. Soil Sci. Soc. Am. J. 2006, 70, 1541–1546. [Google Scholar] [CrossRef]
  8. Miller, R.E.; Huenneke, L.F. Size decline in Larrea tridentata (Creosotebush). Southwest Nat. 1996, 41, 248–250. [Google Scholar]
  9. Rundel, P.W.; Gibson, A.C. Ecological Communities and Processes in a Mojave Desert Ecosystem: Rock Valley, Nevada; Cambridge University Press: New York, NY, USA, 1996. [Google Scholar]
  10. Schlesinger, W.H.; Bernhardt, E.S. Biogeochemistry: An Analysis of Global Change, 3rd ed.; Academic Press: Oxford, UK, 2013. [Google Scholar]
  11. Lapenis, A.G.; Lawrence, G.B.; Bailey, S.W.; Aparin, B.F.; Shiklomanov, A.I.; Speranskaya, N.A.; Torn, M.S.; Calef, M. Climatically driven loss of calcium in steppe soil as a sink for atmospheric carbon. Glob. Biogeochem. Cycle 2008, 22. [Google Scholar] [CrossRef] [Green Version]
  12. Stevenson, B.A.; Verburg, P.S.J. Effluxed CO2-13C from sterilized and unsterilized treatments of a calcareous soil. Soil Biol. Biochem. 2006, 38, 1727–1733. [Google Scholar] [CrossRef]
  13. Xie, J.; Li, Y.; Zhai, C.; Li, C.; Lan, Z. CO2 absorption by alkaline soils and its implication to the global carbon cycle. Environ. Geol. 2009, 56, 953–961. [Google Scholar] [CrossRef]
  14. Li, X.R.; Wang, X.P.; Li, T.; Zhang, J.G. Microbiotic soil crust and its effect on vegetation and habitat on artificially stabilized desert dunes in Tengger Desert, North China. Biol. Fertil. Soils 2002, 35, 147–154. [Google Scholar]
  15. Li, X.R.; Zhang, P.; Su, Y.G.; Jia, R.L. Carbon fixation by biological soil crusts following revegetation of sand dunes in arid desert regions of China: A four-year field study. Catena 2012, 97, 119–126. [Google Scholar] [CrossRef]
  16. Su, Y.Z.; Wang, X.F.; Yang, R.; Lee, J. Effects of sandy desertified land rehabilitation on soil carbon sequestration and aggregation in an arid region in China. J. Environ. Manag. 2010, 91, 2109–2116. [Google Scholar] [CrossRef] [PubMed]
  17. Su, Y.; Lin, W.; Zhang, Y. Characteristics of carbon flux in two biologically crusted soils in the Gurbantunggut Desert, Northwestern China. Catena 2012, 96, 41–48. [Google Scholar] [CrossRef]
  18. Prǎvǎlie, R. Drylands extent and environmental issues. A global approach. Earth-Sci. Rev. 2016, 161, 259–278. [Google Scholar] [CrossRef]
  19. Eswaran, H.; Reich, P.F.; Kimble, J.M.; Beinroth, F.H.; Padmanabhan, E.; Moncharoen, P. Global carbon stocks. In Global Climate Change and Pedogenic Carbonates; Lal, R., Kimble, J.M., Eswaran, H., Stewart, B.A., Eds.; CRC/Lewis: Boca Raton, FL, USA, 2000. [Google Scholar]
  20. Batjes, N.H. Total carbon and nitrogen in the soils of the world. Eur. J. Soil Sci. 2014, 65, 4–21. [Google Scholar] [CrossRef]
  21. Jasoni, R.L.; Smith, S.D.; Arnone, J.A., III. Net ecosystem CO2 exchange in Mojave Desert shrublands during the eighth year of exposure to elevated CO2. Glob. Chang. Biol. 2005, 11, 749–756. [Google Scholar] [CrossRef]
  22. Wohlfahrt, G.; Fenstermaker, L.F.; Arnone, J.A., III. Large annual net ecosystem CO2 uptake of a Mojave Desert ecosystem. Glob. Chang. Biol. 2008, 14, 1475–1487. [Google Scholar] [CrossRef]
  23. Reid, W.V.; Mooney, H.A.; Cropper, A.; Capistrano, D.; Carpenter, S.R.; Chopra, K.; Dasgupta, P.; Dietz, T.; Duraiappah, A.K.; Hassan, R.; et al. Ecosystems and Human Well-Being: Synthesis, Millenium Ecosystem Assessment; Island Press: Washington, DC, USA, 2005. [Google Scholar]
  24. Wu, L.; Wood, Y.; Jiang, P.; Li, L.; Pan, G.; Lu, J.; Chang, A.C.; Enloe, H.A. Carbon sequestration and dynamics of two irrigated agricultural soils in California. Soil Sci. Soc. Am. J. 2008, 72, 808–814. [Google Scholar] [CrossRef]
  25. Albaladejo, J.; Ortiz, R.; Garcia-Franco, N.; Navarro, A.R.; Almagro, M.; Pintado, J.G.; Martínez-Mena, M. Land use and climate change impacts on soil organic carbon stocks in semi-arid Spain. J. Soils Sediments 2013, 13, 265–277. [Google Scholar] [CrossRef]
  26. Cochran, R.L.; Collins, H.P.; Kennedy, A.; Bezdicek, D.F. Soil carbon pools and fluxes after land conversion in a semiarid shrub-steppe ecosystem. Biol. Fertil. Soils 2007, 43, 479–489. [Google Scholar] [CrossRef]
  27. Tiessen, H.; Feller, C.; Sampaio, E.V.S.B.; Garin, P. Carbon sequestration and turnover in semiarid savannas and dry forest. Clim. Chang. 1998. [Google Scholar] [CrossRef]
  28. Urioste, A.M.; Hevia, G.G.; Hepper, E.N.; Anton, L.E.; Bono, A.A.; Buschiazzo, D.E. Cultivation effects on the distribution of organic carbon, total nitrogen and phosphorus in soils of the semiarid region of Argentinian Pampas. Geoderma 2006, 136, 621–630. [Google Scholar] [CrossRef]
  29. Wu, H.; Guo, Z.; Gao, Q.; Peng, C. Distribution of soil inorganic carbon storage and its changes due to agricultural land use activity in China. Agric. Ecosyst. Environ. 2009, 129, 413–421. [Google Scholar] [CrossRef]
  30. Huang, J.; Yu, H.; Guan, X.; Wang, G.; Guo, R. Accelerated dryland expansion under climate change. Nat. Clim. Chang. 2015, 6, 166–172. [Google Scholar] [CrossRef]
  31. Reynolds, J.F.; Smith, D.M.S.; Lambin, E.F.; Turner, B.L., II; Mortimore, M.; Batterbury, S.P.J.; Downing, T.E.; Dowlatabadi, H.; Fernández, R.J.; Herrick, J.E.; et al. Global desertification: building a science for dryland development. Science 2007, 316, 847–851. [Google Scholar] [CrossRef] [PubMed]
  32. Galbally, I.; Meyer, C.P.; Wang, Y.-P.; Kirstine, W. Soil-atmosphere exchange of CH4, CO, N2O and NOx and the effects of land-use change in the semiarid Mallee system in Southeastern Australia. Glob. Chang. Biol. 2010, 16, 2407–2419. [Google Scholar]
  33. Lal, R. Forest soils and carbon sequestration. For. Ecol. Manag. 2005, 220, 242–258. [Google Scholar] [CrossRef]
  34. Lemenih, M.; Itanna, F. Soil carbon stocks and turnovers in various vegetation types and arable lands along an elevation gradient in southern Ethiopia. Geoderma 2004, 123, 177–188. [Google Scholar] [CrossRef]
  35. Saha, D.; Kukal, S.S.; Sharma, S. Landuse impacts on SOC fractions and aggregate stability in typic ustochrepts of Northwest India. Plant Soil 2011, 339, 457–470. [Google Scholar] [CrossRef]
  36. Bonino, E.E. Changes in carbon pools associated with a land-use gradient in the Dry Chaco, Argentina. For. Ecol. Manag. 2006, 223, 183–189. [Google Scholar] [CrossRef]
  37. Qiu, L.; Wei, X.; Zhang, X.; Cheng, J.; Gale, W.; Guo, C.; Long, T. Soil organic carbon losses due to land use change in a semiarid grassland. Plant Soil 2012, 355, 299–309. [Google Scholar] [CrossRef]
  38. Zhao, W.Z.; Xiao, H.L.; Liu, Z.M.; Li, J. Soil degradation and restoration as affected by land use change in the semiarid Bashang area, northern China. Catena 2005, 59, 173–186. [Google Scholar] [CrossRef]
  39. Zhou, Z.; Sun, O.J.; Huang, J.; Li, L.; Liu, P.; Han, X. Soil carbon and nitrogen stores and storage potential as affected by land-use in an agro-pastoral ecotone of northern China. Biogeochemistry 2007, 82, 127–138. [Google Scholar] [CrossRef]
  40. Cates, A.M.; Ruark, M.D.; Hedtcke, J.L.; Posner, J.L. Long-term tillage, rotation and perennialization effects on particulate and aggregate soil organic matter. Soil Tillage Res. 2016, 155, 371–380. [Google Scholar] [CrossRef]
  41. Post, W.M.; Kwon, K.C. Soil carbon sequestration and land-use change: processes and potential. Glob. Chang. Biol. 2000, 6, 317–328. [Google Scholar] [CrossRef]
  42. Scanlon, B.R.; Reedy, R.C.; Bronson, K.F. Impacts of land use change on nitrogen cycling archived in semiarid unsaturated zone nitrate profiles, Southern High Plains, Texas. Environ. Sci. Technol. 2008, 42, 7566–7572. [Google Scholar] [CrossRef] [PubMed]
  43. Smith, P. Land use change and soil organic carbon dynamics. Nutr. Cycl. Agroecosyst. 2008, 81, 169–178. [Google Scholar] [CrossRef]
  44. Schlesinger, W.H.; Belnap, J.; Marion, G. On carbon sequestration in desert ecosystems. Glob. Chang. Biol. 2009, 15, 1488–1490. [Google Scholar] [CrossRef]
  45. Schmidt, M.W.I.; Torn, M.S.; Abiven, S.; Dittmar, T.; Guggenberger, G.; Janssens, I.A.; Kleber, M.; Kögel-Knabner, I.; Lehmann, J.; Manning, D.A.C.; et al. Persistence of soil organic matter as an ecosystem property. Nature 2011, 478, 49–56. [Google Scholar] [CrossRef] [PubMed] [Green Version]
  46. Six, J.; Conant, R.T.; Paul, E.A.; Paustian, K. Stabilization mechanisms of soil organic matter: Implications for C-saturation of soils. Plant Soil 2002, 241, 155–176. [Google Scholar] [CrossRef]
  47. Wu, H.; Guo, Z.; Peng, C. Land use induced changes of organic carbon storage in soils of China. Glob. Chang. Biol. 2003, 9, 305–315. [Google Scholar] [CrossRef]
  48. Bronick, C.J.; Lal, R. Soil structure and management: A review. Geoderma 2005, 124, 3–22. [Google Scholar] [CrossRef]
  49. Gillabel, J.; Denef, K.; Brenner, J.; Merckx, R.; Paustian, K. Carbon sequestration and soil aggregation in center-pivot irrigated and dryland cultivated farming systems. Soil Sci. Soc. Am. J. 2007, 71, 1020–1028. [Google Scholar] [CrossRef] [Green Version]
  50. Liu, W.; Zhang, Z.; Wan, S. Predominant role of water in regulating soil and microbial respiration and their responses to climate change in a semiarid grassland. Glob. Chang. Biol. 2009, 15, 184–195. [Google Scholar] [CrossRef]
  51. Stockmann, U.; Adams, M.A.; Crawford, J.W.; Field, D.J.; Henakaarchchi, N.; Jenkins, M.; Minasny, B.; McBratney, A.B.; de Courcelles, V.; Singh, K.; et al. The knowns, known unknowns and unknowns of sequestration of soil organic carbon. Agric. Ecosyst. Environ. 2013, 164, 80–99. [Google Scholar] [CrossRef]
  52. Yan, M.; Zhou, G.; Zhang, X. Effects of irrigation on the soil CO2 efflux from different poplar clone plantations in arid northwest China. Plant Soil 2013, 375, 89–97. [Google Scholar] [CrossRef]
  53. Austin, A.T.; Yahdjian, L.; Stark, J.M.; Belnap, J.; Porporato, A.; Norton, U.; Ravetta, D.A.; Schaeffer, S.M. Water pulses and biogeochemical cycles in arid and semiarid ecosystems. Oecologia 2004, 141, 221–235. [Google Scholar] [CrossRef] [PubMed]
  54. Hastings, S.J.; Oechel, W.C.; Muhlia-Melo, A. Diurnal, seasonal and annual variation in the net ecosystem CO2 exchange of a desert shrub community (Sarcocaulescent) in Baja California, Mexico. Glob. Chang. Biol. 2005, 11, 927–939. [Google Scholar] [CrossRef]
  55. Huxman, T.E.; Snyder, K.A.; Tissue, D.; Leffler, A.J.; Ogle, K.; Pockman, W.T.; Sandquist, D.R.; Potts, D.L.; Schwinning, S. Precipitation pulses and carbon fluxes in semiarid and arid ecosystem. Oecologia 2004, 141, 254–268. [Google Scholar] [CrossRef] [PubMed]
  56. Burke, I.C.; Reiners, W.A.; Schimel, D.S. Organic matter turnover in a sagebrush steppe landscape. Biogeochemistry 1989, 7, 11–31. [Google Scholar] [CrossRef]
  57. Schaeffer, S.M.; Evans, R.D. Pulse additions of soil carbon and nitrogen affect soil nitrogen dynamics in an arid Colorado Plateau shrubland. Oecologia 2005, 145, 425–433. [Google Scholar] [CrossRef] [PubMed]
  58. Sponseller, R.A. Precipitation pulses and soil CO2 flux in a Sonoran Desert ecosystem. Glob. Chang. Biol. 2007, 13, 426–436. [Google Scholar] [CrossRef]
  59. DeMarco, J.; Filley, T.; Throop, H.L. Patterns of woody plant-derived soil carbon losses and persistence after brush management in a semi-arid grassland. Plant Soil 2016, 406, 277–293. [Google Scholar] [CrossRef]
  60. Hooker, T.D.; Stark, J.M. Carbon flow from plant detritus and soil organic matter to microbes-Linking carbon and nitrogen cycling in semiarid soils. Soil Sci. Soc. Am. J. 2012, 76, 903–914. [Google Scholar] [CrossRef]
  61. Throop, H.L.; Lajtha, K.; Kramer, M. Density fractionation and 13C reveal changes in soil carbon following woody encroachment in a desert ecosystem. Biogeochemistry 2013, 112, 409–422. [Google Scholar] [CrossRef]
  62. Plant Guide for Yellow-Flowered Alfalfa (Medicago sativa subsp. falcata (L.) Arcang. Available online: https://www.nrcs.usda.gov/Internet/FSE_PLANTMATERIALS/publications/ndpmcpg12773.pdf (accessed on 3 August 2018).
  63. Plant Guide for Rubber Rabbitbrush (Ericameria nauseosa). Available online: https://plants.usda.gov/factsheet/pdf/fs_erna10.pdf (accessed on 3 August 2018).
  64. Plant Guide for Yellow Rabbitbrush (Chrysothamnus viscidiflorus). Available online: https://plants.usda.gov/plantguide/pdf/pg_chvi8.pdf (accessed on 3 August 2018).
  65. Soil Survey Staff. Keys to Soil Taxonomy, 12th ed.; USDA-NRCS: Washington, DC, USA, 2014.
  66. Kettler, T.A.; Doran, J.W.; Gilbert, T.L. Simplified method for soil particle-size determination to accompany soil-quality analyses. Soil Sci. Soc. Am. J. 2001, 65, 849–852. [Google Scholar] [CrossRef]
  67. Sollins, P.; Glassman, C.; Paul, E.A.; Swanston, C.; Lajtha, K.; Heil, J.W.; Elliott, E.T. Soil carbon and nitrogen: Pools and fractions. In Standard Soil Methods for Long-Term Ecological Research; Robertson, G.P., Coleman, D.C., Bledsoe, C.S., Sollins, P., Eds.; Oxford University Press: New York, NY, USA, 1999. [Google Scholar]
  68. Harris, D.; Horwáth, W.R.; van Kessel, C. Acid fumigation of soils to remove carbonates prior to total organic carbon or carbon-13 isotopic analysis. Soil Sci. Soc. Am. J. 2001, 65, 1853–1856. [Google Scholar] [CrossRef]
  69. Werner, R.A.; Bruch, B.A.; Brand, W.A. ConFlo III—An interface for high precision δ13C and δ15N analysis with an extended dynamic range. Rapid Commun. Mass Spectrom. 1999, 13, 1237–1241. [Google Scholar] [CrossRef]
  70. Parikh, S.J.; Goyne, K.W.; Margenot, A.J.; Mukome, F.N.; Calderón, F.J. Soil chemical insights provided through vibrational spectroscopy. Adv. Agron. 2014, 126, 1–148. [Google Scholar]
  71. Haberhauer, G.; Feigl, B.; Gerzabek, M.H.; Cerri, C. FT-IR spectroscopy of organic matter in tropical soils: Changes induced through deforestation. J. Appl. Spectrosc. 2000, 54, 221–224. [Google Scholar] [CrossRef]
  72. Calderón, F.J.; Reeves, J., III; Collins, H.P.; Paul, E.A. Chemical differences in soil organic matter fractions determined by diffuse-reflectance mid-infrared spectroscopy. Soil Sci. Soc. Am. J. 2011, 75, 568–579. [Google Scholar] [CrossRef]
  73. Cotrufo, M.F.; Soong, J.L.; Horton, A.J.; Campbell, E.E.; Haddix, M.L.; Wall, D.H.; Parton, W.J. Formation of soil organic matter via biochemical and physical pathways of litter mass loss. Nat. Geosci. 2015, 8, 776–779. [Google Scholar] [CrossRef]
  74. Ding, G.; Novak, J.M.; Amarasiriwardena, D.; Hunt, P.G.; Xing, B. Soil organic matter characteristics as affected by tillage management. Soil Sci. Soc. Am. J. 2002, 66, 421–429. [Google Scholar] [CrossRef]
  75. Haberhauer, G.; Gerzabek, M.H. Drift and transmission FT-IR spectroscopy of forest soils: An approach to determine decomposition processes of forest litter. Vib. Spectrosc. 1999, 19, 413–417. [Google Scholar] [CrossRef]
  76. Yang, Y.-H.; Wang, T. Fourier transform Raman spectroscopic characterization of humic substances. Vib. Spectrosc. 1997, 14, 105–112. [Google Scholar] [CrossRef]
  77. Matamala, R.; Jastrow, J.; Hofmann, S.; Mishra, U.; Michaelson, G.; Calderon, F.; Ping, C.-L.; Zhaosheng, F. Influence of site and soil properties on the DRIFT spectra of northern cold-region soils. Geoderma 2017, 305, 80–91. [Google Scholar] [CrossRef]
  78. Matejkova, S.; Simon, T. Application of FTIR spectroscopy for evaluation of hydrophobic/hydrophilic organic components in arable soil. Plant Soil Environ. 2012, 58, 192–195. [Google Scholar] [CrossRef]
  79. Six, J.; Paustian, K.; Elliott, E.T.; Combrink, C. Soil structure and organic matter: I. Distribution of aggregate-size classes and aggregate-associated carbon. Soil Sci. Soc. Am. J. 2000, 64, 681–689. [Google Scholar] [CrossRef]
  80. Calderón, F.J.; Jackson, L.E. Rototillage, disking, and subsequent irrigation: effects on soil nitrogen dynamics, microbial biomass, and carbon dioxide efflux. J. Environ. Qual. 2002, 31, 752–758. [Google Scholar] [CrossRef] [PubMed]
  81. Oades, J.M. The retention of organic matter in soils. Biogeochemistry 1988, 5, 35–70. [Google Scholar] [CrossRef]
  82. De Oliveira, S.P.; De Lacerda, N.B.; Blum, S.C.; Escobar, M.E.O.; De Oliveira, T.S. Organic carbon and nitrogen stocks in soils of northeastern Brazil converted to irrigated agriculture. Land Degrad. Dev. 2015, 26, 9–21. [Google Scholar] [CrossRef]
  83. Kocyigit, R.; Demirci, S. Long-term changes of aggregate-associated and labile soil organic carbon and nitrogen after conversion from forest to grassland and cropland in northern Turkey. Land Degrad. Dev. 2012, 23, 475–482. [Google Scholar] [CrossRef]
  84. Fallahzade, J.; Hajabbasi, M.A. The effects of irrigation and cultivation on the quality of desert soil in central Iran. Land Degrad. Dev. 2012, 23, 53–61. [Google Scholar] [CrossRef]
  85. Amundson, R.; Austin, A.T.; Schuur, E.A.G.; Yoo, K.; Matzek, V.; Kendall, C.; Uebersax, A.; Brenner, D.; Baisden, W.T. Global patterns of the isotopic composition of soil and plant nitrogen. Glob. Biogeochem. Cycle 2003, 17, 1031. [Google Scholar] [CrossRef]
  86. Ariz, I.; Cruz, C.; Neves, T.; Irigoyen, J.J.; Garcia-Olaverri, C.; Nogués, S.; Aparicio-Tejo, P.M.; Aranjuelo, I. Leaf δ15N as a physiological indicator of the responsiveness of N2-fixing alfalfa plants to elevated [CO2], temperature and low water availability. Front. Plant Sci. 2015, 6, 574. [Google Scholar] [CrossRef] [PubMed]
  87. Dijkstra, P.; Ishizu, A.; Doucett, R.; Hart, S.C.; Schwartz, E.; Menyailo, O.V.; Hungate, B.A. 13C and 15N natural abundance of the soil microbial biomass. Soil Biol. Biochem. 2006, 38, 3257–3266. [Google Scholar] [CrossRef]
  88. Högberg, P.; Johannisson, C. 15N abundance of forests is correlated with losses of nitrogen. Plant Soil. 1993, 157, 147–150. [Google Scholar] [CrossRef]
  89. Kramer, M.G.; Sollins, P.; Sletten, R.S.; Swart, P.K. N isotope fractionation and measures of organic matter alteration during decomposition. Ecology 2003, 84, 2021–2025. [Google Scholar] [CrossRef]
  90. Werth, M.; Kuzyakov, Y. 13C fractionation at the root-microorganisms-soil interface: A review and outlook for partitioning studies. Soil Biol. Biochem. 2010, 42, 1372–1384. [Google Scholar] [CrossRef]
  91. Kozlovskii, F.I.; Ruhlmann, J.; Travnikova, L.S.; Kuzyakov, Y.V. Clay differentiation in initially homogeneous substrates upon long-term field experiments. Eurasian Soil Sci. 2001, 34, 130–138. [Google Scholar]
Figure 1. Distribution of particle size fractions (A) and density fractions (B) in surface and buried soil horizons in alfalfa and shrubland sites. Note that the scale for the density fraction graph starts at 90%. The error bars represent the standard deviations from the mean. Different lowercase letters represent significant differences between soils (p ≤ 0.05). Only one replicate was used for the buried soil layers, so no standard deviation was calculated.
Soilsystems 02 00038 g001
Figure 2. Total organic C (black bars) and N (grey bars) in surface and buried soil horizons in alfalfa and shrubland sites. Error bars represent the standard deviations of the mean. Lowercase letters represent significant differences in C or N between soils (p ≤ 0.05). Only one replicate was used for the buried soil layers, so no standard deviation was calculated.
Soilsystems 02 00038 g002
Figure 3. The proportions of C (left bars) and N (right bars) in particle size (A) and density fractions (B) in surface and buried soil horizons in alfalfa and shrubland sites. Error bars represent the standard deviations from the mean and different lowercase letters represent significant differences in %C or %N between soils (p ≤ 0.05). Only one replicate was used for the buried soil layers so no standard deviation was calculated.
Soilsystems 02 00038 g003
Figure 4. The δ13C (A) and δ15N (B) isotopic composition for each particle size and density fraction in surface and buried horizons as well as above- and belowground vegetation (‘Above’ and ‘Below’ respectively) in alfalfa and shrubland sites. Error bars represent the standard deviations from the mean. Different lowercase letters indicate significant differences within each fraction between soils (p ≤ 0.05). The δ15N values for some fractions of the buried layers were missing due to insufficient N concentrations to allow for reliable 15N analysis. Only one replicate was used for the buried soil layers so no standard deviation was calculated.
Soilsystems 02 00038 g004
Figure 5. Average mid-infrared diffuse reflectance spectra of the bulk soils (A) and free-floating density fractions (B) from the surface soils and buried A horizons at the alfalfa and shrubland sites.
Soilsystems 02 00038 g005
Figure 6. Cumulative microbial respiration for the eight-week laboratory incubation in surface and buried soil horizons in alfalfa and shrubland sites. Error bars represent the standard deviation from the mean for each soil’s total CO2 production and different lowercase letters represent significant differences between soils (p ≤ 0.05). Only one replicate soil was used for the buried soil layers, so no standard deviation was calculated.
Soilsystems 02 00038 g006
Table 1. The C/N ratio (by mass) for particle size and density fractions for surface and buried soils and above- and belowground vegetation from the alfalfa and shrubland site. The standard deviation is given in brackets. Different lowercase letters indicate significant (p ≤ 0.05) differences for specific fractions between soils.
SurfaceBuried
AlfalfaShrub CanopyShrub InterspaceAlfalfa Shrub
Sand + POM11.8 (0.2) a14.6 (0.3) b14.8 (0.3) b10.3 (0.9)17.5 (0.7)
Silt9.4 (0.1) a11.4 (0.2) a11.3 (0.1) a14.9 (2.6)15.5 (1.1)
Clay8.4 (0.2) a10.9 (0.7) b11.0 (0.4) b13.0 (0.1)14.8 (0.3)
Free floating14.0 (0.3) a16.9 (0.9) b16.2 (0.3) ab19.9 (0.9)26.7 (2.2)
Heavy9.8 (0.2) a11.1 (0.4) a11.1 (0.5) a12.9 (1.8)13.5 (0.2)
Aboveground8.7 (0.5) a65.5 (1.7) b69.4 (3.4) b
Belowground13.4 (0.3) a 41.7 (1.1) b47.7 (1.9) c

