Article

Deciphering and Predicting Microscale Controls on Radon Production in Soils, Sediments and Rock

Department of Civil and Environmental Engineering, Massachusetts Institute of Technology, Cambridge, MA 02139, USA
*
Author to whom correspondence should be addressed.
Soil Syst. 2018, 2(2), 30; https://doi.org/10.3390/soilsystems2020030
Submission received: 22 March 2018 / Revised: 3 May 2018 / Accepted: 4 May 2018 / Published: 9 May 2018
(This article belongs to the Special Issue Soil Processes Controlling Contaminant Dynamics)

Abstract

:
Soils, sediments and rock are natural sources of radon (Rn), which poses an ongoing threat to human health. Numerous studies have measured Rn release from bulk earth materials, yet few have examined microscale controls on Rn flux from solids (emanation), which is required to develop a process-based framework for predicting the rate and extent of production. Here, we use a novel closed loop flow-through system to measure Rn emanation from two crushed rock types with disparate physical and geochemical characteristics, shale and granitic pegmatite. We relate the extent of Rn emanation from each sample to microscale characteristics examined using conventional and synchrotron-based techniques, such as Rn parent radionuclide distribution within mineral grains, porosity, and surface area. Our results illustrate that the extent of Rn release from solids is primarily dependent on the position of parent radionuclides within host mineral grains relative to the “recoil range”—the maximum distance a daughter product (such as Rn) may traverse within a solid and into an adjacent pore owing to alpha-recoil—and is less dependent on the bulk parent radionuclide (e.g., radium) activity. We also present a simple model for predicting the emanation coefficient for pure solids based on mineralogical and physical parameters, which is an initial step toward developing a framework for predicting Rn efflux (exhalation) from soils.

Graphical Abstract

1. Introduction

Radon (Rn) is a chemically inert radioactive gas that poses a significant threat to human health [1,2], predominately through the accumulation of short–lived Rn decay products such as 210Po, 214Pb [2,3]. These decay products are chemically reactive, and when inhaled are deposited within respiratory tract tissues, thereby increasing the risk of lung cancer [4]. In fact, inhalation of Rn is the second most frequent cause of lung cancer after smoking, and is classified as a human carcinogen [5]. While Rn is of great interest owing to its impact on human health, it is also used to examine terrestrial and atmospheric processes. For example, temporal and spatial variation in the release rates of Rn from soils and sediments to air and water have been used to locate subsurface uranium (U) and hydrocarbon deposits [6,7], as hydrologic flow path tracers of groundwater and streamflow [3,8,9,10], and as powerful tracers for quantifying atmospheric transport processes [11,12]. For all these studies, a thorough understanding of the factors and processes that control Rn production rates from soils, minerals and rocks is essential.
Three naturally occurring Rn isotopes, 222Rn, 220Rn and 219Rn (half lives of 3.8 days, 55.6 s, 4 s), are produced by the radioactive decay of 226Ra, 224Ra and 223Ra, which are decay products of 238U, 232Th, and 235U decay series respectively. The primary mode of Ra alpha decay to Rn occurs through the high velocity emission of an alpha particle ( He 2 + 4 2 ), which imparts recoil energy to the daughter radionuclide (Rn) sufficient to break chemical bonds and eject the daughter radionuclide from soil-sedimentary solids to surrounding pore space [13,14]. The displacement of Rn in this manner is often referred to as “alpha recoil”, and the distance traversed from the location of the original parent isotope to the adjacent pore space is termed the “recoil range” [15]. The recoil range for Rn is typically in the order of a few hundreds of angstrom, depending on the host material. The release of Rn from solids to pore space is often described using the Rn emanation coefficient (ε), which describes the fraction of Rn released from soil-sedimentary mineral grains owing to alpha recoil. The Rn emanation coefficient is used with several other parameters to describe the production rate (Bq m−3 s−1) of Rn per unit volume of solid material:
P = ε λ A Ra
where λ is the decay constant for Rn (s−1), and ARa is the Ra (parent isotope) activity concentration in the solid (Bq m−3).
Methods used to estimate the Rn emanation coefficient from soils and sediments typically involve placing samples within a sealed container, and then measuring headspace Rn following secular equilibrium (2–20 days) with its parent isotope [9,16,17,18]. The solid phase activity concentration of parent Ra is also measured, and ε is calculated by dividing Rn activity at secular equilibrium in a measured volume by total Ra activity in the solid. However, owing to differences in grain size, moisture content, soil temperature, mineralogy and Ra distribution within grains, there is a large discrepancy observed in ε measured across different materials, even for those with similar Ra concentrations [1,2,19,20,21,22,23,24,25]. For example, Sun and Furbish (1995) showed that high moisture content reduces Rn emanation due to entrapment within thick fluid films on mineral surfaces [23]. While not as common for surface soils, higher temperatures such as those found within geothermal aquifers have been found to increase rates of release as much as 55% with a temperature increase from 5 °C to 50 °C. Moreover, mineral grain microstructure (here defined as sub-millimeter physical characteristics such as shape, size and internal porosity) and the spatial distribution of parent Ra also plays an important role on emanation rates of Rn [26]. Rama and Moore (1984) measured Rn emanation coefficient from a suite of earth materials including saprolite, zircon-monazite mixtures, and monazite sand, and suggested Rn migrates through nanopores following near-surface recoil [16]. Previous studies modeled the impact of Ra distribution in grain on Rn emanation, and found that for near surface distribution of Ra, Rn emanation may theoretically be close to 50%, even for large grains, while those characterized by a homogenous Ra distribution, rates of Rn emanation are generally governed by grain size [27,28].
Despite extensive studies on Rn emanation, previous work has mostly focused on Rn release from bulk rocks, soils and other materials, while less attention has been given to assessing the importance of microscale chemical heterogeneity in solids. Although chemically inert, the recoil range of Rn is affected by variations in mineral density and morphology, which in turn will affect the net flux of Rn entering into the pore space [29,30,31]. In fact, Sakoda et al. compared Rn emanation co-efficient across various minerals separated from rocks and soil and found ε to be equal to 0.4 for quartz and 0.27 for goethite, suggesting that Rn emanation potential is dependent on mineral type and other host matrix properties. However, mineralogical and structural properties are typically not considered when measuring ε. Instead, bulk Ra activities in solids are utilized as a measure for distinguishing the Rn emanation potential between natural materials, thereby neglecting differences in Rn emanation among constituent minerals [13]. Previous studies have acknowledged and analytically demonstrated that the spatial distribution of Ra within soil and rock grains, as well as grain size and shape, affect the net flux of Rn entering into pore space, but limited research has been conducted to combine these findings with experimental data in order to develop models to predict Rn emanation from natural materials [13,32,33]. Accordingly, we measure Rn emanation from two types of rock specimen possessing disparate bulk parent radionuclide content and relate Rn emanation to microscale variation in geochemical and physical properties. We also present a simple but novel model describing the Rn emanation coefficient for individual minerals, which is an initial step toward developing a framework for predicting Rn efflux from soils, sediments and rock.

2. Materials and Methods

2.1. Rock Type and Characterization
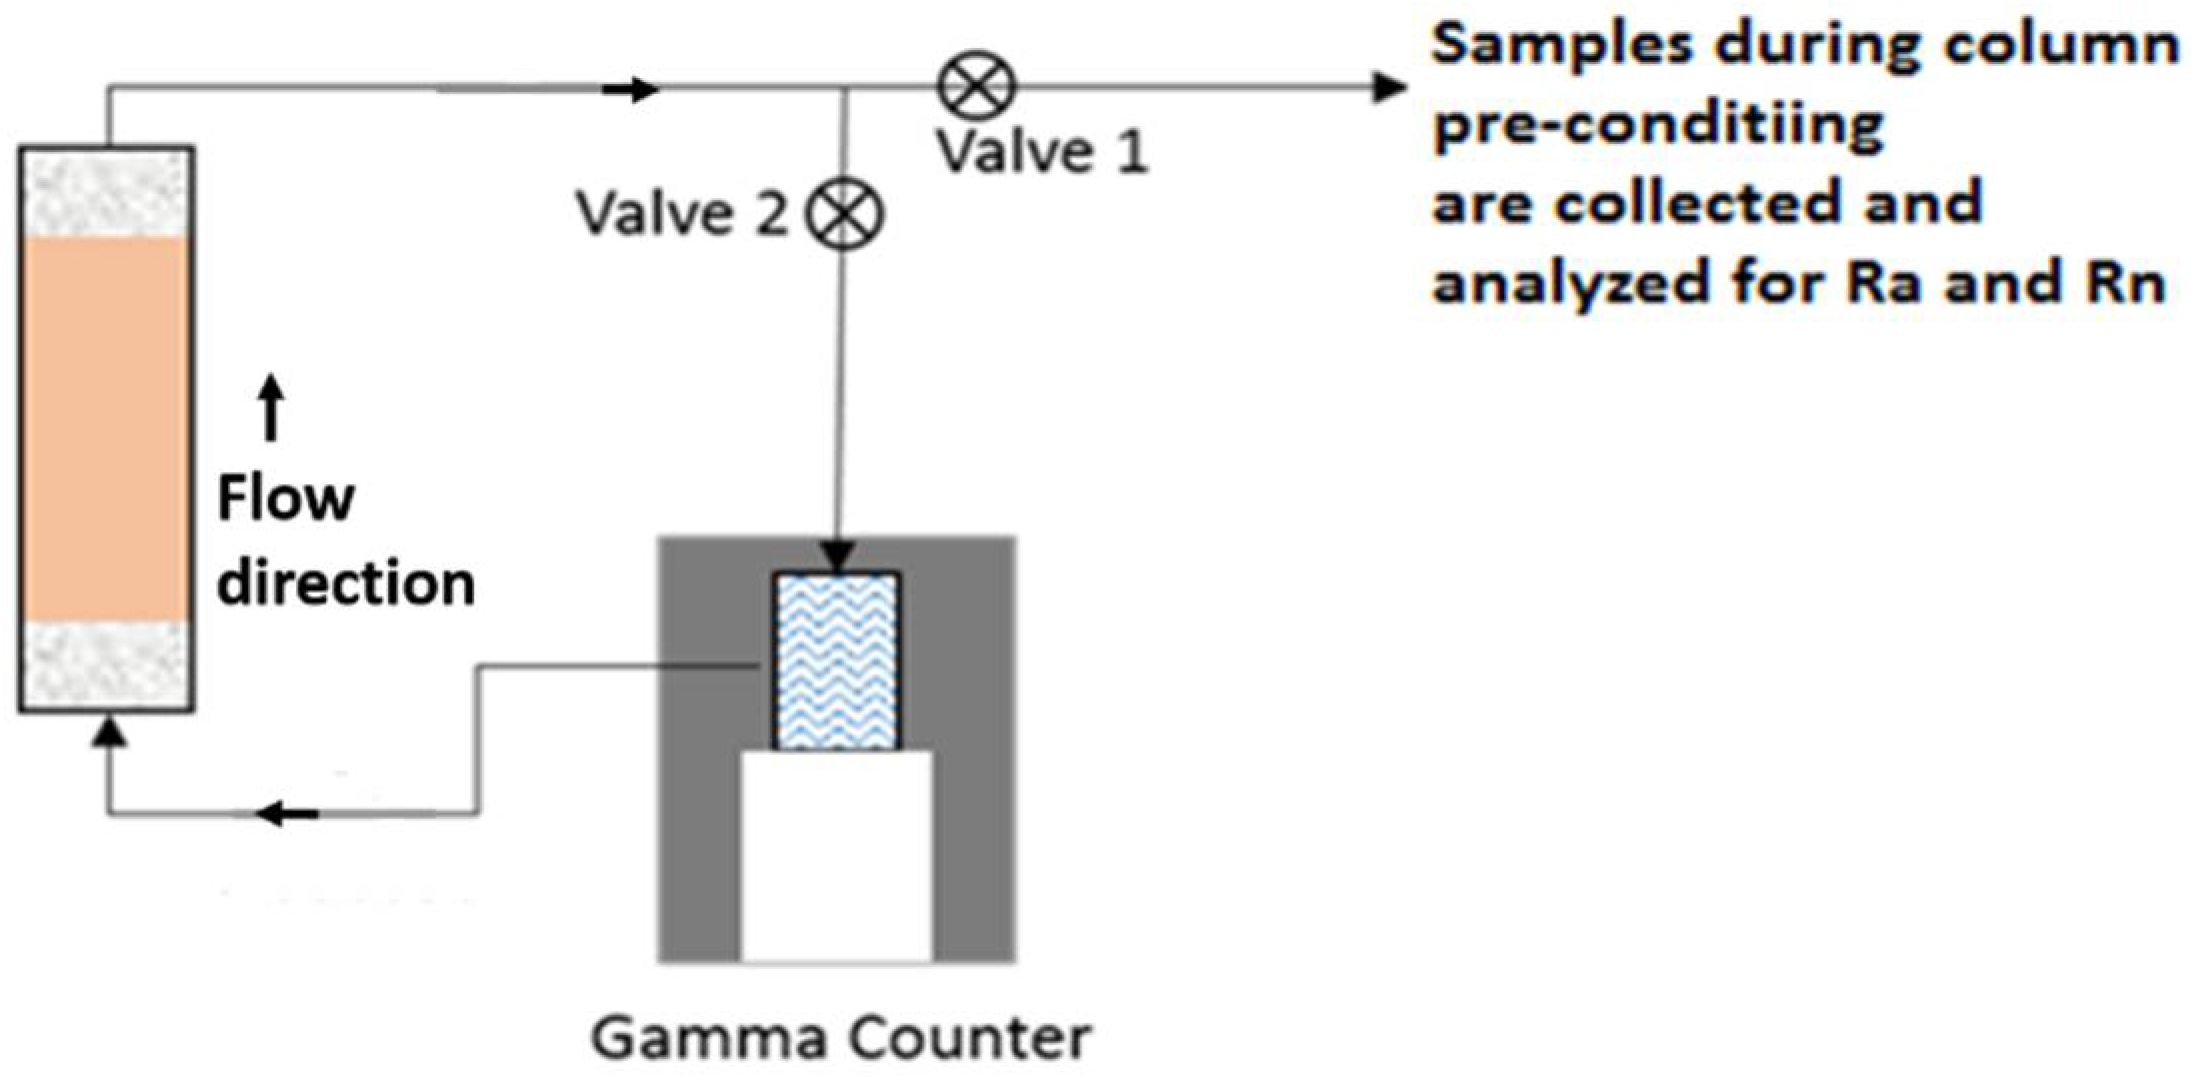
Radon emanation was investigated from shale and pegmatite samples containing disparate mineralogy and Rn parent radionuclide concentrations. The mineralogical composition of both rock specimens were characterized using powdered X-ray Diffraction (XRD). Secular equilibrium conditions were assumed for both specimens (in cases of solids in radioactive disequilibria, the Bateman equations can be used to model Rn decay and ingrowth in the system [34]). Marcellus shale core samples, collected from depths between 1000–7000 feet, were obtained from the Department of Conservation & Natural Resources (DCNR) core repository, located in Harrisburg, PA, USA. A rock specimen originating from the granitic Seerie pegmatite, South Platte Pegmatite District, CO, USA) was obtained from Persson Rare Minerals (http://perssonrareminerals.com) and is hereafter referred to as “pegmatite”. Although these geological materials were received intact, we specifically crushed them for experimental analysis. The use of crushed rocks enables us to simplify microstructure of solids and allows a direct way of linking Rn emanation to surface area and grain size. Each sample was powdered to a particle size of 250–100 µm using a SPEX 8530 Shatterbox®, and surface area was then measured using Brunauer–Emmett–Teller (BET) method, which were 6.5 m2 g−1 for shale and 4.5 m2 g−1 for pegmatite. Element composition for each specimen was quantified through whole-rock acid digestion [35]. Digested samples were spiked with an internal standard before analysis on ICP-MS, consisting of 20 ppb of Lithium, Scandium, Yttrium, Germanium, Bismuth, Terbium, and Indium, and analyzed using Inductively Coupled Mass Spectrometer (ICP-MS). The errors associated with ICP-MS measurement were <5% standard deviation.
Naturally occurring Ra isotopes and decay products within powdered shale and pegmatite were quantified using a Canberra High Purity Germanium Detector (HPGe). Energy and efficiency were calibrated using a mixed multi-nuclide Eckert & Ziegler™ aqueous gamma standard. The measured 226Ra activities in solids were corrected for spectral interference from 235U at 186.5 keV by multiplying the total gamma ray signal for 186.5 keV peak by 0.57 [36]. The spatial distribution of U (parent nuclide of Ra) in a powdered shale thin section was studied using X-ray fluorescence mapping (beamline 2–3, Stanford Synchrotron Radiation Lightsource, SSRL) while the spatial distribution of U in pegmatite was studied using JEOL JXA-8200 Electron Microprobe (Massachusetts Institute of Technology, Cambridge, MA, USA). Grain-scale heterogeneity in radionuclide distribution within shale and pegmatite was qualitatively analyzed using autoradiography by exposing a phosphor screen for 7 days directly to rock specimen and imaging the intensity on a Typhoon™ biomolecular imager. Microstructure of both rocks was characterized using Micro Computed Tomography (micro-CT, GE eXplore CT 120, MIT).
Sequential extractions were used to examine the association of U with shale and pegmatite using a mixed BCR-Tessier scheme [37,38]. Briefly, triplicate extractions nominally target U bound to clays and humic acids (exchangeable fraction), bound to carbonates (acid soluble fraction), bound to metal (hydr)oxides (reducible fraction), bound to organic matter (oxidizable fraction) and bound in silicate minerals (residual fraction). In all steps, samples were filtered using 0.22 µm PES syringe filters and filtrates were analyzed on ICP-MS. More details of sequential extraction scheme are provided in the supplementary info (SI: Sequential Extractions).

2.2. Column Setup

In contrast to previous methods for measuring Rn emanation from solids, a dynamic aqueous flow-through system was designed to continuously measure Rn emanation (flux) from solids through alpha-recoil, which is problematic using static (batch) methods [1] (Figure 1). Briefly, the powdered rock samples were packed in Flex Column™ of length 15 cm and diameter 1.5 cm in three layers: a bottom and top layer, 1 cm and 2 cm in height respectively, composed of Unimin™ IOTA 6 quartz sand, and a middle layer composed of powdered rock sample. The mass of powdered rock placed in columns was 8 g and 12 g for shale and granitic pegmatite respectively. Columns were eluted from the bottom to eliminate flow channeling. Packed columns were conditioned to remove any adsorbed Ra onto the grain surface by flushing with 25 pore volumes of 10 mM CaCl2 followed by 25 pore volumes of 1 M MgCl2 (approximately 200 mL). of pre-conditioning, 100 mL of 10 mM NaCl (buffered at pH 6.6 using 1 mM PIPES) solution was recirculated through column in a closed loop configuration at a rate of 5 pore volume per day. The radioactivity of circulating fluid was regularly measured at different time intervals on the HPGe for a total duration of 30 days. This measurement was performed without flow interruption using an in-line reservoir that was placed directly onto the HPGe detector. 226Ra was measured directly from its gamma peak at 185.6 keV peak, while 222Rn was measured indirectly using the activity of progeny 214Pb (gamma peak at 351.9 keV) in fluids. The aqueous samples were counted for 24 h on gamma spectrometer. The minimum detectable activity (MDA) for the count period for 214Pb and 226Ra was 2.0 × 10⁻¹ Bq mL−1 and 4.6 × 10⁻² Bq mL−1 respectively. The measurement uncertainty associated with 226Ra and 214Pb gamma peak was ~10%. All chemical reagents were ACS reagent grade.

2.3. Radon Emanation Coefficient

Experimental measurements were used to calculate the Rn emanation coefficient (ε) as follows:
ε = A Rn e V T A Ra M
A Rn e = activity of 222Rn, Bq mL−1 of pore water; = porosity of packed column bed; A Ra = activity of 226Ra, Bq g−1 of solid; M = mass of solids, g; VT = total volume of circulating fluid, mL. The activity of Rn ( A Rn e ) was calculated as follows: At any time (t), the quantity of Rn atoms entering pore space ( N Rn ) is expressed using source and sink terms as:
dN Rn dt = emanation + ingrowth from dissolved parent nuclide decay
Re-writing Equation (3) in terms of Rn activity,
dA Rn dt = ( A Rn e + A wp A Rn ) λ
where, A Rn = the total activity of Rn in circulating fluid as measured through gamma spectroscopy (Bq mL−1), A wp = the activity of Rn as a result of ingrowth from dissolved Ra, (Bq mL−1), and λ = decay constant of 222Rn, day−1
Solving the differential Equation (4) yields:
A Rn e = A Rn A wp ( 1 exp ( λ t ) ) ( 1 exp ( λ t ) )
Dissolved Ra activity ( A wp ) was monitored in circulating fluid as a function of time and ingrowth of Rn from dissolved 226Ra was found to be negligible in comparison to ARn (see Figures S1 and S2 in Supplementary Materials). Thus, Equation (5) can be further simplified and expressed as:
A Rn e = A Rn ( 1 exp ( λ t )
Combining Equations (2) and (6), the Rn emanation coefficient is expressed as:
ε = A Rn V T ( 1 exp ( λ t ) ) MA Ra

2.4. Estimating Recoil Range in Solids

The distance traveled by Rn within a solid, termed as recoil range, was calculated using a Monte Carlo based “Stopping and Range of Ions in Matter” (SRIM) software package [39]. The program simulates the recoil process by following a large number of individual Rn atom collisions in a specified solid. During each collision, Rn is displaced a certain distance in solid and continuously dissipates its recoil energy through nuclear and electronic losses, finally stopping at its recoil range [23]. Input parameters include atomic number and weight of constituent elements in the modeled solid, recoil energy of the decay event, and the solid phase density (Table S1). The SRIM output includes a projected range (nm) associated with the recoiled nuclide within the specified solid.

3. Results

3.1. Material Characteristics

The powder X-ray diffraction pattern of crushed pegmatite revealed both uraninite (UO2(s)) and thorite (ThSiO4), and other common minerals such as quartz and feldspar (Figure S3). Autoradiograph analysis of pegmatite reveals widespread grain-scale heterogeneity in radionuclide distribution (Figure 2). This was also observed in element maps acquired through electron microprobe analysis, where the spatial distribution of U was concentrated within veins spanning more than 50 µm in length and at least several µm in width (Figure 3). In contrast, shale has fine textured, micron sized grains, composed primarily of clay minerals, pyrite, carbonates and organic matter [40,41]. Differences in microstructure are illustrated in micro-CT X-ray scans of shale and pegmatite (Figures S4 and S5). Compared to pegmatite, which contained 60% of total uranium in residual fraction, shale contained ~3% of total uranium in residual minerals (Figure 4). Powder X-ray diffraction of crushed Marcellus shale revealed dominant reflections for pyrite and quartz (Figure S6). The total U concentration within digested shale was ~19 ppm, whereas granite contained 3.4% by wt. uranium. Unlike pegmatite, there were no localized radioactive hotspots within shale as measured using autoradiography (Figure 2), albeit synchrotron-based XRF mapping did reveal a sparse distribution of small grains elevated in U with diameters less than ~5 µm. (Figure 5). Spatial quantitative mapping of alpha emitters such as 226Ra was not feasible with the autoradiography techniques and hence, here, we assume the U spatial distribution as a proxy for 226Ra distribution. However, ongoing development of digital autoradiography techniques for quantitatively mapping alpha emitters such as 226Ra is a promising method for delineating the spatial distribution of U and Ra [42].

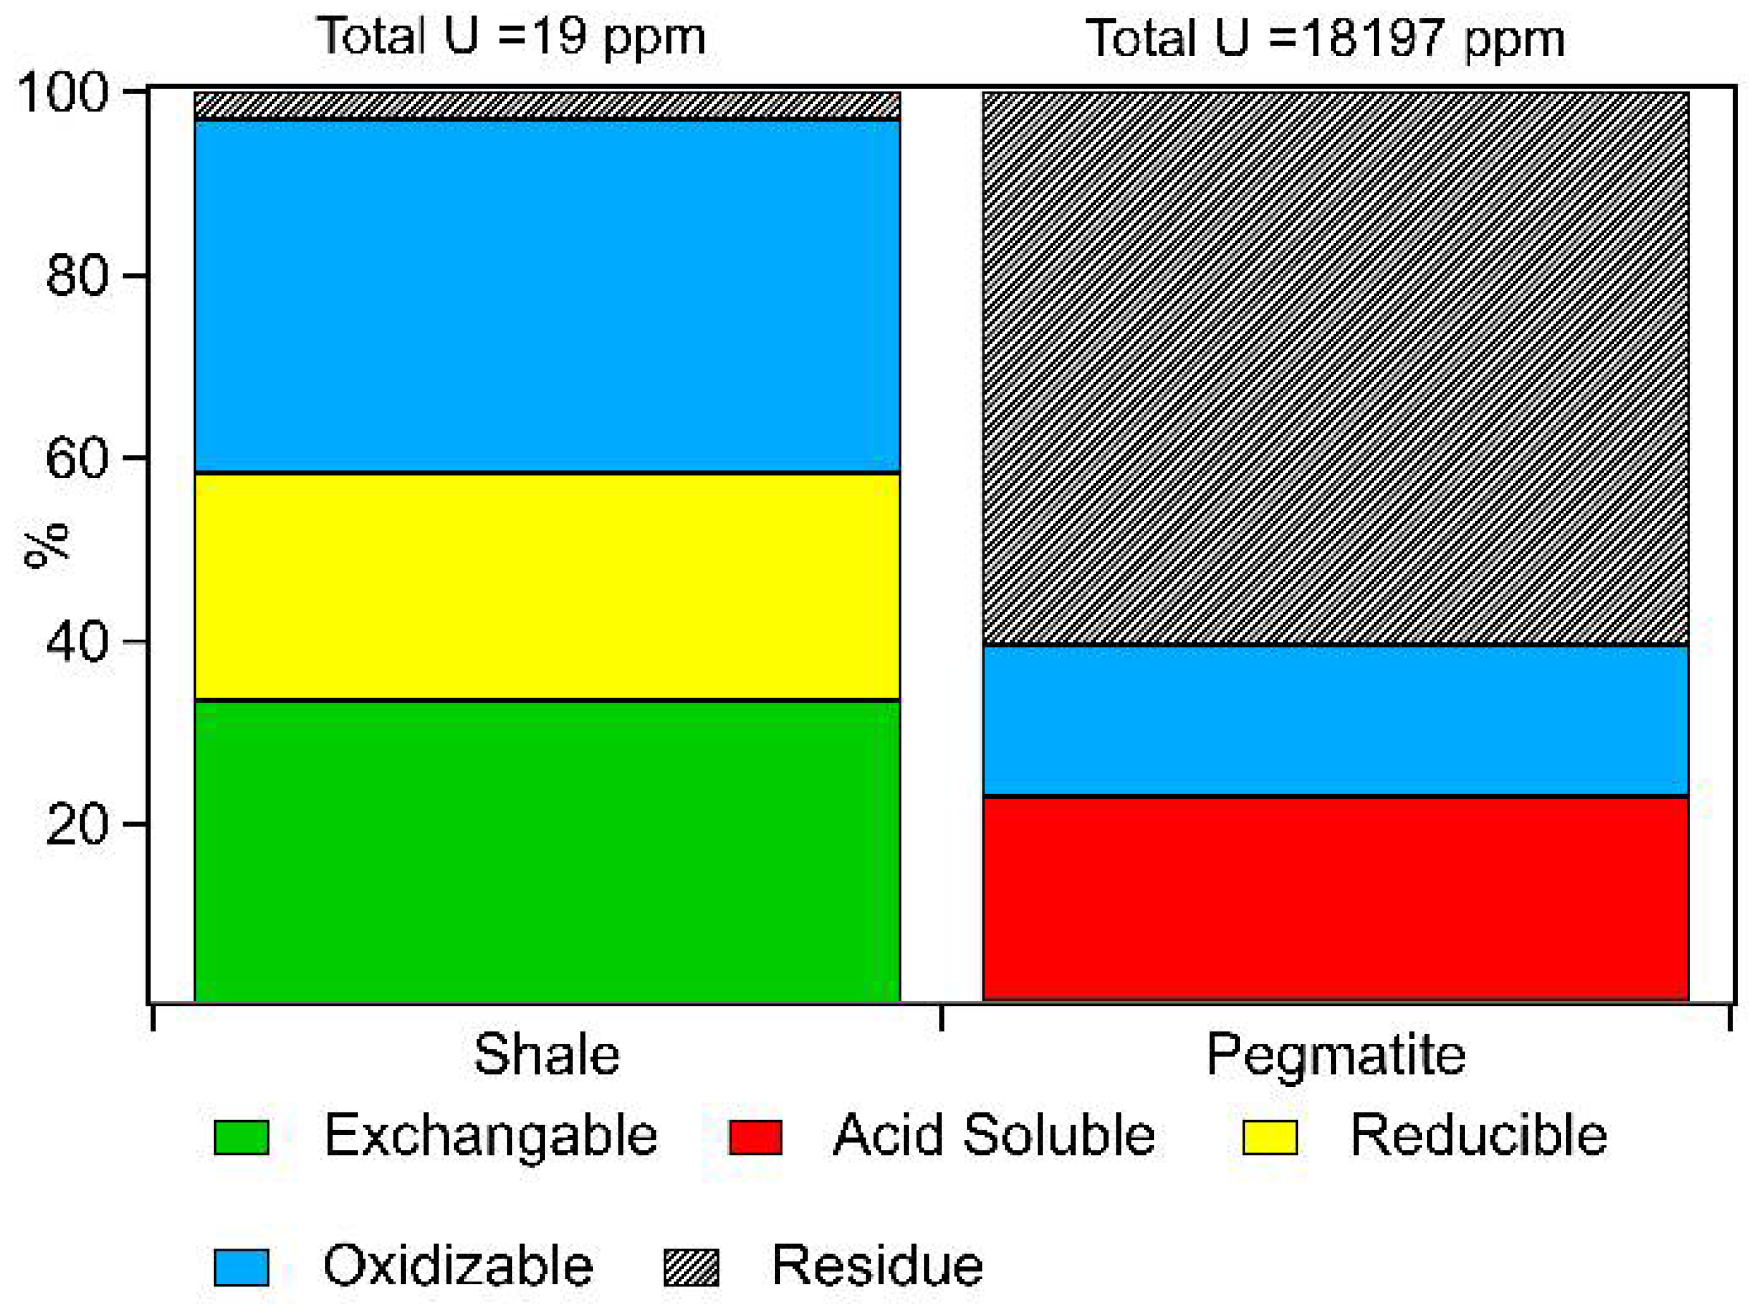
3.2. Sequential Extractions

Uranium chemical association with shale and pegmatite was examined using sequential extractions (Figure 4 and Table S2). More than 50% of the total U in pegmatite was found in the “residual” fraction (final extraction step), implying that substantial quantities of U are located within silicate and other recalcitrant minerals. Less than 1% of the total U in pegmatite was extracted between the exchangeable and reducible fractions, 22% was extracted with the acid soluble fraction, and 17% within the oxidizable fraction (Figure 4). In contrast, up to 33% of the total U in shale was extracted within the exchangeable fraction, 60% was extracted between the reducible and oxidizable fractions, and negligible acid soluble U was extracted. Unlike pegmatite, less than 5% of the total U was extracted in residual fraction in shale, suggesting that recalcitrant minerals are likely not the primary host of U in shale.

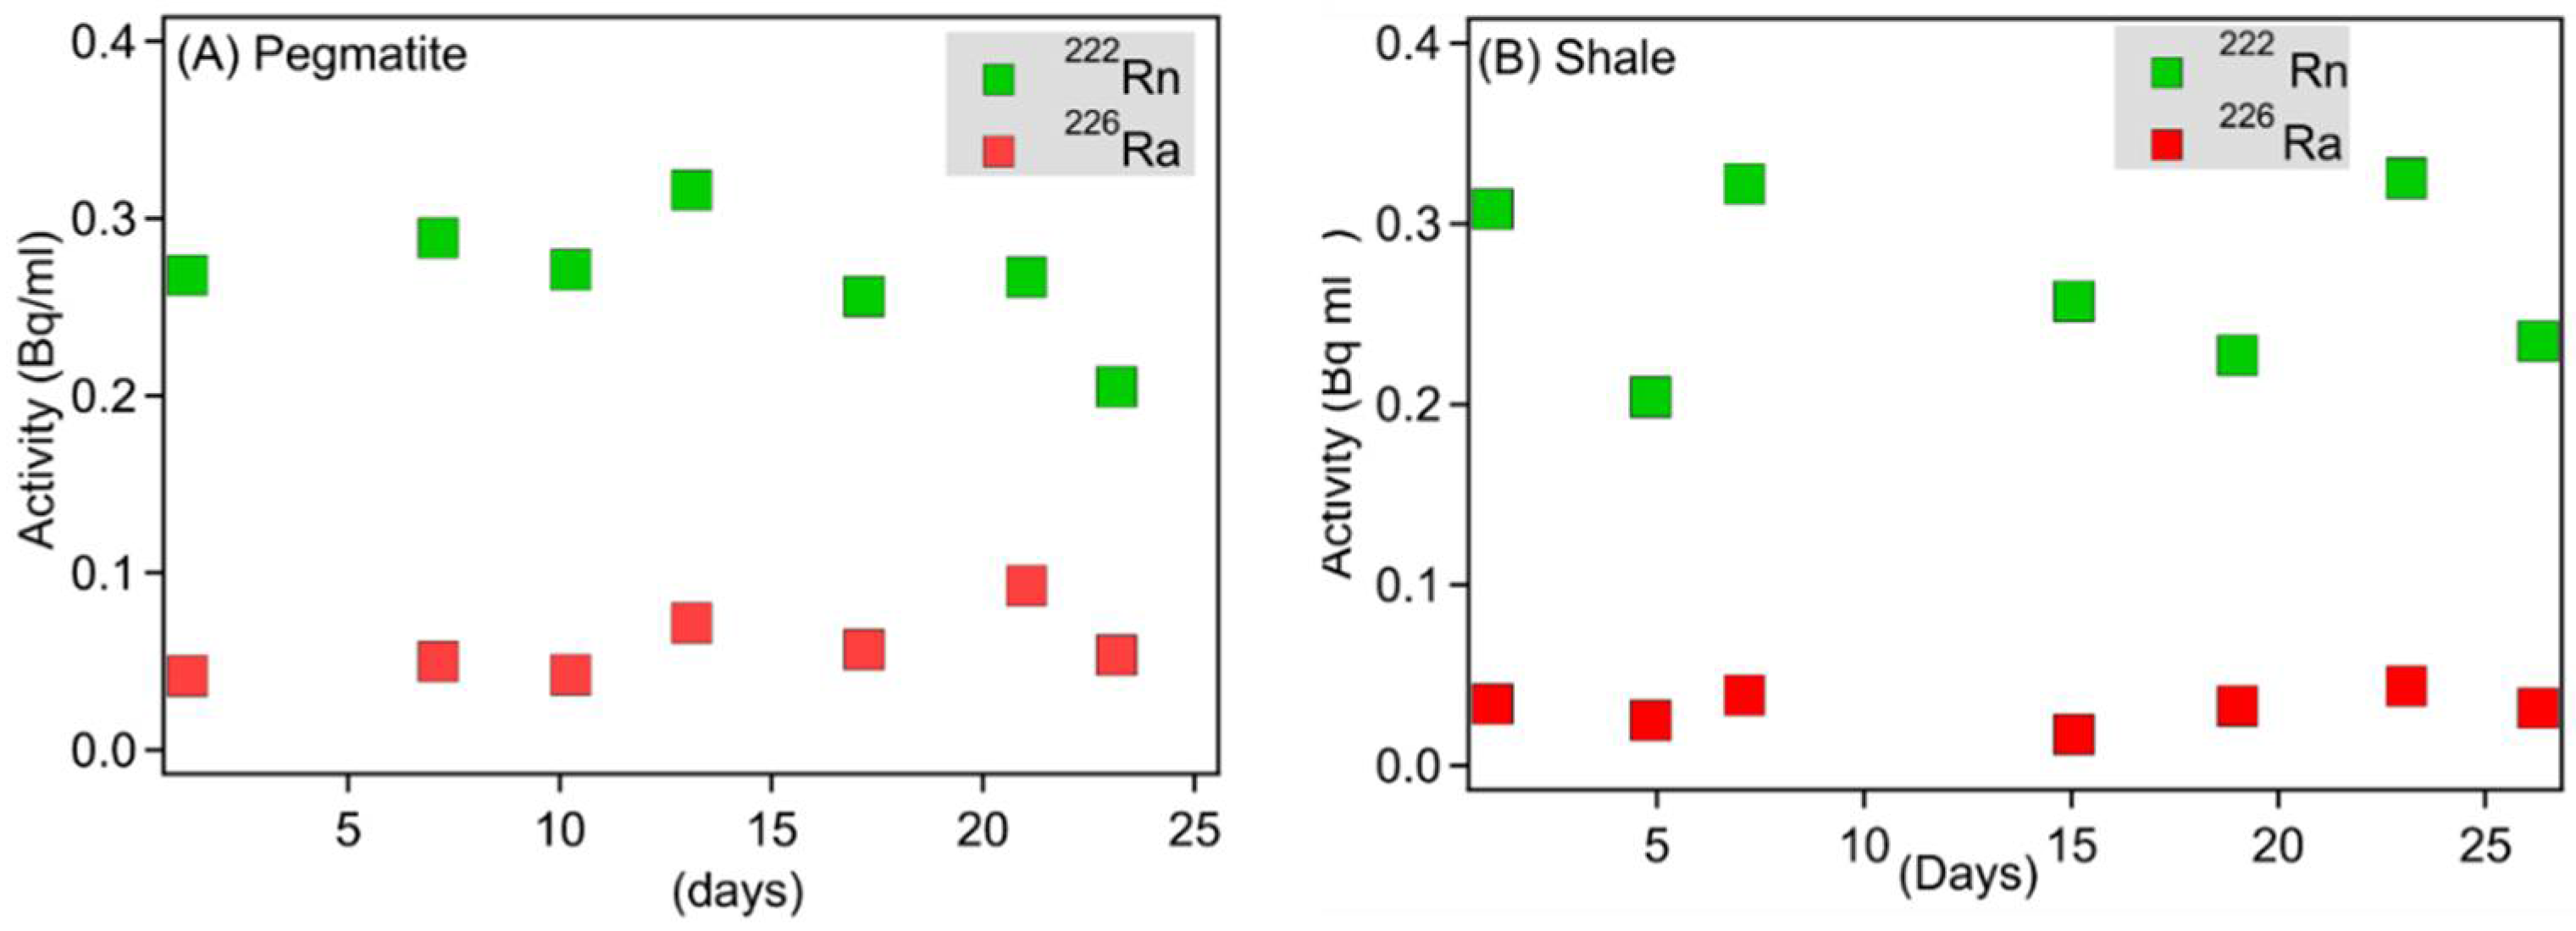
3.3. Porewater Radon Activities within Flow-Through Experiments and Calculated Radon Emanation Coefficients

Prior to operating the column in a closed loop configuration (Figure 1), the packed column is conditioned to eliminate adsorbed parent radionuclides that may contribute to the flux of Rn (but without ejection from solids). This was done to ensure that any Rn activity measured during closed loop configuration was directly a measure of Rn emanated from within solid, rather than adsorbed or aqueous parent radionuclides. Adsorbed Ra was stripped from mineral surfaces using a combination of different ionic strength salts, which eluted from the system (with no return flow). Figures S1 and S2 illustrate the dissolved activities of Ra within these salt solutions during pre-conditioned stages.
Figure 6 illustrates the temporal profile of Rn activity (ARn) in circulating fluid for both granite and shale. In both solutions, dissolved Rn activity ranged between 0.2–0.3 Bq mL−1, and the dissolved activity of 226Ra remained constant. Measured dissolved Ra activities in circulating fluid were not corrected for spectral interference from 235U because we assumed negligible concentrations of 235U would be solubilized in circulating fluid to result in interference with 226Ra gamma peak. Table 1 summarizes the Rn emanation coefficient for shale and granite calculated by substituting measured Rn activity (ARn) in Equation (7). In shale, an estimated 62% of Rn escapes from solid to pore fluids whereas only 0.2% of Rn produced in granite enters the pore fluid.

4. Discussion

4.1. Chemical Heterogeneity and Its Impact on Radon Emanation

Alpha recoil is the displacement of a daughter nuclide from its initial (parent) position within a solid material, including natural mineral grains and synthetic solids [15,43,44,45]. The energy associated with an alpha recoil event is many orders of magnitude larger than typical chemical bond energy (~3–5 eV); hence, these high energy events responsible for ejecting a daughter nuclide from a mineral are also responsible for altering or damaging the lattice of crystalline materials [44,46,47]. The recoil range of a nuclide can vary depending on the type of fluid in pore space as well as the mineralogy of host matrix. For example, the 222Rn recoil length in air equals 64 µm, in water is 95 nm, in quartz is 38 nm, in uraninite is 23.5 nm and in thorite equals 28 nm [29,39]. As such, only Rn recoil produced within its recoil range from grain surface will have any probability of escaping the pore-grain boundary and entering adjacent pore space (assuming a spherical grain and no internal porosity). This means that the spatial distribution of Ra atoms within a solid is a key variable that determines Rn emanation from solid.
Previous models of Rn emanation commonly assume that Ra atoms were distributed homogenously in the solid [28], but such assumptions are probably not reflective of Ra distribution in most natural materials. Radium, unlike Rn, is chemically reactive and known to extensively adsorb to aquifer solids [29,45,48,49,50,51,52,53,54]. Adsorption of Ra is strongly dependent on ionic strength and concentrations of other competing ions in solution. For example, several studies have shown increased mobilization of 226Ra from clays such as kaolinite and montmorillionite in saline solutions [55,56,57]. Localized near grain hotspots of Ra could also be formed due to precipitation of Ra with solids such as barite (BaSO4), witherite (BaCO3), and celestite (SrSO4). Such water-rock interactions result in a Ra distribution which is likely heterogeneous over the whole grain volume, which is an important factor influencing the Rn emanation coefficient. For example, in a solid with all Ra atoms deposited on the surface of the particles (grains)-the emanation coefficient, even for large grains (a few or more µm in diameter), may theoretically be close to 50%. For grains of similar dimensions, although characterized by a homogeneous distribution of Ra atoms, direct recoil from the surface of the grain has only a very small effect on the emanation coefficient. In this case, the grain microstructure (e.g., internal porosity) plays a key role in affecting the emanation coefficient [17,58].
Mapping Ra in geological samples is exceedingly difficult owing to low concentrations, even in U-rich minerals; hence, XRF mapping of U was used as a proxy for determining the spatial distribution of Ra in solids, assuming there is a high likelihood of a spatial correlation between Ra and U (Figure 2, Figure 3 and Figure 5). Given the mineralogy of pegmatite and the presence of localized hotspots of U in solid (Figure 2, Figure 3 and Figure 5), it appears that a majority of U occupies spatial positions within pegmatite mineral grains beyond the recoil range of Rn, thereby eliminating any probability of Rn escape into adjacent pore space. In contrast with pegmatite, U in shale is present in trace quantities, with a substantial fraction associated with shale mineral surfaces, including those known to sorb appreciable quantities of Ra including clay minerals and pyrite [45]. This is consistent with XRF imaging and autoradiograph analysis (Figure 2 and Figure 5), which suggest that only a small fraction of U is concentrated within small diameter grains (possibly microcrystalline UO2(s)), with the remaining U homogenously distributed across a diffuse background (likely sorbed). These results are supported with sequential extraction data for U, where 33% of U is removed from shale solids using 1 M MgCl2, while only 0.8% of U is extracted from pegmatite using the same extractants. Within shale, the higher fraction of U present at the mineral-water interface, or within Rn recoil range of the mineral surface, increases the likelihood of Rn escaping the solid, thereby imparting shale higher Rn emanation coefficient in comparison to pegmatite, even though the U content of pegmatite is comparatively much higher (Table 1).

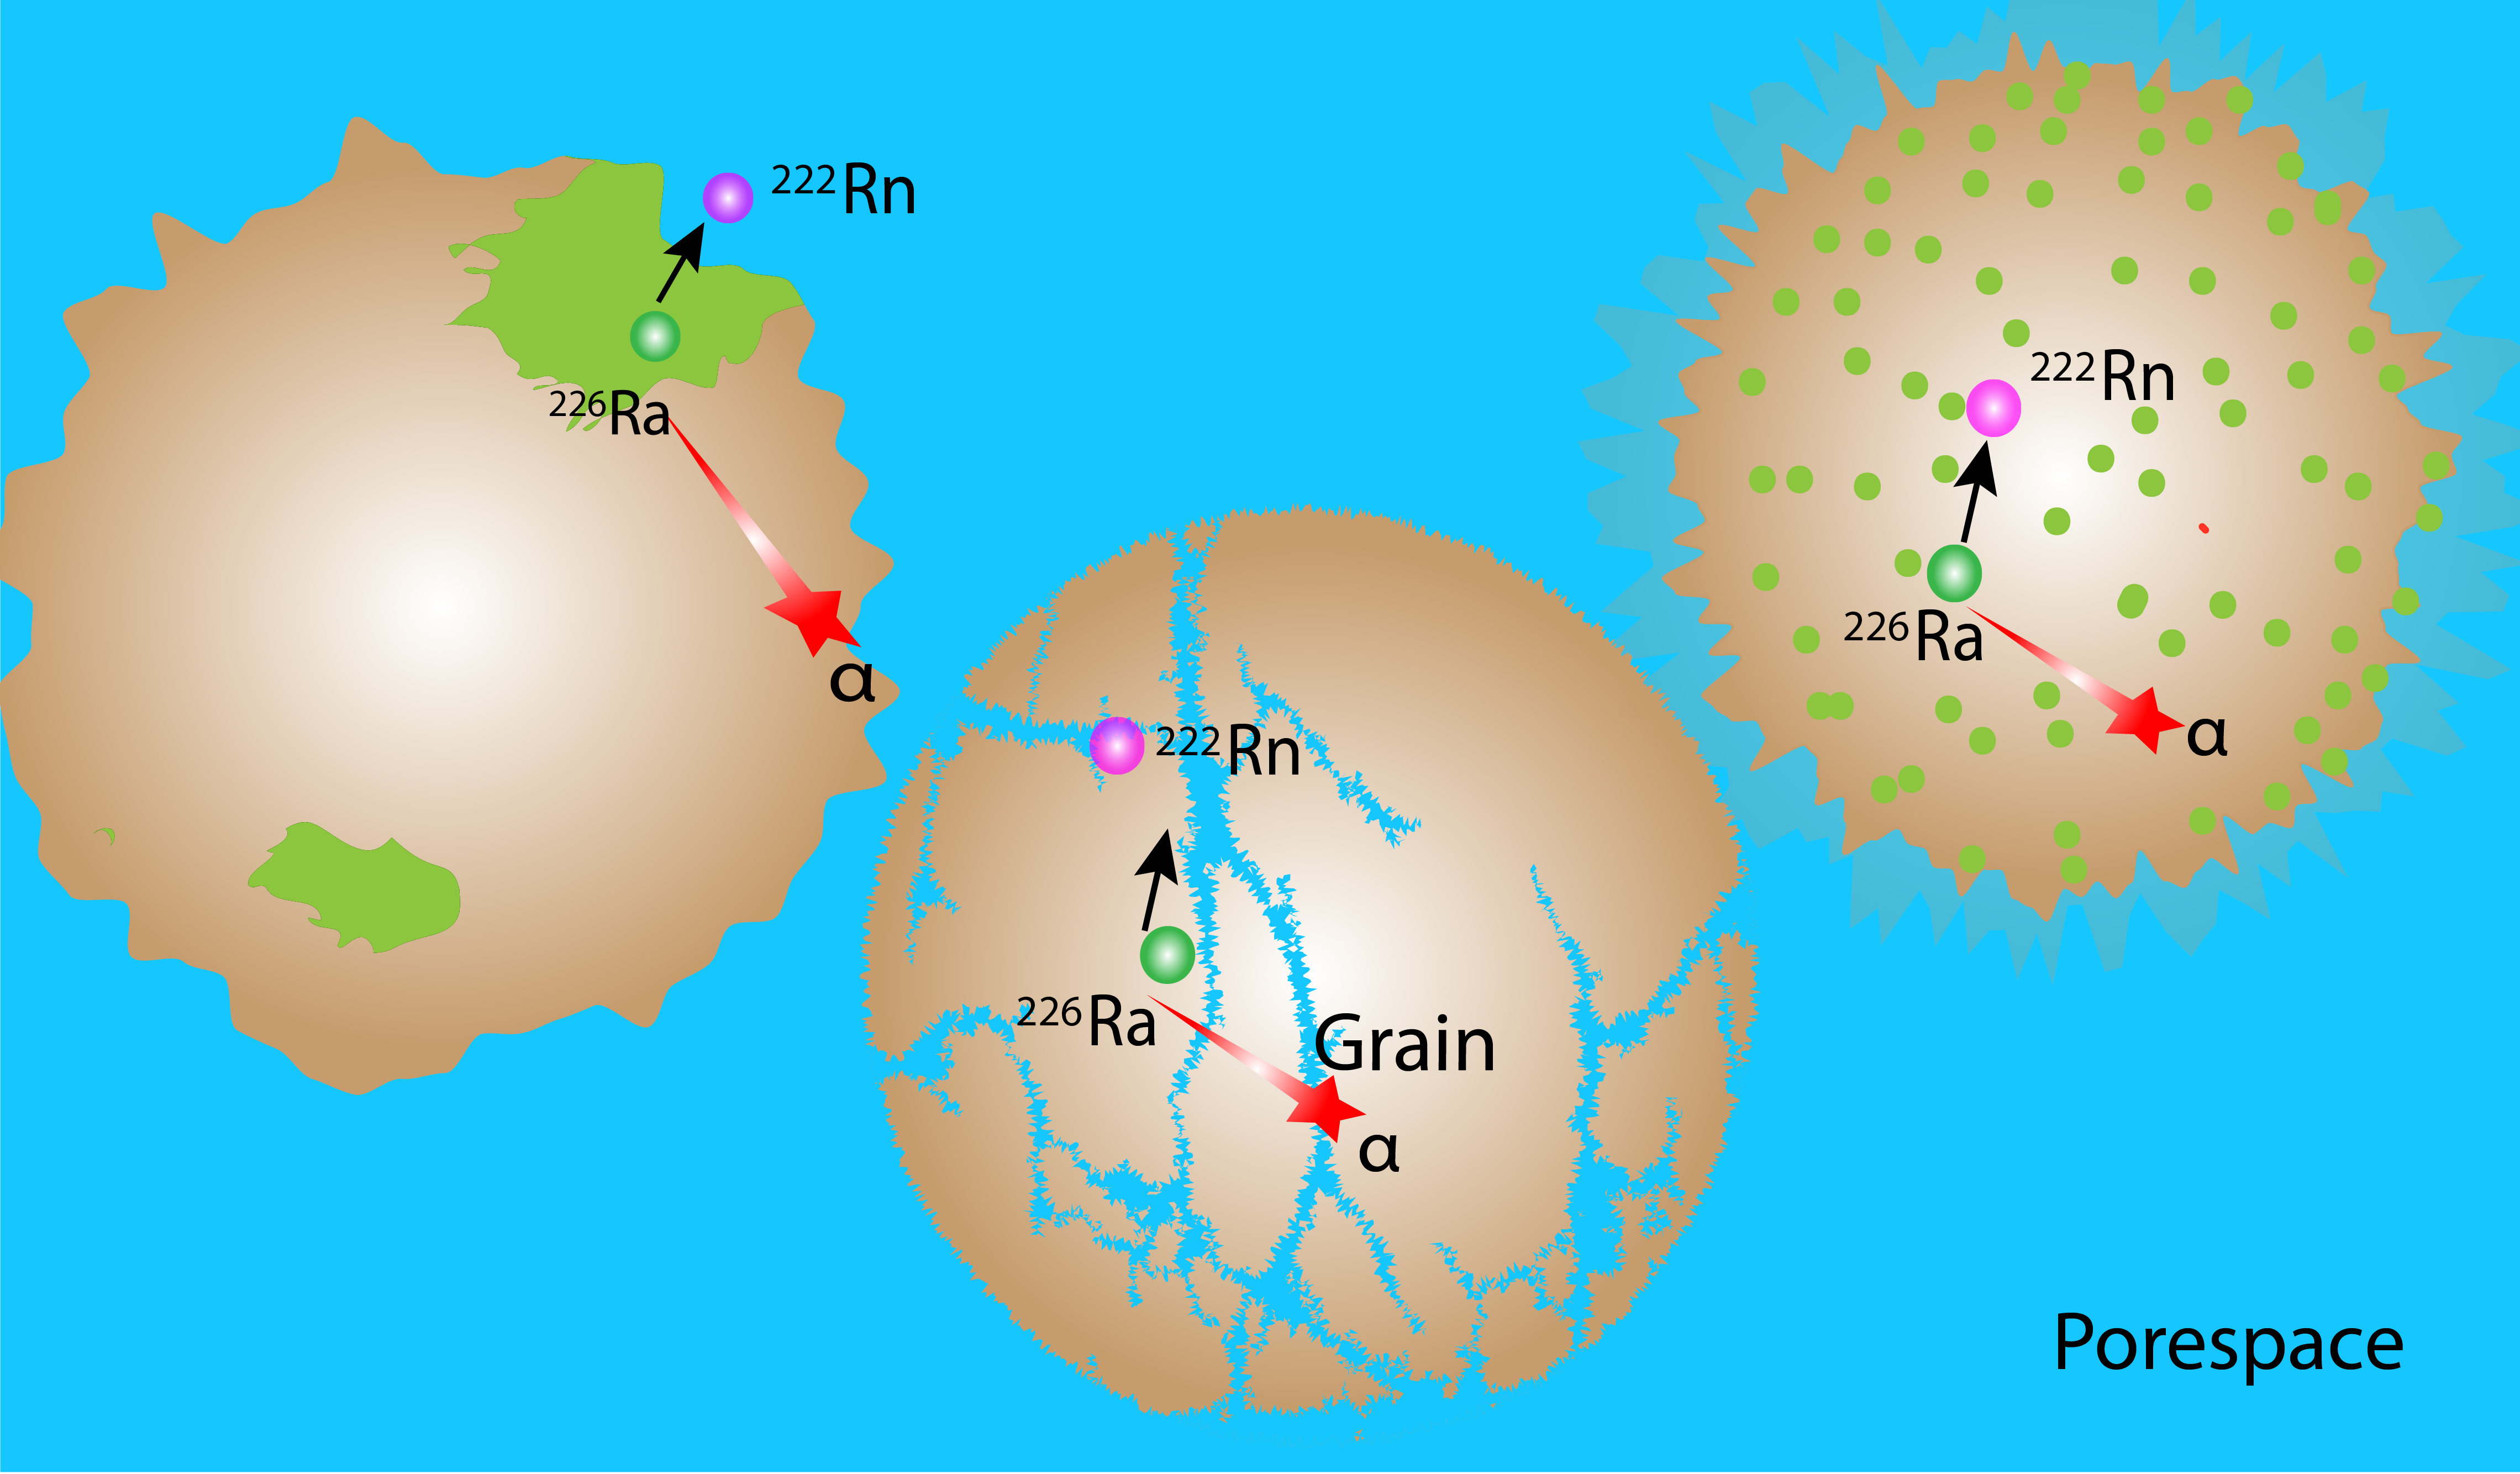
4.2. Role of Microstructure on Emanation

The size and shape of Ra-bearing mineral grains influences how much Rn will escape into adjacent pores. Consequently, the Rn emanation coefficient increases with decreased grain size. For example, with a grain radius increase from 0.5 to 8 μm, the emanation coefficient was found to decrease from 40% to 2% [1,28]. In addition to size, grains may contain a network of internal pores, which could act as conduits for Rn release to pore space. In intact rocks, the connected porosity generated from micro-fissures have been known to enhance Rn escape [26].The shale and pegmatite examined here have contrasting microstructure; crushed shale is composed of aggregated fine grain, micron sized particles possessing substantial nanoscale porosity, whereas mineral grains within crushed pegmatite are larger, often spanning several to tens of microns or more and with limited internal porosity relative to shale.

4.3. Predicting Radon Emanation

Despite an abundance of experimentally measured Rn-emanation coefficient data in the literature, the question remains as to how they can be utilized as a reliable indicator to identify regions vulnerable to prolonged Rn exposure to humans. With sufficient information on Rn emanation coefficients determined for different rocks, minerals, and soils and their variation in response to climatic conditions, emanation data could be used together with other pertinent characteristics to predict the amount of Rn generated by a geologic material. In practice, determining the Rn emanation coefficient relies on characterizing bulk characteristics of solids (e.g., solid phase Ra activity and measured release of Rn), but to our knowledge, there has been no successful effort to predict or constrain the emanation coefficient based on these (or other) parameters; in absence of such relationships, translating experimentally measured ε to a relatively larger scale remains uncertain, and other studies highlight that additional characterization of solids is required to improve predictions of soil-sedimentary Rn exhalation (flux from soils, sediments and rock); for example, Sakoda et.al emphasized the need for mineralogical studies to improve predictions of regions vulnerable to high Rn production [31].
Here, we attempt to relate the physical and chemical properties of host material to predict Rn (ε) and formulate a model to predict Rn emanation from different rock types. Critical parameters known or inferred to influence Rn emanation include the effective recoil distance, rock-mineral surface area, and the density of solids. Of these, little consideration is given to the recoil distance, which may vary more than 50% between minerals with different chemical and physical characteristics. For example, 222Rn travels a distance of 38.4 nm in quartz, whereas it travels a distance of 17.0 nm in thorianite [39]. As such, incorporating a recoil range parameter for minerals within Rn emanation model can enable improving predictions of ε for materials. One such approach is described as follows.
First, a spherical mineral grain with a uniform distribution of Ra is considered. The rate of Rn production (P) from this mineral grain may be expressed as in Equation (1). At steady state, P may be calculated analytically and expressed as a function of recoil range, surface area and activity of Ra:
P = λ A Ra SMR 1 4 V p
where, R 1 = the recoil range of Rn in a given material (m); S = surface area (m2 g−1); Vp = pore volume (m3). For more details on calculation of P, refer to SI: Steady state calculation of Rn Production rates.
Combining Equations (1) and (8), the Rn emanation coefficient is expressed as:
ε = S ρ R 1 4
Here, ε is dependent on surface area, density of the solid ( ρ ) , and recoil range of Rn within the solid. The recoil range of Rn in different solids is calculated using SRIM and input parameters for the SRIM code are listed in Table S1 [39].
Although a wealth of data exists for Rn emanation from bulk soils and sediments, there is a paucity of experimental measurements for Rn emanation from homogenous mineral samples. Sakoda et al. (2010) examined Rn emanation from quartz, microcline, and goethite [28], and the results of their measurements are compared with modeled emanation coefficients (Table 2). Using Equation (7), the predicted Rn emanation coefficient for microcline is 0.25, which is close to the measured values of 0.27. The predicted coefficient for goethite possessing a surface area of 86.4 is 1.81, which is an overestimation compared to the measured value of 0.43. While speculative, it is possible that other high surface area minerals may be present in the goethite sample, as Sakoda et al. used a heavy liquid procedure to separate mineralogical fractions [28]. Regardless, the model prediction matches measured emanation when using a surface area of 20 m2 g−1. The model, however, underestimates ε for two quartz samples by ~1–2 orders of magnitude. The discrepancy observed for quartz may be explained by the existence of micro- and nanopores that are not sensitive to detection through conventional BET surface area analysis, and which may act as conduits for Rn escape, thereby increasing Rn [16]. Other reasons include heterogeneity in particle shape and roughness, and heterogeneous distributions of parent radionuclides, even within seemingly (chemically) uniform samples. Thus, the accuracy of this model is dependent on accurate physical and chemical measurements, and assumes ideal particle morphologies which are clearly unrealistic for most natural samples. Nevertheless, the model illustrates the importance of recoil range, and factors that influence recoil range (e.g., chemical composition and density), on the ejection of daughter products from solids through alpha recoil. Moreover, it is a starting point for developing improved models for predicting Rn efflux, which may improve predictions of Rn exposure based on local soil, sediment, and rock characteristics.

5. Conclusions

Radon is produced from alpha decay of naturally occurring Ra existing with soil, sediment and rock solids. Only a fraction of Rn produced during decay crosses the grain boundary and enters adjacent pore space; this fraction of Rn is a primary variable that determines the emanation coefficient, but is also strongly influenced by mineralogical and physical characteristics that are rarely considered. Here, we examined the impacts of micro-scale chemical heterogeneity on the Rn emanation coefficient in shale and pegmatite. Our measurements reveal that shale, despite containing low U concentration (19 ppm), emanates 62% of produced Rn to pore space whereas pegmatite, with relatively high U concentration (3.2% by wt), emanates 0.2% of Rn to pore space. We illustrate that these differences in Rn emanation are attributed to disparate sample grain size distributions, which in turn controls the spatial distribution of Ra. In shale, a higher fraction of parent radionuclide exists within the recoil range than pegmatite, where a higher fraction exists deeper within individual grains (beyond the recoil range). These spatial patterns of U, Ra, and radioactivity were consistent with measurements using s-XRF, conventional electron microprobe analysis, autoradiography and sequential extractions. As a consequence, a higher fraction of the total Ra will emanate Rn to adjacent pores in shale rather than in pegmatite. Hence, the flux of Rn from each sample is similar, despite total parent radionuclide concentrations differing by orders of magnitude between samples. These experimental findings further demonstrate that bulk Ra (or U) activity in a rock is not necessarily proportional to the Rn emanation potential of a rock or mineral. Furthermore, assessing Rn emanation potential between two natural materials solely based on their bulk Ra (or U) ratio will lead to inaccurate Rn emanation predictions.
Modeling the Rn emanation coefficient for specific minerals yielded mixed results compared with those calculated through direct measurement of Rn and Ra. In particular, the predicted Rn emanation coefficient for microcline was nearly identical to the experimental value, but grossly underestimated the coefficient for quartz, likely because BET surface area measurements do not sufficiently measure internal microporosity and nanoporosity, or the contribution of surface area from these structures is not easily distinguished using BET. In addition, the mineralogical heterogeneity inherent to soils, sediments and rock currently limits its use as a predictive tool, owing to each mineral imparting a different recoil range [39]. It is not currently understood whether the effective recoil range associated with all minerals in soils-sediments-rocks may be calculated as a simple weighted average or must assume a different form. While challenging, incorporating appropriate recoil values and other model parameters are needed to improve predictions of Rn emanation from natural solids. This, coupled with relevant data pertaining to the system of interest (e.g., hydrologic data), may lead to empirical models capable of constraining risks to human health, of explaining variation in Rn flux from soils (and how soil and rock weathering and other disturbance alters these fluxes), and of helping to understand how alpha recoil affects the distribution and ratios of other important isotopes such as Ra.

Supplementary Materials

The following are available online at https://www.mdpi.com/2571-8789/2/2/30/s1, Figures S1–S6, Tables S1 and S2, a description of the sequential extraction procedure, and details regarding calculated radon production rates.

Author Contributions

N.M. and B.D.K. conceived and designed the experiments; N.M. performed the experiments; N.M. and B.D.K. analyzed the data; N.M. wrote the paper.

Funding

This research was funded in part by the MIT Energy Initiative (MITEI) and MIT Center for Environmental Health Sciences (CEHS).

Acknowledgments

The authors would like to thank Charles Harvey (MIT) for insightful discussions, John Neubaum (DCNR- Bureau of Topographic and Geological Survey, Harrisburg, Pennsylvania) for providing Marcellus shale cores, Charlie Settens (MIT, Cambridge) for his assistance with X-ray Diffraction analysis, and Scott E. Malstorm (MIT, Cambridge) for help with Micro-CT analysis, Bogdan I Fedeles (CEHS, MIT) for his help in using autoradiography, and SSRL scientists Sam Webb and Ryan Davis for their help with acquiring synchrotron-based data. We would also like to thank the reviewers for their valuable comments and insight, which helped improve the paper.

Conflicts of Interest

The authors declare no conflict of interest. The founding sponsors had no role in the design of the study; in the collection, analyses, or interpretation of data; in the writing of the manuscript, and in the decision to publish the results.

References

  1. Hassan, N.M.; Masahiro, H.; Ishikawa, T.; Sorimachi, A.; Sahoo, S.K.; Tokonami, S.; Masahiro, F. Radon Migration Process and Its Influence Factors. Jpn. J. Health Phys. 2009, 44, 218–231. [Google Scholar] [CrossRef]
  2. Nazaroff, W.W. Radon transport from soil to air. Rev. Geophys. 1992, 30, 137–160. [Google Scholar] [CrossRef]
  3. Baskaran, M. Radon: A Tracer for Geological, Geophysical and Geochemical Studies, 1st ed.; Springer: Cham, Switzerland, 2016; pp. 167–188. [Google Scholar]
  4. Hopke, P.K.; Borak, T.B.; Doull, J.; Cleaver, J.E.; Eckerman, K.F.; Gundersen, L.C.S.; Harley, N.H.; Hess, C.T.; Kinner, N.E.; Kopecky, K.J.; et al. Health Risks Due to Radon in Drinking Water. Environ. Sci. Technol. 2000, 34, 921–926. [Google Scholar] [CrossRef]
  5. USEPA. Health Risk of Radon. 2004. Available online: http://www.epa.gov/radon/health-risk-radon (accessed on 12 May 2016).
  6. Tanner, A.B. Radon migration in the ground: A supplementary review. In Natural Radiation Environment III: Proceedings of a Symposium Held at Houston, Texas, 23–28 April 1978, Volume 1 (DOE Symposium Series 51); U.S. Department of Energy: Washington, DC, USA, 1980; pp. 5–56. [Google Scholar]
  7. Bollhöfer, A.; Storm, J.; Martin, P.; Tims, S. Geographic variability in radon exhalation at a rehabilitated uranium mine in the Northern Territory, Australia. Environ. Monit. Assess. 2006, 114, 313–330. [Google Scholar] [CrossRef] [PubMed]
  8. Kiro, Y.; Weinstein, Y.; Starinsky, A.; Yechieli, Y. Application of radon and radium isotopes to groundwater flow dynamics: An example from the Dead Sea. Chem. Geol. 2015, 411, 155–171. [Google Scholar] [CrossRef]
  9. Genereux, D.P.; Hemond, F. Naturally Occurring Radon 222 as a Tracer for Streamflow Generation: Steady State Methodology and Field Example. Water Resour. Res. 1990, 26, 3065–3075. [Google Scholar]
  10. Vinson, D.S.; Tagma, T.; Bouchaou, L.; Dwyer, G.S.; Warner, N.R.; Vengosh, A. Occurrence and mobilization of radium in fresh to saline coastal groundwater inferred from geochemical and isotopic tracers (Sr, S, O, H, Ra, Rn). Appl. Geochem. 2013, 38, 161–175. [Google Scholar] [CrossRef]
  11. Liu, S.C.; Mcafee, J.R.; Cicerone, R.J. Radon 222 and Tropospheric Vertical Transport. J. Geophys. Res. 1984, 89, 7291–7297. [Google Scholar] [CrossRef]
  12. Kritz, M.A.; Le Roulley, J.-C.; Danielsen, E.F. The China Clipper—Fast advective transport of radon-rich air from the Asian boundary layer to the upper troposphere near California. Tellus B 1990, 42, 46–61. [Google Scholar] [CrossRef]
  13. Fleischer, R.L. Theory of alpha recoil effects on radon release and isotopic disequilibrium. Geochim. Cosmochim. Acta 1983, 47, 779–784. [Google Scholar] [CrossRef]
  14. Dyck, W. Radon-222 emanations from a uranium deposit. Econ. Geol. 1968, 63, 288–291. [Google Scholar] [CrossRef]
  15. Fleischer, R.L. Alpha-recoil damage and solution effects in minerals: Uranium isotopic disequilibrium and radon release. Geochim. Cosmochim. Acta 1982, 46, 2191–2201. [Google Scholar] [CrossRef]
  16. Rama; Moore, W.S. Mechanism of transport of U-Th series radioisotopes from solids into ground water. Geochim. Cosmochim. Acta 1984, 48, 395–399. [Google Scholar] [CrossRef]
  17. Semkow, T.M. Recoil-emanation theory applied to radon release from mineral grains. Geochim. Cosmochim. Acta 1989, 54, 425–440. [Google Scholar] [CrossRef]
  18. Hussain, N. Supply rates of natural U-TH series radionuclides from aquifer solids into groundwater. Geophys. Res. Lett. 1995, 22, 1521–1524. [Google Scholar] [CrossRef]
  19. Damkjaer, A.; Korsbech, U. Measurement of the emanation of radon-222 from Danish soils. Sci. Total Environ. 1985, 45, 343–350. [Google Scholar] [CrossRef]
  20. Megumi, K.; Mamuro, T. Emanation and Exhalation of Radon and Thoron Gases from Soil Particles. J. Geophys. Res. 1974, 79, 3–6. [Google Scholar] [CrossRef]
  21. Sakoda, A.; Ishimori, Y.; Yamaoka, K. A comprehensive review of radon emanation measurements for mineral, rock, soil, mill tailing and fly ash. Appl. Radiat. Isot. 2011, 69, 1422–1435. [Google Scholar] [CrossRef] [PubMed]
  22. Breitner, D.; Arvela, H.; Hellmuth, K.-H.; Renvall, T. Effect of moisture content on emanation at different grain size fractions—A pilot study on granitic esker sand sample. J. Environ. Qual. 2010, 101, 1002–1006. [Google Scholar] [CrossRef] [PubMed]
  23. Sun, H.; Furbish, D.J. Moisture content effect on radon emanation in porous media. J. Contam. Hydrol. 1995, 18, 239–255. [Google Scholar] [CrossRef]
  24. Stajic, J.M.; Nikezic, D. Theoretical calculation of radon emanation fraction. Nucl. Instrum. Methods Phys. Res. Sect. B 2014, 336, 19–25. [Google Scholar] [CrossRef]
  25. Arvela, H.; Holmgren, O.; Hänninen, P. Effect of soil moisture on seasonal variation in indoor radon concentration: Modelling and measurements in 326 Finnish houses. Radiat. Protect. Dosim. 2016, 168, 277–290. [Google Scholar] [CrossRef] [PubMed]
  26. Hellmuth, K.-H.; Siitari-Kauppi, M.; Arvela, H.; Lindberg, A.; Fonteneau, L.; Sardini, P. Radon emanation from fresh, altered and disturbed granitic rock characterized by 14 C-PMMA impregnation and autoradiography. Appl. Radiat. Isot. 2017, 127, 195–208. [Google Scholar] [CrossRef] [PubMed]
  27. Eakin, M.; Brownlee, S.J.; Baskaran, M.; Barbero, L. Mechanisms of radon loss from zircon; microstructural controls on emanation and diffusion. Geochim. Cosmochim. Acta 2016, 184, 212–226. [Google Scholar] [CrossRef]
  28. Morawska, L.; Phillips, C.R. Dependence of the radon emanation coefficient on radium distribution and internal structure of the material. Geochim. Cosmochim. Acta 1993, 57, 1783–1797. [Google Scholar] [CrossRef]
  29. Sun, H.; Semkow, T.M. Mobilization of thorium, radium and radon radionuclides in ground water by successive alpha-recoils. J. Hydrol. 1998, 205, 126–136. [Google Scholar] [CrossRef]
  30. Luo, S.; Ku, T.L.; Roback, R.; Murrell, M.; McLing, T.L. In-situ radionuclide transport and preferential groundwater flows at INEEL (Idaho): Decay-series disequilibrium studies. Geochim. Cosmochim. Acta 2000, 64, 867–881. [Google Scholar] [CrossRef]
  31. Sakoda, A.; Nishiyama, Y.; Hanamoto, K.; Ishimori, Y.; Yamamoto, Y.; Kataoka, T.; Kawabe, A.; Yamaoka, K. Differences of natural radioactivity and radon emanation fraction among constituent minerals of rock or soil. Appl. Radiat. Isot. 2010, 68, 1180–1184. [Google Scholar] [CrossRef] [PubMed]
  32. Taylor, P.; Sasaki, T.; Gunji, Y.; Okuda, T. Mathematical Modeling of Radon Emanation. J. Nucl. Sci. Technol. 2004, 41, 142–151. [Google Scholar]
  33. Haquin, G.; Yungrais, Z.; Ilzycer, D.; Zafrir, H.; Weisbrod, N. Detailed effects of particle size and surface area on Rn-222 emanation of a phosphate rock. J. Environ. Radioact. 2017, 180, 77–81. [Google Scholar] [CrossRef] [PubMed]
  34. Bateman, H. The solution of a system of differential equations occurring in the theory of radio-active transformations. Proc. Camb. Philos. Soc. 1910, 15, 423–427. [Google Scholar]
  35. USEPA. Method 3052: Microwave Assisted Acid Digestion of Siliceous and Organically Based Matrices; US Environmental Protection Agency: Washington, DC, USA, 1996.
  36. Giles, J.R. Pond Radium-226 Concentrations and Corrections. 1998. Available online: https://inldigitallibrary.inl.gov/PRR/81164.pdf (accessed on 23 April 2018).
  37. Tessier, A.; Campbell, P.G.C.; Bisson, M. Sequential Extraction Procedure for the Speciation of Particulate Trace Metals. Anal. Chem. 1979, 51, 844–851. [Google Scholar] [CrossRef]
  38. Rauret, G.; López-Sánchez, J.F.; Sahuquillo, A.; Rubio, R.; Davidson, C.; Ure, A.; Quevauviller, P. Improvement of the BCR three step sequential extraction procedure prior to the certification of new sediment and soil reference materials. J. Environ. Monit. 1999, 1, 57–61. [Google Scholar] [CrossRef] [PubMed]
  39. Ziegler, J.F.; Ziegler, M.D.; Biersack, J.P. SRIM—The stopping and range of ions in matter (2010). Nucl. Instrum. Methods Phys. Res. Sect. B 2010, 268, 1818–1823. [Google Scholar] [CrossRef]
  40. Chalmers, G.R.; Bustin, R.M.; Power, I.M. Characterization of gas shale pore systems by porosimetry, pycnometry, surface area, and field emission scanning electron microscopy/transmission electron microscopy image analyses: Examples from the Barnett, Woodford, Haynesville, Marcellus, and Doig units. AAPG Bull. 2012, 96, 1099–1119. [Google Scholar]
  41. Chermak, J.A.; Schreiber, M.E. Mineralogy and trace element geochemistry of gas shales in the United States: Environmental implications. Int. J. Coal Geol. 2014, 126, 32–44. [Google Scholar] [CrossRef]
  42. Sardini, P.; Angileri, A.; Descostes, M.; Duval, S.; Oger, T.; Patrier, P.; Rividi, N.; Siitari-Kauppi, M.; Toubon, H.; Donnard, J. Quantitative autoradiography of alpha particle emission in geo-materials using the BeaverTM system. Nucl. Instrum. Methods Phys. Res. Sect. A 2016, 833, 15–22. [Google Scholar] [CrossRef]
  43. Degering, D.; Krüger, F.; Scheiber, J.; Wolfgramm, M.; Köhler, M. Radionuclide Release in Geothermal Aquifers—The Role of Alpha Recoil. In Proceedings of the 2015 World Geothermal Congress, Melbourne, Australia, 19–25 April 2015. [Google Scholar]
  44. Weber, W.J.; Ewing, R.C.; Catlow, C.R.A.; de la Rubia, T.D.; Hobbs, L.W.; Kinoshita, C.; Matzke, H.; Motta, A.T.; Nastasi, M.; Salje, E.K.H.; et al. Radiation effects in crystalline ceramics for the immobilization of high-level nuclear waste and plutonium. J. Mater. Res. 1998, 13, 1434–1484. [Google Scholar] [CrossRef]
  45. Bloch, S.; Key, R.M. Modes of Formation of Anomalously High Radioactivity in Oil-Field Brines: Geologic Notes. AAPG Bull. 1953, 65, 154–159. [Google Scholar]
  46. Bower, W.R.; Pearce, C.I.; Droop, G.T.R.; Mosselmans, J.F.W.; Geraki, K.; Pattrick, R.A.D. Radiation damage from long-term alpha particle bombardment of silicates—A microfocus XRD and Fe K-edge XANES study. Mineral. Mag. 2015, 79, 1455–1466. [Google Scholar] [CrossRef]
  47. Lumpkin, G.R.; Ewing, R.C. Alpha-decay damage in minerals of the pyrochlore group. Phys. Chem. Miner. 1988, 16, 2–20. [Google Scholar] [CrossRef]
  48. Ames, L.L.; McGarrah, J.E.; Walker, B.A.; Salter, P.F. Uranium and radium sorption on amorphous ferric oxyhydroxide. Chem. Geol. 1983, 40, 135–148. [Google Scholar] [CrossRef]
  49. Gascoyne, M. The Environmental Behaviour of Radium; IAEA: Vienna, Austria, 1990. [Google Scholar]
  50. Sajih, M.; Bryan, N.D.; Livens, F.R.; Vaughan, D.J.; Descostes, M.; Phrommavanh, V.; Nos, J.; Morris, K. Adsorption of radium and barium on goethite and ferrihydrite: A kinetic and surface complexation modelling study. Geochim. Cosmochim. Acta 2014, 146, 150–163. [Google Scholar] [CrossRef]
  51. Porcelli, D.; Swarzenski, P.W. The Behavior of U- and Th-series Nuclides in Groundwater. Rev. Miner. Geochem. 2003, 52, 317–361. [Google Scholar] [CrossRef]
  52. Reynolds, B.C.; Wasserburg, G.J.; Baskaran, M. The transport of U- and Th-series nuclides in sandy confined aquifers. Geochim. Cosmochim. Acta 2003, 67, 1955–1972. [Google Scholar] [CrossRef]
  53. Sturchio, N.C.; Bohlke, J.K.; Markun, F.J. Radium isotope geochemistry of thermal waters, Yellowstone National Park, Wyoming, USA. Geochim. Cosmochim. Acta 1993, 57, 1203–1214. [Google Scholar] [CrossRef]
  54. Chen, M.; Kocar, B. Radium Sorption to Iron (hydr)oxides, Pyrite, and Montmorillonite: Implications for Ra Mobility. Environ. Sci. Technol. 2018, 52, 4023–4030. [Google Scholar] [CrossRef] [PubMed]
  55. Tamamura, S.; Takada, T.; Tomita, J.; Nagao, S.; Fukushi, K.; Yamamoto, M. Salinity dependence of 226Ra adsorption on montmorillonite and kaolinite. J. Radioanal. Nucl. Chem. 2014, 299, 569–575. [Google Scholar] [CrossRef]
  56. Ames, L.L.; McGarrah, J.E.; Walker, B.A. Sorption of Trace Constitutents From Aqueous Solution onto Secondary Minerals. II Radium. Clays Clay Miner. 1983, 31, 335–342. [Google Scholar] [CrossRef]
  57. Tachi, Y.; Shibutani, T.; Sato, H.; Yui, M. Experimental and modeling studies on sorption and diffusion of radium in bentonite. J. Contam. Hydrol. 2001, 47, 171–186. [Google Scholar] [CrossRef]
  58. Ishimori, Y.; Lange, K.; Martin, P.; Mayya, Y.; Phaneuf, M. Measurement and Calculation of Radon Releases from NORM Residues; IAEA: Vienna, Austria, 2013. [Google Scholar]
Figure 1. Schematic of the experimental design used in this study. The packed column is preconditioned by flushing with 50 pore volumes of 1 M MgCl2 and samples collected by opening valve 1. Upon completion of the preconditioning stage, valve 1 is closed and valve 2 is set in an open configuration to recirculate 10 mM NaCl (buffered at pH 6.6) through the column at the rate of 5 pore volumes per day. The activity in circulating fluid was regularly measured on High Purity Germanium detector (HPGe) based Gamma Spectrometric system with no disturbance of solids or flow conditions.
Soilsystems 02 00030 g001
Figure 2. Autoradiographs of (A) pegmatite and (B) shale, illustrating heterogeneity in radionuclide distribution within both host rock matrices studied here. The area of analysis for each sample spans ~10 × 10 cm. The colors indicate the intensity of bulk radioactivity in the solid. Orange and yellow indicates low bulk radioactivity and red indicates highest bulk radioactivity.
Soilsystems 02 00030 g002
Figure 3. Electron microprobe elemental map of a typical U-rich vein within pegmatite. (Left) back-scatter image of polished pegmatite rock specimen. (Right) elemental X-ray map of U in pegmatite obtained using energy dispersive spectrometer (EDS). Regions in blue indicate low concentration of U relative to green zones containing higher concentrations of U. The highest U signal is concentrated within veins spanning more than 50 µm in length and several µm in width.
Soilsystems 02 00030 g003
Figure 4. Uranium (U) sequential extraction data of shale and pegmatite. The total U concentration for each rock type is noted on top of the bars. The y-axis shows the percentage of total U extracted within each extraction step. The standard deviation associated with each extraction step was less than 10%.
Soilsystems 02 00030 g004
Figure 5. (A) Scanned image of 30-µm thick shale thin section showing location of two spots (A and B) selected for X-ray Fluorescence imaging of U. (A1,A2) µ-XRF maps of U at the two locations (A and B) marked on thin section. A1 is U map at spot A and A2 is U map at spot B. U hotspots are well-delineated in grains with diameters less than ~5 µm, with a dark red color in the µ-XRF map indicating highest U levels found in the thin section.
Soilsystems 02 00030 g005
Figure 6. Temporal profile of 222Rn and Ra activity in fluid (10 mM NaCl) circulating in column in closed loop for (A) column packed with pegmatite and (B) column packed with shale.
Soilsystems 02 00030 g006
Table 1. Rn emanation coefficients ( ε ) measured in fluid circulating through columns packed with shale and pegmatite. The values are mean ± standard deviation of measurement made during different time intervals of column operation.
Rn Emanation Co-Efficient ( ε )Bulk Uranium Concentration
Shale62 ± 10%19 ± 0.7 ppm
Pegmatite0.2 ± 0.03%18197 ± 560 ppm
Table 2. Comparison of modeled and experimental Rn emanation coefficient for different mineral types.
MineralSurface Area (m2 g−1)Bulk Density (g cm−3)Recoil Range (nm) aEmanation Coefficient (Predicted) bEmanation Coefficient (Measured) c
Quart (low S.A.)0.042.6538.40.0010.046
Quartz (high S.A.)2.002.6538.40.050.40
Microcline27.911.0035.70.250.27
Goethite (high S.A.)86.43.0027.91.810.43
Goethite (low S.A.) d203.0027.90.420.43
Thorite1.005.3527.10.04-
a Recoil range calculated using SRIM software [39]. b This study. c Experimental data obtained from Sakoda et al. (2010). d Hypothetical data based on a lower surface area than reported by Sakoda et al (2010), but using same emanation data for goethite.

