Cu, Pb, and Zn Sorption to Biogenic Iron (Oxyhydr)Oxides Formed in Circumneutral Environments


Department of Crop and Soil Science, North Carolina State University, Raleigh, NC 27695, USA
*
Author to whom correspondence should be addressed.
Soil Syst. 2018, 2(2), 18; https://doi.org/10.3390/soilsystems2020018
Submission received: 17 February 2018
/
Revised: 19 March 2018
/
Accepted: 30 March 2018
/
Published: 31 March 2018
(This article belongs to the Special Issue Soil Processes Controlling Contaminant Dynamics)
Abstract
:The transportation and immobilization of potentially toxic metals in near-surface environments may be partially controlled by sorption processes at the solid-water interface. Myriad studies have shown that iron (oxyhydr)oxides have large sorption capacities and form strong surface complexes with metal ions. Biogenic iron (oxyhydr)oxides (BIOS) form at redox gradients where dissolved ferrous iron encounters oxygenated conditions, allowing bacteria to outcompete abiotic Fe oxidation. This process produces biominerals with distinct surface and structural properties (incorporation of cell-derived organic matter, poor crystallinity, and small particle sizes) that may alter their metal-binding affinity and sorption processes. To better understand metal binding by BIOS, Cu, Pb, and Zn, sorption rate and isotherm studies were conducted with synthetic two-line ferrihydrite and BIOS. Additionally, X-ray absorption spectroscopy and total scattering were used to elucidate the BIOS mineral structure and metal ion surface structures. On a mass normalization basis, BIOS sorbed approximately 8, 4, and 2 times more Cu, Pb, and Zn, respectively, than 2LFh over similar dissolved concentrations. Spectroscopic analyses revealed poorly crystalline structures and small coherent scattering domain sizes for BIOS. Additionally, extended X-ray absorption fine-structure spectroscopy revealed Cu, Pb, and Zn sorbed to BIOS via inner-sphere complexes, similar to 2LFh. These results suggest that, in metal contaminated environments, BIOS are more efficient in metal binding than their synthetic counterparts.
Keywords:
BIOS; ferrihydrite; copper; lead; zinc; sorption; X-ray absorption spectroscopy (XAS); binding mechanisms
1. Introduction
Iron oxides, hydroxides, and oxyhydroxides (henceforth referred to as “iron (oxyhydr)oxides” for simplicity) are ubiquitous minerals [1,2], that can partially control the environmental fate and transportation of metals, such as Cu, Pb, and Zn [2,3,4,5,6,7,8,9,10,11,12,13,14,15,16]. In soil, sediments, and surface water, the oxidation of Fe can occur via abiotic and biotic processes [17], leading to the formation of iron (oxyhydr)oxides. Under aerobic, circumneutral pH settings, the rate of Fe(II) oxidation is rapid [18], with a lifetime in the order of minutes [19]. Conversely, in the suboxic zone (~5–50 µM O2 [20]) of redox gradients where fluids with high ferrous iron concentrations meet oxygenated conditions (e.g., groundwater seeps [21,22,23,24,25], wetland soils [26,27,28], and rhizospheres [29,30,31]), iron-oxidizing bacteria (FeOB) may compete with abiotic Fe(II) oxidation, [20] producing biogenic iron (oxyhydr)oxides (BIOS).
Several studies have shown that BIOS mineralogy closely resembles that of two-line ferrihydrite (2LFh) [8,32,33,34], a poorly crystalline iron oxyhydroxide [1,2] with small mineral domain sizes, poorly ordered structures, and high specific surface areas [32,34,35]. BIOS also have unique surface chemistries due to their association with bacteria and cell-derived organic matter (CDOM) [8,32,33,36], which may impact their ordering and surface charge [8]. These mineralogical and chemical properties have led to the suggestion that BIOS may have unique, and possibly enhanced, sorption reactivity. Interestingly, few studies have investigated the sorption of potentially toxic metal cations to BIOS [33,36,37,38,39] and, to the authors’ knowledge, no studies have determined the surface structure of Cu, Pb, and Zn sorbed onto environmentally produced BIOS. This is surprising because the extent [5,9,11,12,13,14,15,16,40,41,42] and mechanisms [9,11,13,15,16,40,42,43] of Cu, Zn, and Pb uptake by synthetic 2LFh have been extensively studied.
To develop accurate models of Cu, Pb, and Zn cycling in soils and surface waters under circumneutral pH conditions, it is imperative to develop an incisive understanding of their sorption to BIOS. To that end, sorption kinetics and isotherm studies were employed to determine the extent of macroscale Cu, Pb, and Zn sorption onto the environmentally produced BIOS and synthetic 2LFh, whereas molecular-scale spectroscopic approaches were used to elucidate Cu, Pb, and Zn surface-binding structures onto BIOS and 2LFh.
2. Materials and Methods
2.1. Materials
Type I deionized (DI) water was used to prepare all solutions. All chemicals used were reagent grade or higher purity and provided by Fisher Scientific, Sigma Aldrich, Alfa Aesar, and Strem Chemicals.
2.2. Biogenic Iron (Oxyhydr)Oxide (BIOS) Sampling and Sorbent Preparation
In February and April of 2016, BIOS samples were collected from the same location on the north side of Rocky Branch Creek near Pullen Park (35°46′48.8″ N, 78°40′01.4″ W; Raleigh, North Carolina) where iron (oxyhydr)oxides are known to occur throughout the year [34,44,45]. The stream water pH at this location ranged from pH = 6.2–6.5. Two distinct types of BIOS were harvested. The first type was composed of a “fluffy”, orange biomass (Supplementary Materials, Figure S1A) that was submerged under water, which was collected and placed into a 500 mL PP storage bottle using a 25 mL polypropylene (PP) syringe. Within a few minutes, the BIOS settled to the bottom and the water was decanted. This process of collection and decanting occurred 5 times to acquire ample BIOS. The second type was composed of a dense, “clay-like” bio-mat (Supplementary Materials, Figure S1B) that occurred at the stream’s surface. It was collected with a polypropylene (PP) spatula and placed into a 50 mL PP centrifuge tube. The samples were then taken back to the laboratory and a homogenized composite was produced for each sampling date, as described in the SI.
Two-line ferrihydrite was synthesized in the laboratory via the Schwertmann and Cornell method [46], with the specific details of synthesis and processing described in the Supplementary Materials. After processing, the ferrihydrite was frozen at −20 °C and then immediately lyophilized. The dried product was ground with an agate mortar and pestle and stored in the freezer at −20 °C until further use.
2.3. Characterization of BIOS and Two-Line Ferrihydrite (2LFh)
Methods for the characterization of sorbents have been previously described [47], and are provided in detail in the SI. Both the BIOS and 2LFh were analyzed for elemental composition, including metals, P, and S.
BIOS and 2LFh mineral phase, particle morphology, and surface properties were also examined. To investigate the BIOS and 2LFh mineral phase, powder X-ray diffraction (XRD) was used, with specific details of sample preparation and analysis described elsewhere [47]. Iron K-edge X-ray absorption spectroscopy (XAS) was also used to elucidate mineral phases, whereas X-ray total scattering was used to determine the mineral domain sizes of the BIOS and 2LFh, as described below. BIOS and 2LFh particles were imaged via transmission electron microscopy (TEM). BIOS and 2LFh suspensions were pipetted onto silicon nitride wafers, allowed to air dry, then analyzed on a scanning transmission electron microscope (JEOL 2000FX S/TEM) operating at an accelerating voltage of 200 kV and under 1 atm. The surface charge of the BIOS was determined by triplicate ζ-potential analyses at pH = 6.00 ± 0.1, I = 0.01 M NaNO3, with a 1 g L−1 sorbent concentration using a Malvern Zetasizer Nano Z (Worcestshire, UK). A 1-point Brunauer-Emmett-Teller (BET) specific surface area (SSA) was determined with a Quantachrome Monosorb (MS-17).
2.4. Rates of Copper, Lead, and Zinc Sorption to Iron Minerals
All sorption kinetic studies were performed in 250 mL PP bottles with the April BIOS and 2LFh solid loadings of 1 g L−1 (0.25 g L−1 for Pb sorption kinetics). Initially, all sorption studies were performed with a sorbent concentration of 1 g L−1 (Supplementary Materials Table S1); however, to obtain quantifiable dissolved Pb equilibrium concentrations, a 0.25 g L−1 sorbent concentration was chosen. The sorbent solutions were buffered at pH = 6.0 with 0.01 M 2-(N-morpholino)ethanesulfonic acid (MES) with a background electrolyte concentration of 0.01 M NaNO3. This pH was chosen to mimic the stream conditions where the BIOS were collected. Metal stock solutions were made via the addition of Cu(NO3)2·3H2O, Pb(NO3)2, and Zn(NO3)2·6H2O into solutions containing 0.01 M NaNO3 and 0.01 M MES to achieve concentrations of Cu, Pb, and Zn of 15.74 mM, 4.83 mM, and 15.30 mM, respectively. All metal concentrations in stock solutions were undersaturated with respect to likely phases, as calculated with Visual Minteq 3.0 [48].
At the beginning of the experiment (t = 0 h), 12.5 mL of the metal stock solutions were pipetted with continuous stirring into the BIOS or 2LFh sorbent container in order to achieve initial Cu, Pb, and Zn concentrations of 0.79 mM, 0.24 mM, and 0.76 mM, respectively. Over a period of 72 h, 5 mL aliquots were taken via syringe and filtered with a 0.22 µm nylon filter. The filtrates were acidified with HNO3 acid, then stored in the fridge at 4 °C until further analysis.
All Cu, Pb, and Zn filtrate samples were analyzed with a Thermo Scientific iCE 3000 atomic absorption spectrometer (AAS). Analytical quality assurance was monitored by analyzing a 1% nitric acid blank every tenth sample and by running a mid-range calibration standard at the end of every analysis, with all measurements within 5% of their known value.
2.5. Adsorption Isotherms
Copper, Pb, and Zn adsorption isotherms were conducted with the April BIOS and 2LFh at sorbent concentrations of 1 g L−1 for the Cu and Zn adsorption experiments, whereas a 0.25 g L−1 sorbent concentration was used for the Pb adsorption experiments. All Cu, Pb, and Zn stock solutions were made from their respective nitrate salts (Section 2.4), had a background electrolyte concentration of 0.01 M NaNO3 and buffered to pH = 6.0 with MES. A known volume of the metal stock solutions were pipetted into 50 mL PP centrifuge tubes in order to achieve Cu, Pb, and Zn concentration ranges of 0–1.57 mM, 0–0.24 mM, and 0–15.30 mM, respectively. A final reaction volume of 40 mL was achieved with 0.01 M NaNO3 buffered to pH = 6.0 with MES. The samples were rotated end over end onto a Scilogex MX-RD-Pro tube rotator at 30 rpm. The pH of the adsorption experiments were monitored with a Fisher Scientific Accumet XL20 pH meter at t = 0, 3, 24, and 48 h and if needed, adjusted with 0.01 M NaOH or 0.01 M HNO3 in order to keep the pH = 6.0 ± 0.1. At t = 48 h, the experiments were centrifuged at 10,000 × g for 10 min, followed by filtration of 20 mL aliquots with 0.22 µm nylon filters. The filtrates were acidified with HNO3 acid, then stored at 4 °C until further analysis. All adsorption isotherms were performed in duplicate.
Aqueous Cu, Pb, and Zn concentrations were measured by AAS (Section 2.4). If Cu, Pb, and Zn filtrate concentrations were <0.79 µM, 0.24 µM, and 0.76 µM, respectively, samples were remeasured by using inductively coupled plasma-mass spectroscopy (ICP-MS; Perkin-Elmer Elan DRC II) in reaction mode. The sorbed amounts of Cu, Pb, and Zn were calculated as the difference between the initial aqueous Cu, Pb, and Zn concentration (pre-sorption) and their aqueous concentrations (post-sorption). Non-linear optimization in a preprogrammed Excel spreadsheet [49] was used to fit the Cu, Pb, and Zn isotherm data with Freundlich fits.
2.6. X-ray Absorption Spectroscopy Sample Preparation and Analysis
Fe K-edge spectra were collected at beamlines 4-1 and 4-3, and Cu and Zn K-edge and Pb LIII- edge spectra were collected at beamline 11-2 at the Stanford Synchrotron Radiation Lightsource (SSRL). All samples were loaded onto aluminum sample holders as wet pastes and kept moist by sealing with kapton tape. For Fe K-edge spectra, 2LFh and BIOS samples were collected at room temperature in transmission mode. Spectra for 2LFh and BIOS were collected at low and high Cu, Pb, and Zn concentrations (Supplementary Materials Table S1) at room temperature in fluorescence mode using a 100-element Ge detector. Monochromator energy was calibrated by adjusting the first derivative maxima of Fe, Cu, Pb, and Zn foils to their element-binding energies of 7112 eV, 8979 eV, 13035 eV, and 9659 eV, respectively. On beamline 4-1 and 11-2, the incident beam was energy selected using a Si (220) double-crystal monochromator, and harmonics were rejected by detuning beam energy by 50%, 40%, 30%, and 40% for Fe, Cu, Pb, and Zn, respectively. On beamline 4-3, rhodium coated mirrors were used to reject harmonics and energy was selected with a Si(111) monochromator. Iron, Cu, Pb, and Zn spectra were collected using Soller slits and Mn, Ni, Se, and Cu filters, respectively. For Cu and Zn spectra, aluminum foil (4–6 sheets) were placed between the sample and detector to reduce high background fluorescence from Fe. For selected samples, multiple spectra were collected for each sample, with no evidence of beam damage in successive scans, and averaged to improve the signal-to-noise ratio.
Spectra were energy calibrated, averaged, background-subtracted, and splined as described by Kelly et al. [50] using the SIXPACK interface [51], which makes use of the IFEFFIT code [52]. To determine the oxidation state of Fe within the BIOS, linear-combination fitting (LCF) of the X-ray absorption near edge structure (XANES) spectra was performed from 7100 eV to 7200 eV using pyrite and lepidocrocite standards, which serve as Fe(II) and Fe(III) standards, respectively. The reported LCFs were normalized to 100%, with raw summations ranging from 99 ± 1% to 100 ± 1%. Additionally, Fe K-edge extended X-ray absorption fine structure (EXAFS) spectra were analyzed by LCF using iron mineral standards to investigate the BIOS mineral phase and structure. The standards that made up less than 10% of the linear combination fit were removed, and fits were recalculated using the remaining standards, with standards [53,54] used in the LCF listed in the supplementary information (Supplementary Materials Table S2; standards in bold were used in the final fits). The reported Fe K-edge EXAFS LCFs were normalized to 100%, with the raw summation ranging from 95–100 ± 1–8%. Additionally, LCFs were also used to estimate Cu, Pb, and Zn sorbed to the iron mineral and biomass within the BIOS. A standard with Cu, Pb, or Zn sorbed to ferrihydrite was used to represent Cu/Pb/Zn bound to the iron mineral, whereas Cu [55], Zn [56], and Pb bound to Pseudomonas putida biomass was used to represent the proportion of Cu/Pb/Zn sorbed to the biomass within the BIOS (Supplementary Materials Table S3). All reported fits are normalized to 100%, with the raw summation ranging from 90–110 ± 2–8% for EXAFS spectra.
Shell-by-shell structural fits for Cu- and Zn-, and Pb-bearing synthetic 2LFh and BIOS were performed on the K-edge, and LIII-edge EXAFS spectra, respectively, using SIXPACK software [51]. All spectra were modeled with parameters from the EXAFS equation. Paths for Cu, Pb, and Zn were generated from a Fe substituted Cu(OH)2, red tetragonal Pb(II) oxide, and franklinite (ZnFe2O4), respectively, using Feff9 [57]. An additional octahedral Zn-O path was generated from a Zn substituted NiO. The amplitude-reduction factor () was fixed for all shells at 0.9 for Cu [58], 0.843 for Pb [59], and 0.86 for Zn [60]. The EXAFS parameter ΔE0 was allowed to float during optimization, but was linked to a common value for every shell considered for each sample. Values for the Debye–Waller parameter (σ2) for Cu and Zn were obtained from initial shell-by-shell fits and were fixed for the final fits with σ2 values within the ranges of reported literature values [9,13,42,61,62]. For Pb, all σ2 values were held constant at 0.01 Å2 [13,15].
Existing models for Cu(II) sorption onto ferrihydrite have utilized a Cu-O first shell at (R = 1.93–1.95 Å) along with a bidentate, edge-sharing complex at (R = 2.95–3.01 Å) [13]. After initial fits, it was determined that the addition of a Cu–O–O multiple scattering path statistically improved the fit [63,64]. Hence, we constructed a model with Cu–O and Cu–Fe/Cu for the first and second shell, respectively, with the addition of a Cu–O–O multiple scattering path. The coordination number (N) and interatomic distance (R) were allowed to float for the single-scattering paths, whereas N, R, and σ2 for the multiple-scattering path were fully constrained by the relevant single-scattering paths [65].
Typically, published models for Pb(II) sorption onto iron (oxyhydr)oxides have been fit with a Pb–O first shell at (R = 2.26–2.34 Å) and a second shell corresponding to a bidentate, edge-sharing complex at (R = 3.29–3.36 Å) [3,4,13,15]. We thus created a model with Pb–O and Pb–Fe for the first and second shell, respectively, with N and R allowed to float. After initial fits, it was determined that the addition of a second Pb–Fe path improved the quality of the fit for all samples at a 95% confidence interval [63,64].
Models for Zn(II) sorbed to ferrihydrite have been fit with a Zn–O first shell at (R = 1.97−1.99 Å) accompanied by two Zn–Fe/Zn bidentate, binuclear complexes at distances at R = 3.21−3.30 Å and R = 3.44−3.48 Å [62]. Therefore, we built a model with a first shell containing Zn–O along with two Zn–Fe/Zn paths with N and R allowed to float. After initial fits, it was found that the addition of an octahedral Zn–O path improved the quality of the fits for all samples with surface Zn loadings of 188 µmole g−1 or higher (Supplementary Materials Table S1) at a 95% confidence interval [63,64].
2.7. X-ray Total Scattering
X-ray total scattering experiments were conducted at the Advanced Photon Source, Argonne National Laboratory on beam line 11-ID-B. Synthetic 2LFh and BIOS used in the sorption studies were packed and sealed into ~1 mm polyimide (Kapton) capillaries. All data were collected at ambient temperature using a Perkin Elmer amorphous silicon detector. An X-ray energy of ~59 keV (λ = 0.21130 Å) was used for wide-angle measurements with a ~14 cm sample-to-detector distance.
A CeO2 standard was used to calibrate the sample-to-detector distance. The raw 2-D scattering data were integrated and converted to 1-D intensity vs wave vector (Q) spectra using Fit2D software [66]. During the integration process, a polarization correction factor of 0.95 was applied. Diffraction spots resulting from dead pixels and columns in the detector and crystalline phases were masked prior to integrating the raw data. This masking procedure has been used in other total scattering experiments [35] and does not significantly affect the data. The total scattering structure function S(Q), reduced structure function F(Q), and the pair distribution function (PDF) were obtained using the program PDFgetX3 [67], where standard corrections were applied along with those unique to image-plate geometry [68]. The total scattering structure function S(Q) was obtained by normalizing synthetic 2LFh and BIOS to their elemental compositions (Table 1). Whereas the PDF or G(r) was obtained by Fourier transforming S(Q), with a Qmax = 26.5 Å−1. From the PDF, details about the short-, medium-, and long-range structural order can be obtained, as well as estimates of a mineral’s coherent scattering domain (CSD) size based off of the distance r(Å) at which the PDF signal-to-noise ratio is one [69,70]. Estimated errors for CSDs are ± 3 Å [71].
3. Results and Discussion
3.1. 2LFh and BIOS Mineral Characterization
The BIOS are similar in properties to other samples collected at different dates [34,47]. Briefly, transmission electron micrographs of synthetic 2LFh, Feb BIOS, and April BIOS are shown in Figure 1. The morphology of 2LFh consists of rounded aggregates with jagged edges. Whereas Feb BIOS is comprised of <100 nm rounded particles with irregular edges that coalesce to form large, loosely packed aggregates, April BIOS is composed of larger aggregates. The tube-like and fibrous structures seen in Figure 1B,C are similar to iron (oxyhydr)oxide morphologies that have been produced by FeOB [24,26,32,34,44].
Elemental compositions of the BIOS samples and synthetic 2LFh are shown in Supplementary Materials Table S3. The BIOS samples’ components were predominantly composed of Fe (261.9–464.2 g kg−1 solid) and C (35.3–88.2 g kg−1 solid) in good agreement with BIOS sampled at previous dates [34,47]. Major elements (Al, Si, Ca, P, S, and N) ranged from 0.4–14.5 g kg−1 solid, whereas minor elements (Mn, K, Mg, Na, Pb, Zn, and Cu) were all below 1 g kg−1 solid and consistent with BIOS sampled from Axial Volcano located in the north-east Pacific Ocean [72]. Synthetic 2LFh Fe concentration was 611.0 g Fe kg−1 solid and agrees well with other reported values [47,73].
X-ray diffraction patterns for synthetic 2LFh and BIOS are shown in Supplementary Materials Figure S2. For all BIOS samples and 2LFh, two broad maxima typical of ferrihydrite [1,74] are seen at ~35°2Θ and ~62°2Θ, which correspond to d-spacings of ~2.6 Å and ~1.5 Å, respectively. In comparison to synthetic 2LFh, the BIOS maxima are less intense and broader, indicative of increased structural disorder [35], and are similar to XRD patterns from previous BIOS sampling dates [34,47]. Sharp peaks in the BIOS diffraction patterns arise from quartz (Qz) present in the biofilm or, the sample holder.
Iron K-edge XANES and EXAFS spectra of the BIOS samples and 2LFh are plotted along with select Fe mineral standards in Figure 2A,B, respectively; LCFs are shown as overlain black dotted lines. XANES LCFs for the Feb and April BIOS are best fit with 100% lepidocrocite, a Fe(III) standard, indicating that no Fe(II) component (<10%) is in the BIOS fits. Consistent with other BIOS sampling dates [34,47], our EXAFS LCFs showed that the Feb and April BIOS spectra were more poorly crystalline than 2LFh (Table 1). A visual comparison of the BIOS EXAFS spectra with the 2LFh spectra reveals that the main difference appears in the k-space region between 7–8 Å−1 where substantial dampening of the BIOS samples’ maxima occurs, which signifies a decrease in Fe-O6 corner-sharing octahedra [75,76] and have been reported for other BIOS and natural iron (oxyhydr)oxides [34,35,47,70,75].
X-ray total scattering PDFs of BIOS and 2LFh are plotted along with a 3 nm ferrihydrite (Fh) standard [69] in Figure 3. When compared to the 3 nm Fh std, both the 2LFh and BIOS PDFs have similar short- and medium-range ordering (Figure 3A). However, there are distinctive differences. Both 2LFh and the BIOS samples PDFs attenuate at lower radial distances and peak maxima are considerably broader indicating increased structural disorder [69]. Coherent scattering domains represented by solid, black arrows in Figure 3A for 2LFh and BIOS are estimated to be 20 Å and 18 Å, respectively, values consistent with those reported for 2LFh [69,77,78], and BIOS sampled from a California mercury mine [35] and Loihi Seamount [70].
A comparison of the short-range order of the samples is shown in Figure 3B with select peak assignments labeled (a–d). The first three main peaks (b–d) in 2LFh have been assigned to Fe-O, Fe-Fe edge sharing, and Fe-Fe corner-sharing distances of 1.98 Å, 3.03 Å, and 3.44 Å, respectively [77], and occurs at equivalent distances in the BIOS PDF. However, a substantial decrease in peak (d) intensity in the BIOS PDF is seen, indicating fewer Fe–Fe corner sharing linkages and a decrease in crystallinity. Similar results were seen when investigating iron precipitation in the presence of arsenate, phosphate, silica, and organic ligands [75,76,79,80,81]. The incorporation is further supported by the appearance of peak (a) in the BIOS PDF (Figure 3B) that can be attributed to the Si–O atom pair at ~1.60 Å [35]. Thus, X-ray total scattering results indicate that the BIOS has a less ordered structure than 2LFh, consistent with our EXAFS and XRD measurements, and other observations of BIOS and natural iron (oxyhydr)oxides [34,35,47,70,75].
At pH = 6.0, surface charge for Feb and April BIOS was −1.7 ± 4.1 and −14.8 ± 6.1 mV, respectively. Therefore, both BIOS samples have a point of zero charge (pzc) ≤ pH = 6, which is substantially lower than synthetic ferrihydrite with a reported pHpzc = 7.8–8.5 [15,62,82]. These results are in good agreement with Sowers et al. [34] and Zhu et al. [83] who showed that the pHpzc for BIOS, and ferrihydrite-organic matter composites, respectively, were lower than synthetic two-line ferrihydrite, likely due to the presence of carboxylic acid and phosphoryl functional groups with pKa values of ~4 and ~6, respectively, in associated CDOM [84,85].
Lastly, Brunauer, Emmett and Teller specific surface area analyses (BET SSAs) for 2LFh, Feb BIOS, and April BIOS were determined to be 242, 277, and 177 m2 g−1, respectively, and falls within the range of SSAs reported for other BIOS and natural iron (oxyhydr)oxides [34,35,47,84,86,87]. The lower SSA of the April BIOS may arise due to the increased amounts of C (Supplementary Materials Table S3) causing aggregate formation seen in Figure 1C that may reduce the adsorption of N2 to all of the BIOS mineral surfaces [35,88].
3.2. Cu, Pb, and Zn sorption to 2LFh and BIOS
The mass normalized sorption of Cu, Pb, and Zn onto 2LFh and BIOS as a function of time is shown in Figure 4A. For BIOS, Cu and Pb sorption increased rapidly within the first eight hours, with >90% of the total sorption occurring during that time. Maximum sorption was reached at 24 h with sorbed concentrations of Cu and Pb at 725 and 830 µmol g−1 solid, respectively. Zinc sorption to BIOS was slower, with only ~75% of the total sorption occurring in the first 8 h; concentrations approached maximum values of ~280 µmol Zn g−1 solid at 48 h. For 2LFh, Cu, Pb, and Zn sorption was slower than BIOS with only 61%, 61%, and 73% of the total sorption occurring within the first eight hours, respectively. By 48 h, sorbed concentrations of Cu, Pb, and Zn approached maximum values of ~305, ~520, and ~190 µmol g−1 solid, respectively. Thus, a 48 h equilibration time was chosen for our sorption isotherm experiments.
The rate of metal sorption for BIOS and 2LFh is consistent with other kinetic studies of Cu, Pb, Zn, Cd, and Sr sorption onto ferrihydrite [5,15,89] and BIOS [39]. For both BIOS and 2LFh, the metal affinity occurred in the order of Pb > Cu > Zn, in agreement with previous ferrihydrite [90] and hematite [91] sorption studies. The BET SSA normalized sorption of Cu, Pb, and Zn onto 2LFh and BIOS as a function of time is shown in Figure 4B. At 48 h, sorption maxima for Cu, Pb, and Zn onto BIOS were ~4.13, ~4.71, and ~1.58 µmol m−2, respectively. Whereas for 2LFh, sorption maxima for Cu, Pb, and Zn at 48 h were ~1.26, ~2.14, and 0.80 µmol m−2, respectively.
The mass normalized sorption of Cu, Pb, and Zn onto 2LFh and BIOS as a function of dissolved Cu, Pb, or Zn concentration is shown in Figure 5A–E, with surface normalized plots in Supplementary Materials Figure S3A–E. For both 2LFh and BIOS, Cu, Pb, and Zn sorption onto the surfaces increase with increasing dissolved Cu, Pb, and Zn concentrations, followed by decreases in the slope as higher dissolved concentrations are reached (L-type isotherm) [92]. In all cases, sorption to BIOS exceeded that of 2LFh. When comparing Cu sorption onto 2LFh (Figure 5A) and BIOS (Figure 5B) at similar dissolved Cu concentrations (~50 M Cu), BIOS sorbed aproximately 8 times more Cu (900 g−1 solid) than 2LFh (110 g−1). Values for 2LFh were consistent with the range (50–110 Cu g−1) reported for three differently prepared synthetic ferrihydrite samples under similar dissolved Cu concentrations at pH = 5.5 [93] and for goethite, hematite, and lepidocrocite (~160, ~150, and ~135 g−1, respectively) at similar dissolved Cu concentrations at pH = 6.5 [94].
Like Cu, Pb sorption to BIOS (Figure 5D) was substantially larger than to 2LFh (Figure 5C) at similar dissolved Pb concentrations. At Pb equilibrium concentrations of ~6 µM, sorbed Pb concentrations for 2LFh and BIOS were ~170 and ~750 g−1 solid, respectively. These Pb surface excess values for 2LFh were lower than the maximum sorption values of ~1000 Pb g−1 solid observed for ferrihydrite under similar dissolved Pb concentrations at pH = 5.5 and 6.5 [15]. The low Pb surface excess values seen for 2LFh likely arise due to the larger aggregates (Figure 1A) from the freeze-drying process, which has been shown to decreases Cu and Pb sorption when compared to fresh, non-dried ferrihydrite gel [13].
Zinc sorption to BIOS and 2LFh is plotted as a function of concentration in Figure 5E. At dissolved Zn concentrations of ~2500 µM, 2LFh and BIOS Zn surface excess values were ~250 and ~550 g−1 solid, respectively. This value for 2LFh is roughly half of that seen for synthetic ferrihydrite (~470 Zn g−1 solid) at similar dissolved Zn concentrations [62]; these differences in Zn sorption likely arise due to differences in experimental conditions, including higher sorbent concentrations (1 vs. 2 g L−1), pH (6 vs. 6.5), and ferrihydrite preparation.
It should be noted that surface-area normalized sorption trend mirror those of mass normalized sorption (Supplementary Materials Figure S3). Cu, Pb, and Zn surface excess values (in µmol m−2) for BIOS are approximately 11, 5, and 2.5 times larger than for 2LFh, respectively, at similar dissolved concentrations. Interestingly, Feb BIOS used for XAS measurements sorbs more consistently with April when surface area normalized (as opposed to mass normalized; cf. Figure 5 and Supplementary Materials Figure S3). This is consistent with a previous study that found that surface-area normalization was an effective way to account for variation between BIOS samples [34].
Under the experimental conditions tested, Cu, Pb, and Zn sorption to BIOS was substantially larger than 2LFh, consistent with many studies that show increased metal and anion retention by BIOS [34,38,84] and iron (oxyhydr)oxide-organic matter composites [11,83,95] when compared to their synthetic counterparts. These differences in sorption between BIOS and 2LFh can be attributed to three likely explanations. First, BIOS have more poorly ordered structures (Supplementary Materials Figure S2, Figure 2 and Table 1), smaller CSDs (Figure 3), and lower pHpzc than 2LFh, leading to higher metal affinities. Second, at pH = 6, 2LFh (pHpzc ~8.0) surface charge will have substantially more positive surface binding sites causing repulsion and decreased metal sorption compared to BIOS. Lastly, freeze-dried ferrihydrite has been shown to substantially lower Cu and Pb sorption capacities when compared to non-dried ferrihydrite gel due to aggregation of the ferrihydrite particles, which blocks surface-binding sites [13].
Interestingly, the variation between BIOS and 2LFh Cu and Pb sorption are substantially larger than Zn sorption. Although lower Zn affinities have been observed for humic acids [96], fulvic acids [97], and extracellular polymeric substances [98,99] when compared to Cu and Pb, our EXAFS LCFs for BIOS (Supplementary Materials Figure S4) shows little variation in organic matter (biomass) bound Cu, Pb, and Zn (Supplementary Materials Table S5). However, a more likely reason for the higher Cu and Pb sorption compared to Zn sorption can be explained by their sorption edges to 2LFh. At metal concentrations of 50 µM and a ferrihydrite concentration equating to 1 mM Fe, Benjamin and Leckie [5] determined adsorption edges for Cu, Pb, and Zn to occur at approximate pHs of 5.0, 5.6, and 6.4, respectively, suggesting that our experiments are below the optimum pH for Zn sorption.
BIOS and 2LFh sorption data were modeled with a Freundlich isotherm (solid, black line in Figure 5). The Freundlich sorption constant (Kf), exponential constant (n), and model efficiency (E) for all data sets are shown in Table 2. Variation in sorption extent between BIOS and 2LFh are indicated by differences in Kf and n parameters; in all cases, BIOS Kf values are substantially higher than that of 2LFh (Table 2). These results are consistent with Sowers et al. [34] and Whitaker et al. [47] who showed As(III) and As(V), and Cr(VI) Kf values for BIOS exceed those for 2LFh. Interestingly, n values for Zn sorption are higher than ones obtained for Cu and Pb, suggesting Zn sorption is more linear (n = 1) with the slope of the line approaching Kf [92]. These deviations in L-type isotherm behavior have previously been noted for Zn sorption onto synthetic ferrihydrite [62,100] and have been attributed to the onset of Zn precipitate formation, despite bulk solution being undersaturated with respect to Zn(OH)2.
3.3. Partitioning to Mineral Surfaces and Biomass
To estimate the fraction bound to organic matter and iron (oxyhydr)oxide surfaces, we performed a two component LCF analysis of the Cu, Pb, and Zn BIOS EXAFS spectra at low and high surface loadings (Supplementary Materials Table S1) using mineral sorbed and biomass standards (Cu/Pb/Zn-2LFh and Cu/Pb/Zn-biomass; Supplementary Materials Figure S4 and Table S5). In all cases, the LCFs contain a predominant faction of Cu/Pb/Zn bound to 2LFh, implying that most of the sorption occurs on the mineral surface. For Cu, a slight increase in the percentage sorbed to 2LFh is seen (74 to 87%) as sorbed concentration increases. However, for Pb and Zn, the low and high surface loadings are within error of each other, with approximately 80% of Pb and Zn being sorbed to the mineral surface. These results are in agreement with Moon and Peacock [11], who showed that at pH = 6.4 and similar Cu surface loadings, 80% of Cu(II) was bound to ferrihydrite and 20% was bound to bacteria in a ferrihydrite-bacteria composite, and with Templeton et al. [101], who determined Pb(II) sorption to goethite was favored over sorption to bacteria in a goethite-bacteria composite at pH = 6 and similar Pb surface loadings.
3.4. Surface Complexes of Cu, Pb, and Zn on 2LFh and BIOS
Figure 6A,B shows the Cu K-edge EXAFS spectra and Fourier transform (FT) plots, respectively, for 2LFh and BIOS samples at low and high Cu surface loadings (Supplementary MaterialsTable S1). Little to no change in the EXAFS spectra and FT magnitude plots suggests that the Cu binding mechanism for 2LFh and BIOS is similar and invariant of surface loading concentrations. The FTs for all samples show two main peaks at ~1.5 and ~2.5 Å R + ΔR, which correspond to the first Cu-O and Cu-Cu/Fe shell, respectively [11]. Shell-by-shell structural models (overlain black dotted lines in Figure 6) reveals a Cu first shell coordination environment consisting of 4.1–4.2 O atoms at interatomic distances of 1.93 ± 0.01 Å for all samples (Table 3). These values are within error of reported coordination numbers and interatomic distances seen for the equatorial oxygen atoms of the Jahn–Teller distorted Cu(OH)6 octahedron [7,13]. The addition of axial oxygen atoms did not improve the fit statistically [63,64], consistent with shell-by-shell fits of Cu(II) sorbed to ferrihydrite [13] and P. putida biomass [55]. For all samples, the small second shell located at ~2.5 Å R + ΔR (Figure 6B) was fit with 0.4–0.7 Cu/Fe atoms at ~2.99 Å (Table 3). These results agree well with Moon and Peacock [11] and Scheinost et al. [13] for Cu(II) adsorbed onto ferrihydrite via a bidentate edge-sharing complex at pH = 5–6.25 under similar Cu surface loadings. Fits were improved via the addition of a Cu–O–O multiple scattering path at R ~3.86 Å, consistent with a three atom multiple scattering path at ~3.9 Å obtained for Cu(II) adsorbed to lepidocrocite, hematite, and goethite at pH = 6.5 and similar Cu surface loadings [94]. Our results thus suggest that inner-sphere Cu(II) sorption onto both 2LFh and BIOS occurs via a bidentate edge-sharing complex (Figure 7A) that is invariant to Cu surface loadings (Supplementary Materials Table S1).
Pb LIII-edge EXAFS spectra and FT plots for 2LFh and BIOS are shown in Figure 8A,B, respectively, for the low and high Pb surface values listed in Supplementary Materials Table S1. All FT plots show two large peaks at ~1.8 and ~2.9 Å R + ΔR, which are attributed to the first Pb-O and Pb-Fe shell, respectively [3,15,102]. Shell-by-shell analysis shows Pb first shell coordination environments consist of 2.5–2.7 O atoms at distances of 2.35 ± 0.02 Å (Table 3). These values are consistent with a distorted trigonal pyramidal coordination of Pb(II) surrounded by hydroxyl/oxygen ligands [3,15] and are within the error of values obtained for Pb(II) sorbed to ferrihydrite, hydrous ferric oxide, goethite, and hematite at similar Pb surface loadings between pH = 4.5–8.0 [3,13,15,102]. For all spectra, the second shell was fit with 0.9–1.2 Fe atoms at an approximate distance of 3.4 Å (Table 3). These values are in good agreement with Pb(II) sorbed to ferrihydrite, hydrous ferric oxide, goethite, and hematite as a bidentate edge-sharing complex at pH = 4.5–8.0 under similar concentrations [3,13,15,102]. The addition of a second Pb–Fe path at R ~4.03 ± 0.07 Å was found to statistically improve the fit (p < 0.05) [63,64]. In previous EXAFS studies, Bargar et al. [4] and Trivedi et al. [15] determined that Pb-Fe distances ≥3.9 Å indicate monodentate or bridging bidentate complexes with the corners of FeO6 octahedra. Our results thus indicate that at pH = 6, Pb(II) sorption to both 2LFh and BIOS occurs via an inner-sphere complexes (Figure 7B,C) that are invariant of surface Pb loadings over the measured range.
Zn K-edge EXAFS spectra and FT plots for 2LFh and BIOS at low and high Zn surface loadings (Supplementary Materials Table S1) are shown in Figure 9A,B, respectively. When compared to the 2LFh Zn Low sample, a dampening of the EXAFS beat patterns at k = 4 and 6 Å−1 is observed for the BIOS Zn Low and High sample as well as the 2LFh Zn High sample, which suggests there is a difference in the Zn coordination geometries or sorption mechanisms. The FT plots are dominated by a large peak at ~1.5 Å R + ΔR, which corresponds to the first shell Zn–O path, whereas the peaks at ~2.8 and ~3.2 Å R + ΔR arise due to Zn–Fe/Zn contributions [62].
Results from shell-by-shell fitting (Table 3) show Zn first shell coordination environments consist of 3.7–4.3 O atoms at an average distance of 1.97 ± 0.01 Å, comparable to results obtained by Cismasu et al. [62] and Trivedi et al. [42] for Zn(II) sorption to ferrihydrite at pH = 4.5–7.5 at similar Zn surface loadings. After initial first shell fits, it was determined that the addition of an octahedral Zn–O path at distances of 2.12–2.18 Å improved the fits for all samples with Zn surface loadings ≥188 µmol g−1 (Supplementary Materials Table S1). Octahedral Zn has been identified by Waychunas et al. [16] at high Zn surface coverages after adsorption and precipitation with ferrihydrite, as well as by Toner et al. [60] and Manceau et al. [103] when studying Zn(II) sorption to a biogenic Mn oxide and birnessite, respectively. It is noteworthy to mention that as an outer-sphere octahedrally coordinated complex Zn (R ~2.18 Å) has been identified on hydrous ferric oxide at circumneutral pH [43]. However, this coordination environment manifests itself as in second-shell coordination numbers (e.g., Zn–surface binding) [104], which is not supported by our EXAFS fits (Table 3).
Second shell coordination environments consisted of 0.8–1.3 Fe or Zn atoms at distances of 3.21–3.27 Å. These values are comparable to results obtained by Cismasu et al. [62], who suggested there are two plausible explanations for a Zn–Fe path at this distance. The first being a bidentate binuclear complex with Zn bound to the FeO6 octahedra, while the second explanation is a complex formed between tetrahedral Zn and tetrahedral iron, which has been found in two-line ferrihydrite [73,105]. In order to improve the quality of the second shell fit (significant improvement at a 95% confidence level [63,64]), an additional Zn–Fe/Zn path was added at distances of 3.42–3.48 Å with coordination numbers between 1.3–2.1 Zn or Fe atoms. Values obtained for the second path are in good agreement with Trivedi et al. [42], Cismasu et al. [62], and Lee and Anderson [9] and can be attributed to binuclear bidentate complexes. Consistent with other studies [9,16,42,62] of Zn sorption, as well as our results with Cu and Pb, XAS results indicate that Zn(II) is chemisorbed to the surfaces of 2LFh and BIOS at pH = 6 (Figure 7D,E).
Under the experimental conditions tested, all metal sorbate binding mechanisms to BIOS were determined to be inner-sphere processes, like that of 2LFh (Figure 7). Both Cu and Pb sorption occurred via bidentate edge-sharing complexes, with Pb having an additional monodentate or bridging bidentate complex with the corners of FeO6 octahedra; binuclear bidentate complexes formed for Zn. It should be noted that Cu, Pb, and Zn XAS structural models were not significantly improved by the addition of a C shell, implying the majority of sorption occurs at the mineral surface, which is in agreement with our EXAFS LCFs and other observations of Cu, Pb, and Zn sorption to mineral-bacteria composites at pH = 6.0–6.4 and similar surface excess values [11,101,106].
4. Conclusions
Our results suggest that BIOS has an enhanced sorption reactivity when compared to 2LFh, consistent with previous work [34,38,47,107] that reported maximum sorbed concentrations on BIOS that varied from similar to three-fold higher than 2LFh. At pH = 6 and similar aqueous metal concentrations, Cu, Pb, and Zn sorption onto BIOS was approximately 8, 4, and 2 times more (per mass basis) than 2LFh, respectively. These large differences between BIOS and 2LFh sorption were attributed to the reduced ordering (Supplementary Materials Figure S2, Figure 2 and Table 1), small CSDs (Figure 3), and presence of organic C (Supplementary Materials Table S3) within the BIOS, resulting in a larger sorption capacity [38,83,84]; however, the 2LFh point of zero charge and sorbent preparation contributed to the large sorption differences as well. When compared to Cu and Pb, substantially lower quantities of Zn were sorbed for 2LFh and BIOS due to the higher Zn adsorption edge pH [5]. XAS shell-by-shell fit analyses showed inner-sphere sorption mechanisms for Cu, Pb, and Zn bound to BIOS and 2LFh, which was invariant of surface loading concentrations, with no significant differences between the two minerals. This observation is in good agreement with EXAFS LCFs that show nearly ~80% of all sorption occurs at the mineral surface.
Although our results showed that most metal sorption occurs at the mineral surface, this situation may not be the case at lower pH values [11] and/or shorter reaction times [106]. Due to the variety of organic moieties within CDOM [8,32] it is imperative for future studies to investigate the role BIOS plays in metal sequestration at varying pH values (e.g., pH = 4–8) and reaction times. Furthermore, recent research [108] shows that amorphous iron nanoparticles are responsible for the transportation of ~66% and ~38% of Fe and P, respectively, in urban and rural streams under baseflow conditions in the Southern Piedmont. Thus, methods of BIOS transportation and its effects on contaminant dynamics, in analogy to P, must be thoroughly examined. Nevertheless, under the experimental conditions tested, our results show that BIOS are more effective at adsorbing Cu, Pb, and Zn from solution than 2LFh, requiring a revision of metal fate and contaminant transport models employed to describe and predict behaviors in redox environments.
Supplementary Materials
The following are available online at https://www.mdpi.com/2571-8789/2/2/18/s1, Methods for BIOS Composites, 2LFh Synthesis and Processing, and Characterization of BIOS and 2LFh, Figure S1: Images of BIOS collected for use in this study, Figure S2: X-ray diffractograms of 2LFh, Feb BIOS, and April BIOS, Figure S3: Brunauer, Emmett and Teller specific surface area (BET SSA) normalized sorption of Cu(II), Pb(II), and Zn(II) onto 2LFh and April BIOS as a function of dissolved metal concentrations, Figure S4: EXAFS LCFs of Cu(II), Pb(II), and Zn(II) sorption to April BIOS, Table S1: Cu(II), Pb(II), and Zn(II) adsorption conditions utilized for 2LFh and Feb BIOS XAS studies, Table S2: Fe standards used for Feb and April BIOS K-edge XANES and EXAFS LCFs, Table S3: Elemental composition of the Feb and April BIOS, Table S4: Cu(II), Pb(II), and Zn(II) Freundlich sorption parameters for 2LFh and April BIOS normalized to BET SSA, Table S5: EXAFS LCF parameters for Cu(II), Pb(II), and Zn(II) sorption to April BIOS.
Acknowledgments
This material is based upon work supported by the National Science Foundation under Grant We are grateful for support received from the National Science Foundation Geobiology and Low-Temperature Geochemistry Program (award EAR-125515). We thank Jacob Jones, Robert Borden, Jongho Won, Changhao Zhao, Kevin A. Beyer, F. Marc Michel, Megan Andrews, Tyler Sowers, Benjamin Uster, Kim Hutchison, Lisa Lentz, Guillermo Ramirez, Ching-Chang Chung, Ryan Davis, Erik Nelson, and Matthew Lattimer for assistance on this project. We thank Dean Hesterberg, Jasquelin Peña, Brandy Toner, and Nelson Rivera for reference XAS spectra. This work was supported by the USDA National Institute of Food and Agriculture, Hatch project NC02440. This work was performed in part at the Environmental and Agricultural Testing Service laboratory (EATS), Department of Crop and Soil Sciences, at North Carolina State University. This work was performed in part at the Analytical Instrumentation Facility (AIF) at North Carolina State University, which is supported by the State of North Carolina and the National Science Foundation (award number ECCS-1542015). The AIF is a member of the North Carolina Research Triangle Nanotechnology Network (RTNN), a site in the National Nanotechnology Coordinated Infrastructure (NNCI). Use of the Stanford Synchrotron Radiation Lightsource, SLAC National Accelerator Laboratory, is supported by the U.S. Department of Energy, Office of Science, and Office of Basic Energy Sciences under Contract No. DE-AC02-76SF00515. High-energy X-ray scattering measurements were performed at beamline 11-ID-B at the Advanced Photon Source, Argonne National Laboratory. Use of the APS is supported by the U.S. Department of Energy (DOE), Office of Science, Office of Basic Energy Sciences, under Contract DE-AC02-06CH11357.
Author Contributions
Andrew H. Whitaker conceived and designed the experiments with help from Owen W. Duckworth; Andrew H. Whitaker performed the experiments; Andrew H. Whitaker analyzed the data with guidance from Owen W. Duckworth; and Andrew H. Whitaker wrote the paper with input from Owen W. Duckworth.
Conflicts of Interest
The authors declare no conflict of interest.
References
- Cornell, R.; Schwertmann, U. Structure, properties, reactions, occurrence and uses. In The Iron Oxides; VCH: Weinheim, Germany, 1996; pp. 375–395. [Google Scholar]
- Jambor, J.L.; Dutrizac, J.E. Occurrence and constitution of natural and synthetic ferrihydrite, a widespread iron oxyhydroxide. Chem. Rev. 1998, 98, 2549–2586. [Google Scholar] [CrossRef] [PubMed]
- Bargar, J.; Brown, G.; Parks, G. Surface complexation of Pb(II) at oxide-water interfaces: II. XAFS and bond-valence determination of mononuclear Pb(II) sorption products and surface functional groups on iron oxides. Geochim. Cosmochim. Acta 1997, 61, 2639–2652. [Google Scholar] [CrossRef]
- Bargar, J.; Brown, G.; Parks, G. Surface complexation of Pb(II) at oxide-water interfaces: III. XAFS determination of Pb(II) and Pb(II)-chloro adsorption complexes on goethite and alumina. Geochim. Cosmochim. Acta 1998, 62, 193–207. [Google Scholar] [CrossRef]
- Benjamin, M.M.; Leckie, J.O. Multiple-site adsorption of Cd, Cu, Zn, and Pb on amorphous iron oxyhydroxide. J. Colloid Interface Sci. 1981, 79, 209–221. [Google Scholar] [CrossRef]
- Hua, M.; Zhang, S.; Pan, B.; Zhang, W.; Lv, L.; Zhang, Q. Heavy metal removal from water/wastewater by nanosized metal oxides: A review. J. Hazard. Mater. 2012, 211, 317–331. [Google Scholar] [CrossRef] [PubMed]
- Karlsson, T.; Persson, P.; Skyllberg, U. Complexation of copper (II) in organic soils and in dissolved organic matter—EXAFS evidence for chelate ring structures. Environ. Sci. Technol. 2006, 40, 2623–2628. [Google Scholar] [CrossRef] [PubMed]
- Kennedy, C.; Martinez, R.; Scott, S.D.; Ferris, F. Surface chemistry and reactivity of bacteriogenic iron oxides from Axial Volcano, Juan de Fuca Ridge, north-east Pacific Ocean. Geobiology 2003, 1, 59–69. [Google Scholar] [CrossRef]
- Lee, S.; Anderson, P.R. EXAFS study of Zn sorption mechanisms on hydrous ferric oxide over extended reaction time. J. Colloid Interface Sci. 2005, 286, 82–89. [Google Scholar] [CrossRef] [PubMed]
- Martínez, C.E.; McBride, M.B. Dissolved and Labile Concentrations of Cd, Cu, Pb, and Zn in Aged Ferrihydrite-Organic Matter Systems. Environ. Sci. Technol. 1999, 33, 745–750. [Google Scholar] [CrossRef]
- Moon, E.M.; Peacock, C.L. Adsorption of Cu(II) to ferrihydrite and ferrihydrite-bacteria composites: Importance of the carboxyl group for Cu mobility in natural environments. Geochim. Cosmochim. Acta 2012, 92, 203–219. [Google Scholar] [CrossRef]
- Sauvé, S.; Martínez, C.E.; McBride, M.; Hendershot, W. Adsorption of Free Lead (Pb2+) by Pedogenic Oxides, Ferrihydrite, and Leaf Compost. Soil Sci. Soc. Am. J. 2000, 64, 595–599. [Google Scholar] [CrossRef]
- Scheinost, A.C.; Abend, S.; Pandya, K.I.; Sparks, D.L. Kinetic Controls on Cu and Pb Sorption by Ferrihydrite. Environ. Sci. Technol. 2001, 35, 1090–1096. [Google Scholar] [CrossRef] [PubMed]
- Trivedi, P.; Axe, L. Modeling Cd and Zn sorption to hydrous metal oxides. Environ. Sci. Technol. 2000, 34, 2215–2223. [Google Scholar] [CrossRef]
- Trivedi, P.; Dyer, J.A.; Sparks, D.L. Lead sorption onto ferrihydrite. 1. A macroscopic and spectroscopic assessment. Environ. Sci. Technol. 2003, 37, 908–914. [Google Scholar] [CrossRef] [PubMed]
- Waychunas, G.; Fuller, C.; Davis, J. Surface complexation and precipitate geometry for aqueous Zn(II) sorption on ferrihydrite I: X-ray absorption extended fine structure spectroscopy analysis. Geochim. Cosmochim. Acta 2002, 66, 1119–1137. [Google Scholar] [CrossRef]
- Stumm, W.; Morgan, J.J. Aquatic Chemistry: Chemical Equilibria and Rates in Natural Waters; John Wiley & Sons: Hoboken, NJ, USA, 2012; Volume 126. [Google Scholar]
- Davison, W.; Seed, G. The kinetics of the oxidation of ferrous iron in synthetic and natural waters. Geochim. Cosmochim. Acta 1983, 47, 67–79. [Google Scholar] [CrossRef]
- Martin, S.T. Precipitation and Dissolution of Iron and Manganese Oxides. Available online: https://www.researchgate.net/file.PostFileLoader.html?id=5774bc85615e27a79348dd21&assetKey=AS%3A378564546449408%401467268229098 (accessed on 28 January 2018).
- Druschel, G.K.; Emerson, D.; Sutka, R.; Suchecki, P.; Luther, G.W. Low-oxygen and chemical kinetic constraints on the geochemical niche of neutrophilic iron (II) oxidizing microorganisms. Geochim. Cosmochim. Acta 2008, 72, 3358–3370. [Google Scholar] [CrossRef]
- James, R.; Ferris, F. Evidence for microbial-mediated iron oxidation at a neutrophilic groundwater spring. Chem. Geol. 2004, 212, 301–311. [Google Scholar] [CrossRef]
- Fleming, E.J.; Cetinić, I.; Chan, C.S.; King, D.W.; Emerson, D. Ecological succession among iron-oxidizing bacteria. ISME J. 2014, 8, 804–815. [Google Scholar] [CrossRef] [PubMed]
- Bruun, A.-M.; Finster, K.; Gunnlaugsson, H.P.; Nornberg, P.; Friedrich, M.W. A comprehensive investigation on iron cycling in a freshwater seep including microscopy, cultivation and molecular community analysis. Geomicrobiol. J. 2010, 27, 15–34. [Google Scholar] [CrossRef]
- Duckworth, O.W.; Holmström, S.J.; Peña, J.; Sposito, G. Biogeochemistry of iron oxidation in a circumneutral freshwater habitat. Chem. Geol. 2009, 260, 149–158. [Google Scholar] [CrossRef]
- Haaijer, S.C.; Harhangi, H.R.; Meijerink, B.B.; Strous, M.; Pol, A.; Smolders, A.J.; Verwegen, K.; Jetten, M.S.; Den Camp, H.J.O. Bacteria associated with iron seeps in a sulfur-rich, neutral pH, freshwater ecosystem. ISME J. 2008, 2, 1231–1242. [Google Scholar] [CrossRef] [PubMed]
- Emerson, D.; Weiss, J.V. Bacterial iron oxidation in circumneutral freshwater habitats: Findings from the field and the laboratory. Geomicrobiol. J. 2004, 21, 405–414. [Google Scholar] [CrossRef]
- Weiss, J.V.; Emerson, D.; Megonigal, J.P. Geochemical control of microbial Fe(III) reduction potential in wetlands: Comparison of the rhizosphere to non-rhizosphere soil. FEMS Microbiol. Ecol. 2004, 48, 89–100. [Google Scholar] [CrossRef] [PubMed]
- Weiss, J.V.; Emerson, D.; Megonigal, J.P. Rhizosphere Iron (III) Deposition and Reduction in a L.-Dominated Wetland. Soil Sci. Soc. Am. J. 2005, 69, 1861–1870. [Google Scholar] [CrossRef]
- Neubauer, S.C.; Toledo-Durán, G.E.; Emerson, D.; Megonigal, J.P. Returning to their roots: Iron-oxidizing bacteria enhance short-term plaque formation in the wetland-plant rhizosphere. Geomicrobiol. J. 2007, 24, 65–73. [Google Scholar] [CrossRef]
- Weiss, J.V.; Emerson, D.; Backer, S.M.; Megonigal, J.P. Enumeration of Fe(II)-oxidizing and Fe(III)-reducing bacteria in the root zone of wetland plants: Implications for a rhizosphere iron cycle. Biogeochemistry 2003, 64, 77–96. [Google Scholar] [CrossRef]
- Weiss, J.V.; Rentz, J.A.; Plaia, T.; Neubauer, S.C.; Merrill-Floyd, M.; Lilburn, T.; Bradburne, C.; Megonigal, J.P.; Emerson, D. Characterization of neutrophilic Fe(II)-oxidizing bacteria isolated from the rhizosphere of wetland plants and description of Ferritrophicum radicicola gen. nov. sp. nov., and Sideroxydans paludicola sp. nov. Geomicrobiol. J. 2007, 24, 559–570. [Google Scholar] [CrossRef]
- Ferris, F. Biogeochemical properties of bacteriogenic iron oxides. Geomicrobiol. J. 2005, 22, 79–85. [Google Scholar] [CrossRef]
- Ferris, F.; Hallberg, R.; Lyven, B.; Pedersen, K. Retention of strontium, cesium, lead and uranium by bacterial iron oxides from a subterranean environment. Appl. Geochem. 2000, 15, 1035–1042. [Google Scholar] [CrossRef]
- Sowers, T.D.; Harrington, J.M.; Polizzotto, M.L.; Duckworth, O.W. Sorption of arsenic to biogenic iron (oxyhydr) oxides produced in circumneutral environments. Geochim. Cosmochim. Acta 2017, 198, 194–207. [Google Scholar] [CrossRef]
- Cismasu, A.C.; Michel, F.M.; Tcaciuc, A.P.; Tyliszczak, T.; Brown, G.E., Jr. Composition and structural aspects of naturally occurring ferrihydrite. Comptes Rendus Geosci. 2011, 343, 210–218. [Google Scholar] [CrossRef]
- Ferris, F.; Konhauser, K.; Lyven, B.; Pedersen, K. Accumulation of metals by bacteriogenic iron oxides in a subterranean environment. Geomicrobiol. J. 1999, 16, 181–192. [Google Scholar]
- Martinez, R.E.; Pedersen, K.; Ferris, F.G. Cadmium complexation by bacteriogenic iron oxides from a subterranean environment. J. Colloid Interface Sci. 2004, 275, 82–89. [Google Scholar] [CrossRef] [PubMed]
- Langley, S.; Gault, A.G.; Ibrahim, A.; Takahashi, Y.; Renaud, R.; Fortin, D.; Clark, I.D.; Ferris, F.G. Sorption of strontium onto bacteriogenic iron oxides. Environ. Sci. Technol. 2009, 43, 1008–1014. [Google Scholar] [CrossRef] [PubMed]
- Rentz, J.A.; Ullman, J.L. Copper and Zinc Removal Using Biogenic Iron Oxides. In Proceedings of the World Environmental and Water Resources Congress 2012: Crossing Boundaries, Albuquerque, NM, USA, 20–24 May 2012; pp. 687–698. [Google Scholar]
- Manceau, A.; Charlet, L.; Boisset, M.; Didier, B.; Spadini, L. Sorption and speciation of heavy metals on hydrous Fe and Mn oxides. From microscopic to macroscopic. Appl. Clay Sci. 1992, 7, 201–223. [Google Scholar] [CrossRef]
- Rout, K.; Mohapatra, M.; Anand, S. 2-Line ferrihydrite: Synthesis, characterization and its adsorption behaviour for removal of Pb(II), Cd(II), Cu(II) and Zn(II) from aqueous solutions. Dalton Trans. 2012, 41, 3302–3312. [Google Scholar] [CrossRef] [PubMed]
- Trivedi, P.; Dyer, J.A.; Sparks, D.L.; Pandya, K. Mechanistic and thermodynamic interpretations of zinc sorption onto ferrihydrite. J. Colloid Interface Sci. 2004, 270, 77–85. [Google Scholar] [CrossRef]
- Trivedi, P.; Axe, L.; Tyson, T.A. An analysis of zinc sorption to amorphous versus crystalline iron oxides using XAS. J. Colloid Interface Sci. 2001, 244, 230–238. [Google Scholar] [CrossRef]
- Almaraz, N.; Whitaker, A.H.; Andrews, M.Y.; Duckworth, O.W. Assessing Biomineral Formation by Iron-oxidizing Bacteria in a Circumneutral Creek. J. Contemp. Water Res. Educ. 2017, 160, 60–71. [Google Scholar] [CrossRef]
- Andrews, M.Y.; Duckworth, O. A universal assay for the detection of siderophore activity in natural waters. BioMetals 2016, 29, 1085–1095. [Google Scholar] [CrossRef] [PubMed]
- Schwertmann, U.; Cornell, R.M. Iron Oxides in the Laboratory: Preparation and Characterization; John Wiley & Sons: Hoboken, NJ, USA, 2008. [Google Scholar]
- Whitaker, A.H.; Peña, J.; Amor, M.; Duckworth, O.W. Cr(VI) Uptake and Reduction in Biogenic Iron Oxides Assemblages. 2017. Submitted. [Google Scholar]
- Gustafsson, J. Visual MINTEQ ver. 3.0; Department of Land and Water Resources Engineering, Royal Institute of Technology: Stokholm, Sweden, 2011. [Google Scholar]
- Bolster, C.H.; Hornberger, G.M. On the use of linearized Langmuir equations. Soil Sci. Soc. Am. J. 2007, 71, 1796–1806. [Google Scholar] [CrossRef]
- Kelly, S.; Hesterberg, D.; Ravel, B. Analysis of soils and minerals using X-ray absorption spectroscopy. Methods Soil Anal. 2008, 5, 387–463. [Google Scholar]
- Webb, S. SIXpack: A graphical user interface for XAS analysis using IFEFFIT. Phys. Scr. 2005, 2005, 1011. [Google Scholar] [CrossRef]
- Newville, M. IFEFFIT: Interactive XAFS analysis and FEFF fitting. J. Synchrotron Radiat. 2001, 8, 322–324. [Google Scholar] [CrossRef] [PubMed]
- Harrington, J.M.; Parker, D.L.; Bargar, J.R.; Jarzecki, A.A.; Tebo, B.M.; Sposito, G.; Duckworth, O.W. Structural dependence of Mn complexation by siderophores: Donor group dependence on complex stability and reactivity. Geochim. Cosmochim. Acta 2012, 88, 106–119. [Google Scholar] [CrossRef]
- O’day, P.A.; Rivera, N.; Root, R.; Carroll, S.A. X-ray absorption spectroscopic study of Fe reference compounds for the analysis of natural sediments. Am. Mineral. 2004, 89, 572–585. [Google Scholar] [CrossRef]
- Pena, J. Contaminant Metal Immobilization by Biogenic Manganese Oxide Nanoparticles: Implications for Natural Attenuation and Bioremediation; University of California: Berkeley, CA, USA, 2009. [Google Scholar]
- Toner, B.; Manceau, A.; Marcus, M.A.; Millet, D.B.; Sposito, G. Zinc sorption by a bacterial biofilm. Environ. Sci. Technol. 2005, 39, 8288–8294. [Google Scholar] [CrossRef] [PubMed]
- Rehr, J.J.; Kas, J.J.; Vila, F.D.; Prange, M.P.; Jorissen, K. Parameter-free calculations of X-ray spectra with FEFF9. Phys. Chem. Chem. Phys. 2010, 12, 5503–5513. [Google Scholar] [CrossRef] [PubMed]
- Duckworth, O.W.; Bargar, J.R.; Sposito, G. Quantitative structure-activity relationships for aqueous metal-siderophore complexes. Environ. Sci. Technol. 2008, 43, 343–349. [Google Scholar] [CrossRef]
- Villalobos, M.; Bargar, J.; Sposito, G. Mechanisms of Pb(II) sorption on a biogenic manganese oxide. Environ. Sci. Technol. 2005, 39, 569–576. [Google Scholar] [CrossRef] [PubMed]
- Toner, B.; Manceau, A.; Webb, S.M.; Sposito, G. Zinc sorption to biogenic hexagonal-birnessite particles within a hydrated bacterial biofilm. Geochim. Cosmochim. Acta 2006, 70, 27–43. [Google Scholar] [CrossRef]
- Alcacio, T.E.; Hesterberg, D.; Chou, J.W.; Martin, J.D.; Beauchemin, S.; Sayers, D.E. Molecular scale characteristics of Cu(II) bonding in goethite-humate complexes. Geochim. Cosmochim. Acta 2001, 65, 1355–1366. [Google Scholar] [CrossRef]
- Cismasu, A.C.; Levard, C.; Michel, F.M.; Brown, G.E. Properties of impurity-bearing ferrihydrite II: Insights into the surface structure and composition of pure, Al-and Si-bearing ferrihydrite from Zn(II) sorption experiments and Zn K-edge X-ray absorption spectroscopy. Geochim. Cosmochim. Acta 2013, 119, 46–60. [Google Scholar] [CrossRef]
- Downward, L.; Booth, C.; Lukens, W.; Bridges, F. A Variation of the F-Test for Determining Statistical Relevance of Particular Parameters in EXAFS Fits. AIP Conf. Proc. 2007, 882, 129–131. [Google Scholar]
- Hamilton, W.C. Significance tests on the crystallographic R factor. Acta Crystallogr. 1965, 18, 502–510. [Google Scholar] [CrossRef]
- Webb, S.M.; Tebo, B.; Bargar, J. Structural characterization of biogenic Mn oxides produced in seawater by the marine Bacillus sp. strain SG-1. Am. Mineral. 2005, 90, 1342–1357. [Google Scholar] [CrossRef]
- Hammersley, A. FIT2D: An introduction and overview. Eur. Synchrotron Radiat. Facil. Intern. Rep. 1997, 68, 58. [Google Scholar]
- Juhás, P.; Davis, T.; Farrow, C.L.; Billinge, S.J. PDFgetX3: A rapid and highly automatable program for processing powder diffraction data into total scattering pair distribution functions. J. Appl. Crystallogr. 2013, 46, 560–566. [Google Scholar] [CrossRef]
- Chupas, P.J.; Qiu, X.; Hanson, J.C.; Lee, P.L.; Grey, C.P.; Billinge, S.J. Rapid-acquisition pair distribution function (RA-PDF) analysis. J. Appl. Crystallogr. 2003, 36, 1342–1347. [Google Scholar] [CrossRef]
- Michel, F.; Ehm, L.; Liu, G.; Han, W.; Antao, S.; Chupas, P.; Lee, P.; Knorr, K.; Eulert, H.; Kim, J.; et al. Similarities in 2-and 6-line ferrihydrite based on pair distribution function analysis of X-ray total scattering. Chem. Mater. 2007, 19, 1489–1496. [Google Scholar] [CrossRef]
- Toner, B.M.; Berquó, T.S.; Michel, F.M.; Sorensen, J.V.; Templeton, A.S.; Edwards, K.J. Mineralogy of iron microbial mats from Loihi Seamount. Front. Microbiol. 2012, 3, 118. [Google Scholar] [CrossRef] [PubMed]
- Hall, B.; Zanchet, D.; Ugarte, D. Estimating nanoparticle size from diffraction measurements. J. Appl. Crystallogr. 2000, 33, 1335–1341. [Google Scholar] [CrossRef]
- Kennedy, C.B.; Scott, S.D.; Ferris, F.G. Characterization of Bacteriogenic Iron Oxide Deposits from Axial Volcano, Juan de Fuca Ridge, Northeast Pacific Ocean. Geomicrobiol. J. 2003, 20, 199–214. [Google Scholar] [CrossRef]
- Michel, F.M.; Barrón, V.; Torrent, J.; Morales, M.P.; Serna, C.J.; Boily, J.-F.; Liu, Q.; Ambrosini, A.; Cismasu, A.C.; Brown, G.E. Ordered ferrimagnetic form of ferrihydrite reveals links among structure, composition, and magnetism. Proc. Natl. Acad. Sci. USA 2010, 107, 2787–2792. [Google Scholar] [CrossRef] [PubMed]
- Stanjek, H.; Weidler, P. The effect of dry heating on the chemistry, surface area, and oxalate solubility of synthetic 2-line and 6-line ferrihydrites. Clay Miner. 1992, 27, 397. [Google Scholar] [CrossRef]
- Toner, B.M.; Santelli, C.M.; Marcus, M.A.; Wirth, R.; Chan, C.S.; McCollom, T.; Bach, W.; Edwards, K.J. Biogenic iron oxyhydroxide formation at mid-ocean ridge hydrothermal vents: Juan de Fuca Ridge. Geochim. Cosmochim. Acta 2009, 73, 388–403. [Google Scholar] [CrossRef]
- Van Genuchten, C.M.; Gadgil, A.J.; Peña, J. Fe(III) nucleation in the presence of bivalent cations and oxyanions leads to subnanoscale 7 Å polymers. Environ. Sci. Technol. 2014, 48, 11828–11836. [Google Scholar] [CrossRef] [PubMed]
- Michel, F.M.; Ehm, L.; Antao, S.M.; Lee, P.L.; Chupas, P.J.; Liu, G.; Strongin, D.R.; Schoonen, M.A.; Phillips, B.L.; Parise, J.B. The structure of ferrihydrite, a nanocrystalline material. Science 2007, 316, 1726–1729. [Google Scholar] [CrossRef] [PubMed]
- Wang, X.; Zhu, M.; Koopal, L.K.; Li, W.; Xu, W.; Liu, F.; Zhang, J.; Liu, Q.; Feng, X.; Sparks, D.L. Effects of crystallite size on the structure and magnetism of ferrihydrite. Environ. Sci. Nano 2016, 3, 190–202. [Google Scholar] [CrossRef]
- Cismasu, A.C.; Michel, F.M.; Tcaciuc, A.P.; Brown, G.E. Properties of impurity-bearing ferrihydrite III. Effects of Si on the structure of 2-line ferrihydrite. Geochim. Cosmochim. Acta 2014, 133 (Suppl. C), 168–185. [Google Scholar] [CrossRef]
- Waychunas, G.; Rea, B.; Fuller, C.; Davis, J. Surface chemistry of ferrihydrite: Part 1. EXAFS studies of the geometry of coprecipitated and adsorbed arsenate. Geochim. Cosmochim. Acta 1993, 57, 2251–2269. [Google Scholar] [CrossRef]
- Mikutta, C. X-ray absorption spectroscopy study on the effect of hydroxybenzoic acids on the formation and structure of ferrihydrite. Geochim. Cosmochim. Acta 2011, 75, 5122–5139. [Google Scholar] [CrossRef]
- Charlet, L.; Manceau, A.A. X-ray absorption spectroscopic study of the sorption of Cr(III) at the oxide-water interface: II. Adsorption, coprecipitation, and surface precipitation on hydrous ferric oxide. J. Colloid Interface Sci. 1992, 148, 443–458. [Google Scholar] [CrossRef]
- Zhu, J.; Pigna, M.; Cozzolino, V.; Caporale, A.G.; Violante, A. Competitive sorption of copper (II), chromium (III) and lead (II) on ferrihydrite and two organomineral complexes. Geoderma 2010, 159, 409–416. [Google Scholar] [CrossRef]
- Kennedy, C.; Gault, A.; Fortin, D.; Clark, I.; Ferris, F. Retention of iodide by bacteriogenic iron oxides. Geomicrobiol. J. 2011, 28, 387–395. [Google Scholar] [CrossRef]
- Martinez, R.E.; Smith, D.S.; Kulczycki, E.; Ferris, F.G. Determination of Intrinsic Bacterial Surface Acidity Constants using a Donnan Shell Model and a Continuous pKa Distribution Method. J. Colloid Interface Sci. 2002, 253, 130–139. [Google Scholar] [CrossRef] [PubMed]
- Childs, C.; Downes, C.; Wells, N. Hydrous iron oxide minerals with short range order deposited in a spring/stream system, Tongariro National Park, New Zealand. Soil Res. 1982, 20, 119–129. [Google Scholar] [CrossRef]
- Langley, S.; Igric, P.; Takahashi, Y.; Sakai, Y.; Fortin, D.; Hannington, M.; Schwarz-Schampera, U. Preliminary characterization and biological reduction of putative biogenic iron oxides (BIOS) from the Tonga-Kermadec Arc, southwest Pacific Ocean. Geobiology 2009, 7, 35–49. [Google Scholar] [CrossRef] [PubMed]
- Eusterhues, K.; Wagner, F.E.; Häusler, W.; Hanzlik, M.; Knicker, H.; Totsche, K.U.; Kögel-Knabner, I.; Schwertmann, U. Characterization of ferrihydrite-soil organic matter coprecipitates by X-ray diffraction and Mossbauer spectroscopy. Environ. Sci. Technol. 2008, 42, 7891–7897. [Google Scholar] [CrossRef] [PubMed]
- Axe, L.; Anderson, P.R. Experimental and theoretical diffusivities of Cd and Sr in hydrous ferric oxide. J. Colloid Interface Sci. 1997, 185, 436–448. [Google Scholar] [CrossRef] [PubMed]
- Kinniburgh, D.; Jackson, M.; Syers, J. Adsorption of alkaline earth, transition, and heavy metal cations by hydrous oxide gels of iron and aluminum. Soil Sci. Soc. Am. J. 1976, 40, 796–799. [Google Scholar] [CrossRef]
- McKenzie, R. The adsorption of lead and other heavy metals on oxides of manganese and iron. Soil Res. 1980, 18, 61–73. [Google Scholar] [CrossRef]
- Sposito, G. The Surface Chemistry of Soils; Oxford University Press: Oxford, UK, 1984. [Google Scholar]
- Meng, S.; Wang, H.; Liu, H.; Yang, C.; Wei, Y.; Hou, D. Evaluation of the ability of ferrihydrite to bind heavy metal ions: Based on formation environment, adsorption reversibility and ageing. Appl. Geochem. 2014, 45 (Suppl. C), 114–119. [Google Scholar] [CrossRef]
- Peacock, C.L.; Sherman, D.M. Copper (II) sorption onto goethite, hematite and lepidocrocite: A surface complexation model based on ab initio molecular geometries and EXAFS spectroscopy. Geochim. Cosmochim. Acta 2004, 68, 2623–2637. [Google Scholar] [CrossRef]
- Liu, J.-F.; Zhao, Z.-S.; Jiang, G.-B. Coating Fe3O4 magnetic nanoparticles with humic acid for high efficient removal of heavy metals in water. Environ. Sci. Technol. 2008, 42, 6949–6954. [Google Scholar] [CrossRef] [PubMed]
- Kerndorff, H.; Schnitzer, M. Sorption of metals on humic acid. Geochim. Cosmochim. Acta 1980, 44, 1701–1708. [Google Scholar] [CrossRef]
- Schnitzer, M.; Hansen, E. Organo-metallic interactions in soils: 8. An evaluation of methods for the determination of stability constants of metal-fulvic acid complexes. Soil Sci. 1970, 109, 333–340. [Google Scholar] [CrossRef]
- Wei, L.; Li, Y.; Noguera, D.R.; Zhao, N.; Song, Y.; Ding, J.; Zhao, Q.; Cui, F. Adsorption of Cu2+ and Zn2+ by extracellular polymeric substances (EPS) in different sludges: Effect of EPS fractional polarity on binding mechanism. J. Hazard. Mater. 2017, 321, 473–483. [Google Scholar] [CrossRef] [PubMed]
- Ha, J.; Gélabert, A.; Spormann, A.M.; Brown, G.E. Role of extracellular polymeric substances in metal ion complexation on Shewanella oneidensis: Batch uptake, thermodynamic modeling, ATR-FTIR, and EXAFS study. Geochim. Cosmochim. Acta 2010, 74, 1–15. [Google Scholar] [CrossRef]
- Kinniburgh, D.; Jackson, M. Concentration and pH dependence of calcium and zinc adsorption by iron hydrous oxide gel. Soil Sci. Soc. Am. J. 1982, 46, 56–61. [Google Scholar] [CrossRef]
- Templeton, A.S.; Ostergren, J.D.; Trainor, T.P.; Foster, A.L.; Traina, S.; Spormann, A.; Brown, G. XAFS and XSW study of the distribution of Pb(II) sorbed to biofilms on α-Al2O3 and α-FeOOH surfaces. J. Synchrotron Radiat. 1999, 6, 642–644. [Google Scholar] [CrossRef] [PubMed]
- Xu, Y.; Boonfueng, T.; Axe, L.; Maeng, S.; Tyson, T. Surface complexation of Pb(II) on amorphous iron oxide and manganese oxide: Spectroscopic and time studies. J. Colloid Interface Sci. 2006, 299, 28–40. [Google Scholar] [CrossRef] [PubMed]
- Manceau, A.; Lanson, B.; Drits, V.A. Structure of heavy metal sorbed birnessite. Part III: Results from powder and polarized extended X-ray absorption fine structure spectroscopy. Geochim. Cosmochim. Acta 2002, 66, 2639–2663. [Google Scholar] [CrossRef]
- Xu, T.; Catalano, J.G. Effects of Ionic Strength on Arsenate Adsorption at Aluminum Hydroxide-Water Interfaces. Soil Syst. 2018, 2, 1. [Google Scholar]
- Peak, D.; Regier, T. Direct observation of tetrahedrally coordinated Fe(III) in ferrihydrite. Environ. Sci. Technol. 2012, 46, 3163–3168. [Google Scholar] [CrossRef] [PubMed]
- Wang, Y.; Gélabert, A.; Michel, F.M.; Choi, Y.; Gescher, J.; Ona-Nguema, G.; Eng, P.J.; Bargar, J.R.; Farges, F.; Spormann, A.M.; et al. Effect of biofilm coatings at metal-oxide/water interfaces I: Pb(II) and Zn(II) partitioning and speciation at Shewanella oneidensis/metal-oxide/water interfaces. Geochim. Cosmochim. Acta 2016, 188 (Suppl. C), 368–392. [Google Scholar] [CrossRef]
- Katsoyiannis, I.A.; Althoff, H.W.; Bartel, H.; Jekel, M. The effect of groundwater composition on uranium (VI) sorption onto bacteriogenic iron oxides. Water Res. 2006, 40, 3646–3652. [Google Scholar] [CrossRef] [PubMed]
- River, M.; Richardson, C.J. Stream transport of iron and phosphorus by authigenic nanoparticles in the Southern Piedmont of the U.S. Water Res. 2018, 130, 312–321. [Google Scholar] [CrossRef] [PubMed]
Figure 1.
Transmission electron microscope (TEM) images of (A) synthetic two-line ferrihydrite (2LFh); (B) Feb biogenic iron (oxyhydr)oxides (BIOS); and (C) April BIOS. BIOS morphology is consistent with previously sampled BIOS from Pullen Park in Raleigh, NC [34,44]. Arrows denote FeOB tube-like and fibrous structures.
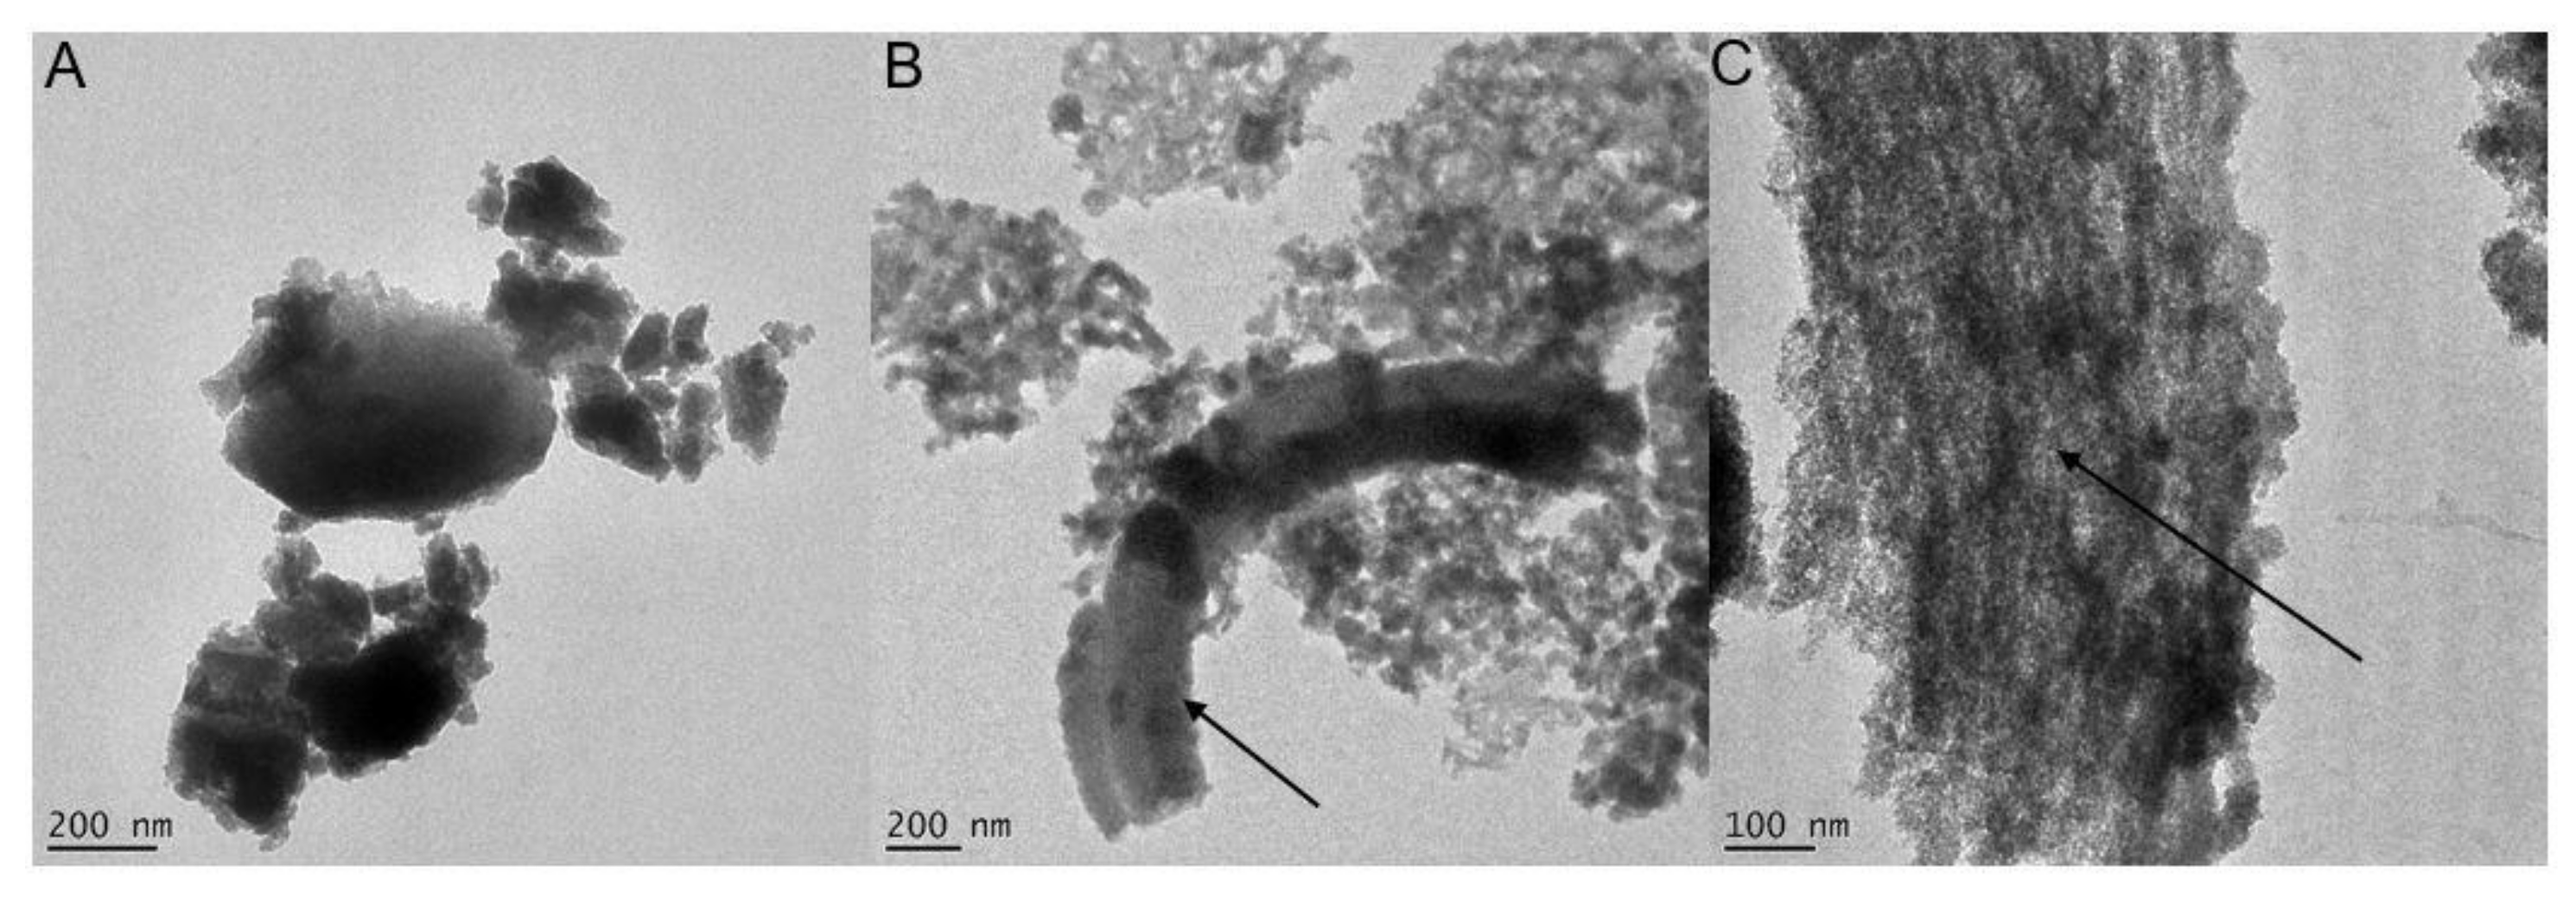
Figure 2.
Fe K-edge (A) normalized X-ray absorption near edge structure (XANES), and (B) extended X-ray absorption fine structure (EXAFS) spectra of the BIOS samples, and iron mineral standards. XANES spectra are fit with lepidocrocite, an Fe(III) standard, and pyrite, an Fe(II) standard. In all cases, the linear-combination fittings (LCFs) (overlain dotted lines) indicated 100% Fe(III). Linear combination fitting was also performed for the BIOS EXAFS spectra and are represented as overlain dotted lines, with fit parameters shown in Table 1.
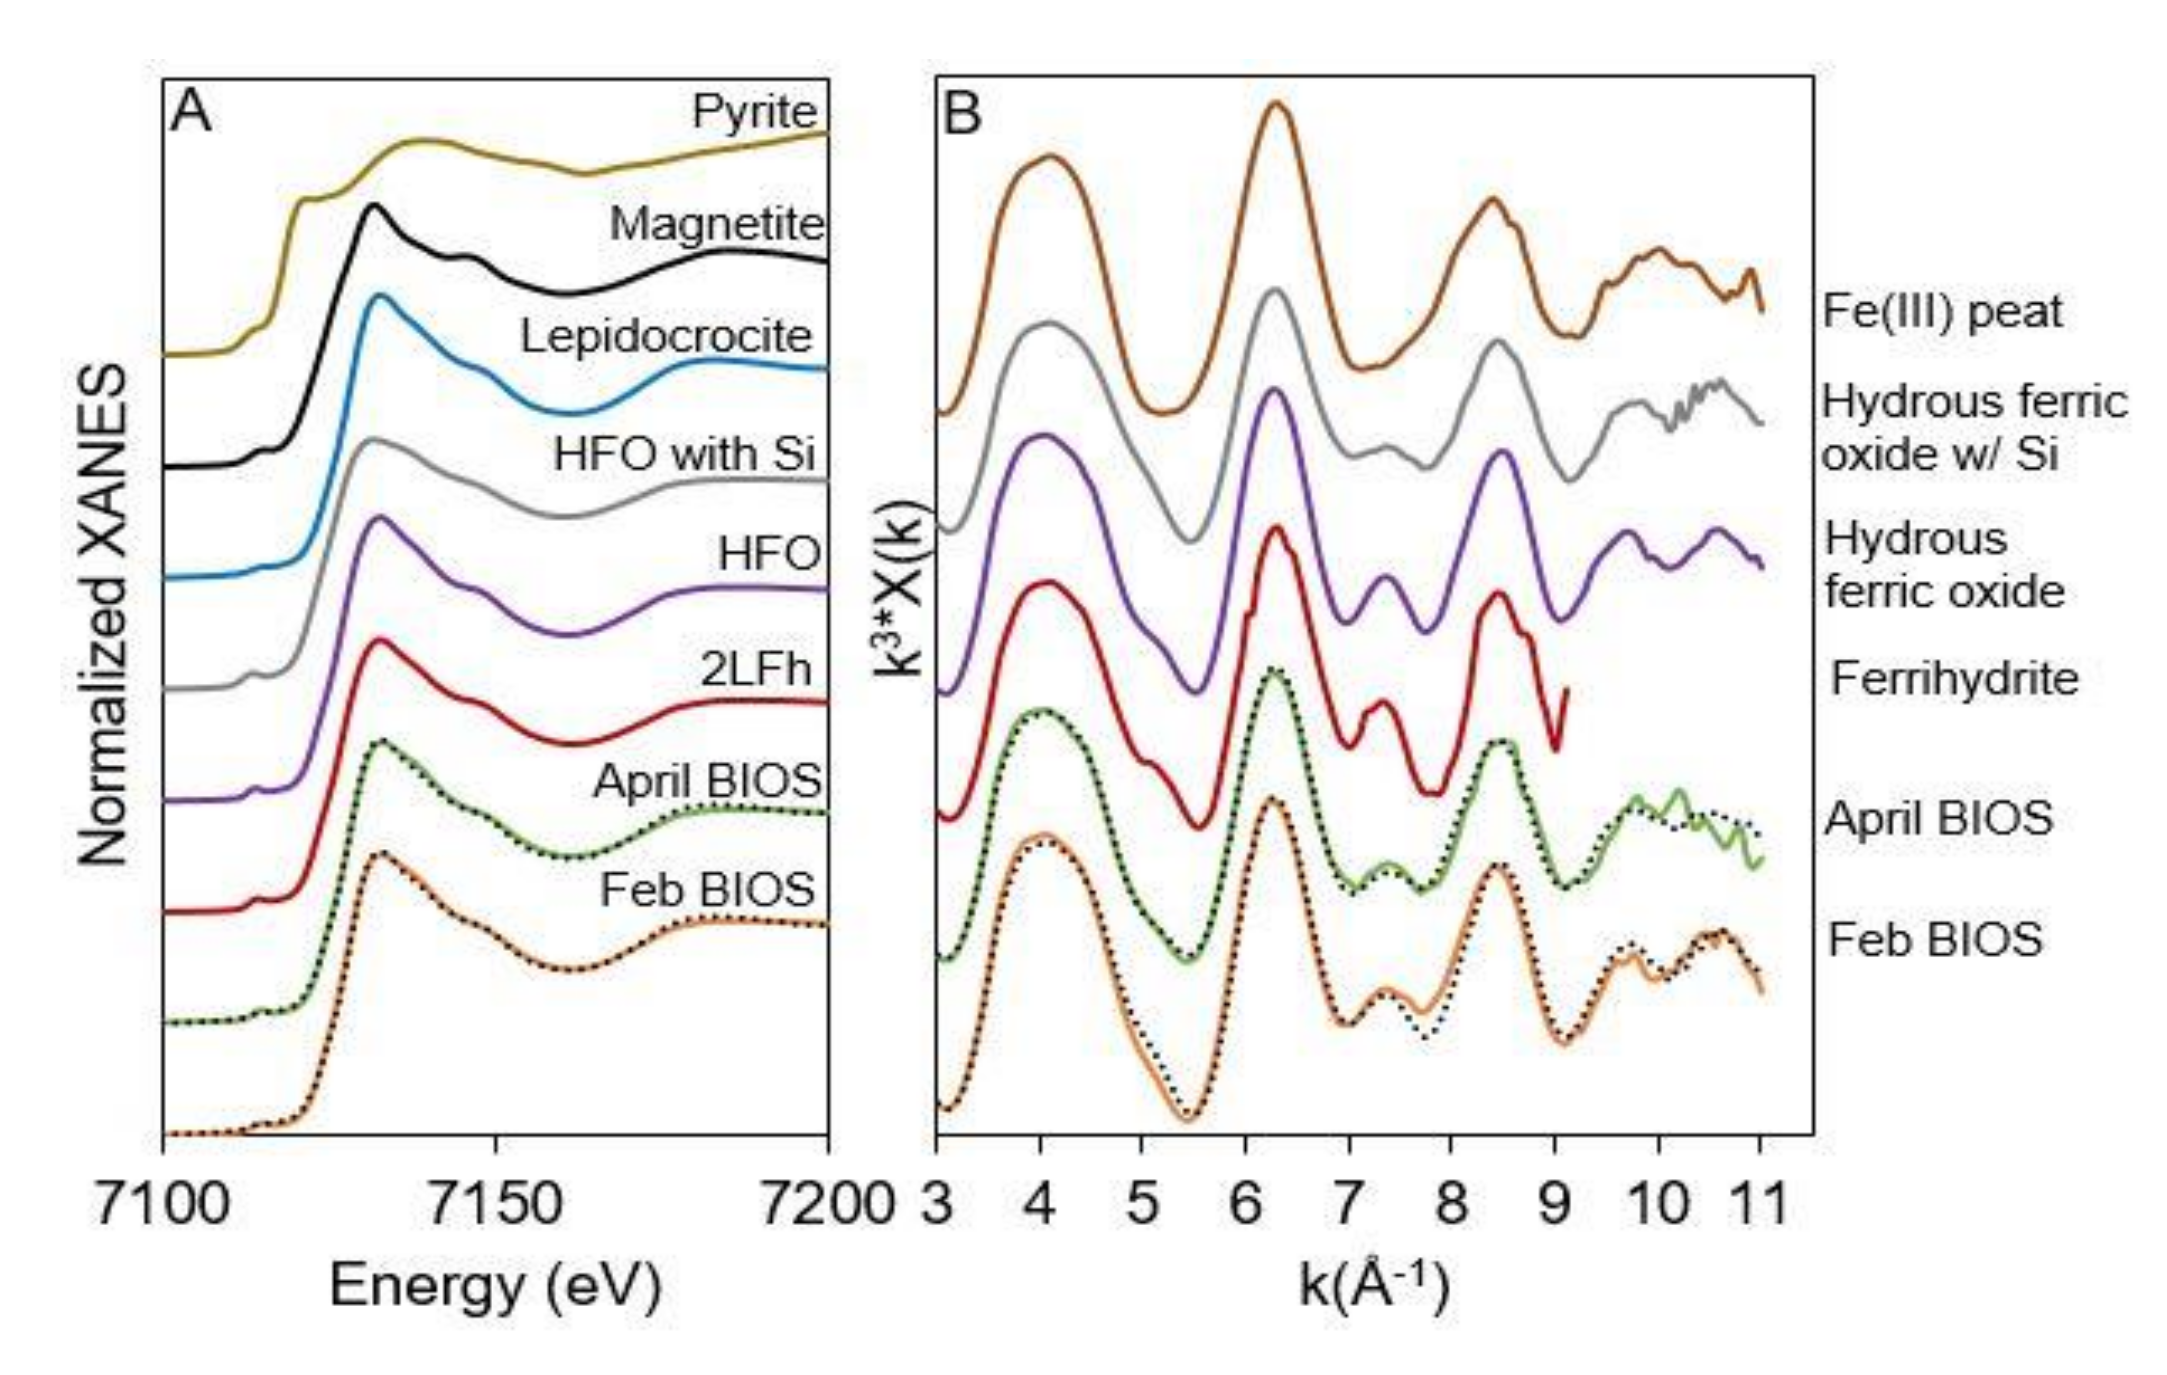
Figure 3.
Pair distribution functions or G(r) of 2LFh and April BIOS compared to a 3 nm ferrihydrite standard [69]. (A) Attenuation in the PDF’s at ca. 18–20 Å suggest 2LFh and April BIOS have similar coherent scattering domain (CSD) sizes. CSDs have an estimated error of (± 3Å) [71]. (B) Comparison of the short-range order of these samples. Labeled peaks (a–d) correspond to the Si-O atom pair at r = 1.60 Å, Fe-O atom pair at r = 1.98 Å, Fe-Fe edge-sharing atom pair at r = 3.03 Å, and the Fe-Fe corner sharing atom pair at r = 3.44 Å, respectively [35,77].
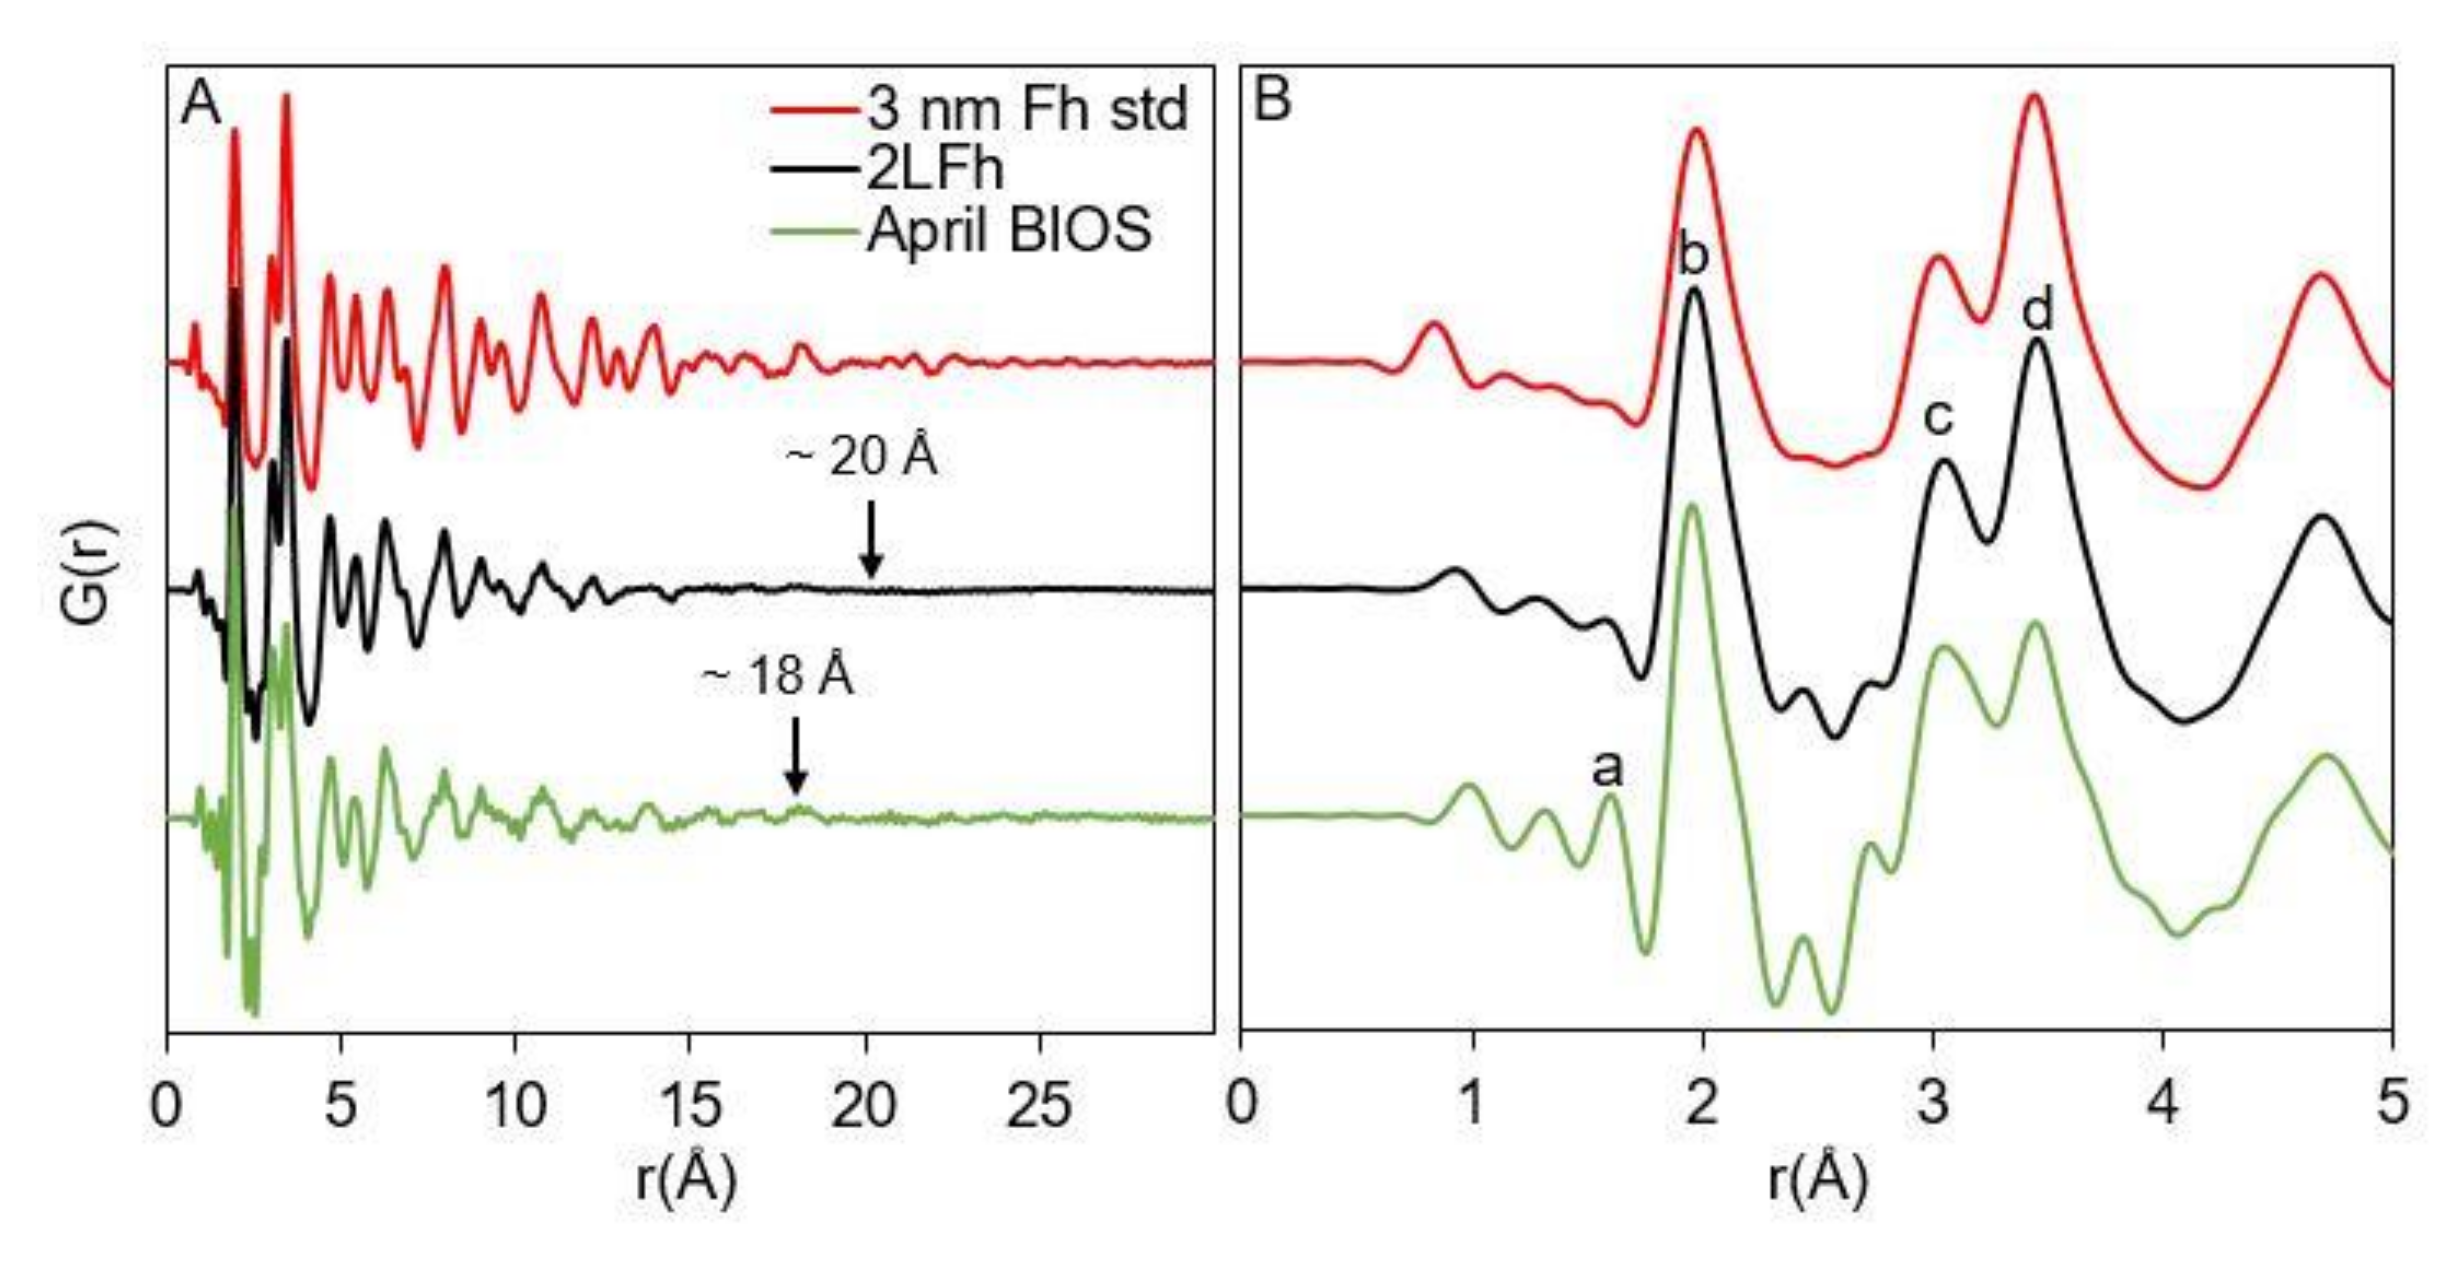
Figure 4.
Rate of (A) Cu (triangles), Pb (squares), and Zn (circles) sorption (mass normalized) and (B) surface area normalized sorption to synthetic 2LFh (open symbols) and April BIOS (solid symbols). Initial experimental conditions: 1 g L−1 (0.25 g L−1 for Pb) sorbent (dry weight basis), Cu(II) = 0.79 mM, Pb(II) = 0.24 mM, Zn(II) = 0.76 mM, I = 0.01 M NaNO3, pH = 6.0 ± 0.1, temp. = 23 ± 2 °C.
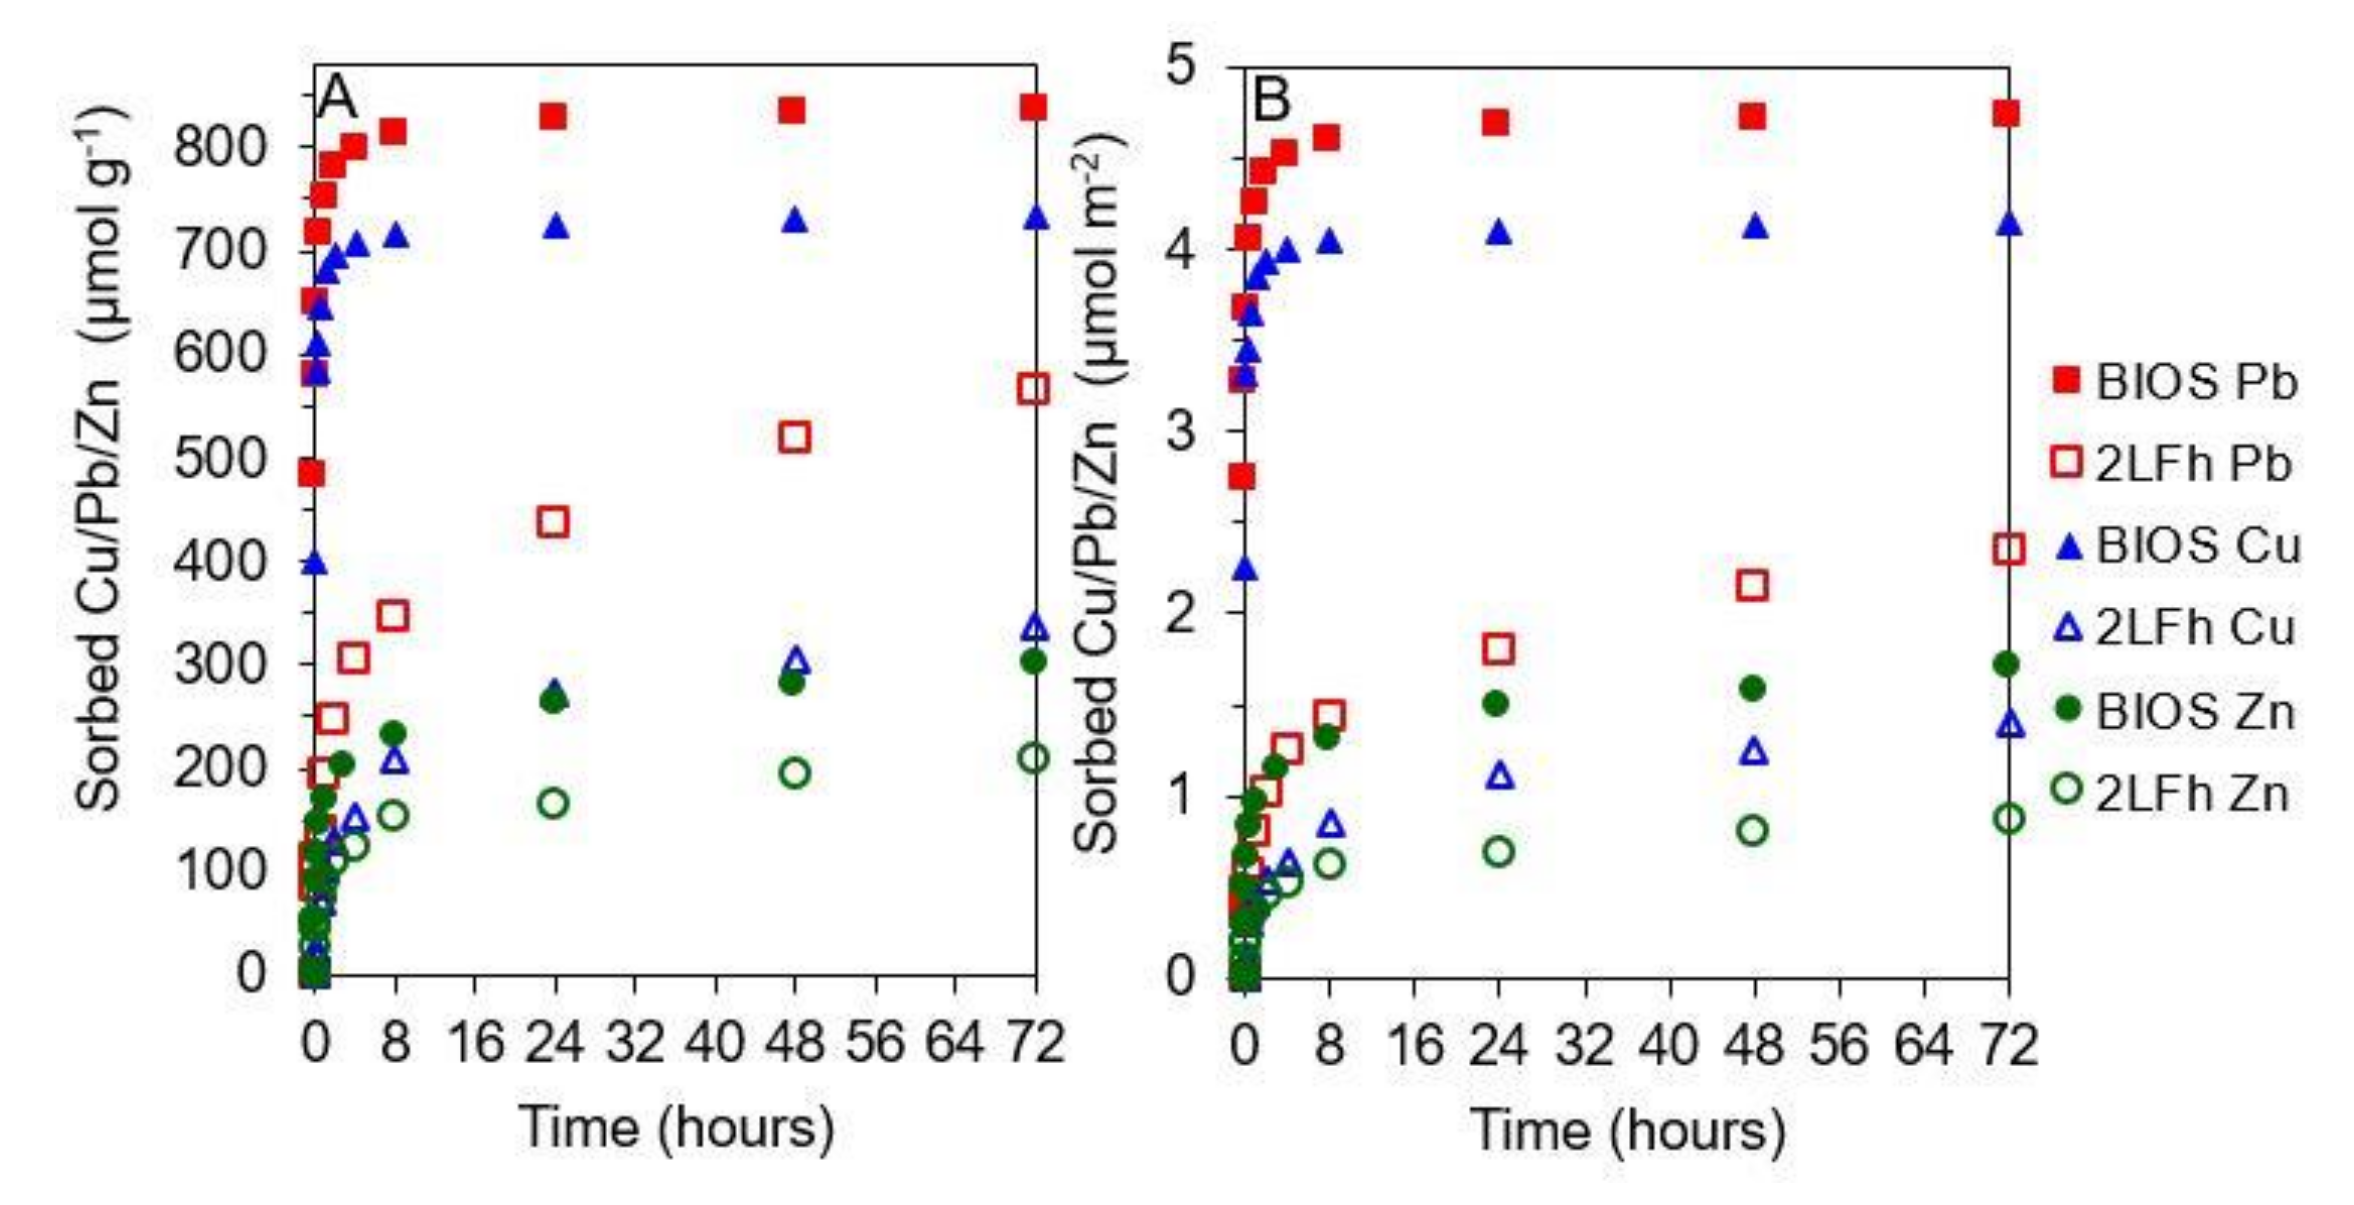
Figure 5.
Mass normalized sorption of (A) Cu onto synthetic 2LFh (open triangle), (B) Cu onto BIOS (solid triangle), (C) Pb onto synthetic 2LFh (open square), (D) Pb onto April BIOS (solid square), (E) Zn onto synthetic 2LFh (open circle) and BIOS (solid circle). Due to large differences in Cu and Pb equilibrium concentrations between BIOS and 2LFh, isotherms were plotted separately. The black X’s represent the Feb BIOS and 2LFh surface loadings that were used for X-ray absorption spectroscopy (XAS) studies. Data sets were modeled with a Freundlich sorption isotherm model (solid black line), with fit parameters shown in Table 2. Initial experimental conditions: 1 g L−1 (0.25 g L−1 for Pb) sorbent (dry weight basis), Cu(II) = 0–01.57 mM, Pb(II) = 0–0.24 mM, Zn(II) = 0–15.30 mM, I = 0.01 M NaNO3, pH = 6.0 ± 0.1, Temp = 23 ± 2 °C.
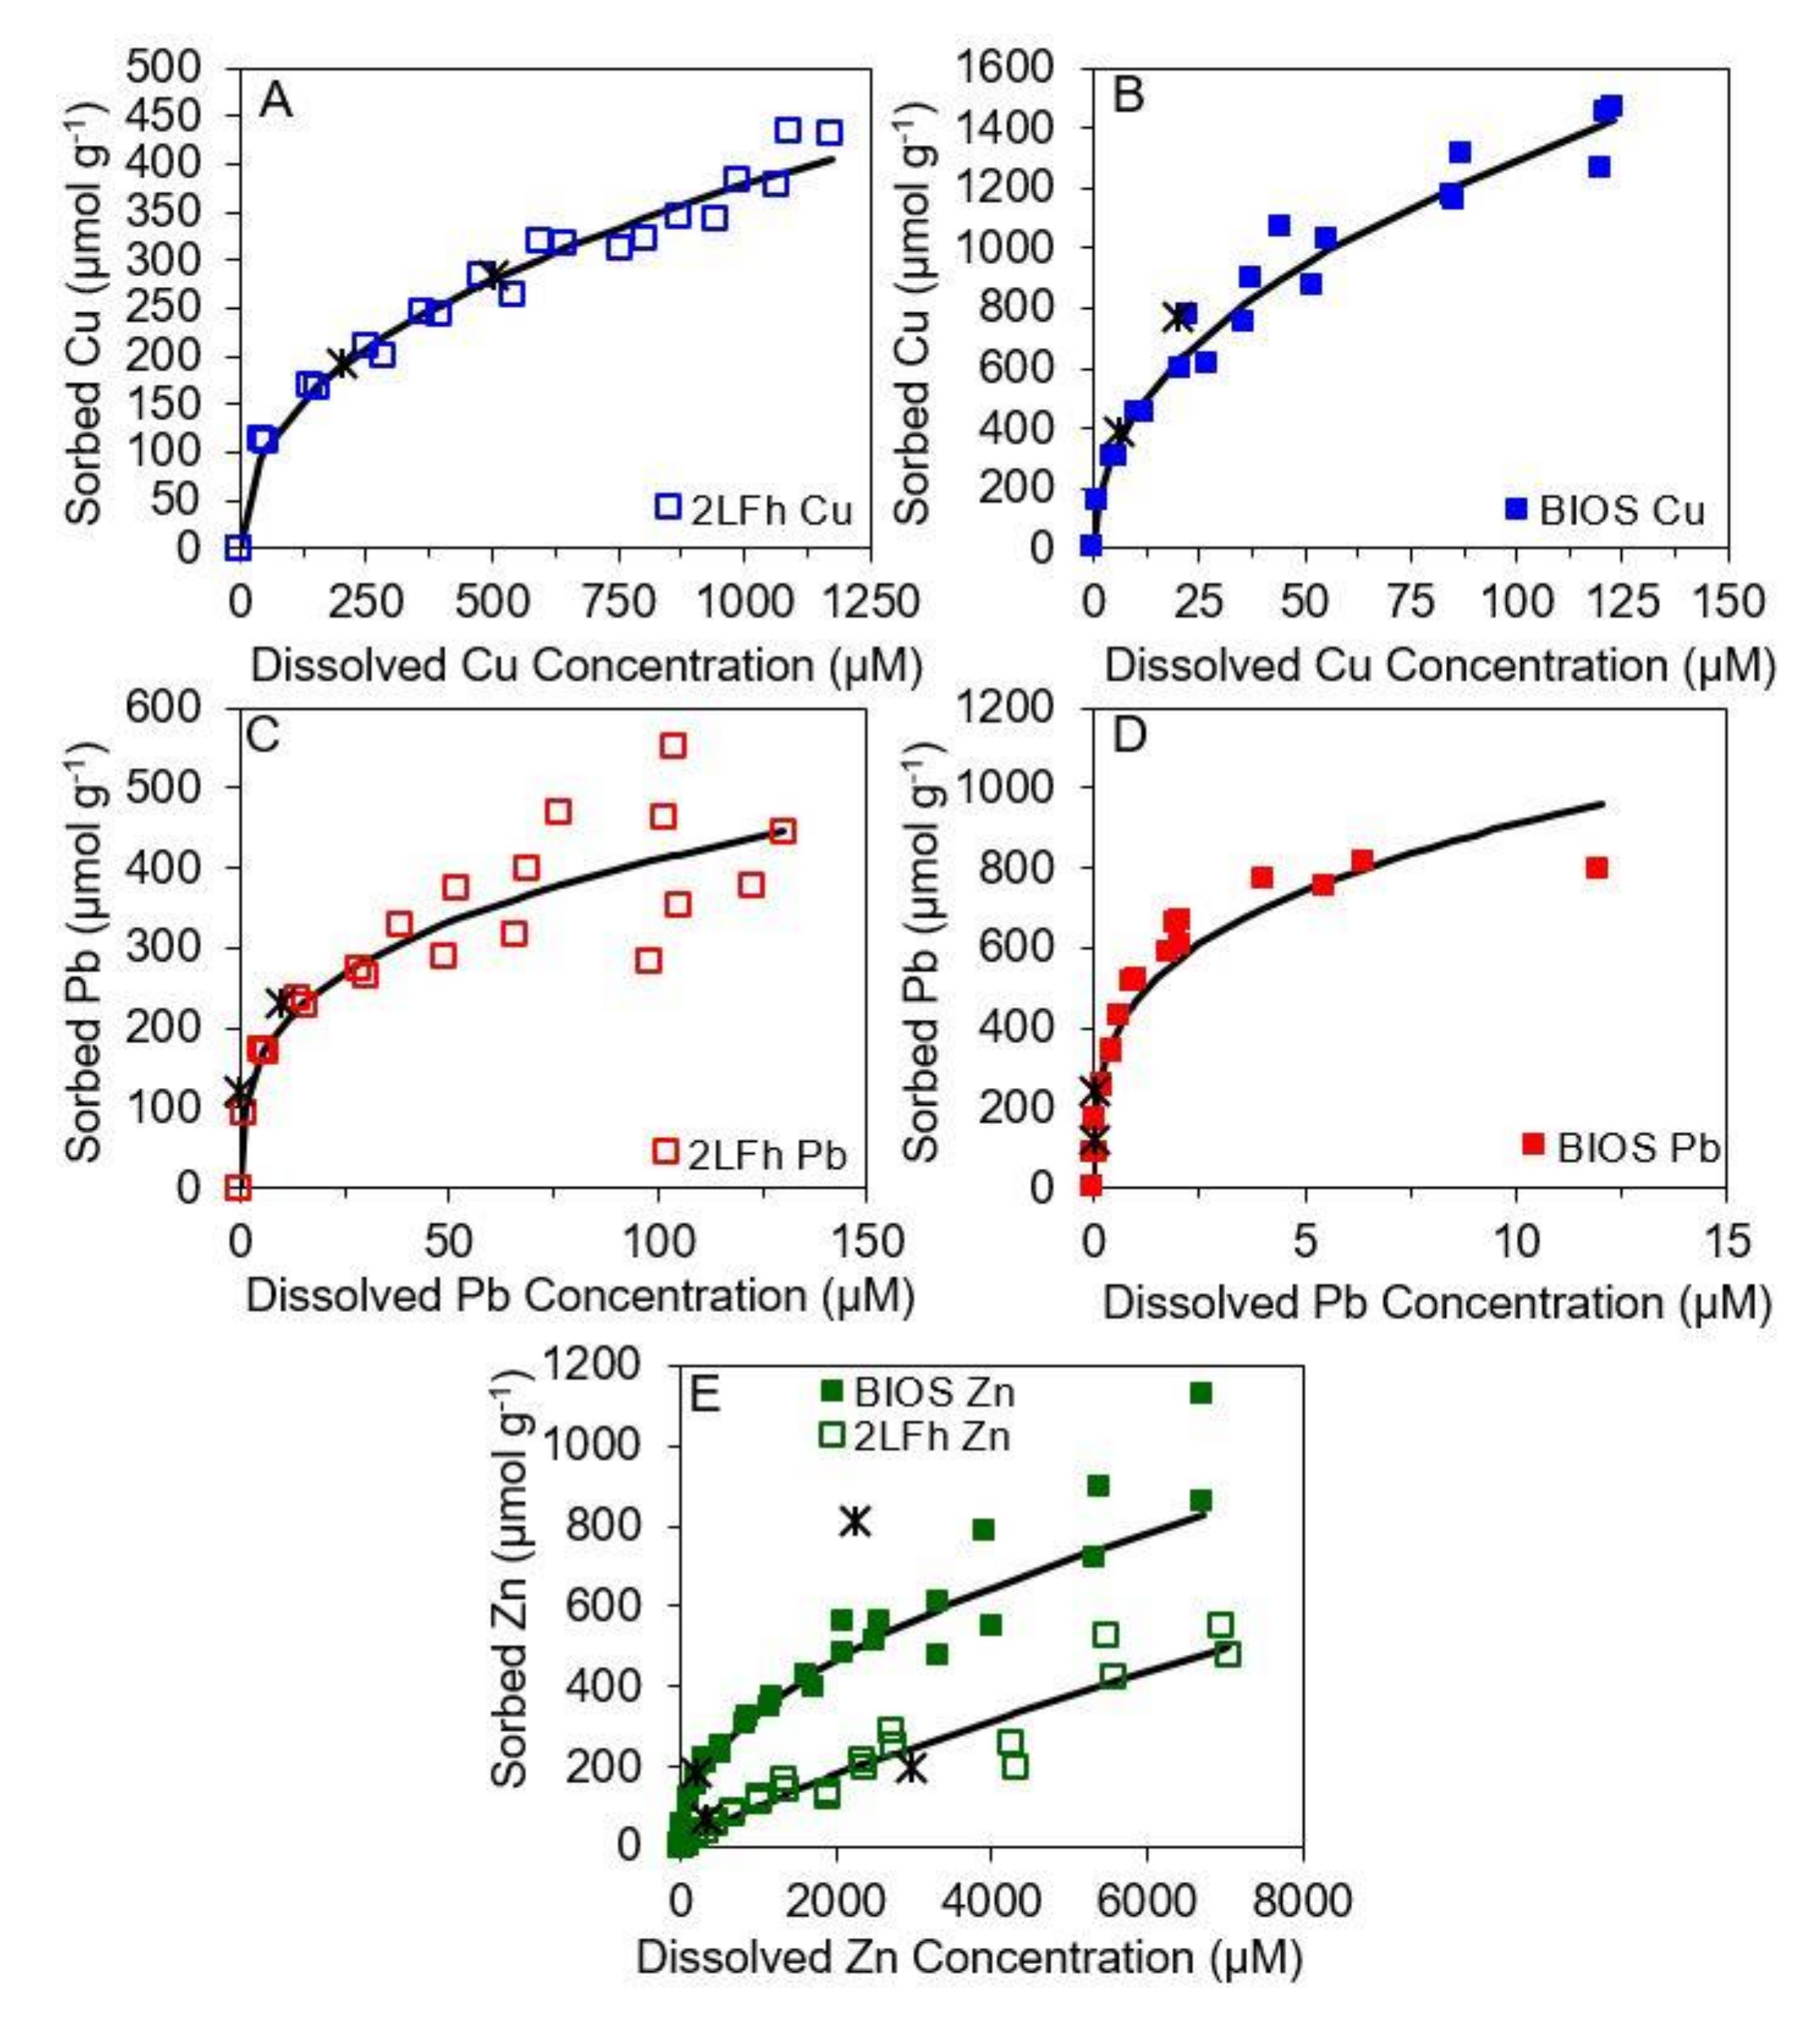
Figure 6.
Cu K-edge (A) EXAFS spectra, and (B) Fourier transform (FT) magnitude plots of synthetic 2LFh and Feb BIOS samples. Shell-by-shell (structural model) fits to the data are represented by overlain dotted lines with fit parameters shown in Table 3. Structural models were fit from k = 3−11 Å−1. Initial experimental sorption conditions along with post-sorption Cu surface loadings are reported in Supplementary Materials Table S1.

Figure 7.
Possible Cu, Pb, and Zn surface binding mechanisms for BIOS and 2LFh. (A) Cu bidentate edge-sharing complex, (B) Pb bidentate edge-sharing and (C) bridging bidentate complexes, and (D) ZnIV (tetrahedrally-coordinated Zn) bridging bidentate and (E) ZnVI (octahedrally-coordinated Zn) bridging bidentate complexes.
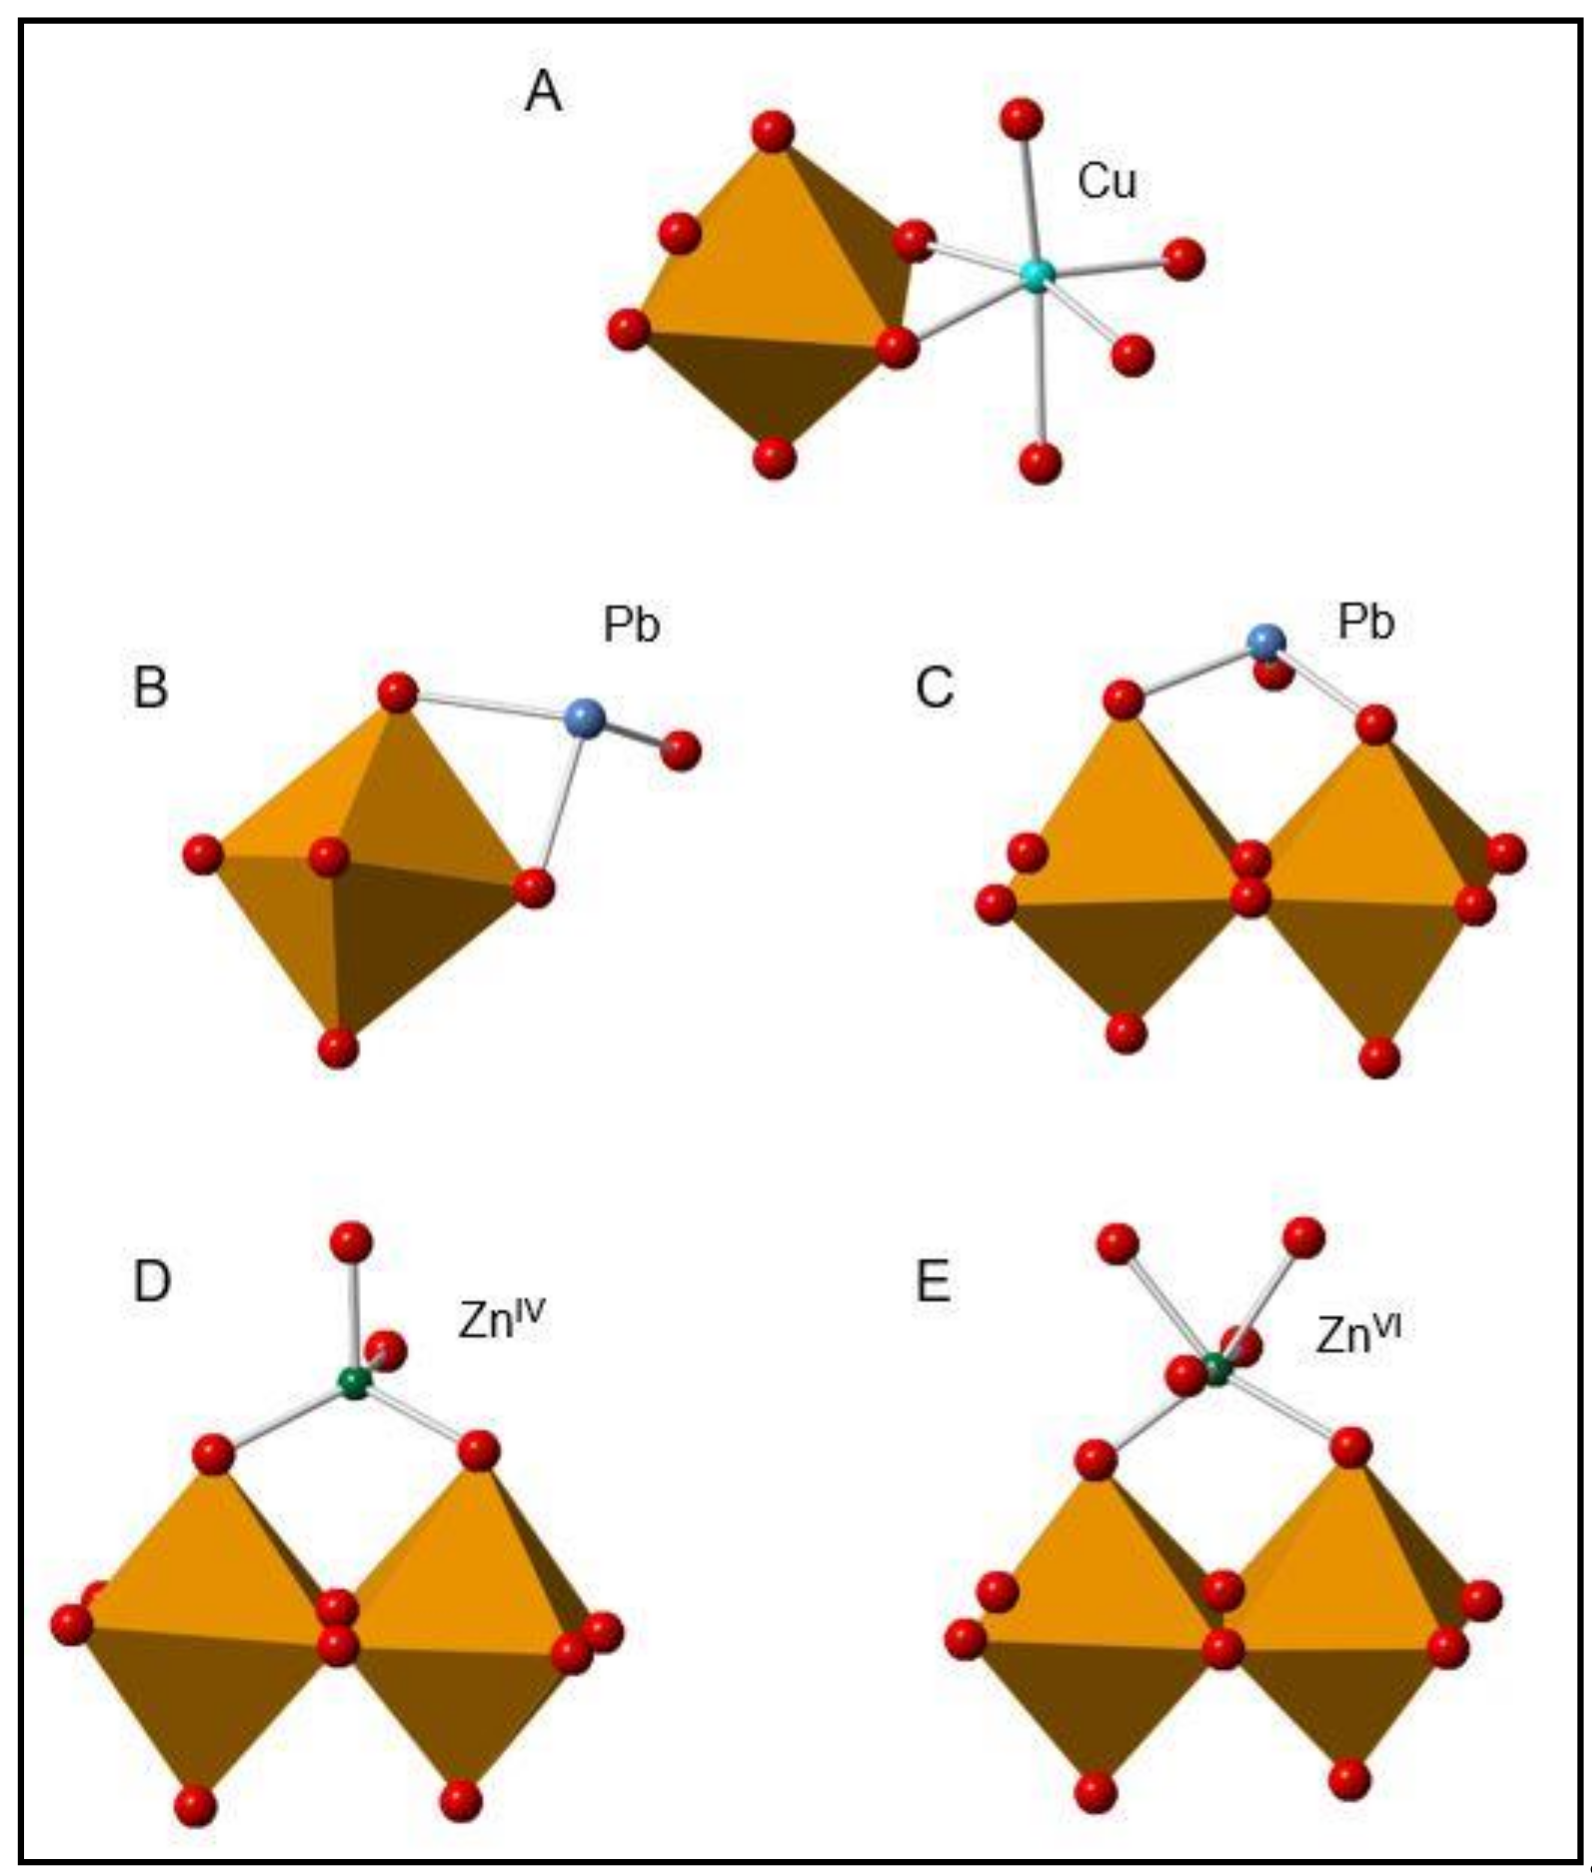
Figure 8.
Pb LIII-edge (A) EXAFS spectra and (B) FT magnitude plots of synthetic 2LFh and Feb BIOS samples. Shell-by-shell (structural model) fits to the data are represented by overlain dotted lines with fit parameters shown in Table 3. Structural models were fit from k = 3−8.5 Å−1. Initial experimental sorption conditions along with post-sorption Pb surface loadings are reported in Supplementary Materials Table S1.
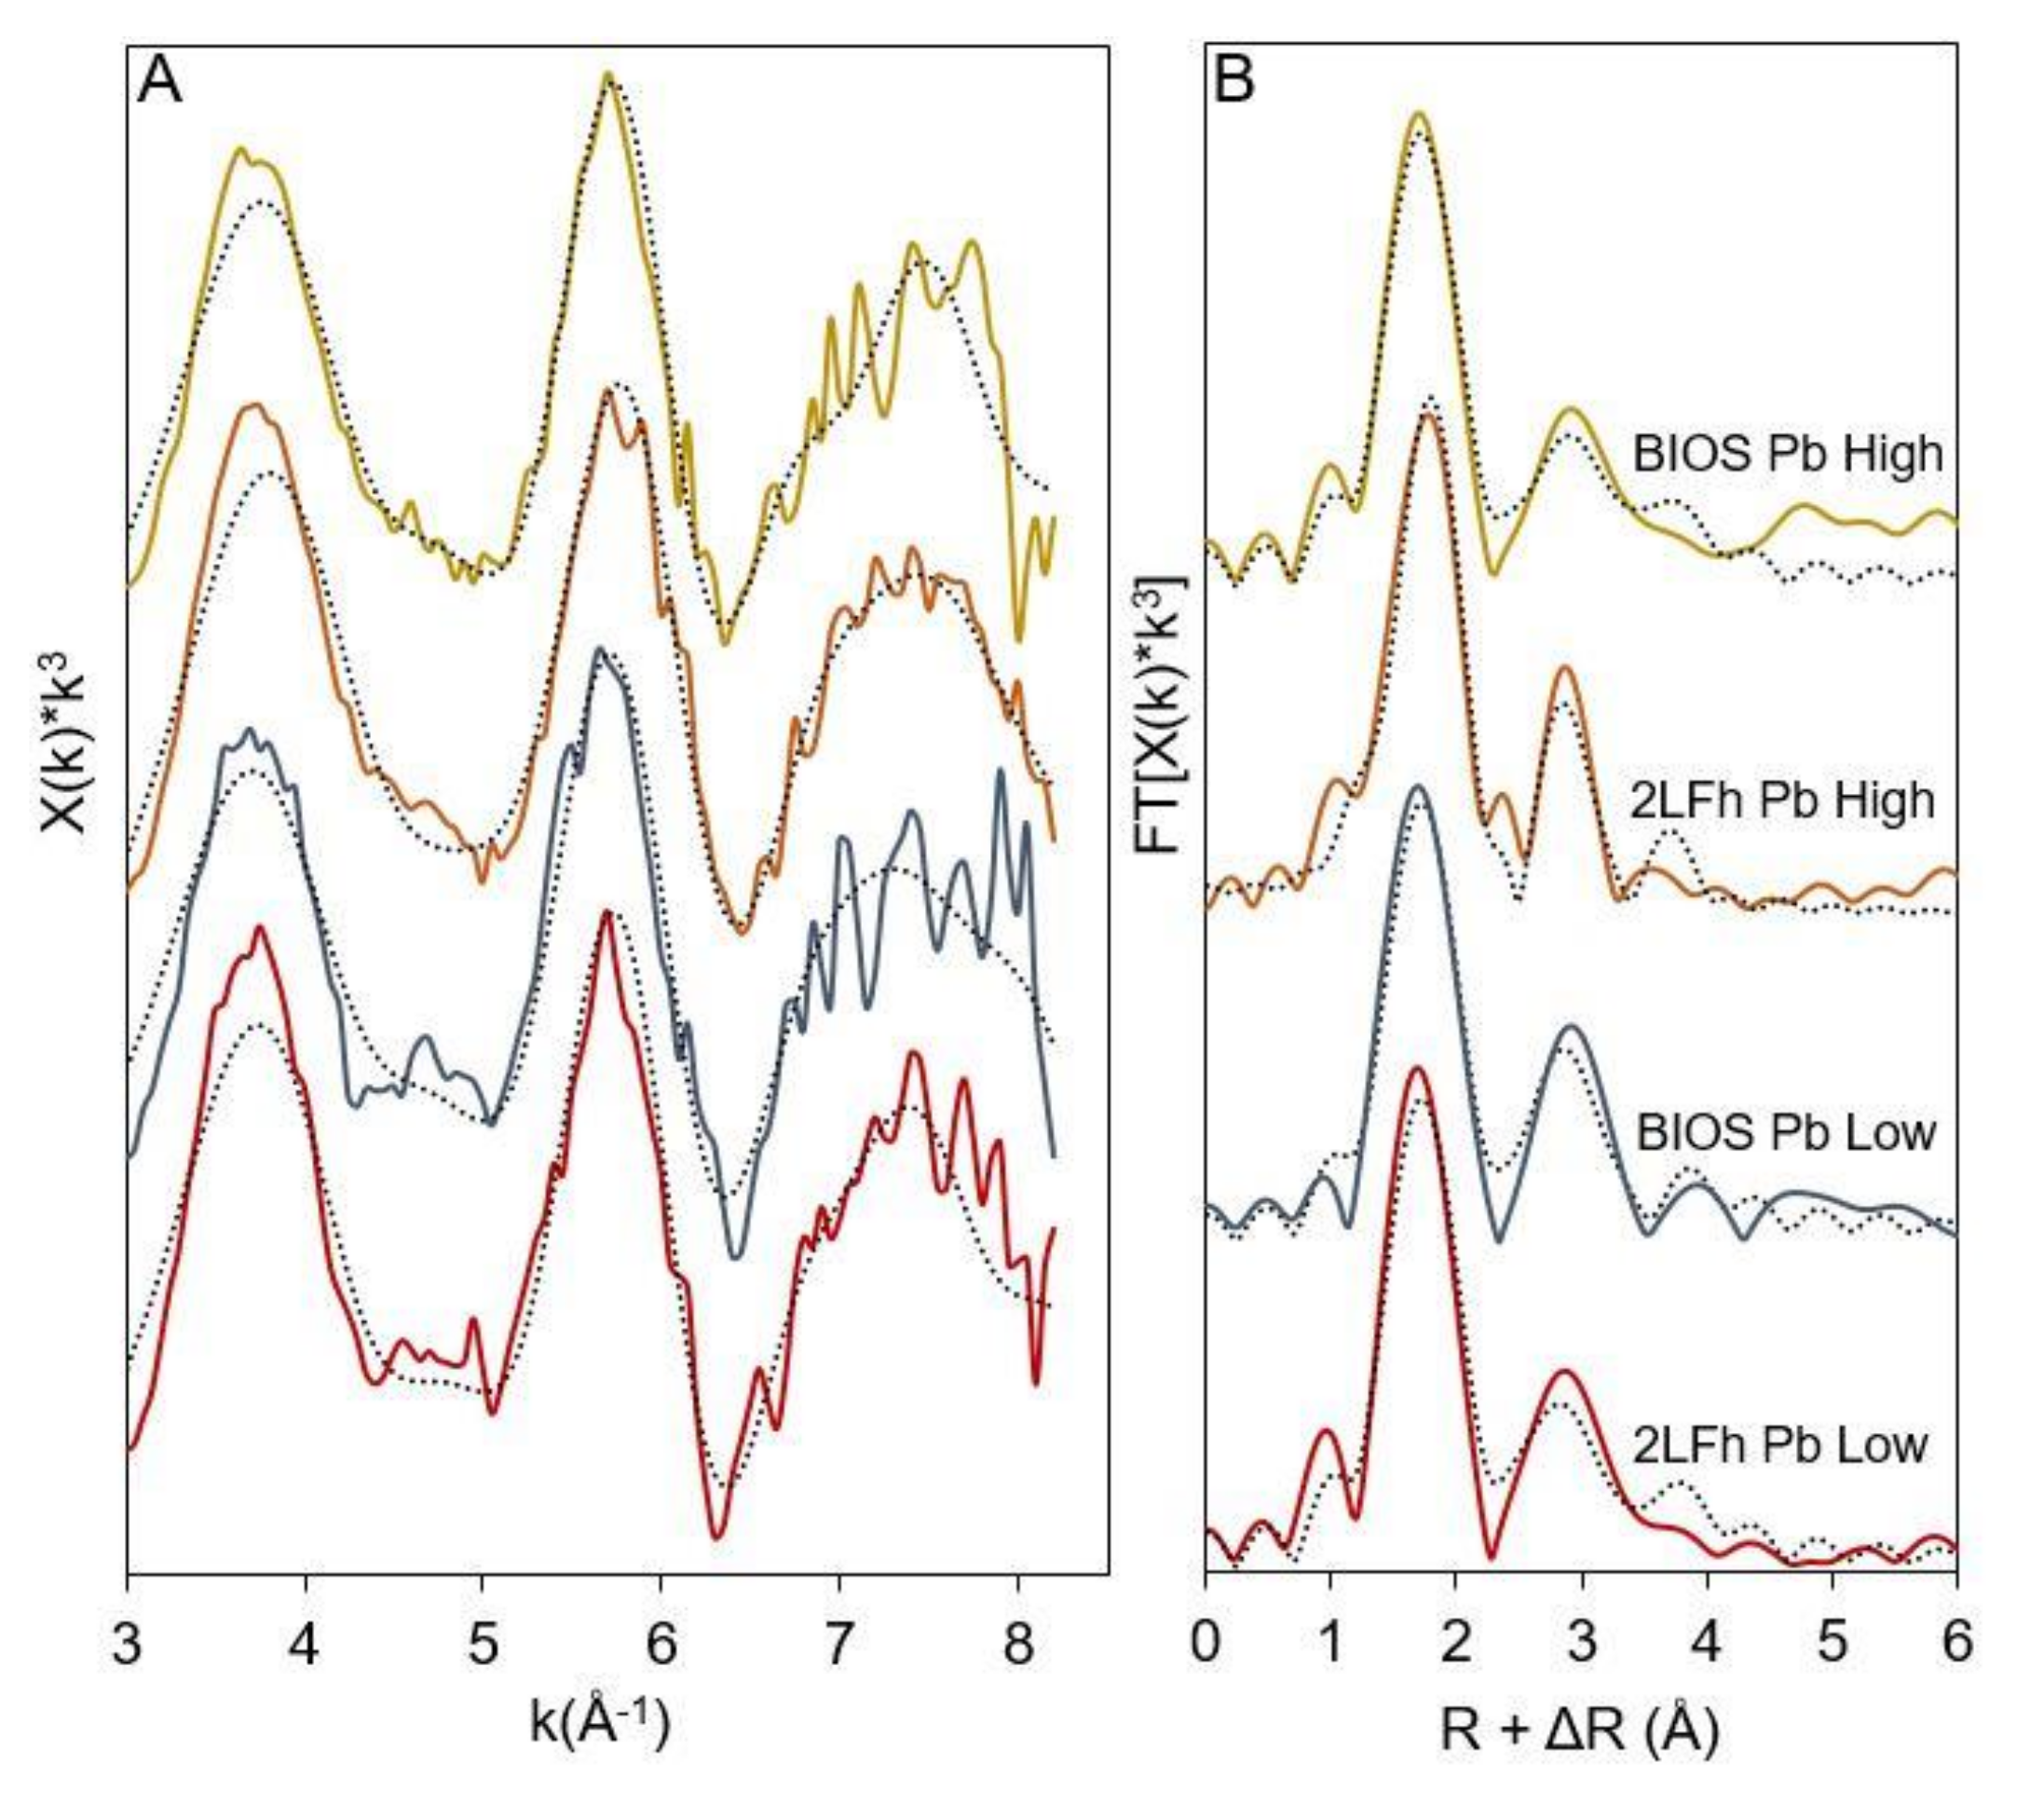
Figure 9.
Zn K-edge (A) EXAFS spectra and (B) FT magnitude plots of synthetic 2LFh and Feb BIOS samples used in adsorption isotherms. Fits to the data on structural models are represented by overlain dotted lines with fit parameters shown in Table 3. Structural models were fit from k = 3–11 Å−1. Initial experimental sorption conditions along with post-sorption Zn surface loadings are reported in Supplementary Materials Table S1.
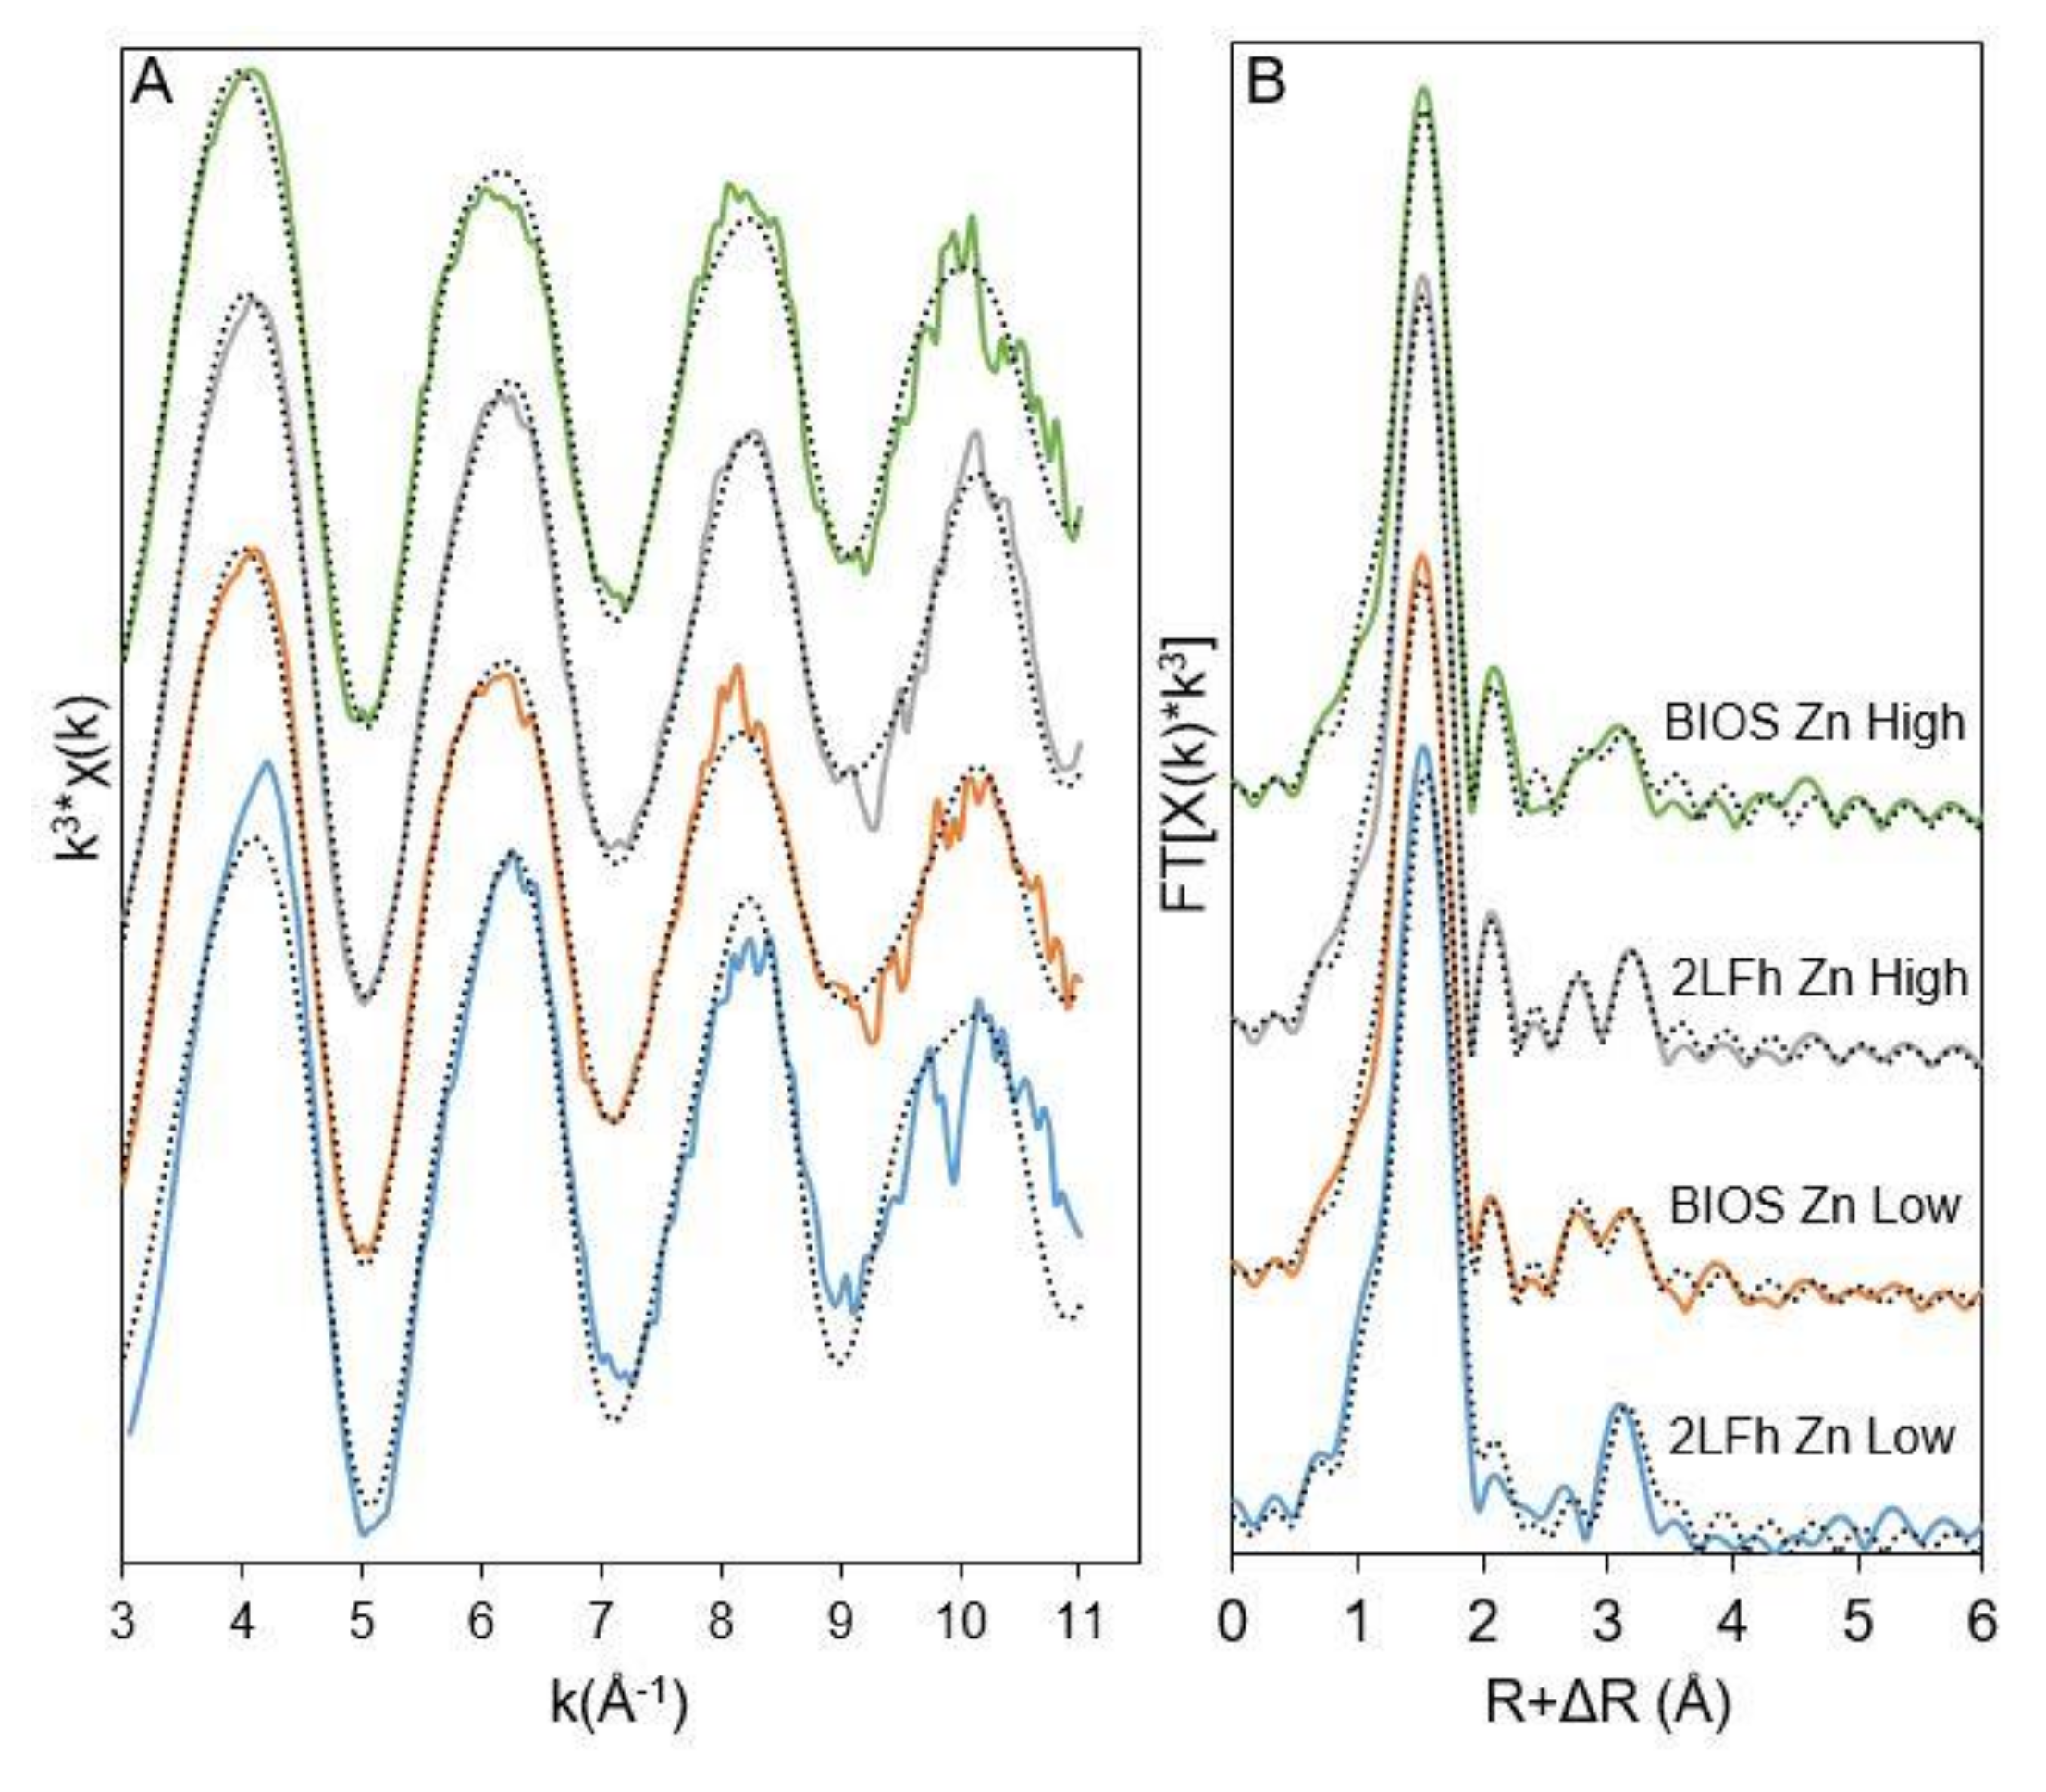

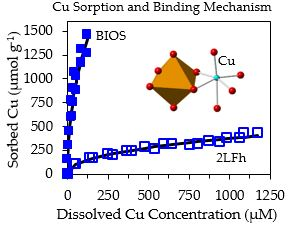
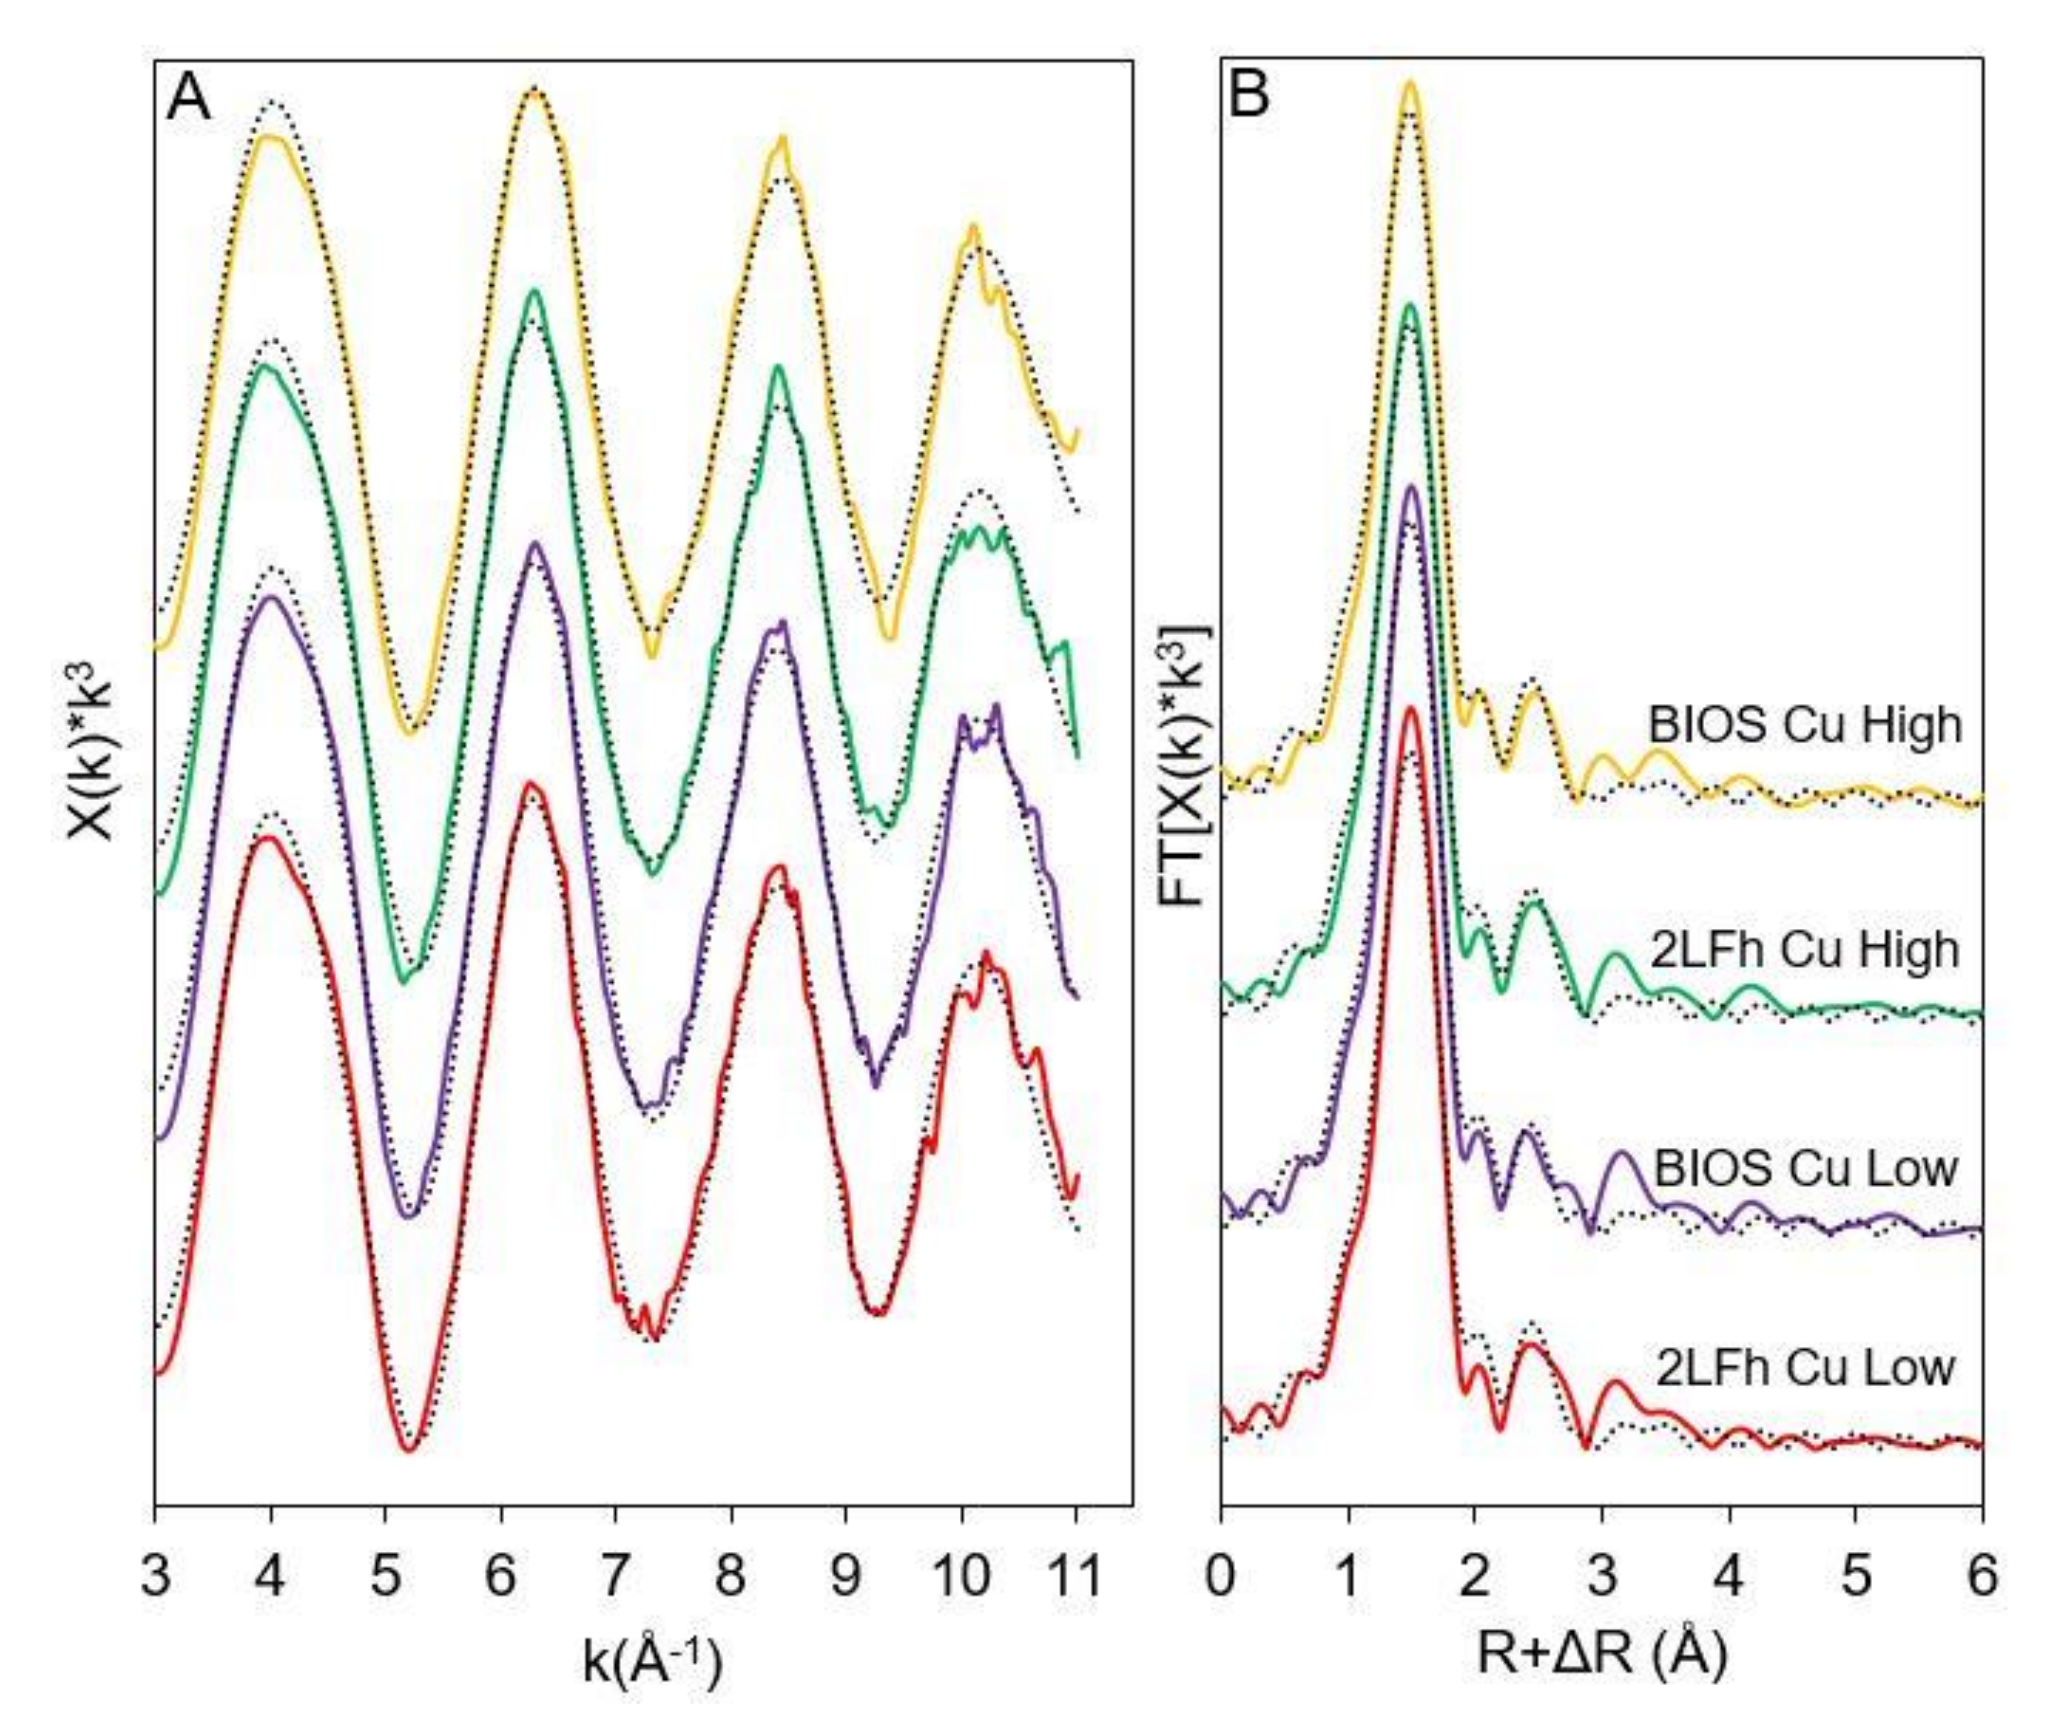
Table 1.
Fe K-edge EXAFS linear combination fits (LCFs) for February (Feb) and April BIOS samples. LCFs were normalized to 100%, with raw fits summing to 95–100 ± 1–8%.
Table 1.
Fe K-edge EXAFS linear combination fits (LCFs) for February (Feb) and April BIOS samples. LCFs were normalized to 100%, with raw fits summing to 95–100 ± 1–8%.
| Sample ID | Component | % Contribution | R-Value |
|---|---|---|---|
| Feb BIOS | Hydrous ferric oxide | 46 ± 7 | 0.0282353 |
| Hydrous ferric oxide with Si | 54 ± 8 | ||
| April BIOS | Hydrous ferric oxide | 42 ± 7 | 0.0203070 |
| Fe(III) peat | 35 ± 3 | ||
| Hydrous ferric oxide with Si | 23 ± 8 |
Table 2.
Freundlich parameters used to model Cu(II), Pb(II), and Zn(II) sorption to synthetic 2LFh and April BIOS samples normalized to mass. Kf = sorption constant; n = exponential constant; E = model efficiency. Surface-area normalized isotherms (Supplementary Materials Figure S3) were also fit with data tabulated in the Supplementary Materials Table S4. Uncertainty is reported as standard error.
| Adsorbate | Adsorbent | Kf (µmol Cu/Pb/Zn g−1) | n | E |
|---|---|---|---|---|
| Cu(II) | 2LFh | 18 ± 3.0 | 0.44 ± 0.02 | 0.979 |
| Cu(II) | BIOS | 160 ± 30 | 0.46 ± 0.03 | 0.986 |
| Pb(II) | 2LFh | 100 ± 20 | 0.31 ± 0.05 | 0.871 |
| Pb(II) | BIOS | 470 ± 20 | 0.29 ± 0.02 | 0.943 |
| Zn(II) | 2LFh | 0.4 ± 0.3 | 0.80 ± 0.08 | 0.888 |
| Zn(II) | BIOS | 13 ± 3 | 0.47 ± 0.03 | 0.949 |
Table 3.
EXAFS fitting parameters for Cu, Pb, and Zn sorbed to synthetic 2LFh and BIOS samples.
| Sample | Path | N a | R(Å) b | σ2 (Å2) c | ΔE0 (eV) d | R-Factor e |
|---|---|---|---|---|---|---|
| 2LFh Cu Low | Cu-Oeq | 4.1 (0.2) | 1.93 (0.01) | 0.006 | −5.0 (1.4) | 0.0204 |
| Cu-Cu/Fe | 0.6 (0.3) | 2.99 (0.03) | 0.01 | |||
| Cu-O-O | 4 | 3.87 | 0.012 | |||
| BIOS Cu Low | Cu-Oeq | 4.2 (0.2) | 1.93 (0.01) | 0.006 | −5.0 (1.4) | 0.0198 |
| Cu-Cu/Fe | 0.4 (0.3) | 2.99 (0.04) | 0.01 | |||
| Cu-O-O | 4 | 3.87 | 0.012 | |||
| 2LFh Cu High | Cu-Oeq | 4.1 (0.2) | 1.93 (0.01) | 0.006 | −5.4 (1.1) | 0.0124 |
| Cu-Cu/Fe | 0.7 (0.2) | 2.99 (0.02) | 0.01 | |||
| Cu-O-O | 4 | 3.86 | 0.012 | |||
| BIOS Cu High | Cu-Oeq | 4.1 (0.2) | 1.93 (0.01) | 0.006 | −5.4 (1.3) | 0.0166 |
| Cu-Cu/Fe | 0.6 (0.2) | 2.98 (0.03) | 0.01 | |||
| Cu-O-O | 4 | 3.86 | 0.012 | |||
| 2LFh Pb Low | Pb-O | 2.7 (0.4) | 2.35 (0.03) | 0.01 | 1.1 (4.0) | 0.0604 |
| Pb-Fe1 | 1.0 (0.4) | 3.41 (0.05) | 0.01 | |||
| Pb-Fe2 | 1.3 (0.7) | 4.03 (0.07) | 0.01 | |||
| BIOS Pb Low | Pb-O | 2.5 (0.4) | 2.35 (0.03) | 0.01 | 0.4 (4.0) | 0.0581 |
| Pb-Fe1 | 1.2 (0.4) | 3.42 (0.04) | 0.01 | |||
| Pb-Fe2 | 1.0 (0.7) | 4.05 (0.07) | 0.01 | |||
| 2LFh Pb High | Pb-O | 2.6 (0.2) | 2.35 (0.01) | 0.01 | 2.9 (2.0) | 0.0398 |
| Pb-Fe1 | 0.9 (0.2) | 3.42 (0.02) | 0.01 | |||
| Pb-Fe2 | 0.7 (0.4) | 4.02 (0.04) | 0.01 | |||
| BIOS Pb High | Pb-O | 2.6 (0.3) | 2.34 (0.02) | 0.01 | 1.1 (2.8) | 0.0293 |
| Pb-Fe1 | 0.9 (0.3) | 3.42 (0.04) | 0.01 | |||
| Pb-Fe2 | 1.3 (0.5) | 4.02 (0.05) | 0.01 | |||
| 2LFh Zn Low | ZnIV-O | 4.2 (0.3) | 1.97 (0.01) | 0.006 | 3.4 (2.3) | 0.0463 |
| ZnVI-O | - | - | - | |||
| Zn-Zn/Fe1 | 1.3 (0.9) | 3.21 (0.05) | 0.01 | |||
| Zn-Zn/Fe2 | 2.1 (1.1) | 3.43 (0.04) | 0.01 | |||
| BIOS Zn Low | ZnIV-O | 3.7 (0.5) | 1.97 (0.02) | 0.006 | 5.3 (1.5) | 0.0112 |
| ZnVI-O | 2.6 (0.4) | 2.12 (0.04) | 0.01 | |||
| Zn-Zn/Fe1 | 1.3 (0.5) | 3.27 (0.03) | 0.01 | |||
| Zn-Zn/Fe2 | 1.5 (0.6) | 3.47 (0.03) | 0.01 | |||
| 2LFh Zn High | ZnIV-O | 4.3 (0.3) | 1.97 (0.01) | 0.006 | 5.9 (1.8) | 0.0168 |
| ZnVI-O | 2.0 (0.6) | 2.16 (0.04) | 0.01 | |||
| Zn-Zn/Fe1 | 1.1 (0.6) | 3.27 (0.04) | 0.01 | |||
| Zn-Zn/Fe2 | 1.6 (0.7) | 3.48 (0.03) | 0.01 | |||
| BIOS Zn High | ZnIV-O | 4.1 (0.3) | 1.99 (0.01) | 0.006 | 6.2 (1.7) | 0.015 |
| ZnVI-O | 1.9 (0.5) | 2.18 (0.04) | 0.01 | |||
| Zn-Zn/Fe1 | 0.8 (0.5) | 3.23 (0.06) | 0.01 | |||
| Zn-Zn/Fe2 | 1.3 (0.6) | 3.42 (0.05) | 0.01 |
a Coordination number. b Interatomic distance. c Debye–Waller factor. d Difference in the threshold Fermi level between data and fit. e goodness of fit parameter calculated in SIXPACK [51].
© 2018 by the authors. Licensee MDPI, Basel, Switzerland. This article is an open access article distributed under the terms and conditions of the Creative Commons Attribution (CC BY) license (http://creativecommons.org/licenses/by/4.0/).
Share and Cite
MDPI and ACS Style
Whitaker, A.H.; Duckworth, O.W. Cu, Pb, and Zn Sorption to Biogenic Iron (Oxyhydr)Oxides Formed in Circumneutral Environments. Soil Syst. 2018, 2, 18. https://doi.org/10.3390/soilsystems2020018
AMA Style
Whitaker AH, Duckworth OW. Cu, Pb, and Zn Sorption to Biogenic Iron (Oxyhydr)Oxides Formed in Circumneutral Environments. Soil Systems. 2018; 2(2):18. https://doi.org/10.3390/soilsystems2020018
Chicago/Turabian StyleWhitaker, Andrew H., and Owen W. Duckworth. 2018. "Cu, Pb, and Zn Sorption to Biogenic Iron (Oxyhydr)Oxides Formed in Circumneutral Environments" Soil Systems 2, no. 2: 18. https://doi.org/10.3390/soilsystems2020018